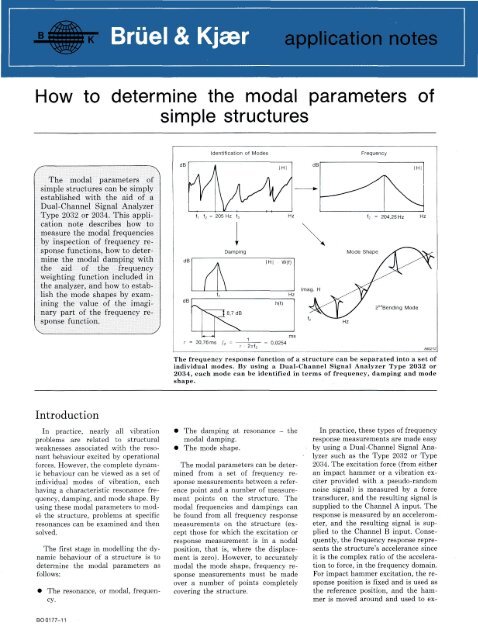
How to determine the modal parameters of simple structures
How to determine the modal parameters of simple structures
How to determine the modal parameters of simple structures

You also want an ePaper? Increase the reach of your titles
YUMPU automatically turns print PDFs into web optimized ePapers that Google loves.
<strong>How</strong> <strong>to</strong> <strong>determine</strong> <strong>the</strong> <strong>modal</strong> <strong>parameters</strong> <strong>of</strong><br />
<strong>simple</strong> <strong>structures</strong><br />
The <strong>modal</strong> <strong>parameters</strong> <strong>of</strong><br />
, • Jill ^ v • i<br />
<strong>simple</strong> <strong>structures</strong> can be simply<br />
established with <strong>the</strong> aid <strong>of</strong> a<br />
Dual-Channel Signal Analyzer<br />
Type 2032 or 2034. This appli<br />
cation note describes how <strong>to</strong><br />
measure <strong>the</strong> <strong>modal</strong> frequencies<br />
by inspection <strong>of</strong> frequency re-<br />
sponse functions, how <strong>to</strong> deter!<br />
mine <strong>the</strong> <strong>modal</strong> damping with<br />
<strong>the</strong> aid <strong>of</strong> <strong>the</strong> frequency<br />
weighting function included in<br />
<strong>the</strong> analyzer, and how <strong>to</strong> estab-<br />
Push <strong>the</strong> mode shapes by exam-<br />
ining <strong>the</strong> value <strong>of</strong> <strong>the</strong> imagi«<br />
1::"■.■■■"-■■■',f*. J--1—■ ■■■■■■■#■ ' ' ■»:KH:«h:::";■":::K : . : M V.< :::: M jy ::<br />
nary part <strong>of</strong> <strong>the</strong> frequency re-<br />
sponse function.<br />
\ /<br />
v y<br />
^ S ^ . | ;■;; ■ : -:■?-:::: .. ' :-■:::-;;;■■- : j: ■ ■ J ! ■ ■;■ ■ ■ ^...:j ;■ - ■.: -::::. ■ ■ ■ ^,1 :^. ::: ■ ::: - ■'■■■- ■■■■■■ ■ ■ '■■-■ -:: i ^-■■.■;:v:_vii. : v!:\r:::!: ■■ » ^ - ^<br />
Introduction<br />
The frequency response function <strong>of</strong> a structure can be separated in<strong>to</strong> a set <strong>of</strong><br />
individual modes. By using a Dual-Channel Signal Analyzer Type 2032 or<br />
2034, each mode can be identified in terms <strong>of</strong> frequency, damping and mode<br />
shape.<br />
In practice, nearly all vibration • The damping at resonance - <strong>the</strong> In practice, <strong>the</strong>se types <strong>of</strong> frequency<br />
problems are related <strong>to</strong> structural <strong>modal</strong> damping. response measurements are made easy<br />
weaknesses associated with <strong>the</strong> reso- • The mode shape. by using a Dual-Channel Signal Ananant<br />
behaviour excited by operational ' lyzer such as <strong>the</strong> Type 2032 or Type<br />
forces. <strong>How</strong>ever, <strong>the</strong> complete dynam- The <strong>modal</strong> <strong>parameters</strong> can be deter- 2034. The excitation force (from ei<strong>the</strong>r<br />
ic behaviour can be viewed as a set <strong>of</strong> mined from a set <strong>of</strong> frequency re- an impact hammer or a vibration exindividual<br />
modes <strong>of</strong> vibration, each sponse measurements between a refer- citer provided with a pseudo-random<br />
having a characteristic resonance fre- ence point and a number <strong>of</strong> measure- noise signal) is measured by a force<br />
quency, damping, and mode shape. By merit points on <strong>the</strong> structure. The transducer, and <strong>the</strong> resulting signal is<br />
using <strong>the</strong>se <strong>modal</strong> <strong>parameters</strong> <strong>to</strong> mod- <strong>modal</strong> frequencies and dampings can supplied <strong>to</strong> <strong>the</strong> Channel A input. The<br />
el <strong>the</strong> structure, problems at specific be found from all frequency response response is measured by an acceleromresonances<br />
can be examined and <strong>the</strong>n measurements on <strong>the</strong> structure (ex- eter, and <strong>the</strong> resulting signal is supsolved.<br />
cept those for which <strong>the</strong> excitation or plied <strong>to</strong> <strong>the</strong> Channel B input. Conse-<br />
response measurement is in a nodal quently, <strong>the</strong> frequency response repre-<br />
The first stage in modelling <strong>the</strong> dy- position, that is, where <strong>the</strong> displace- sents <strong>the</strong> structure's accelerance since<br />
namic behaviour <strong>of</strong> a structure is <strong>to</strong> ment is zero). <strong>How</strong>ever, <strong>to</strong> accurately it is <strong>the</strong> complex ratio <strong>of</strong> <strong>the</strong> accelera<strong>determine</strong><br />
<strong>the</strong> <strong>modal</strong> <strong>parameters</strong> as <strong>modal</strong> <strong>the</strong> mode shape, frequency re- tion <strong>to</strong> force, in <strong>the</strong> frequency domain.<br />
follows: sponse measurements must be made For impact hammer excitation, <strong>the</strong> reover<br />
a number <strong>of</strong> points completely sponse position is fixed and is used as<br />
• The resonance, or <strong>modal</strong>, frequen- covering <strong>the</strong> structure. <strong>the</strong> reference position, and <strong>the</strong> hamcy.<br />
mer is moved around and used <strong>to</strong> ex-<br />
BO 0177-11
cite <strong>the</strong> structure at every point corre<br />
sponding <strong>to</strong> a point in <strong>the</strong> model. For<br />
vibration exciter excitation, <strong>the</strong> exci<br />
tation point is fixed and is used as <strong>the</strong><br />
reference position, while <strong>the</strong> response<br />
accelerometer is moved around <strong>the</strong><br />
structure. A typical instrumentation<br />
set-up is illustrated in Figure 1.<br />
Simple <strong>structures</strong><br />
Structures which exhibit lightly<br />
coupled modes are usually referred <strong>to</strong><br />
as <strong>simple</strong> <strong>structures</strong>. The modes are<br />
not closely spaced, and are not heavily<br />
damped (see Figure 2). At resonance,<br />
a <strong>simple</strong> structure behaves predomi<br />
nantly as a single-degree-<strong>of</strong>-freedom<br />
system, and <strong>the</strong> <strong>modal</strong> <strong>parameters</strong> can<br />
be <strong>determine</strong>d relatively easily with a<br />
Briiel & Kjaer Dual-Channel Signal<br />
Analyzer.<br />
Determination <strong>of</strong> <strong>the</strong> — —<br />
mr^rlol 4W>rM-i,vnsti'^r. Flgm L An instramentati ^ set-up, using broadband pseudo-random force excitation providmOaai<br />
ireqiienCieS ed by a vibration exciter.<br />
The resonance frequency is <strong>the</strong> easi<br />
est <strong>modal</strong> parameter <strong>to</strong> <strong>determine</strong>. A<br />
resonance is identified as a peak in <strong>the</strong><br />
magnitude <strong>of</strong> <strong>the</strong> frequency response<br />
function, and <strong>the</strong> frequency fr at<br />
which it occurs is found using <strong>the</strong> ana<br />
lyzer's cursor as shown in Figure 3.<br />
The frequency resolution <strong>of</strong> <strong>the</strong><br />
analysis <strong>determine</strong>s <strong>the</strong> accuracy <strong>of</strong><br />
<strong>the</strong> frequency measurement. Greater<br />
accuracy can be attained by reducing<br />
<strong>the</strong> frequency range <strong>of</strong> <strong>the</strong> baseband<br />
measurement, for resonances at low<br />
n n ? asloTn m liure 4 " ^ * ^ Z T l ^ ^ ° f 8imple 8tructu can be °*> Ut "' i ^ ^ ^ ^<br />
surement, as Shown in figure 4. each mode behaving as a single-degree-<strong>of</strong>-freedom system.<br />
Flg ' 3 ' ftmTtl^ ° f "* freqUency res P onse faction for <strong>the</strong> test Fig. 4. Zoom measurement for achieving greater frequency resolution<br />
in <strong>the</strong> determination <strong>of</strong> <strong>the</strong> resonance frequency for <strong>the</strong> second<br />
mode.<br />
2
Fig. 5. Determination <strong>of</strong> <strong>the</strong> damping for <strong>the</strong> second mode by inden- Fig. 6. The frequency weighting function <strong>of</strong> <strong>the</strong> Type 2032 and 2034<br />
tification <strong>of</strong> <strong>the</strong> half-power points. allows a single mode <strong>to</strong> be isolated from <strong>the</strong> frequency response<br />
function.<br />
Determination <strong>of</strong> <strong>the</strong><br />
<strong>modal</strong> damping<br />
The classical method <strong>of</strong> determining<br />
<strong>the</strong> damping at a resonance, using a<br />
frequency analyzer, is <strong>to</strong> identify <strong>the</strong><br />
half power (-3 dB) points <strong>of</strong> <strong>the</strong> mag<br />
nitude <strong>of</strong> <strong>the</strong> frequency response func<br />
tion (see Figure 5). For a particular<br />
mode, <strong>the</strong> damping ratio /"r can be<br />
found from <strong>the</strong> following equation:<br />
* " 2fr<br />
where Af is <strong>the</strong> frequency bandwidth<br />
between <strong>the</strong> two half power points.<br />
The use <strong>of</strong> <strong>the</strong> analyzer's reference<br />
cursor greatly simplifies <strong>the</strong> determi<br />
nation <strong>of</strong> <strong>the</strong> bandwidth Af.<br />
The accuracy <strong>of</strong> this method is de<br />
pendent on <strong>the</strong> frequency resolution<br />
used for <strong>the</strong> measurement because FlgZ The impulse response function <strong>of</strong> <strong>the</strong> isolated mode can be represented by its magm-<br />
this <strong>determine</strong>s how accurately <strong>the</strong> tude and displayed on a logarthmic scale <strong>to</strong> enable easy calculation <strong>of</strong> <strong>the</strong> decay rate.<br />
peak magnitude can be measured. For<br />
lightly damped <strong>structures</strong>, high reso<br />
lution analysis is required <strong>to</strong> measure<br />
<strong>the</strong> peak accurately, consequently, a<br />
zoom measurement at each resonance<br />
frequency is normally required <strong>to</strong> The magnitude (envelope) <strong>of</strong> <strong>the</strong> im- The decay rate ar for <strong>the</strong> isolated<br />
achieve sufficient accuracy. This pulse response function can <strong>the</strong>n be mode is related <strong>to</strong> <strong>the</strong> time constant rr<br />
means that a new measurement must displayed by virtue <strong>of</strong> <strong>the</strong> Hilbert by:<br />
be made for each resonance. transform facility incorporated in <strong>the</strong><br />
<strong>How</strong>ever, <strong>the</strong> Dual-Channel Signal<br />
analyzers. Tj. = —<br />
Analyzers Type 2032 and 2034 can be Since a <strong>simple</strong> structure behaves as The decay correSp0nding <strong>to</strong> time con-<br />
used <strong>to</strong> <strong>determine</strong> <strong>the</strong> damping ratio a smgle-degree-<strong>of</strong>-freedom system at stant rr is given by <strong>the</strong> fac<strong>to</strong>r e \ or in<br />
by an alternative method which re- each resonance, <strong>the</strong> impulse response ^B' _201og(e) = -8 7dB<br />
quires no new measurements. By using function <strong>of</strong> <strong>the</strong> windowed resonance<br />
a frequency weighting function (win- will show characteristic exponential The damping ratio 1S related <strong>to</strong> <strong>the</strong><br />
dow) <strong>to</strong> isolate a single mode from <strong>the</strong> decay r. By displaying <strong>the</strong> magnitude decay rate b .<br />
frequency response function (see Fig- on a logarithmic scale <strong>the</strong> impulse re-<br />
ure 6), <strong>the</strong> impulse response function sponse is represented by a straight y _ ^r _ 1<br />
for that mode alone is easily produced. line (see Figure 7). ' T 2irfr rr ■ 2wfr<br />
a r<br />
3
By moving <strong>the</strong> frequency window<br />
through <strong>the</strong> frequency response func<br />
tion, and looking at each impulse re<br />
sponse function in turn, <strong>the</strong> <strong>modal</strong><br />
damping at each resonance can be de<br />
termined from a single baseband mea<br />
surement.<br />
The decay rate, calculated from a<br />
frequency response function found by<br />
using hammer excitation, will be mod<br />
ified by <strong>the</strong> effective damping <strong>of</strong> <strong>the</strong><br />
exponential weighting function ap<br />
plied <strong>to</strong> <strong>the</strong> response channel. This<br />
weighting function was added <strong>to</strong> cur<br />
tail <strong>the</strong> structural ringing excited by<br />
<strong>the</strong> hammer impact. <strong>How</strong>ever, this er<br />
ror can be compensated for, easily, by<br />
using <strong>the</strong> following correction:<br />
/ 1<br />