S T ATEM E N T S F IN A NCIAL - Cemig
S T ATEM E N T S F IN A NCIAL - Cemig
S T ATEM E N T S F IN A NCIAL - Cemig

You also want an ePaper? Increase the reach of your titles
YUMPU automatically turns print PDFs into web optimized ePapers that Google loves.
F<strong>IN</strong>A<strong>NCIAL</strong><br />
2007<br />
S T A T E M E N T S
Dear Stockholders,<br />
<strong>Cemig</strong> submits for your consideration the report of management and the<br />
financial statements and opinions of the audit board and the external auditors<br />
on the business year ended December 31, 2007. The principal information<br />
in this report refers to the activities of the holding company and<br />
the companies in which the company has 100% control, principally <strong>Cemig</strong><br />
Distribuição S.A. (<strong>Cemig</strong> Distribution) and <strong>Cemig</strong> Geração e Transmissão<br />
S.A. (<strong>Cemig</strong> Generation and Transmission).<br />
MESSAGE FROM MANAGEMENT<br />
After the first wave of consolidation in Brazil’s electricity sector, which we<br />
led with the acquisition of the distributor Light S.A. and of TBE, a group<br />
of companies operating five transmission lines, we began 2007 preparing to<br />
face greater competition due to the success achieved in 2006.<br />
With the positive perception of the investments that we made, the investor<br />
market to some extent woke up to the opportunities for growth through<br />
acquisitions. As a result, the difficulty of acquiring good assets increased<br />
significantly, principally for us, who have specifically-established targets<br />
for returns to our stockholders, based on our Long-term Strategic Plan,<br />
which are part of our strategy for ensuring sustainability in the growth of<br />
our business.<br />
For us, the great challenge for 2008 is to re-establish our position of leadership<br />
in the process of consolidation of the Brazilian sector – and to achieve<br />
this it has been necessary to make some changes in the way we manage our<br />
Strategic Plan.<br />
Firstly, we made some changes in our Bylaws, aiming to make the decision<br />
process faster, and to adapt the organizational structure better to the new<br />
competitive context.<br />
We restructured the process of strategic planning to enable the structural<br />
changes to be incorporated as soon as they are identified. This aspect will<br />
add a new dynamic in evaluation of the impacts caused by changes, and<br />
commit a larger number of executives to re-directing strategic initiatives<br />
to achieve the targets established in our Strategic Plan.<br />
We have created the Chief New Business Officer’s Department, and the<br />
Chief Trading Officer’s Department, aiming to give more flexibility and<br />
competitiveness to the two segments that are most exposed to the investor<br />
market and electricity trading. We believe that this new structure will enable<br />
us to identify opportunities in both markets faster, principally those<br />
related to acquisition of new assets, and capturing of the benefits arising<br />
from these acquisitions.<br />
At the same time, we continue to seek operational excellence in our assets<br />
– which will also be submitted to a process of review to make them more<br />
efficient and economic. For this process we will contract a consultancy company<br />
with international reputation, able to bring us new practices which,<br />
jointly with our present practices, will provide a reduction of costs that<br />
will add not only great value for our stockholders, but also benefits to the<br />
consumers served by our distribution company.<br />
We continue to implement our human capital management policy with a<br />
view to definitively achieving a better remuneration practice for our employees<br />
linked to their performance. This will materialize efficiency gains<br />
obtained by the review of plans to increase productivity and profitability.<br />
In 2007 we achieved net profit of R$ 1.7 billion, with cash flow as measured<br />
by Ebitda totaling R$ 4.1 billion. The cash flow ensures we have the<br />
funds necessary for our expansion. In the period 2004–2007 we have exceeded<br />
the net profit target set in our Long-Term Strategic Plan by 2.9%.<br />
These results – in line with our forecasts disclosed to the market – have<br />
placed our performance among the best in the Brazilian electricity sector.<br />
Meanwhile, as our published reports show, all our indicators are in line<br />
REPORT OF MANAGEMENT FOR 2007<br />
2<br />
with the targets of our Plan, and with the limits specified in our bylaws –<br />
preserving one of the pillars of our growth strategy, which is the company’s<br />
financial health.<br />
We highlight investments we have made that will provide additional gains<br />
when they mature. In the last five years, we have invested more than R$ 6.2<br />
billion in our electricity generation, transmission and distribution activities.<br />
The Light for Everyone program alone – to provide universal access<br />
to public electricity service – has represented investment of R$ 1.6 billion<br />
over the last two years. The immediate material outcome of these investments<br />
has been connection of 279,000 new consumers in 2007, making an<br />
enormous reduction in the number of people who live in the rural areas of<br />
Minas Gerais State without access to electricity.<br />
As well as the investments in distribution we have made accentuated investment<br />
in transmission and generation projects. One highlight is our<br />
participation in the winning consortium at the auction for implementation<br />
of the Santo Antônio hydroelectric plant, the first plant of the Madeira river<br />
complex. This auction took place in December 2007. The plant, with installed<br />
capacity of 3,150 MW, in scheduled to start operating in 2012, and<br />
is thus expected to make a significant contribution to guaranteeing Brazil’s<br />
electricity supply in the next decade. A presence in the Amazon region is an<br />
essential element in our strategy in generation, because that region holds<br />
60% of Brazil’s potential for new hydroelectric generation projects.<br />
We are continuously seeking to improve our relationship with stockholders<br />
and investors, and have now further facilitated their access to our securities<br />
with the launch of ADRs for our common (ON) shares on New York stock<br />
exchange, on June 12, 2007. In 2007 we also made a reverse split, bringing<br />
the unit basis for trading on the São Paulo stock exchange exactly into line<br />
with that of the ADRs in New York and the unit trading price on Madrid’s<br />
Latibex exchange.<br />
On average over the year, our shares had the second highest market capitalization<br />
in the Brazilian Electricity Sector in 2007. Our market cap. at<br />
year-end was R$ 16 billion, reflecting uncertainties on the credit market<br />
in the United States, the risks of the tariff review, and uncertainty on the<br />
return from the Santo Antonio project. For the latter, we reaffirm our secure<br />
confidence in the decision to invest, because we are strongly confident<br />
that we will obtain a return compatible with our investment policy. Unfortunately,<br />
due to the existence of a confidentiality agreement, it has not<br />
been possible to give the required transparency to the investor market. As<br />
soon as the confidentiality agreement permits, we will provide information<br />
complementary to that published so far, and this will enable everyone to<br />
deduce that our decision is in line with our investment policy.<br />
We are confident that, through responsible and sustainable corporate practices,<br />
allied to our commitment to add value over the long term, our stockholders<br />
will continue to have an adequate return for their investments.<br />
This positioning has placed us, once again, among the world leading companies<br />
according to the Dow Jones Sustainability World Index. We have<br />
also been recognized as the best company in the utility sector worldwide<br />
(the “supersector” including electricity, gas, water, and other public utility<br />
services all over the world).<br />
As well as international recognition – which once again reaffirms our status<br />
as a world-class company – we have been recognized by our clients as “the<br />
Best Electricity Concession in the Brazilian Southeast” (in the category of<br />
companies with more than 400,000 consumers), by the IASC (Aneel Consumer<br />
Satisfaction Index) for 2006.<br />
We are aware of the challenges of 2008, in which the economic environment<br />
will be one of considerable uncertainty and instability, led by the<br />
growing concern on Brazil’s ability to ensure that it has enough supply of<br />
electricity in the coming years. In this scenario, <strong>Cemig</strong> presents itself as a<br />
leading company, investing with rigid financial discipline, which guarantees<br />
creation of value, with solid fundamentals in its electricity generation,<br />
transport and distribution businesses, guided by permanent updating in<br />
accordance with the demands of the electricity sector, and best corporate<br />
management practices.
Finally, we thank our stockholders for their trust in our work, and especially<br />
our majority stockholder the State of Minas Gerais, represented by<br />
Governor Aécio Neves. We also thank our employees for their commitment<br />
and dedication, and our clients, suppliers, and all those who have played a<br />
role in our successful 55-year history.<br />
THE ECONOMIC CONTEXT<br />
2007 was a year of improvement in practically all the indicators of the<br />
Brazilian economy.<br />
The economy grew significantly in the year, with GDP posting growth<br />
of 5%, according to financial market estimates, led by the strength of the<br />
domestic market.<br />
The gradual and continuous reduction in interest rate contributed to the<br />
growth of the Brazilian economy in the year – the Selic rate was reduced<br />
from 13.25% p.a. at the end of 2006 to 11.25% at the end of 2007.<br />
Continuation of the process of reduction of interest rates in 2008 will<br />
mainly depend on the behavior of inflation, which the increase has caused<br />
some concern at the end of the year. Even with this increase, the inflacion<br />
acumulated from January to December, measured by IPCA - Índice<br />
Nacional de Preços ao Consumidor Amplo was 4.46%, within the target<br />
established by the country’s monetary authorities.<br />
Brazil continues to achieve a significant trade surplus – among the largest<br />
in the world: R$ 40 billion in 2007, although this was 14.1% less<br />
than in 2006. Exports grew 17% in the year, boosted by the increase<br />
AC<br />
AM<br />
RO<br />
RR<br />
Chile<br />
MT<br />
PA<br />
AP<br />
GO DF<br />
MS<br />
SP<br />
PR<br />
SC<br />
RS<br />
Brazil<br />
MA<br />
CE<br />
RN<br />
PB<br />
PI<br />
PE<br />
TO<br />
AL<br />
BA SE<br />
MG<br />
RJ<br />
ES<br />
3<br />
in prices of exported basic products, while imports increased faster, by<br />
32%, from 2006.<br />
This reduction in the trade balance partly reflects the strengthening of the<br />
Brazilian Real against the US dollar. The dollar depreciated against the<br />
Real by more than 17% in the year – from R$ 2.1380 / US$ at the end of<br />
December 2006 to R$ 1.7713 / US$ at the end of December 2007.<br />
Further significant growth in the Brazilian economy is expected in 2008<br />
and, as a counterpart, greater concern on the part of the monetary authorities<br />
to maintain inflation within targets – a factor which could mean a<br />
slowing of the fall in interest rates.<br />
The growth that is expected in the Brazilian economy in 2008 will have a<br />
direct impact on consumption of electricity, and this makes it even more<br />
necessary to increase investments in expansion of electricity supplies significantly,<br />
and also to maintain a regulatory environment that stimulates<br />
the entry of new investors into the sector.<br />
OUR BUS<strong>IN</strong>ESS<br />
<strong>Cemig</strong> is an operator of significant scale in the electricity sector, having set<br />
up numerous companies to manage its assets.<br />
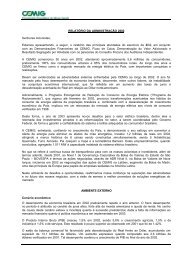
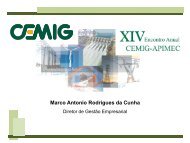
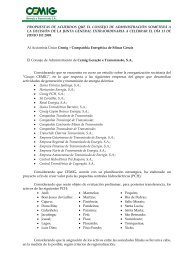
Geographical coverage<br />
As shown in the map below, <strong>Cemig</strong> operates in various regions of Brazil,<br />
primarily concentrated in the Southeast, and also outside Brazil in Chile,<br />
where it is working on construction of the Charrúa–Nueva Temuco transmission<br />
line, scheduled for startup in the second half of 2008.<br />
Transmission<br />
Generation in development<br />
Generation<br />
<strong>Cemig</strong> Free Clients
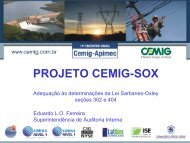
Stockholding structure<br />
Electricity generation<br />
Thermal<br />
Hydroelectric<br />
UTE Barreiro S.A<br />
100,00% CEMIG<br />
UTE Ipatinga S.A<br />
100,00% CEMIG<br />
Cogeração S.A<br />
100,00% CEMIG<br />
<strong>Cemig</strong> GT S.A<br />
100,00%<br />
<strong>Cemig</strong> (1)<br />
Sá Carvalho S.A<br />
100,00%<br />
<strong>Cemig</strong><br />
Horizontes S.A<br />
100,00% CEMIG<br />
<strong>Cemig</strong> PCH S.A<br />
100,00% CEMIG<br />
Capim Branco S.A<br />
100,00% CEMIG<br />
Rosal Energia S.A<br />
100,00% CEMIG<br />
C.H. Pai Joaquim<br />
100,00% CEMIG<br />
Cachoeirão S.A<br />
49,00%<br />
<strong>Cemig</strong> (3)<br />
Guanhães<br />
Energia S.A<br />
49,00% CEMIG(3)<br />
Madeira Energia S.A<br />
10,00% CEMIG (3)<br />
<strong>Cemig</strong> Baguari S. A<br />
100,00%<br />
<strong>Cemig</strong> (3)<br />
VALUE OF THE CEMIG BRAND<br />
Electricity<br />
transmission<br />
Transleste<br />
25,00% CEMIG<br />
Centroeste Minas<br />
51,00% CEMIG<br />
Transudeste<br />
24,00% CEMIG<br />
Transirapé<br />
24,50% CEMIG<br />
Transchile S.A<br />
49,00% CEMIG<br />
ETEP<br />
18,19% CEMIG<br />
ENTE<br />
18,35% CEMIG<br />
ERTE<br />
18,35% CEMIG<br />
EATE<br />
15,79% CEMIG<br />
ECTE<br />
7,50% CEMIG<br />
At present, in the information age, products, machines and equipment<br />
can mean less for companies than image, know-how, brand, technological<br />
development capacity and even intellectual capital – intangible assets,<br />
which when measured can often have market value much greater than that<br />
of the tangible assets recorded in the accounts.<br />
In this context <strong>Cemig</strong>, in a pioneering move in the electricity market,<br />
decided to value its brand, in relation to strategic objectives of management<br />
and mitigation of risk. A panel of <strong>Cemig</strong> brand indicators was included<br />
in the company’s Balance Scorecard, and also an internal process of brand<br />
management.<br />
The strength of the brand can be seen in the relationship with clients,<br />
stockholders, opinion formers (such as specialized media, environmentalists,<br />
NGOs, prefectures, etc), investors and employees.<br />
The value of the <strong>Cemig</strong> brand was calculated by the method based on<br />
Economic Use, by Brand Finance, one of the world’s leadings specialists<br />
in brand valuation. Brand Finance’s method seeks to recognize the future<br />
value of profit flows generated by the brand as a result of the “pact” made<br />
with its clients and other stakeholders. Hence it is based on discounted<br />
value of future profits generated by the brand, with the profit attributed to<br />
tangible and intangible assets being valued separately.<br />
Based on indicators or drivers of value of the brand in the relationship with<br />
stakeholders, the brand’s contribution to the business was determined on<br />
the basis of a quantitative survey of its publics, assessing the performance of<br />
the <strong>Cemig</strong> brand in the following value drivers: credibility, the company’s<br />
trust and solidity, innovation and technology, ethics and transparency,<br />
quality, management practices, development attitudes, image, prices<br />
and contractual conditions, technical support and service, social and<br />
environmental responsibility, association with the State.<br />
Electricity<br />
distribution<br />
<strong>Cemig</strong> Distrib S.A<br />
100,00% CEMIG<br />
Trading S.A<br />
100,00% CEMIG<br />
RME S.A<br />
25,00% CEMIG (2)<br />
4<br />
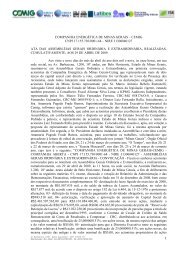
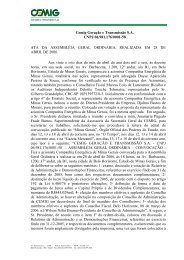
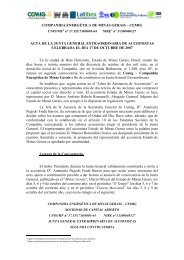
The resulting of the <strong>Cemig</strong> brand can be summarized in this diagram of<br />
two different scenarios:<br />
900<br />
880<br />
860<br />
840<br />
820<br />
800<br />
780<br />
760<br />
740<br />
Gas<br />
distribution<br />
Gasmig S.A<br />
55,19% CEMIG<br />
Valuation of the <strong>Cemig</strong> Brand – EVA and RR – R$ million<br />
890<br />
Telecoms Energy<br />
Infovias S.A<br />
100,00% CEMIG<br />
796<br />
EVA method<br />
RR method<br />
Effi ciency<br />
Effi cientia S.A<br />
100,00% CEMIG<br />
Stockholders scenario Market/financial statements<br />
STRATEGIC PLANN<strong>IN</strong>G<br />
<strong>Cemig</strong>’s strategy seeks to maximize value for its stockholders, in a sustainable<br />
manner, and in obedience to its long-term Strategic Plan (for 2005-2035),<br />
which establishes the financial basis for the strategic planning.<br />
To execute the strategy focus is directed to expansion of the area of operation<br />
(electricity and gas) in the whole of the territory of Brazil, within the limits<br />
set by the regulatory environment; and initial investments in international<br />
projects. In 2007 an example of our growth strategy was our participation<br />
in the Madeira Energia consortium, which won the auction to operate the<br />
Santo Antônio hydroelectric complex on the Madeira River in the Amazon<br />
region.<br />
792<br />
818<br />
Services<br />
Focus Soluções<br />
Energéticas<br />
49,00% CEMIG<br />
(1) Has also electricity transmission activity<br />
(2) The RME - Rio Minas Energia has 54.20% interest of Light S.A<br />
(3) Subsidiaries of <strong>Cemig</strong> Geração e Transmissão S.A. (jointly controlled) of generation<br />
and sale of electricity. They are at development phase.
The strategy also seeks constantly to add value for stockholders and the<br />
public, through a dividend policy that is recognized as attractive; through<br />
commitment to social and environmental responsibility; profitability of<br />
the businesses; integrated risk management, operational efficiency; and an<br />
agreeable environment to work in.<br />
Another important step for <strong>Cemig</strong> was the implementation of a new<br />
management strategy model, based on a structured flow of meetings<br />
that makes greater alignment and focus possible, and makes the process<br />
of strategy planning and management a continuous one. The proposed<br />
model includes the possibility of structured strategic planning, and also<br />
immediate repositioning, when necessary, through a system of strategic<br />
alerts that can be activated for any need or opportunity. Senior management<br />
is the focus and principal user of the model, which can also activate any<br />
area of the corporation. Strategy management is the concept adopted,<br />
which incorporates traditional strategic planning into management best<br />
practices.<br />
In 2006 the process of implementation of this tool focused strongly on<br />
translation of the corporate strategy into operational terms, with our<br />
strategic “maps” for our businesses being updated and validated and<br />
corporate maps and strategic panels of the support processes also being<br />
built, each one with their strategic objectives and performance indicators,<br />
so as to meet the principal indicator directly derived from the Long-Term<br />
Strategic Plan.<br />
In 2007 efforts were centered on alignment between the strategy and<br />
decision on targets for all the company’s business areas for the next<br />
five years, and decisions on initiatives that will achieve the corporate<br />
strategy.<br />
All these efforts aim to make <strong>Cemig</strong> one of the largest companies in<br />
the Brazilian electricity sector. For this, <strong>Cemig</strong> is seeking and will seek<br />
opportunities for acquisition of existing assets and increase of competitiveness<br />
in the auctions for expansion of generation and transmission in which it<br />
takes part, as well as constantly seeking operation efficiency and alignment<br />
to the overall strategy.<br />
With the current phase of consolidation in this sector, growth becomes a<br />
challenge for <strong>Cemig</strong> – and above all a condition for successful survival.<br />
CAPITAL EXPENDITURE<br />
As well as the permanent focus on generation, transmission and distribution<br />
of electricity, <strong>Cemig</strong> has been developing various synergies to its principal<br />
business, taking its brand into other sectors such as telecommunications,<br />
energy efficiency services, and others, aiming always to increase profitability<br />
and strengthen its market position.<br />
The Works Prioritization Committee was organized in the late 1990s and<br />
analyses the expansion projects contained in the Five-year Business Plan,<br />
recommending execution to the Executive Board and ensuring that there is<br />
the minimum return demanded by the Board of Directors.<br />
The mainly investiments of CEMIG, net of divestiture, were as follow:<br />
2007 2006 Change, %<br />
Generation 279 206 35.44<br />
Distribution 861 1,130 (23.81)<br />
Transmission 78 359 (78.27)<br />
Sale of the Way Tv (49) – –<br />
Other 22 25 (12.00)<br />
1,189 1,720 (30.87)<br />
5<br />
Generation<br />
<strong>Cemig</strong> and its subsidiaries own 62 power plants, of which 57 are<br />
hydroelectric, four are thermal and one is a wind power plant, with total<br />
installed capacity of 6,678MW.<br />
Expansion in electricity generation<br />
The main electricity projects under construction are:<br />
Project Power <strong>Cemig</strong> stake<br />
Startup<br />
expected<br />
Baguari plant 140MW 34.00% 2nd half 2009<br />
Cachoeirão “PCH”<br />
(Small Hydro Plant)<br />
PCHs of Guanhães,<br />
20MW 49.00% 2nd half 2008<br />
Senhora do Porto, Fortuna<br />
II and Jacaré<br />
44MW 49.00% 1st half 2009<br />
A highlight in the year was <strong>Cemig</strong>’s participation in the auction for the Santo<br />
Antônio hydroelectric plant on the Madeira River, in the Amazon region, in<br />
December 2007, as a member of the winning consortium. This 3,150MW<br />
plant, in the basin of the Madeira River, will be built in partnership with<br />
other companies. <strong>Cemig</strong> Geração e Transmissão S.A. (<strong>Cemig</strong> Generation and<br />
Distribution) has 10.0%. Startup is scheduled for the year 2012.<br />
Hydroelectric inventory surveys:<br />
The following partnerships were entered into for hydroelectric inventory<br />
studies to obtain information on the energy potential of the state of Minas<br />
Gerais:<br />
Partnership<br />
River Partners Power<br />
started<br />
São Francisco Chesf 1,400MW Jan 07<br />
Paracatu Engevix 47MW Jan 07<br />
Jequitinhonha and Neoenergia and<br />
990MW Aug 07<br />
Araçuaí<br />
Furnas<br />
Feasibility studies of hydroelectric and thermal plants:<br />
Partnerships were entered into with important agents of the Brazilian<br />
hydroelectric generation sector for joint development of technical, economic,<br />
financial and environmental feasibility studies of hydroelectric and thermal<br />
plants, respectively totaling some 1300MW and 70MW of installed capacity.<br />
The Minas Small Hydro Plant (PCH) Program<br />
The aim of the Minas PCH Program is to increase <strong>Cemig</strong>’s generation<br />
capacity through building of small hydro plants (“PCHs”) in Minas<br />
Gerais state, developing alternative energy sources and also generation<br />
from within the locations in the network, contributing to development of<br />
regional markets in the state.<br />
Consumers of the energy generated by the PCHs will benefit also from tax<br />
and other benefits applicable to consumers of electricity from renewable<br />
sources. Renewable-source generation projects are eligible under the Clean<br />
Development Mechanism (CDM) concept, involving obtaining of carbon<br />
credits.<br />
PCHs are built and operated through special-purchase companies whose<br />
stockholders are companies authorized by Aneel, investors and <strong>Cemig</strong><br />
(with 49% stake). Sales are made through sales contracts signed between<br />
the special-purpose company and the consumer.<br />
As well as the projects with construction currently contracted or under<br />
way, the Minas PCH program has 15 other PCHs registered – a total of<br />
209.4MW of installed capacity, of which Memorandums of Understanding<br />
have been signed for 68.5MW, 64.9MW is the subject of confidentiality<br />
agreements, and 76.0MW has an analysis of documents completed.
Modernization and revitalization of plants:<br />
<strong>Cemig</strong> has been carrying out a broad-based program of modernization and<br />
revitalization of some of its plants, with capital expenditure approximately<br />
R$ 250 million in the period of 2002-2009.<br />
Three major projects on progress:<br />
• Modernization of the Três Marias Plant (396MW) with investment of<br />
R$ 53 million, for completion in 2008, which includes technological<br />
updating of the various control systems and refurbishment of its<br />
generating units, making automation of the whole facility possible.<br />
• Modernization of the generating units of the Jaguara plant (424MW)<br />
with investment of R$ 60 million. This plant started operating in<br />
1971, was totally modernized between 2004 and 2007, and the current<br />
modernization project includes technological updating of the regulation,<br />
startup and protection systems, as well as partial refurbishment of the<br />
generators. Modernization of the generating units has resulted in gains in<br />
operational reliability, more efficient physical and electrical protection,<br />
and a better response to system oscillations.<br />
• General refurbishment of the four generating units of the Salto Grande<br />
hydroelectric plant (102MW). Investment is estimated at R$ 17 million,<br />
for conclusion in 2009, including refurbishment of the generators and<br />
rotors, with significant gains in the plant’s efficiency and reliability.<br />
The sugar and alcohol sector<br />
Under the Minas Gerais Program to Stimulate Development of the Sugar<br />
and Alcohol Sector, letters of intent are being signed by <strong>Cemig</strong> and various<br />
bodies of the state government with sugar and alcohol mills planned for<br />
construction in Minas Gerais.<br />
<strong>Cemig</strong> has been holding meetings with groups that plan to set up new sugar/<br />
alcohol mills or modernize their existing plant, so as to map the potential for cogeneration<br />
and sale of new electricity, and to present a proposal for partnership<br />
by <strong>Cemig</strong> in co-generation and/or sale of electricity.<br />
45 sugar/alcohol operations to be built in Minas Gerais have been identified,<br />
with potential co-generation capacity of the order of 2,200MW by 2015<br />
providing excess energy for sale of 1,300MW during the harvest.<br />
Transmission<br />
The main projects in progress are:<br />
• The 75-km 345kV Furnas–Pimenta transmission line, to be built by<br />
Companhia de Transmissão Centroeste de Minas, in which <strong>Cemig</strong><br />
has (51%) and Furnas (49%). The investment is R$ 47.7mn, <strong>Cemig</strong><br />
participating with R$ 24.3mn. Startup is planned for January 2009.<br />
• Construction of the Charrúa–Nueva Temuco transmission line in Chile:<br />
This is a double-circuit, 220kV line with total length of 205km, and<br />
two sections between the Charrúa and Nueva Temuco substations, in<br />
the Central Region of Chile. <strong>Cemig</strong> has a stake of 49%, and Alusa 51%.<br />
They have formed the company Transchile Charrúa Transmisión S.A. to<br />
implement, operate and maintain the facility, with startup date scheduled<br />
for January 2008. The investment is US$63.4mn, <strong>Cemig</strong> participating<br />
with US$31.1mn.<br />
The main projects that started operation in 2007 were:<br />
• The 140-km, 345kV Itutinga–Juiz de Fora transmission line, being<br />
built by Companhia Transudeste de Transmissão, in which <strong>Cemig</strong> has<br />
24%, Alusa 41%, Furnas 25% and Orteng 10%. The total cost of works<br />
was R$ 68 million.<br />
• The 65-km, 230kV Irapé–Araçuaí transmission line, and the Irapé<br />
and Araçuaí substations, being built by Companhia Transirapé de<br />
Transmissão, in which <strong>Cemig</strong> has 24.5%, Alusa 41%, Furnas 24.5% and<br />
Orteng 10%.
The events in Bolivia led to a change in compliance with the levels of<br />
supply previously contracted with that country, and showed the importance<br />
of reducing dependence of the Brazilian gas market on supply from the<br />
Brazil-Bolivia gas pipeline (“Gasbol”). The action taken by Petrobras to<br />
contract imports of liquefied natural gas (LNG) are part of the mediumterm<br />
response to this situation – supply will begin in 2008.<br />
Over a longer horizon, it is still necessary to speed up projects for gas<br />
exploration and production in Brazilian deposits, and also to apply<br />
policies that aim for a greater integration of Brazil with other Latin<br />
American countries in terms of energy, as well as expanding gas transport<br />
infrastructure for delivery of the natural gas produced domestically, and to<br />
be imported.<br />
In 2007 Brazil consumed an average of 42 million m3/day, of natural<br />
gas, led by the Southeastern region with 2/3 of this volume. The most<br />
important consumer, industry, consumed 59% of the total volume followed<br />
by the thermal electricity distribution industry with 26%, the automobile<br />
industry with 13%, and other sectors with 2%.<br />
Expansion of Gasmig’s network has made it possible to distribute natural<br />
gas to a higher number of clients: 276 at the end of 2007 (169 companies,<br />
90 vehicle natural gas stations, and 2 thermal electricity plants, 7 compressed<br />
natural gas distribution bases, and 8 clients consuming liquefied natural<br />
gas). This was an increase of 5.75% in the number of clients from 2006.<br />
There was a reduction of 13.47% in the total volume of sales, led by the<br />
reduction of consumption by thermal plants, where there was a significant<br />
fall of 60.77%. However, considering only the market for conventional gas,<br />
the volume of gas sold increased 3.51%, reflecting increased consumption,<br />
mainly by industrial clients.<br />
Telecoms<br />
2007 was a positive year for the telecoms sector, with continuation of the<br />
expansion in mobile telephony in recent years. Voice services, currently<br />
the main generator of revenue for the mobile operators, are estimated to<br />
provide 80% of total sales. This trend is expected to continue in 2008<br />
but the sector is looking for a way of reversing this trend, in which clients<br />
would use other services.<br />
A highlight is the launch of the first 3G network, offering broadband<br />
services. Following the trend in the telecoms market, Empresa de Infovias<br />
expanded the Ethernet technology network initially to meet the demand<br />
ELECTRICITY SALES<br />
Electricity auctions<br />
In 2007 <strong>Cemig</strong> took part in several auctions in the Regulated Market and Free Market, as follows:<br />
Date Auction<br />
Power bought by <strong>Cemig</strong><br />
Distribution<br />
Trading in the Regulated Market<br />
7<br />
of the mobile operator TIM in the “3G Project”. This project consists of a<br />
third generation network able to offer clients broadband service by mobile<br />
phone at high transmission speeds.<br />
Infovias was classified by the Anuário Telecom 2007 as the second most<br />
efficient company in the category Services – Network Infrastructure. This<br />
was based on the company’s results for 2006. Speed and quality in service<br />
to clients and competitive prices were vital factors in the company’s<br />
performance in 2007.<br />
Even greater growth in the telecom sector is expected in 2008 than<br />
in 2007, led by broadband access. It is clear that there will be intense<br />
construction of both 3G and Wimax networks in Latin America in 2008,<br />
to increase broadband penetration, which is currently between 3% and 5%<br />
– compared to approximately 20% in more developed regions.<br />
The outlook for Infovias this year is for investment in important projects<br />
for consolidation in the sector, and growth of its revenue. The Board of<br />
Directors has approved the SIM (Integrated Services) Project to provide<br />
telecom services (including voice, IP telephony, telemetry and internet)<br />
in 50 cities of Minas Gerais state – initially for <strong>Cemig</strong>, and potentially for<br />
the local corporate market. Total planned investment in 2008 is R$ 59.5<br />
million.<br />
Other businesses<br />
In partnership with Concert Technologies S.A., Nansen S.A. Instrumentos<br />
de Precisão, Leme Engenharia Ltda. and FIR Capital Partners Ltda, <strong>Cemig</strong><br />
created Focus Soluções Tecnológicas S.A., the name of which will be changed<br />
to Axxiom Soluções Tecnológicas S.A., to offer solutions in technology and<br />
systems for operational management of public service concession holders,<br />
including electricity, gas, water, and sewerage and other public utility<br />
companies, offering the following:<br />
• Integration of new solutions, developed by it or by other companies, into<br />
existing systems;<br />
• development and implementation of specific solutions;<br />
• offer of hardware or consultancy contract services for integrated solutions;<br />
and<br />
• development, supply and sale of the equipment, software and systems<br />
necessary for the solutions offered.<br />
Average Price<br />
(MWh)<br />
Power sold by <strong>Cemig</strong> Generation<br />
and Transmission<br />
Average price<br />
(R$ /MWh)<br />
6/18/2007 Alternative sources 61MW average (15 years) R$ 138.85 – –<br />
6/18/2007 Alternative sources 20MW average (30 years) R$ 134.99 – –<br />
7/26/2007 A-3 431,173MW average (15 years) R$ 134.67 – –<br />
9/27/2007 6th Adjustment Auction 3,5MW average (1 year) R$ 138.74 60MW average (1 year) R$ 139.04<br />
10/16/2007 A-5 56MW average (30 years) R$ 128.73 43MW average (30 years) R$ 125.90<br />
10/16/2007 A-5 126MW average (15 years) R$ 128.73 – –<br />
12/10/2007 Santo Antonio 30,002,603.786 MWh (30 years) R$ 78.87 – –
Auctions in the Free Market<br />
<strong>Cemig</strong> Generation and Transmission sold 32,323 GWh, and acquired<br />
3,879 GWh from Free Clients and traders in auctions held in the Free<br />
Market (“ACL”) held by <strong>Cemig</strong> Generation and Distribution itself or by<br />
third parties.<br />
Development of the energy market<br />
<strong>Cemig</strong>’s consolidated market consists of the markets of the companies<br />
<strong>Cemig</strong> Distribuição S.A. and <strong>Cemig</strong> Geração e Transmissão S.A., and<br />
also of other subsidiary companies, mainly Light S.A.. Through the<br />
various companies in its group, <strong>Cemig</strong> operates in all the sectors of<br />
the electricity industry and, with a diversified portfolio, serves captive<br />
and free final clients, as well as trading energy with other agents that<br />
operate in this market.<br />
After the strong migration of captive clients to the free contracting<br />
environment that took place in 2005, in the following years some<br />
consumer units opted for free acquisition of energy, but less frequently.<br />
In 2007, twelve consumers migrated from the captive market to<br />
the free contracting environment, representing 0.8% of the energy<br />
supplied by <strong>Cemig</strong> Distribuição S.A. Of these, four units contracted<br />
energy from sources benefiting from tax and other incentives, with<br />
subsidiaries of the <strong>Cemig</strong> group, and one unit with <strong>Cemig</strong> Geração<br />
e Transmissão.<br />
The good performance of the Brazilian economy, sustained by the<br />
dynamism of the domestic and external markets, associated with<br />
the sales strategies adopted by <strong>Cemig</strong> in the free market and the<br />
acquisition of Light, in August 2006, through the RME (Rio Minas<br />
Energia S.A. consortium), contributed to the growth of sales of<br />
electricity in 2007.<br />
Retail supply of electricity<br />
Total electricity sold – GWh<br />
Type 2003 2004 2005 2006 2007<br />
Change, %<br />
2007/2006<br />
Industrial 21,715 23,071 23,472 23,973 24,686 2.97<br />
Residential 6,529 6,526 6,590 7,430 8,649 16.41<br />
Commercial 3,402 3,537 3,754 4,439 5,549 25.01<br />
Rural 1,783 1,846 1,941 1,942 2,212 13.90<br />
Others<br />
Total<br />
sold to fi nal<br />
2,478 2,499 2,573 2,970 3,507 18.08<br />
consumers 35,907 37,479 38,330 40,754 44,603 9.44<br />
Wholesale<br />
supply<br />
Own<br />
consumption<br />
621 364 1,255 11,472 13,236 15.38<br />
55 54 29 37 53 43.24<br />
Total 36,583 37,897 39,614 52,263 57,892 10.77<br />
As shown, the volume of <strong>Cemig</strong>’s energy sales increased from 2006 in<br />
all consumer classes. The sales of Light, which are taken into account in<br />
proportion to <strong>Cemig</strong>’s stockholding in the RME consortium (25%), add<br />
5,791 GWh to total consolidated sales in 2007.<br />
The highest relative growth was in the commercial and residential user<br />
categories: 25.01% and 16.41%, respectively. The growth in those<br />
categories reflects the stake in Light, which added 1,836GWh to the<br />
residential category and 1,439GWh to the commercial category. Together<br />
8<br />
these two categories correspond to 56.55% of Light’s total retail supply of<br />
5,791GWh.<br />
The main variations in the consumer categories, as well as the effect arising<br />
from the consolidation of Light in the 12 months of 2007 – compared to<br />
5 months in 2006 – reflects the following factors:<br />
• Consumption grew in the Residential user class grew due to the<br />
increase in the number of consumers billed, and the good performance<br />
of conditioning factors such as increasing employment and real<br />
income, abundant supply of credit and growth in the volume of sales<br />
of household appliances.<br />
• The Industrial category grew 3.0%, reflecting sales to free clients,<br />
in turn reflecting greater use of contractual flexibility and also the<br />
company’s efforts to make contracts with new clients, including<br />
clients outside the company’s concession area.<br />
• The commercial category grew by 25.0% from 2006, also reflecting<br />
the increase of consumption by the main commercial activities in<br />
Minas Gerais, such as: retailing (5.2%), accommodation and food<br />
(4.5%) and communication services (8.7%).<br />
• In the rural category, the growth in new conventional consumer<br />
units connected by the Light For Everyone program, and the growth<br />
in consumption for irrigation, reflecting lower rainfall and higher<br />
temperatures, led to an increase of 13.9% in consumption, from<br />
2006.<br />
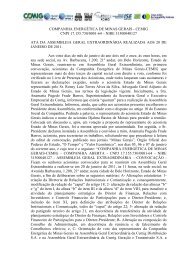
4.5%<br />
18.8%<br />
BREAKDOWN BY CATEGORY, %<br />
0.1%<br />
22.4%<br />
42.9%<br />
6.1%<br />
3.8%<br />
9.7%<br />
Industrial<br />
15.0%<br />
Residential Commercial<br />
Rural<br />
Own Consumption<br />
Others Supply<br />
BREAKDOWN BY REVENUE, %<br />
8.9%<br />
25.6%<br />
9.1%<br />
33.1%<br />
Industrial Residential Commercial<br />
Rural Others Supply
Tariff adjustment and review<br />
Tariff adjustment<br />
The tariff adjustment in effect from April 8, 2007 applied different rates<br />
of increase by category of consumption, aiming to gradually eliminate the<br />
cross-subsidies existing between the consumer groups. The average increase<br />
in electricity bills was 5.16%; low-voltage users paid an increase of 6.50%,<br />
while high-voltage users had an increase of 2.89%.<br />
The Tariff Review<br />
Aneel, the Brazilian electricity regulator, is in the process of review of retail<br />
supply tariffs and the Charge for Use of the Distribution System (TUSD) of<br />
<strong>Cemig</strong> Distribution, this being the second cycle of review corresponding to<br />
the period 2008–13. The public hearing was set for March 5, 2008, and the<br />
new tariffs will come into effect on April 8, 2008. The average percentage<br />
of adjustment, disclosed on a provisional basis by Aneel, corresponds to<br />
a reduction of 9.72%. To arrive at this value, parameters were taken into<br />
account for the first cycle, which are also being adjusted, such as indicators<br />
of productivity, the value of the asset base to be remunerated, and the<br />
company’s average cost of capital. This provisional percentage may yet be<br />
altered as a result of contributions be received at the public hearing, and<br />
decision by Aneel on the actual value of the asset base to be remunerated in<br />
the second tariff review cycle.<br />
Revision of permitted transmission revenue<br />
On June 26, 2007, the date for annual readjustment of permitted revenues of<br />
transmission concession holders, Aneel published the various adjustments,<br />
by Homologation Resolution 496, to come into effect from July 1, 2007 up<br />
to June 30, 2008 for <strong>Cemig</strong> Geração e Transmissão.<br />
The annual transmission revenue was increased by 3.07%, resulting from<br />
application of the IGP-M inflation index up to May, in the amount of<br />
4.40%, and in counterpart, the effects of the first Periodic Review of the<br />
Assets of the Basic Network – New Installations (RBNI) were incorporated,<br />
resulting in a reduction of 24.58% in the revenue from these assets,<br />
backdated to July 2005.<br />
This resulted in calculation of an excess revenue for the previous periods,<br />
giving rise to a liability in the amount of R$ 31 million, which is being<br />
amortized in two portions, the first in the 2007-8 cycle and the second in<br />
the 2008-9 cycle.<br />
Protection of revenue – management of losses<br />
<strong>Cemig</strong> Distribution is among the distributors with the lowest indices of<br />
commercial losses in Brazil, although there have been increases in recent<br />
years.<br />
At present, the company’s level of commercial losses is around 2.78% of<br />
the total amount of energy that enters the distribution system, this index<br />
being comparable to those of the best companies in the electricity sector<br />
worldwide. The Brazilian average is around 6%.<br />
The results of identification and recovery of commercial losses total<br />
147.8 GWh in 2007, an increase of 11.5% in relation to 2006. This<br />
corresponds to approximately R$ 108.7 million (increase of 20.8% from<br />
2006), and also, approximately, R$ 91.4 million in losses avoided or<br />
increases of consumption by consumer units that were regularized.<br />
In 2007, aiming further to increase the company’s capacity for reaction<br />
to the increase in the practice of irregularities, several actions were taken,<br />
including:<br />
• Implementation of analysis of probability and risk of loss for each<br />
consumer unit where there is suspicion of irregularity, associated to the<br />
Web Inspection Orders Management system (WGOI), seeking greater<br />
efficiency in identification of units with irregularities, and strengthening<br />
the potential for results from the process.<br />
• Improvement in the corporate system for control of seals and meters<br />
made available, and also general rules for control of seals, seeking to<br />
ensure traceability of these devices and equipment.<br />
9<br />
• Implementation and execution of the Value Addition Project (PAV) for<br />
protection of revenue, which showed the economic viability of actions to<br />
combat losses and default, providing a greater input of funds into these<br />
activities, with consequent addition of revenue.<br />
• Approval of the Revenue Protection Plan, focused on metering, to be put<br />
in place starting in 2008, aiming to focus on the question and treatment<br />
of commercial losses of <strong>Cemig</strong> Distribution, adding, to form a major<br />
project, technologies and actions to “bulletproof” the revenue from<br />
medium-sized and large consumers, and application of complementary<br />
technologies to the other consumers.<br />
• Development and incorporation of the system for management of losses<br />
in the new Clients Management System (SGC/SAP) acquired by <strong>Cemig</strong><br />
which is in the process of being put in place, making the information<br />
fully traceable and available to all the those involved.<br />
Retail supply quality<br />
The charts below show the changes in <strong>Cemig</strong> Distribution’s quality<br />
indicators.<br />
54<br />
10.74<br />
6.42<br />
Consumer outages: minutes/month<br />
55<br />
61<br />
2003 2004 2005 2006 2007<br />
10.93<br />
12.21<br />
13.03<br />
Approximately 18% of the DEC and 13% of the FEC is for programmed<br />
outages effected to improve the network. These are preceded by notice to<br />
consumers, reducing the impact of temporary suspension of supply.<br />
Service policy<br />
<strong>Cemig</strong> has consolidated a group of Commercial Relationship Practices<br />
with its clients based principally on quality of its products and services,<br />
65<br />
Consumer outages: hours/year (DEC)<br />
13.14<br />
2003 2004 2005 2006 2007<br />
Consumer outage frequency (FEC)<br />
Number of outages/year<br />
6.58<br />
6.78<br />
6.43<br />
66<br />
6.39<br />
2003 2004 2005 2006 2007
preservation of credibility with clients, stockholders and the public, and<br />
in the strength of its brand and its effective participation in social and<br />
economic development over the whole of its area of operation.<br />
The company offers channels of relationship that enable clients to carry out<br />
transactions, complain, suggest and request services, efficiently and fast. the<br />
main channels available are: Speak to <strong>Cemig</strong> “Fale com a <strong>Cemig</strong>”); Service<br />
Branches (“Agências de Atendimento”); Relationship Agents (“Agentes<br />
de Relacionamento”); Simplified Service Posts (“Postos de Atendimento<br />
Simplificado (PAS)”); <strong>Cemig</strong> Fácil (“<strong>Cemig</strong> Easy Access”); and the “Virtual<br />
Branch” (Agência Virtual) which is available on <strong>Cemig</strong>’s web portal:<br />
www.cemig.com.br.<br />
As well as continuous investment in improvement of the existing channels<br />
<strong>Cemig</strong> seeks new forms of relationship to offer more convenient and fast<br />
options for contact with the company.<br />
The client also has available, periodically, other relationship options<br />
through the Mobile Branch trailer and the <strong>Cemig</strong> na Praça (“<strong>Cemig</strong> in the<br />
Main Square”) program. Both aim to take <strong>Cemig</strong> to the client. The Mobile<br />
Branch trailer visits municipalities of some regions of the state providing<br />
services and orientation to the public. The <strong>Cemig</strong> na Praça program<br />
covers municipalities of all the regions, taking services, information and<br />
orientation to clients in a personalized marquee.<br />
ECONOMIC – F<strong>IN</strong>A<strong>NCIAL</strong> PERFORMANCE<br />
In thousands of reais, except where otherwise stated.<br />
Net profit<br />
<strong>Cemig</strong>’s net profit in 2007 was R$ 1,735 million, which compares with net<br />
profit of R$ 1,719 million in 2006.<br />
As shown by the table below, the largest contribution to <strong>Cemig</strong>’s result<br />
comes from <strong>Cemig</strong> Geração e Transmissão (<strong>Cemig</strong> Generation and<br />
Transmission) and <strong>Cemig</strong> Distribuição (<strong>Cemig</strong> Distribution):<br />
2007 % 2006 %<br />
<strong>Cemig</strong> – parent company (176) (10.14) 124 7.21<br />
<strong>Cemig</strong> Distribuição S.A. 771 44.44 770 44.79<br />
<strong>Cemig</strong> Geração e<br />
Transmissão S.A.<br />
747 43.05 614 35.72<br />
Gasmig 46 2.65 44 2.56<br />
Rio Minas Energia (Light) 148 8.53 35 2.04<br />
Other 199 11.47 132 7.68<br />
Consolidated net profi t 1,735 100.00 1,719 100.00<br />
Operational Revenue<br />
OPERATIONAL REVENUE – R$ million<br />
Gross revenue from retail supply of<br />
electricity<br />
Revenue for use of the network<br />
– free consumers<br />
2007 2006 Change, %<br />
13,285 11,135 19.30<br />
1,946 1,789 8.78<br />
Other 558 507 10.06<br />
15,789 13,431 17.56<br />
10<br />
Gross revenue from retail supply of electricity<br />
Final consumers<br />
The main impacts on 2007 revenues arose from the following factors:<br />
• An increase of 8.69% in the average tariff, from R$ 245.73 in 2006<br />
to R$ 267.08 in 2007, as a result of tariff increases allowed to <strong>Cemig</strong><br />
Distribuição on April 8, 2006 (full effect in the 2007 business year) and<br />
April 8, 2007.<br />
• 9.44% increase in the volume of energy invoiced to final consumers<br />
– comments on the variations are in the item on Sales of electricity.<br />
This chart shows quarterly and annual variations in retail supply:<br />
GWh billed to final consumers<br />
10,537<br />
35,907<br />
9,594<br />
Quarterly<br />
11,645<br />
11,203 11,218<br />
10,649 10,777<br />
9,734<br />
1° Trim. 2° Trim. 3° Trim. 4º Trim<br />
2007 2006<br />
37,479<br />
Annual<br />
38,330<br />
40,754<br />
44,603<br />
2003 2004 2005 2006 2007<br />
There are more comments on retail supply and the tariff adjustment in the<br />
item on Sales of electricity.<br />
Other concession holders<br />
The volume of energy sold to other concession holders in 2007<br />
was 13,236 GWh, which compares with 11,472 GWh in 2006<br />
– corresponding to R$ 1,210 million and R$ 709 million, respectively.<br />
This significant increase arises basically from the start up of the Irapé<br />
plant, in the second half of 2006, higher volume of electricity traded<br />
through contracts with electricity traders, and better prices negotiated<br />
by <strong>Cemig</strong> Generation and Transmission in 2007. We also highlight<br />
the exportation of electricity to Argentina in Uruguay in 2007, providing<br />
revenue of R$ 64 million. The average sale tariff in 2007 was 91.40/MWh<br />
compared to R$ 61.79/MWh in 2006, an increase of 47.92%.
Revenue from use of the grid<br />
The increase in revenue from use of the network was 8.78% in 2007:<br />
R$ 1,946 in 2007, vs. R$ 1,789 in 2006.<br />
The major item under this heading is the revenue from the TUSD (Tariff<br />
for Use of the Distribution System), charged by <strong>Cemig</strong> Distribution<br />
and Light to free consumers. This was 9.23% higher in 2007 than 2006<br />
(R$ 1,313 miliions in 2007 vs. R$ 1,202 miliions. The increase primarily<br />
represents higher volume of electricity transported in 2007, reflecting the<br />
increase in industrial production and the migration of clients from the<br />
captive market to the free market, in 2007.<br />
Additionally there was a reduction in revenue from the basic grid in 2007,<br />
of R$ 31 million, due to the review of the annual permitted revenues linked<br />
to the new facilities of the basic grid and other transmission facilities<br />
for electricity transmission concession holders, in obedience to Aneel<br />
decisions. There are more explanations in Explanatory Notes 23 and 27 to<br />
the Consolidated Financial Statements.<br />
Non-controllable costs<br />
The differences between the sums of non-controllable costs (also referred<br />
to as “CVA”) used as a reference in the calculation of the tariff adjustment<br />
and the disbursements actually made are offset in the subsequent tariff<br />
adjustments, and are registered in Current assets and Non-current assets.<br />
As a function of the change in Aneel’s accounting plan, some items were<br />
transferred to the item “Deductions from Operational Revenues”. There<br />
are more explanations in Explanatory Notes 2 and 8 to the Consolidated<br />
Financial Statements.<br />
Deductions from operational revenues<br />
Deductions from operational revenues amounted to R$ 5,544 million in<br />
2007, compared to R$ 4,965 million in 2006, an increase of 11.66%. The<br />
principal changes in these expenses are as follows:<br />
Fuel Consumption Account – CCC<br />
This relates to the operational costs of thermal plants in the Brazilian grid<br />
and isolated systems, split among electricity concession holders as specified<br />
by an Aneel Resolution. This is a non-controllable cost, and the amount<br />
recorded for electricity distribution service corresponds to the amount<br />
actually passed through to the tariff. For the amount recorded in relation<br />
to electricity transmission services the company merely passes through the<br />
CCC charge – it is charged to free consumers on their invoice for us of the<br />
grid and passed onto Eletrobrás.<br />
The total deduction from revenue for the CCC in 2007 was R$ 407mn vs.<br />
R$ 554mn in 2006, 26.53% lower – mainly reflecting backdated charging in<br />
2006 to some consumers, after homologation of the Contracts for Use of the<br />
Transmission System (CUST) by the National System Operator (ONS).<br />
Energy Development Account – CDE<br />
The deduction from revenue for the CDE in 2007 was R$ 391 million, vs.<br />
R$ 334 in 2006, an increase of 17.0%. The payments are specified by an<br />
Aneel Resolution. This is a non-controllable cost. The amount posted for<br />
electricity distribution services corresponds to the amount actually passed<br />
through to the tariff. For the amount posted in relation to electricity<br />
transmission services the company merely passes through the charge since<br />
the CCC is charged to free consumer on the invoice for the use of the grid<br />
and passed onto Eletrobrás.<br />
RGR – Global Reversion Reserve<br />
The provision for RGR in 2007 was R$ 145 million, vs. R$ 30 million<br />
in 2006. This reflects a positive adjustment in 2006 for the provision for<br />
2004, in the amount of R$ 66 million, due to homologation of this expense<br />
by Aneel in a lower amount than was estimated by the company, and also<br />
an increase in 2007 of the accounting value of fixed assets in service, which<br />
is the basis for calculation of the expense.<br />
The other deductions from revenue are for taxes calculated as a percentage<br />
of billing, and their variations thus substantially arise from the changes<br />
in revenue.<br />
11<br />
Operational costs and expenses<br />
2007 2006<br />
Change,<br />
%<br />
NON-CONTROLLABLE COSTS<br />
Electricity purchased for resale<br />
Financial compensation for use of<br />
2,794 2,113 32.23<br />
water resources<br />
Charges for use of the national<br />
137 139 (1.44)<br />
transmission grid 650 664 (2.11)<br />
CONTROLLABLE COSTS<br />
3,581 2,916 22.81<br />
Personnel and managers expenses 968 1,088 (11.03)<br />
Post-employment obligations 123 170 (27.65)<br />
Materials<br />
Raw materials and inputs for<br />
94 82 14.63<br />
production 59 37 59.46<br />
Outsourced services 620 504 23.02<br />
Operational provisions 291 52 459.62<br />
Gas purchased for resale 154 158 (2.53)<br />
Depreciation and amortization 778 672 15.77<br />
Other expenses, net 284 238 19.33<br />
3,371 3,001 12.33<br />
6,952 5,917 17.49<br />
Operational costs and expenses (excluding Financial revenue (expenses))<br />
totaled R$ 6,952 million in 2007, compared to R$ 5,917 million in 2006,<br />
an increase of 17,49%. This mainly reflects the change in the amount of<br />
energy bought through for resale, and operational provisions, partly offset<br />
by the reduction in the expense on personnel.<br />
The principal changes in expenses are:<br />
Electricity purchased for resale<br />
The expense on this account in 2007 was R$ 2,794 million, 32.23% higher<br />
than the figure of R$ 2,113 million for this account in 2006. This is a noncontrollable<br />
cost, with the expense recognized in the income statement<br />
corresponding to the value effectively passed through to the tariff. For more<br />
information please see Explanatory Note 30 to the financial statements.<br />
Charges for Use of the Basic Transmission Grid<br />
The expense on charges for use of the transmission network in 2007 was<br />
R$ 650 million, vs. R$ 664 million in 2006, a reduction of 2.11%. These<br />
charges are payable by distribution and generation agents for use of the<br />
facilities and components of the basic grid, and are set by Aneel resolution.<br />
This is a non-controllable cost, with the deduction from revenue recorded<br />
corresponding to the value effectively passed through to the tariff.<br />
Personnel expenses<br />
Personnel expenses in 2007 totaled R$ 968 million, vs. R$ 1,088 million in<br />
2006, a reduction of 11.03%. This lower figure is primarily because of the<br />
provision made in June 2006 for indemnity to employees for their future<br />
“anuênio” rights, in the amount of R$ 178 million, partially offset by the<br />
4% and 5% wage adjustment given to employees in November of 2006<br />
and 2007, respectively, and the 1.50% increase in the number of employees<br />
of the <strong>Cemig</strong> Holding Company, <strong>Cemig</strong> Generation and Transmission<br />
and <strong>Cemig</strong> Distribution, which totaled 10,658 in December 2006, and<br />
10,818 in December 2007. There is a breakdown of personnel expenses in<br />
Explanatory Note 30 to the Consolidated Financial Statements.<br />
Depreciation and amortization<br />
Deductions from operational revenues totaled R$ 778 million in 2007,<br />
compared to R$ 672 million in 2006, an increase of 15.77%.<br />
This variation arises mainly from investments in the Light for Everyone<br />
program and the startup of the Irapé plant, in the second half of 2006.
We also highlight the consolidation of RME, which added an expense of<br />
R$ 82 million in 2007 (vs. R$ 33 million in 2006) – because RME was<br />
consolidated for the whole of 2007, but only five months of 2006.<br />
Post-employment obligations<br />
Expenses on post-employment obligations in 2007 were R$ 123 million<br />
compared to R$ 170 million in 2006, a reduction of 27.65%. These<br />
expenses basically represent interest on the actuarial liabilities of <strong>Cemig</strong><br />
Distribution, net of the expected return on plan assets, as estimated by an<br />
external actuary. The reduction reflects higher growth of the assets of the<br />
pension plan than the growth in obligations to the participants.<br />
EBITDA (EARN<strong>IN</strong>GS BEFORE <strong>IN</strong>TEREST, TAX,<br />
DEPRECIATION AND AMORTIZATION)<br />
Reflecting the above variations, Ebitda adjusted for non-recurring items<br />
is as follows:<br />
2007 2006<br />
Change,<br />
%<br />
Net profi t<br />
+ Provision for current and deferred<br />
1,735 1,719 0.93<br />
income tax and Social Contribution<br />
+ Non-operational revenue (ex-<br />
623 527 18.22<br />
penses) 10 37 (72.97)<br />
+ Financial revenues (expenses) 356 50 612.00<br />
+ Amortization and depreciation 778 672 15.77<br />
+ Employees’ profi t shares 455 210 116.67<br />
+ Minority interest 116 7 1.557.14<br />
EBITDA<br />
Non-recurring items (*)<br />
Cost of Energy Effi ciency programs<br />
4,073 3,222 26.41<br />
from previous years – 85 –<br />
Indemnity for the “anuênio” – 178 –<br />
+ CVA re-composition - TUSD – 93 –<br />
+ Review of transmission revenue<br />
– Homologation Resolution 496<br />
31 –<br />
–<br />
- Reversal of provision for RGR<br />
- CVA energy – adjustments set by<br />
– (66) –<br />
ANEEL (29) – –<br />
ADJUSTED EBITDA 4,075 3,512 16.03<br />
The non-recurring adjustments correspond to the company’s interpretation<br />
on events which it deems to be extraordinary, not related to current<br />
operations.<br />
As can be seen, <strong>Cemig</strong>’s Ebitda increased significantly in 2007 – and has<br />
increased by approximately 127% over the last five years – reflecting the<br />
growing operational performance over that period.<br />
4.200<br />
3.600<br />
3.000<br />
2.400<br />
1.800<br />
1.200<br />
600<br />
-<br />
1,797<br />
2,266<br />
2,798<br />
3,222<br />
2003 2004 2005 2006 2007<br />
EBITDA EBITDA Margin<br />
4,073<br />
60%<br />
50%<br />
40%<br />
30%<br />
20%<br />
10%<br />
0%<br />
12<br />
Financial revenues (expenses)<br />
The company posted net financial expenses of R$ 356 million in 2007,<br />
which compares with net financial expenses of R$ 50 million in 2006. The<br />
main factors in this financial result are:<br />
• Reversal of the provision for losses on accounts receivable from the state<br />
of Minas Gerais, of R$ 99 million in 2006, due to the creation of a<br />
Credit Receivables Fund (FIDC) and signature of the 4th contractual<br />
amendment for renegotiation of the debt. For more information please<br />
see Explanatory Note 14 to the financial statements.<br />
• Revenue for monetary variation arising from the General Agreement for<br />
the Electricity Sector in 2007 of R$ 405mn, compared to R$ 322mn in<br />
2006, an increase of 25.77% – arising mainly from accounting in the<br />
second half of 2007 of financial revenue of R$ 100mn in accordance with<br />
criteria for updating set by Aneel for the assets relating to transactions<br />
in free energy in the period of rationing. This change did not affect Net<br />
financial revenue (expenses) since there is a corresponding increase in the<br />
provision for losses in free energy (R$ 175 million in 2007, compared to<br />
R$ 86 million in 2006).<br />
• Revenue from monetary variation and interest on the deferred tariff<br />
adjustment in 2007 was R$ 131 million, 34.17% less than its total of<br />
R$ 199 million in 2006. This mainly reflects the reduction of the size of<br />
the asset due to receipt of some of the values receivable into electricity<br />
accounts paid by clients. For more information please see Explanatory<br />
Note 13 to the financial statements.<br />
• Net gain of R$ 110 million on currency variations in 2007, compared to<br />
a net gain of R$ 86 million in 2006, reflecting effects on foreign currency<br />
loans and financings. The appreciation of the Real against the dollar in<br />
2007 was 17,15%, versus appreciation of 8.66% in 2006.<br />
For a breakdown of financial revenues and expenses, see Explanatory Note<br />
31 to the financial statements.<br />
Income tax and Social Contribution<br />
<strong>Cemig</strong>’s expenses on income tax and the Social Contribution in 2007<br />
totaled R$ 622 million, on profit of R$ 2,928 million before tax effects,<br />
a percentage of 21.24%. <strong>Cemig</strong>’s expenses on income tax and the Social<br />
Contribution in 2006 totaled R$ 527 million on profit of R$ 2,463 million<br />
before tax effects, a percentage of 21.40%. These effective rates are<br />
reconciled with the nominal rates in Explanatory Note 12 to the financial<br />
statements.<br />
Employees’ profit shares<br />
In accordance with the 2007 Collective Labor Agreement <strong>Cemig</strong> allocated<br />
profit shares to its employees totaling R$ 455 million (R$ 210 million<br />
in 2006). For further information see Explanatory Notes 2 and 33 to the<br />
Consolidated Financial Statements.<br />
LIQUIDITY AND CASH FLOW<br />
At the end of 2007 <strong>Cemig</strong>’s cash position was R$ 2,066 million (vs. R$<br />
1,402 million in 2006), an increase of R$ 664 million and 47.36% of<br />
growth.<br />
Cash generated by operations in 2007 was R$ 3,213 million, compared<br />
to R$ 2,185 million in 2006. This increase of 47.05% in cash generated<br />
by operations mainly reflects the higher amount received in relation to<br />
regulatory assets and also the greater profit in 2007, adjusted for items that<br />
do not affect cash.<br />
Financing activities represented outflow of cash of R$ 1,359 million,<br />
compared to outflow of R$ 532 million in 2006. This significant change<br />
primarily reflects the lower volume of loans and financings obtained in<br />
2007 (R$ 1,855 million in 2007 vs. R$ 3,466 million in 2006), partially<br />
offset by lower distribution of dividends and Interest on (R$ 1,360 million<br />
in 2007 vs. R$ 2,072 million 2006).
The company’s capital expenditure in 2007 was R$ 1,189 million, which<br />
compares with R$ 1,720 million in 2006, an increase of 32.0%. This result<br />
was principally due to the higher volume of funds invested in distribution<br />
activities, with the launch of the Light for Everyone (Luz Para Todos)<br />
program.<br />
FUND<strong>IN</strong>G AND DEBT MANAGEMENT<br />
<strong>Cemig</strong>’s debt management policy is focused on preserving credit quality.<br />
This concern translates into an express obligation in the bylaws to maintain<br />
certain financial indicators limited to numbers that denote the company’s<br />
financial health.<br />
<strong>Cemig</strong> is a mixed private-sector/public-sector company, with the majority<br />
interest held by the Brazilian State of Minas Gerais, and as such is<br />
subject to rules for containment of public sector borrowing, which limit<br />
its financing alternatives. These limitations apply also to its subsidiaries<br />
which, indirectly, are also state-controlled.<br />
Raising of funds from third parties in 2007 consisted mainly of transactions<br />
in the capital markets in the form of issues of promissory notes and<br />
debentures, supported by firm guarantees of placement of the securities<br />
from financial institutions. These transactions were to pay debt becoming<br />
due and to rebuild cash for the debts paid over the year. The high liquidity<br />
favored contracting of transactions on very favorable conditions.<br />
In 2007 <strong>Cemig</strong> made its second public issue of non-convertible, unsecured<br />
debentures (in a single series): 40,000 debentures with nominal unit value<br />
of 10,000 issued on December 15, 2007, and subscribed and paid in full,<br />
for a total R$ 400mn. These debentures are indexed to the IPCA inflation<br />
index and return annual interest to 7.96% p.a. The principal is to be repaid<br />
in three equal portions in December 2015, 2016 and 2017, and interest is<br />
paid annually.<br />
Banco do Brasil Investimentos S.A. gave a firm guarantee of placement<br />
and subscribed 46% of the issue. We highlight the total tenor of ten<br />
years for maturity, which was considered notable in the current situation:<br />
comparison with the remuneration on public securities of similar tenor and<br />
index (NTN-Bs) indicates that <strong>Cemig</strong> Distribuição S.A. raised funds at a<br />
cost very close to that of a risk-free asset. The combination of tenor and cost<br />
of this issue reflects the financial market and investors’ confidence in the<br />
company’s credit capacity and its potential for growth.<br />
On December 21, 2007 <strong>Cemig</strong> Generation and Transmission issued its 2nd<br />
issue of Promissory Notes in the total amount of R$ 200 million, maturing<br />
in 180 days, for interest at 101.5% of the CDI rate, with no guarantee<br />
from <strong>Cemig</strong>. <strong>Cemig</strong> Distribution also raised a total of R$ 159 million<br />
(excluding funds from the CDE) from Eletrobrás to finance the Light for<br />
Everyone program and the Reluz project.<br />
Other highlights of 2007 are two project financings transactions by<br />
subsidiaries of <strong>Cemig</strong> for specific investment projects in transmission and<br />
generation:<br />
• Transchile Charrúa Transmisión S.A a signed financing contract for 20 years<br />
for approximately US$51 million with the inter-American Development<br />
Bank on July 18, 2007. These funds will be used in construction of the<br />
220 kV, 205-km Charrúa–Nueva Temuco transmission line.<br />
• The Cachoeirão Hydro Plant, a subsidiary of <strong>Cemig</strong> Generation and<br />
Transmission in partnership with Santa Maria Energética S.A., signed a<br />
financing contract for onlending of funds from the National Development<br />
Bank (BNDES) with Banco do Brasil on November 1, 2007 for<br />
R$ 71,3mn with tenor of 11 years.<br />
Use of the banking market to meet financing needs has helped, in recent<br />
years, to increase the share represented by the CDI rate in the profile of<br />
<strong>Cemig</strong>’s debt. With the issuance by <strong>Cemig</strong> Distribution of debentures<br />
indexed to ICPA inflation at the end of 2007, refinancing promissory notes<br />
indexed to the CDI, the resulting breakdown of <strong>Cemig</strong>’s debt by indexor<br />
is now as follows:<br />
13<br />
Distr<br />
36%<br />
GT<br />
41%<br />
Breakdown of debt by indexor at december 2007<br />
CDI/Selic<br />
71%<br />
Dollar<br />
5%<br />
Breakdown by Company<br />
Holding<br />
14%<br />
Others<br />
1%<br />
Yen<br />
1% RGR/Finel Urtj IGP-M index<br />
5% 3% 9%<br />
Others<br />
1%<br />
Light<br />
6%<br />
Ipca index<br />
5%<br />
TBE<br />
2%<br />
As shown in the next chart, the debt amortization timetable now has a<br />
satisfactory profile, with average tenor of five years, meeting the company’s<br />
policy directive of avoiding concentration of debt coming due in the short<br />
term, mitigating the risk of refinancing and eliminating any pressure on<br />
cash flow that could reduce availability of funds for investment.<br />
1200<br />
Debt Amortization Timetable – Consolidated<br />
December 2007, R$ million<br />
1,167<br />
1,020<br />
1000<br />
800<br />
928<br />
739<br />
1,037<br />
837<br />
945<br />
600<br />
588<br />
400<br />
200<br />
0<br />
378<br />
2008 2009 2010 2011 2012 2013 2014 2015 2016 to<br />
2031<br />
Another of the company’s directive guidelines, reduction of the average<br />
cost of debt, has been complied with: at the end of the year the average<br />
cost of debt was 7.94% p.a., at constant prices, also reflecting the federal<br />
government’s policy of reduction of interest rates.<br />
12.09 11.67<br />
Average cost of the<br />
Consolidate Debt %<br />
9.15<br />
9.47<br />
8.56<br />
7.85<br />
7.94<br />
dec/04 dec/05 dec/06 mar/07 jun/07 sep/07 dec/07
Our position of 6% of debt in foreign currency does not represent a material<br />
financial risk for the company, since a good part of it is contractually<br />
protected by indexor swap transactions. There is also a natural protection<br />
provided by energy sale contracts indexed to the US dollar.<br />
In March 2007 Moody’s Investors Service gave <strong>Cemig</strong> corporate rating<br />
of Ba2 on the global scale, and Aa3.br on the Brazilian national scale,<br />
an increase of five levels. This reflects Moody’s view of improvement<br />
in the company’s corporate governance and in its credit indicators on a<br />
consolidated basis, reflecting <strong>Cemig</strong>’s strong cash flow, which Moody’s<br />
believes to be sustainable in the short term, and also its improved profile<br />
and robust liquidity position.<br />
Hedging policy<br />
Our policy on hedging is primarily to give predictability to the cash<br />
flow and to the budget, over a moving horizon of 12 months, through<br />
transactions that reduce exposure and minimize negative impacts resulting<br />
from relative price variations.<br />
The derivative instruments contracted by the company have the purpose<br />
of protecting operations against the risks arising from foreign exchange<br />
variation and are not used for speculative purposes. Transactions entered<br />
into take into account market liquidity, relative price of assets and<br />
concentration of debt servicing.<br />
The Company has given priority to coverage of its FX liabilities through<br />
a natural hedge: contracting of electricity sales for prices indexed to the<br />
exchange rate, with some of its major consumers.<br />
CORPORATE GOVERNANCE<br />
Our corporate governance model is based on principles of transparency,<br />
equity and reporting, focusing on clear definition of roles and responsibilities<br />
in the Board of Directors and the Executive Board for formulation, approval<br />
and execution of policies in guidelines in conduct, approving and executing<br />
policies and guidelines for managing the company’s business.<br />
We seek sustainable development of the company through equilibrium<br />
between the economic, financial, environmental and social aspects of our<br />
undertakings, aiming to improve the relationship with our stockholders,<br />
clients, and employees, the public at large and other stakeholders.<br />
<strong>Cemig</strong>’s preferred and common shares have been listed under Corporate<br />
Governance Level 1 on the São Paulo stock exchange since 2001. This<br />
represents a guarantee of the best possible reporting of information, and<br />
also that stockholdings are as widely dispersed as possible. Since <strong>Cemig</strong><br />
has ADRs (American Depository Receipts) listed on the New York Stock<br />
Exchange, representing PN (preferred) and ON (common) shares, we are also<br />
subject to the regulations of the US Securities and Exchange Commission<br />
(SEC) and to the New York Stock Exchange Listed Companies Manual.<br />
Our material procedures related to preparation of the Consolidated<br />
Financial Statements have been compliant since the end of 2006with the<br />
requirements of Section 404 of the Sarbanes-Oxley law of the US.<br />
Our Board of Directors has 14 members, appointed by the stockholders. All<br />
have a period of office of 3 (three) years, and may be reelected. To increase<br />
their efficiency, the Board has constituted 5 (five) committees that operate<br />
in specific issues related to Strategy, Governance, Finance, Audit and Risks,<br />
and Human Resources. In 2007, 25 meetings were held to decide on various<br />
subjects from strategic planning to investment projects.<br />
The Audit Board is permanent and made up of 5 (five) members, appointed<br />
by stockholders. All the members meet the requirements for independence<br />
in accordance with international practices. As presently constituted the<br />
Audit Board meets the requirements for exemption from constitution of an<br />
audit committee under the Securities Act and the Sarbanes-Oxley Law. The<br />
Audit Board met twelve times in 2007.<br />
Also, the structure of committees made up of executives of various areas<br />
ensures that strategic decisions are taken based on support by technical<br />
criteria.<br />
14<br />
Every year we hold our meeting with capital market analysts and investors<br />
to disclose information about the economic and financial situation, plans<br />
and outlook as well as carrying out various meetings with regional analysts’<br />
associations.<br />
Our bylaws include targets of the Strategic Plan, and the dividend policy:<br />
• to keep consolidated indebtedness equal to or less than 2 times Ebitda<br />
(Earnings before interest, taxes, depreciation and amortization);<br />
• consolidated (Net debt) / (Net debt + Stockholders’ equity) limited to 40%;<br />
• consolidated funds in Current assets limited to 5% of Ebitda;<br />
• consolidated funds destined to capital expenditure in each business year<br />
limited to 40% of Ebitda (this varies, exceptionally to 65% in 2006 and<br />
55% in 2007);<br />
• to invest only in distribution, generation and transmission projects<br />
which offer real minimum internal rates of return equal to or more than<br />
those specified in the company’s Long-Term Strategic Plan, subject to<br />
the legal obligations; and<br />
• to limit the expenses of the subsidiary <strong>Cemig</strong> Distribuição S.A., and of<br />
any subsidiary which operates in distribution of electricity, to amounts not<br />
greater than the amounts recognized in the tariff adjustments and reviews.<br />
The Board of Directors may authorize numbers in excess of these standards,<br />
in response to temporary needs, up to the following limits: consolidated<br />
debt: maximum 2.5 times Ebitda;<br />
consolidated (Net debt) / (Net debt + Stockholders’ equity): maximum 50%;<br />
consolidated funds in Current assets: maximum 10% of Ebitda;<br />
Stockholders’ agreement<br />
The stockholders’ agreement signed between the government of Minas<br />
Gerais and Southern Electric Brasil Ltda. (SEB) in 1997 has been annulled<br />
by the courts. Appeals filed by SEB are before the federal courts.<br />
CAPITAL MARKETS<br />
<strong>Cemig</strong>’s shares were listed for the first time, on the stock exchange of the<br />
State of Minas Gerais, on October 14, 1960. On January 14, 1972 our<br />
common (ON) and preferred (PN) shares were listed on the São Paulo stock<br />
exchange (Bovespa), and currently trade under the tickers CMIG3 (ON)<br />
and CMIG4 (PN). Since October 2001, we have been part of the Level 1<br />
Corporate Governance listing of the Bovespa. Our shares have been traded<br />
on the New York Stock Exchange since 1993, where we have Level 1 ADRs<br />
(ticker: CIG) representing our preferred shares, which were transferred<br />
into Level 2 in 2001. Subsequently, in June 2007, we launched ADR’s on<br />
the NYSE representing our common shares (ticker: CIG.C). Our preferred<br />
shares have been listed on the Latibex of the Madrid Stock Exchange since<br />
2002 (ticker: XCMIG).<br />
Stockholding structure<br />
On December 31, 2007 the Company’s registered capital was R$ 2,432<br />
million, as shown in the following chart:<br />
Total number of shares<br />
486,461 mil<br />
Common shares<br />
212,622 mil<br />
State of Minas Gerais<br />
50.97%<br />
Southern Electric Brasil<br />
32.96%<br />
Brazilian Investors<br />
9.19%<br />
Non-Brazilian Investors<br />
6.82%<br />
Preferred shares<br />
273,838 mil<br />
Non-Brazilian Investors<br />
68.00%<br />
Brazilian Investors<br />
29.89%<br />
State of Minas Gerais<br />
1.99%<br />
Held in Treasury<br />
0.08%
At Ordinary and Extraordinary General Stockholders’ Meetings held on<br />
April 26, 2007, <strong>Cemig</strong> decided a capital increase in the registered capital<br />
of R$ 810,769 thousand, or 50%, using funds from the Profit reserve. This<br />
resulted in a bonus of 500 new shares, of the same type, with nominal value<br />
of R$ 0.01, for each group of thousand shares. The bonus shares were then<br />
grouped in a reverse split at 500 shares with nominal value of R$ 0.01 to<br />
1 share with the nominal value of R$ 5.00. The diagram above reflects<br />
these changes.<br />
Share prices<br />
The following were the closing prices of our shares on the stock exchanges<br />
of São Paulo (Bovespa), New York (NYSE) and Madrid (Latibex) at the end<br />
of 2006 and 2007:<br />
Name Ticker<br />
Currency/<br />
unit<br />
Close of<br />
2006<br />
Close of<br />
2007<br />
<strong>Cemig</strong> PN CMIG4 R$ 32.70 32.50<br />
<strong>Cemig</strong> ON CMIG3 R$ 28.36 33.79<br />
ADRs for PN CIG US$ 15.14 18.46<br />
ADRs for ON CIG.C US$ – 18.50<br />
<strong>Cemig</strong> PN on<br />
(Latibex)<br />
XCMIG Euro 12.46 12.75<br />
A total of R$ 13,866 million in our preferred shares was traded in 2007<br />
with daily average of R$ 56.6 millions in 2007 and R$ 39.3 millions in<br />
2006. This places CMIG4 as the sixteenth largest-volume share, and the<br />
share with largest volume in the electricity sector, on the São Paulo stock<br />
exchange.<br />
Market capitalization<br />
Our market capitalization was relatively unchanged from 2006 to 2007,<br />
with a small change of 0.3%. Over the last five years it has increased by<br />
116.1%:<br />
7,441<br />
Market Capitalization – R$ billion<br />
9,951<br />
14,335<br />
16,040<br />
2003 2004 2005 2006 2007<br />
16,078<br />
These charts show the changes in our share prices over recent years,<br />
comparing with other indicators.<br />
2500%<br />
2000%<br />
1500%<br />
1000%<br />
500%<br />
0%<br />
CEMIG PN X CEMIG ON X IBOVESPA<br />
Ajustados p/ US$<br />
% CEMIG PN IBOVESPA CEMIG ON<br />
feb/03<br />
apr/03<br />
jun/03<br />
aug/03<br />
oct/03<br />
dec/03<br />
feb/04<br />
apr/04<br />
jun/04<br />
aug/04<br />
oct/04<br />
dec/04<br />
feb/05<br />
apr/05<br />
jun/05<br />
aug/05<br />
oct/05<br />
dec/05<br />
feb/06<br />
apr/06<br />
jun/06<br />
aug/06<br />
oct/06<br />
dec/06<br />
feb/07<br />
apr/07<br />
jun/07<br />
aug/07<br />
oct/07<br />
dec/07<br />
15<br />
DOW JONES<br />
%<br />
320%<br />
270%<br />
220%<br />
170%<br />
120%<br />
70%<br />
Dividend yield and return to stockholders<br />
The total return to stockholders, defined as the increase in share price plus<br />
dividend distributed, over the last 5 years, has been as follows:<br />
7.46%<br />
CEMIG ADR X DOWN JONES<br />
8.09%<br />
CEMIG ADR ON<br />
sep/04<br />
nov/04<br />
jan/05<br />
mar/05<br />
may/05<br />
jul/05<br />
sep/05<br />
nov/05<br />
jan/06<br />
mar/06<br />
may/06<br />
jul/06<br />
sep/06<br />
nov/06<br />
jan/07<br />
mar/07<br />
may/07<br />
jul/07<br />
sep/07<br />
nov/07<br />
Dividend Yield % (*)<br />
19.68%<br />
8.98%<br />
Investor relations<br />
In accordance with best corporate governance practices, we seek to<br />
disseminate a policy of transparency with the capital markets, so as to add<br />
value to the investments of our stockholders.<br />
In 2007, <strong>Cemig</strong> was present, worldwide, at 84 seminars, conferences and<br />
investor meetings; 10 congresses; 11 roadshows; and video conference<br />
calls with capital markets analysts and investors. In our national and<br />
international events, we held more than 490 one-on-one meetings.<br />
We also highlight our 12th Annual <strong>Cemig</strong> Meeting with the Association<br />
of Capital Markets Analysts and Investment Professionals (Apimec) in the<br />
city of Tiradentes, in Minas Gerais, which included a technical visit to<br />
the Itutinga Hydroelectric Plant, on the border between the counties of<br />
Itutinga and in Minas Gerais.<br />
DIVIDEND POLICY<br />
5.41%<br />
2003 2004 2005 2006 2007<br />
CEMIG ADR PN<br />
<strong>Cemig</strong>, through its bylaws, assumes the undertaking to distribute a<br />
minimum dividend of 50% of the net profit for each year. Additionally,<br />
extraordinary dividends are distributed each two years, or more frequently,<br />
if cash availability permits.<br />
The dividends are then paid in two equal installments, by June 30 and<br />
December 30 of the year subsequent to the year they refer to. Dividends<br />
paid in 2007 totaled R$868 million. Dividends paid in 2006 totaled<br />
R$ 1,382 million, of which R$ 497 million was an extraordinary<br />
dividend.
PROFIT ALLOCATION PROPOSAL<br />
The Board of Directors will propose to the Annual General Meeting, to be<br />
held on April 28, that the net profit of R$ 1.735 billion for 2007 should<br />
be allocated as follows:<br />
• R$ 868 million (50% of net profit) for payment ;<br />
• R$ 87 million for constitution of the Legal Reserve; and<br />
• R$ 780 million: held in Stockholders’ equity in the Profit reserve.<br />
RELATIONSHIP WITH EXTERNAL AUDITORS<br />
We change external auditors every five years, in accordance with rules of<br />
the CVM (Brazilian Securities Commission). Up to first quarter 2007 our<br />
accounts were audited by Deloitte Touche Tohmatsu, when we changed to<br />
KPMG Auditores Independentes.<br />
The services provided by independent auditors to <strong>Cemig</strong> and the majority<br />
of its subsidiaries were as follows:<br />
Service<br />
Annual Dividends (MM Reais)<br />
1,173<br />
692<br />
885 868<br />
320<br />
2003 2004 2005 2006 2007<br />
2.46<br />
2007<br />
R$ ’000<br />
897<br />
Ordinary Extraordinary<br />
%<br />
vs. audit<br />
2006<br />
R$ ’000<br />
%<br />
vs. audit<br />
Auditors<br />
Deloitte 32 4.69 502 100.00<br />
KPMG 650 95.31 - -<br />
Total, auditing<br />
services<br />
Other services:<br />
Compliance with<br />
SOX requirements<br />
– Sections 302 and<br />
404<br />
682 100.00 502 100.00<br />
Deloitte – - 2,080 314.34<br />
KPMG 290 42.52<br />
Overall total 940 142.52 2,582 414.34<br />
497<br />
Earnings per share - R$/share<br />
2.84<br />
4.12<br />
3.53<br />
3.57<br />
2003 2004 2005 2006 2007<br />
16<br />
The additional services shown were approved by the Board of Directors<br />
since in the view of management they do not result in loss of independence<br />
by the external Auditors and are not included in the items prevented<br />
by Article 23 of the Sarbanes-Oxley Law or CVM Instruction 308 of<br />
May 14, 1999.<br />
RISK MANAGEMENT<br />
<strong>Cemig</strong>’s principal assumption for management of corporate risks is that<br />
every company exists to provide value to its stockholders. This results in<br />
the permanent challenge of determining how much the corporation will be<br />
prepared to guarantee its sustainable development, taking into account the<br />
risks and opportunities involved<br />
<strong>Cemig</strong>’s principal objective is not to eliminate risks, but to be proactive<br />
in their identification, analysis, assessment, treatment and continuous<br />
monitoring, with a view to obtaining competitive advantages. Success in<br />
corporate management depends on a culture of management of risks being<br />
disseminated, serving as a basis for sustaining of the following 3 ‘pillars’:<br />
• Management processes: Awareness of the processes of the company with a<br />
view to improvement in operational efficiency.<br />
• Management of more severe risks: Identification of the imminent risks that<br />
require short-term decisions with a view to reduction of volatility in<br />
results, higher predictability of returns to the stockholders and decision<br />
on treatment of risks.<br />
• Management of risks and measurement of cost of capital: Optimal allocation<br />
of capital, sensitivity analysis, use of comprehensible modeling systems<br />
with well-grounded assumptions.<br />
Thus corporate risk management is a management tool that is part of our<br />
corporate governance practices. To be more efficacious, and so as to be<br />
included more easily in the organization’s culture, we aim to align it with<br />
<strong>Cemig</strong>’s Strategic Planning Process, which defines the strategic objectives<br />
of the company’s business.<br />
Other instances of management involved with corporate risk management<br />
are: The Corporate Governance Committee, Compliance with the Sarbanes<br />
Oxley Law, the Budget Prioritization Committee, Internal Auditing, the<br />
Energy Risks Management Committee, the Insurable Risks Committee, the<br />
Control and Management Committee, and other functions and processes.<br />
<strong>Cemig</strong>’s corporate risks management structure was put in place in 2003.<br />
The risks matrix was revised for the first time in 2004, and a second time in<br />
2005-6, aiming to identify changes in relation to the level of performance<br />
expected for each process. The result has been improvement in the<br />
effectiveness of controls, commitment to implementation of the proposed<br />
mitigating action plans and, consequently, reduction of the impact and the<br />
probability of occurrence of innumerable risks.<br />
The corporate risk management activities gives rise to various products<br />
which are of great value in the decision process, as follows:<br />
1- The corporate risk matrix: This presents all the corporate risks mapped<br />
and classified as follows: a) Financial Exposure – product of the impact<br />
on the business and the probability of occurrence of the risk; and b) Final<br />
Exposure, result of the association of the Financial Exposure of the risk<br />
weighted by the analysis of its intangible impact.<br />
2 – Matrix of risk factors from the stakeholders’ point of view: This is an analysis<br />
of the risk factors – circumstances or events which may (or may not) give<br />
rise to risks for the corporation – taking into account the factors that<br />
influence value from the point of view of these agents. The objective is to<br />
make possible an improvement in management based on what interested<br />
parties see as a strategic threat and the identification of risks that have so<br />
far not been mapped in the corporate risk matrix.
This process was developed during 2007. In the first stage, the risk<br />
factors were identified from the point of view of each stakeholder. In the<br />
second stage, we thought to identify whether the corresponding risks had<br />
been mapped in the corporate risk matrix, which signaled to us that the<br />
company was on the right path in relation to a wide-ranging perception of<br />
risk management, in view of the fact that more than 90% of the risks were<br />
already mapped. Since this is an improvement tool, the risks identified that<br />
had not been mapped in the corporate risk matrix are now being analyzed<br />
and included.<br />
The charts below show the risks with high, medium and low final<br />
exposure in the companies <strong>Cemig</strong> Distribution (D), <strong>Cemig</strong> Generation and<br />
Transmission (GT) and the <strong>Cemig</strong> Holding Company (H), and the risks<br />
by category.<br />
Business Unit<br />
H<br />
D<br />
Operational<br />
70%<br />
0%<br />
25.74<br />
Corporate Risks Quantity per Business Unit<br />
48.28<br />
20%<br />
41.09 33.17<br />
40% 60% 80% 100%<br />
Share per Final Exposure Level<br />
Environment<br />
4%<br />
34.48 17.24<br />
GT<br />
15.32 29.84 54.84<br />
High Final Exposure Medium Final Exposure Low Final Exposure<br />
Compliance<br />
6%<br />
HR<br />
7%<br />
IT<br />
3%<br />
Strategic<br />
7%<br />
Financial<br />
3%<br />
In <strong>Cemig</strong> Distribution the high percentage of risks with high Final Exposure<br />
represents the fact that the risks of sales revenue and collection, and market<br />
risks, including the risks of trading of electricity in the wholesale and retail<br />
markets, are mapped as being in this company.<br />
In <strong>Cemig</strong> Generation and Transmission the highlight is on risks of operation<br />
and maintenance of the hydroelectric plants, operation and maintenance of<br />
the electricity system and expansion of the generation and transmission<br />
facilities.<br />
In the holding company the composition of the risks with high Final<br />
Exposure is diversified, since in this company they are located in all the<br />
process of support to the business areas of the company, including IT, HR,<br />
logistics, transport, material and services and finances.<br />
It can be seen that the participation of high Final Exposure risks in the<br />
distribution business is higher than in the generation and transmission<br />
business. However, the financial exposure of the significant risk of the<br />
Generation and Transmission business is greater than in the Distribution<br />
business (highly regulated), which reflects the fact that the requirement<br />
for minimum return demanded from projects in the electrical system is<br />
greater.<br />
Certification of internal controls<br />
<strong>Cemig</strong> obtained certification of its internal controls for mitigation of risks<br />
involved in the preparation and disclosure of the financial statements,<br />
in accordance with an opinion by the external auditors, Deloitte Touche<br />
Tohmatsu Auditores Independentes, issued in accordance with Section 4 of<br />
the Sarbanes-Oxley Law and the rules of the Public Company Accounting<br />
17<br />
Oversight Board (PCAOB), which is a part of the annual 20-F report<br />
relating to the business year ending December 31, 2006, filed with the US<br />
Securities and Exchange Commission (SEC).<br />
Since the activities related to the Certification of Internal Controls are<br />
permanent and need to be constantly monitored, <strong>Cemig</strong>’s management,<br />
in compliance with the new orientation with the SEC and based on the<br />
PCAOB criteria, of the Committee of Sponsoring Organizations of the Treadway<br />
Commission (Coso) and Control Objectives for Information and Related Technology<br />
(Cobit), based on review of the existing controls structure, documented<br />
the controls in the terms of the processes of the business and of the entity,<br />
including the controls that are supported by information technology.<br />
It was established between the potentially significant controls and<br />
accounting records in the financial statements for 2007, and the design of<br />
the key processes in controls for ensuring mitigation of the risks associated<br />
with the preparation and disclosure of the financial statements for the year<br />
ended December 31, 2007 was validated with our new external auditors,<br />
KPMG Auditores Independentes.<br />
The Ethics Committee and the Reporting Channel<br />
The Ethics Committee was created on August 12, 2004, and is responsible<br />
for assessment of and decision on possible non-compliances, and also for<br />
assessing the need for reviews of the Statement of Ethical Principles and<br />
Code of Professional conduct. This is one more element of alignment with<br />
best Corporate Governance practices, and is also an instrument that meets<br />
the orientation of the Sarbanes-Oxley Law of the US (SOX).<br />
After the creation of the Reporting Channel, in December 2006, the Ethics<br />
Committee began to receive anonymous accusations of irregular practices<br />
contrary to the company’s interest, such as: 1) financial frauds, including<br />
adulteration, falsification or suppression of financial, tax or accounting<br />
documents; 2) improper appropriation of assets or funds; 3) receipt of undue<br />
advantages by managers and employees; and 4) irregular contracting, via<br />
the anonymous accusation channel created on <strong>Cemig</strong>’s intranet.<br />
Accusations of an ethical nature are accepted only where there is<br />
identification of the accuser, and are processed by the committee itself.<br />
Accusations which qualify under items 1 to 4 above are submitted to the<br />
Chairman of the Audit Board for measures to be taken.<br />
Telecoms and IT<br />
Up to date with IT Security<br />
TECHNOLOGY<br />
In 2007 the “Up to Date with IT Security” project was held, with 941<br />
people participating, to disseminate the classification and treatment of<br />
<strong>Cemig</strong>’s information, improve the level of the company’s security, and to<br />
ensure certification in the SOX 2008 Audit.<br />
We also highlight the “Fun with Security” project, which aimed to raise<br />
the awareness of the children of <strong>Cemig</strong> employees on the importance of the<br />
adoption of information security measures in home use of the computer,<br />
and in dealing with the family and professional data of parents.<br />
Classification of Information<br />
This project aims to establish criteria for classification and treatment of<br />
information of interest to <strong>Cemig</strong>, aiming to protect it from undue access<br />
and/or alteration, prohibitive disclosure and unavailability, taking into<br />
account the estimate of the losses that can be caused to the company’s<br />
business or image by unauthorized access, modification, exclusion and/or<br />
disclosure, lack of control and registry or non-availability of information.<br />
The benefits resulting from this include compliance with the legal<br />
requirements; protection of <strong>Cemig</strong>’s business; the giving of proper value to<br />
information; compliance with the requirements of SOX; and dissemination<br />
of the degrees of secrecy and forms of treatment of the company’s information<br />
to employees, contractors and interns.
Digital certification<br />
Studies were carried out for feasibility of a project to identify opportunities<br />
for use of digital certification and information cryptography within the<br />
needs of the processes of the company’s business, thus defining the technical<br />
standards to be used and a plan for projects for their implementation.<br />
The main benefits of this type of project are knowledge of opportunities for<br />
use of the technology within the company; identification of an opportunity<br />
to reduce cost and speed up some processes; definition of technical<br />
standards (offering of a structured surface) and security in the storage and<br />
transmission of critical information.<br />
Client Management System<br />
In April 2006 a project was begun to implement the new Client<br />
Management System (the “evolution’ project). This project aims to replace<br />
some of the company’s principal systems involved in the processing of<br />
billing, collection, service, accounting, field services, management of<br />
measuring equipment, and issuance and printing of electricity tax invoices<br />
and reports. It has a team of 240 professionals including <strong>Cemig</strong> employees<br />
and external consultants.<br />
The aims of this program include greater control and security in the<br />
processes of billing and collection, with precise and integrated information<br />
to support the control and management of clients.<br />
This project is scheduled to be concluded in the first half of 2008, with<br />
investment of R$ 178 million.<br />
Technology and alternative energy sources.<br />
<strong>Cemig</strong> has always considered technology to be a basic and strategic input,<br />
and a factor adding value, through making business possible or optimization<br />
of internal processes in the search for best technological practices.<br />
In management of alternative energy sources, <strong>Cemig</strong> has invested in projects<br />
to use renewable energy sources, led by biomass, the Small Hydro Plants,<br />
solar energy, and wind generation. It has also invested in projects for rational<br />
use of energy, co-generation and “distributed generation” (geographically<br />
distributed at input points throughout the grid area), using various fuels<br />
such as hydrogen, natural gas, alcohol and bio diesel.<br />
<strong>Cemig</strong> is always ahead in identification, development and application of new<br />
technologies for the electricity sector and use of alternative sources, ensuring<br />
it an outstanding position among electricity companies and reaffirming its<br />
commitment to its consumers and to sustainable development.<br />
Strategic Management of Technology and Innovation.<br />
To remain always in the vanguard of use, adaptation and development of the<br />
more advanced technologies appropriate to its production processes, <strong>Cemig</strong><br />
uses the methodology of strategic technology management involving<br />
the development of partnerships with universities and research entities,<br />
prospecting technology and analysis of the development of technological<br />
scenarios, by setting up strategies, guidelines and actions of a technological<br />
nature for business operation, in co-ordination with the strategic technology<br />
management committee (CoGET).<br />
The importance of technology as one of the pillars sustaining business<br />
strategy, the high volume of funds allocated annually to technological<br />
research and development, and the need for constant improvement of<br />
results arising from these initiatives led to the creation, in 2006, of the<br />
Strategic Technology Management Centre – CGET, a non-profit association<br />
with administrative and financial autonomy, and the signing in 2007 of<br />
working agreements for technical and scientific co-operation to support the<br />
development of R&D projects of <strong>Cemig</strong> companies.<br />
Being aware of the important role played by development of the market in<br />
which it operates and the importance of partnerships and exchange projects,<br />
<strong>Cemig</strong> has sought to increase actions involving universities, research centers<br />
and companies interested in promoting and participating in development<br />
and consolidation of technological excellence in Minas Gerais.<br />
Six technological partnerships – technical-scientific co-operation working<br />
agreements – were set up in 2007, among which we highlight the creation<br />
18<br />
of the Business Management Excellence Centre in partnership with the<br />
Dom Cabral Foundation (FDC). Twelve other working agreements are in<br />
preparation, including a Letter of Intent for creation of the Agroenergy<br />
Excellence Centre, in partnership between <strong>Cemig</strong> and the Minas Gerais<br />
Farming Research Company (Epamig) and several universities in the Minas<br />
“Triangle” area, as well as a working agreement to create the Construction<br />
Materials Excellence Centre, in partnership with Minas Gerais Federal<br />
University (UFMG).<br />
R&D Programs<br />
<strong>Cemig</strong> has always stood out as a company dedicated to research and<br />
technological development, and has chosen, with this in mind, the<br />
priorities in selecting the projects that make up the Annual Technological<br />
Research and Development programs which are submitted for approval by<br />
the National Electricity Agency (Aneel).<br />
62 new and ongoing R&D projects were in process in 2007. Among the<br />
82 projects already concluded, the great majority have resulted in products<br />
being incorporated into the company’s daily routine: several methods in<br />
engineering, software, devices and equipment were developed and applied,<br />
helping to reduce operational costs, increase the reliability in security of<br />
<strong>Cemig</strong>’s systems and facilities, environmental control and development of<br />
alternative energy sources.<br />
In 2007 <strong>Cemig</strong> had expenses of R$ 27 million on R&D, R$ 26 million with<br />
the National Scientific and Technological Development Fund (FNDCT)<br />
and R$ 22 million with the Energy Research Company (EPE).<br />
Biomass<br />
With the development of more efficient transformation technologies,<br />
lower levels of emissions of toxic gasses and greenhouse gasses, biomass has<br />
become a very promising energy alternative for the generation of electricity<br />
in some regions of the State.<br />
<strong>Cemig</strong> has sought to develop the use of biomass in circumstances varying<br />
from the Formoso Plant in the north of Minas Gerais, co-generation in<br />
the sugar/alcohol, paper and pulp and steel industries, to the present<br />
experiments on planting of energy forests, gasification of biomass,<br />
generators running on alcohol, and bio-diesel.<br />
An example of this effort is the co-generation project using gas from the<br />
charcoal-burning blast furnace in the 13 MW thermal plant belonging to<br />
the steel maker Vallourec Mannesmann. <strong>Cemig</strong> is working continuously<br />
to make biomass energy generation projects viable, being aware that this<br />
is an environmentally correct alternative, and one that is important for<br />
meeting the growing energy demand, with positive impacts for generation<br />
of employment and revenue in a decentralized manner.<br />
Solar energy<br />
<strong>Cemig</strong>’s pioneer work in solar energy, both in its photovoltaic and in its solar<br />
thermal versions, through use of flat collectors and solar concentrators, has<br />
helped to create new alternatives for the supply of energy and improvement<br />
of efficiency for some consumers in Minas Gerais State.<br />
The installation of flat solar collectors and heat pumps for heating of water<br />
has also been fostered by <strong>Cemig</strong>, which sees these options as tools to reduce<br />
electricity consumption at peak times and also as an alternative source for<br />
lower-income housing projects.<br />
In 2007 <strong>Cemig</strong> installed photovoltaic energy in 760 homes to comply with<br />
the Light for Everyone Program, and also 1,000 flat solar collectors for heating<br />
of water to replace electric showers in low-income homes and hospitals.<br />
<strong>Cemig</strong> continues to invest in R&D projects to purify the metallurgical<br />
silicon found in Minas Gerais, and development of low cost photovoltaic<br />
cells. Another of the company’s initiatives is research and experimentation<br />
in the use of thermal solar energy to produce electricity through solar<br />
thermal plants, using cylindrical-parabolic concentrators, and to heat water<br />
in a centralized manner, using flat solar collectors (District heating for lowincome<br />
communities).
Wind energy<br />
<strong>Cemig</strong> was the first Brazilian electricity concession holder to install a wind<br />
plant connected to the grid, the Experimental Wind Plant at Morro do<br />
Camelinho, paving the way for introduction of a wind power culture in<br />
the country. A survey was made of the wind potential of some promising<br />
sites in Minas Gerais, and in 2007, confidentiality agreements were signed<br />
with companies interested in assessing the installation of a wind farm in<br />
the north of the State. A research and development project for small wind<br />
generators was also begun.<br />
Hydrogen and fuel cell energy<br />
Hydrogen is a source of energy obtained from water, and from other<br />
energy sources such as biomass and fossil fuels, and is considered an energy<br />
source of the future. To explore this alternative <strong>Cemig</strong> has an experimental<br />
laboratory for production of hydrogen via electrolysis and from conversion<br />
of ethanol. The main challenges for making this energy source viable are<br />
reduction of production costs, storage and transport of this fuel. Hydrogen<br />
will be initially used as a fuel for tests in fuel cells, to supply internal<br />
demand and also as a chemical element for purification of silicon, to be used<br />
in the photovoltaic cell R&D project, which is in progress. Fuel cells are<br />
one of the new technologies for the generation of energy in a decentralized<br />
manner, with a strong potential for an impact on the electricity sector in<br />
the future.<br />
Bio-diesel<br />
<strong>Cemig</strong> sees bio-diesel as a sustainable energy alternative, a generator of<br />
employment and income, and a tool for social empowerment. It has been<br />
working, with other bodies of Minas Gerais State and research centers,<br />
for consolidation of the bio-diesel production technology in Minas<br />
Gerais, through identification of regional vocations for oil seed cultures,<br />
construction of a small pilot plant for experimental production of this fuel,<br />
and also putting in place of laboratory infrastructure in a research body of<br />
the state to qualify and certify this fuel, and thus contribute to its insertion<br />
into the Brazilian market.<br />
The Biofuel Laboratory of CETEC was inaugurated in 2007, with<br />
capacity to produce 1,000 liters/day of bio-diesel. Use of the bio-diesel<br />
produced in the laboratory for electricity generation is expected to<br />
begin in 2008, on an experimental basis, in a motor-generator group<br />
and a micro-turbine<br />
The electric vehicle<br />
This can be considered as trend for the coming years. In partnership with<br />
Itaipu Binacional and Fiat Automóveis, <strong>Cemig</strong> has begun a project for<br />
research and technical and economic feasibility study of the use of vehicles<br />
running on electricity. It intends to test prototypes of these vehicles in<br />
its fleet in 2008, to assess operational and maintenance targets, and the<br />
development of a Brazilian technology. With the intensive use of this<br />
technology, the intention is to make available one more alternative for<br />
<strong>Cemig</strong> companies for reducing the use of fossil fuels, and operation of a<br />
new electricity niche market.<br />
SOCIAL RESPONSIBILITY<br />
The conception of social responsibility on the part of companies is<br />
increasingly disseminated, associated with the notion of sustainability,<br />
aiming to reconcile the economic, environmental and social dimensions of<br />
business activity. <strong>Cemig</strong> seeks to operate within a vision of the future in its<br />
management related to these various dimensions.<br />
Integrated social action<br />
Our social responsibility strategy is publicly known and recognized through<br />
our Mission, Vision and Corporate Values. Our Corporate Guidelines are<br />
monitored by the Social Responsibility Committee, with representatives in<br />
all the Directors’ Departments of the company.<br />
19<br />
Our company has many projects aiming to improve living conditions<br />
for children, adolescents, adults and old people, and assistance to needy<br />
populations. One example is the <strong>Cemig</strong> Integrated Social Action (Asin)<br />
programs, with more than 1,100 employees registered as volunteers, helping<br />
to generate funds which are directed to sustainability of institutions,<br />
community associations, schools and old people’s homes.<br />
There are 83 of these projects throughout the state, involving 10% of<br />
the company’s employees, and focusing on community action, education,<br />
environment and health, also receiving the support of external and<br />
international partners. Also involved are individual activities such as<br />
Children’s Day, Volunteers Day, Christmas and other initiatives which<br />
involve not only the institutions that are registered with, and the volunteers<br />
of <strong>Cemig</strong>’s Asin organization, but outsourced employees and partners from<br />
the municipalities. <strong>Cemig</strong>’s Asin Project can be seen on the site: http://<br />
www.cemig.com.br/institucional/balanco_social.asp.<br />
Another concrete example of social action supported by the company is the<br />
AI6% (Creating Citizens) program, a partnership between AIC (the <strong>Cemig</strong><br />
Inter-Management Association) and the <strong>Cemig</strong> Asin project, in place since<br />
2001. The program aims to encourage employees and retirees of <strong>Cemig</strong> to<br />
re-allocate part of their payable income tax to the Infancy and Adolescents<br />
Funds (FIAs).<br />
As evidence of how the <strong>Cemig</strong> Asin Project has developed, in 2001 we<br />
succeeded in allocating R$ 190,000 to 31 institutions in 16 municipalities,<br />
while in 2007 the program raised donations from <strong>Cemig</strong> employees<br />
totaling R$ 1,243,000, making it possible to help 137 institutions from<br />
80 municipalities in Minas Gerais state.<br />
Another recognition of <strong>Cemig</strong>’s social responsibility actions was its<br />
inclusion, since 2005, in the work group for the creation of the ISO 26,000<br />
– Social Responsibility – Standard, on invitation by the ISO (International<br />
Organization for Standardization), the Ethos Institute and the Brazilian<br />
Technical Standards Association (ABNT). This is the first time that<br />
worldwide coordination of an ISO project has been led jointly by two<br />
countries, in this case Brazil and Sweden – which makes our participation<br />
even more significant.<br />
<strong>Cemig</strong>’s active participation and interaction in a high-level forum of<br />
discussion, influencing the international process of construction of the<br />
Standard through project activities is one more evidence of its pioneer<br />
nature.<br />
Value added<br />
The Value Added Statement shows <strong>Cemig</strong>’s importance for society in<br />
general, with the creation of R$ 11,470 million in added value in 2007,<br />
compared to R$ 10,401 million in 2006 – an increase of 10.28%.<br />
Value added, 2003 – 2007 (R$ ’000)<br />
6,136<br />
Value added, 2003 – 2007 (R$ ’000)<br />
7,354<br />
9,289<br />
10,401<br />
11,470<br />
2003 2004 2005 2006 2007<br />
The distribution of the added value created by <strong>Cemig</strong> between the<br />
various segments can be seen in this chart, where the part retained by the<br />
government – 54% of the total in both of 2006 and 2007 – can be seen.
Stockholders<br />
8%<br />
Stockholders<br />
13%<br />
Personnel<br />
15%<br />
Third Part<br />
14%<br />
Third Part<br />
14%<br />
Personnel<br />
16%<br />
2007<br />
Amount retained<br />
8%<br />
2006<br />
Amount retained<br />
3%<br />
Other<br />
0.01%<br />
Government<br />
54%<br />
Government<br />
54%<br />
Human resources<br />
Since 2004 <strong>Cemig</strong> has been putting in place its Strategic Human Capital<br />
Management System, a model developed from the starting point of the<br />
company’s Vision and Mission. Its objective is to align strategic planning<br />
and the HR management model with the organizational strategy,<br />
incorporating a long-term vision and focusing on actions that add value<br />
to the business while favoring integrated management. Performance<br />
Management is the link between the “<strong>Cemig</strong> Strategy” and the various<br />
processes of HR management, ensuring that the strategic directives are<br />
applied in the company.<br />
This aims to develop strategic competencies that lead to improvement in<br />
results, both financial and non-financial, through contracting of targets<br />
and individual development agreements, aligning the actions of individuals<br />
and teams with the organization’s guidelines.<br />
With the implementation of the Performance Management model and a<br />
more strategic operation in the area of human resources, it has been possible<br />
to create a definitive link between the business strategy and the various<br />
processes of management of people, serving as a base for several initiatives<br />
and changes in the HR area, such as: reallocations and promotions based on<br />
performance, external competitions, the trainee program, internal mobility,<br />
various training and personal development programs, management of<br />
organizational atmosphere, etc.<br />
Training and development<br />
The <strong>Cemig</strong> Leadership in Management Program, defined and mapped by<br />
the Dom Cabral Foundation jointly with the company, was held in 2007,<br />
to develop leadership competencies. This is a continuation of a permanent<br />
process that aims to ensure that <strong>Cemig</strong> has available to it people who are<br />
capable of leading the transformations of today and the future. For the<br />
whole year, managers and superintendents were trained in at least three<br />
of a total of 10 leadership competencies, aiming to reduce the gaps in the<br />
exercise of these competencies. The number of employee participations was<br />
1,586, representing 14,092 hours of training.<br />
Continuing the corporate objective of having and maintaining a workforce<br />
with development that is compatible to its needs, and consequently<br />
being trained, polished and specialized, in 2007 EFAP provided 11,323<br />
participations in technical training to <strong>Cemig</strong> group employees, as well<br />
as 458 participations for employees of other companies. Total man-hours<br />
trained amounted to 507,590.<br />
In November 2007 the Bureau Veritas Quality International (BVQI)<br />
recommended certification of 15 processes of our Professional Improvement<br />
and Training School (EFAP). The putting in place of the quality management<br />
system at AFAP is one of the challenges of strategic human resources<br />
20<br />
planning, and it aims primarily to achieve continual improvement of its<br />
processes, focused on the quality of technical training offered to its internal<br />
and external clients.<br />
Training in IT, administration, external training, post-graduate courses,<br />
language and other courses continued, to meet the company’s constant<br />
needs arising from the emergence of new technologies, equipment and<br />
work methods. Attendances in 2007 totaled 17,172, corresponding to<br />
49.23 student training hours.<br />
Management of organizational atmosphere<br />
Aware that the achievement of high performance is intimately linked with a<br />
healthy and stimulating environment, <strong>Cemig</strong> seeks permanently to manage<br />
its internal environment. Within this context, one of the elements of the<br />
company’s vision is “to be one of the best companies to work in”.<br />
In 2006, competing with more than 500 companies, <strong>Cemig</strong> was included<br />
in the list of the 150 Best Companies to Work In by Exame magazine’s Você<br />
S.A. Guide. In 2007 not only was it once again among the Guide’s list of<br />
the 150 best companies to work in, but it was considered the best in the<br />
special category of the largest companies – those with more than 10,000<br />
employees.<br />
Another tool used to manage satisfaction with the work environment is the<br />
Organizational Atmosphere Survey, held every two years with all employees.<br />
After the phase of diagnosis and analysis of results, the company carries out<br />
planning of actions for improvement, preparing a corporate action plan<br />
and individual action plans for the various superintendents’ and managers’<br />
departments, and this is followed, finally, by a phase of monitoring of<br />
the performance of the improvement action plans. In the 2005-7 cycle<br />
there was a corporate plan made up of 21 improvement actions, and 95<br />
individual area action plans, totaling 2,232 improvement actions. From the<br />
monitoring that was carried out, it was found that more than 80% of these<br />
actions were implemented.<br />
Health, well-being and work safety<br />
To disseminate the culture and ensure the desired levels of safety, health and<br />
well-being of our own employees, and also outsourced employees, <strong>Cemig</strong><br />
continues its programs started in previous years, and maintains innovative<br />
initiatives implementing new projects aimed to ensure the health, safety<br />
and well-being of its employees.<br />
Programs continued in the year include the Energia Vital quality of life<br />
program, the disabled inclusion program, vaccination and blood donor<br />
programs, seminars on preparation for retirement, among others.<br />
In 2007 <strong>Cemig</strong> carried out various training programs in safety, highlighting<br />
those related to electricity, technical courses and recycling, with a total<br />
of 254,820 man-hours of training, as well as organization of workshops,<br />
meetings and other training sessions.<br />
Labor and union relations<br />
Other the last four years <strong>Cemig</strong> has negotiated changes in its remuneration<br />
policy with the Unions, aiming to integrate the HR management processes<br />
with the company’s business strategy. A highlight is the certification<br />
under NBR Standard ISO 9001:2000 of our Labor Union Relations<br />
Department.<br />
New people<br />
Completing the replacement of staff levels begun in 2006, 242 new<br />
employees were hired in 2007 for positions of medium, technical, and<br />
higher levels, arising from approval in a public competition held in January<br />
2006.<br />
In October 2007, as part of Strategic Human Capital Management, the<br />
company created its Internal Mobility Procedure, which responds to<br />
demands from various areas of the company where vacancies occur. It aims<br />
to provide the maximum benefit to and make use of the company’s own<br />
employees, in accordance with the criteria in the Jobs and Remuneration<br />
Plan, and the provisions of law.
11,302<br />
NUMBER OFE EMPLOYEES (*)<br />
10,668 10,658<br />
10,271<br />
10,818<br />
2003 2004 2005 2006 2007<br />
EMPLOYEES, BY COMPANY<br />
Holding<br />
Company<br />
225<br />
<strong>Cemig</strong> Distribuição<br />
8,317<br />
<strong>Cemig</strong> Geração<br />
e Transmissão<br />
2,276<br />
(*) Holding Company, <strong>Cemig</strong> Distribuição and <strong>Cemig</strong> Geração e Transmissão<br />
Culture and society<br />
<strong>Cemig</strong> maintains a profound involvement with the society of which it is a part.<br />
A central focus is sponsorship of cultural projects and incentive-related donations<br />
to initiatives for social empowerment and the improvement of quality of life.<br />
In 2007 we invested approximately R$ 27.3 million in cultural and social<br />
actions, directly benefiting the population of more than 200 municipalities<br />
in Minas Gerais. Most of the cultural projects sponsored by <strong>Cemig</strong> are<br />
continuous, or take the form of maintenance of permanent cultural spaces,<br />
reinforcing the concept of sustainability, a decisive factor in the construction<br />
of the citizen’s identity and dignity.<br />
We invest in university extension festivals in the largest academic centers<br />
of the state, because we believe they offer the possibility for reflection about<br />
the information acquired in the classroom – the advantages are gained by<br />
the population of the cities where they happen. We sponsor large and small<br />
museums, public libraries, music academies and theaters.<br />
With the second year of our “Film it in Minas” program, we reaffirm the<br />
state’s vocation in the audiovisual arts. Thirty-four projects received funding,<br />
in a wide variety of categories, in 2007/2008. Prizes were given not only to<br />
full-length and short films, but also to experimental videos, documentaries,<br />
and projects in research and development and literature of the area. All of<br />
these projects used labor, logistics and locations in the state of Minas Gerais.<br />
To provide its internal public with access to reading and the visual arts,<br />
<strong>Cemig</strong> maintains an art gallery at its head office, holding 11 exhibitions of<br />
artists from all the country – each year for the last 17 years – in a library<br />
that is also open to the public, with approximately 57,000 books. As well<br />
as this collection at the head office building, a traveling library visited<br />
another 12 administrative units of the company, serving new readers in the<br />
capital city, Belo Horizonte, and throughout the state.<br />
By ensuring that popular theater festivals take place, or taking the artistic<br />
expression of Minas Gerais outside Brazil, <strong>Cemig</strong> invests in the transforming force<br />
of culture, and reaps, together with a more mature society, comprehension of the<br />
best possible use of natural resources, respect for heritage and the common good.<br />
Environment<br />
<strong>Cemig</strong> has an Environmental Policy, published in 1990, containing 7<br />
principles that orient activities and efforts related to the protection of the<br />
environment and sustainable development. These principles are translated<br />
into actions that seek to impress on the employees and partners increasing<br />
awareness of environmental issues.<br />
Within its area of operation <strong>Cemig</strong> carries out various activities aiming to<br />
contribute to sustainable development. These include a school environmental<br />
21<br />
education program, environmental reserves, programs for preservation of flora<br />
and fauna, in which programs related to fish are a highlight.<br />
Through these actions <strong>Cemig</strong> seeks continual improvement in its social and<br />
environmental responsibility. Investments in the environment in the last<br />
four years have been more than R$ 300 million, as follows:<br />
Environment Implementation of new projects (R$ million)<br />
121.8<br />
61.3<br />
2004 2005 2006 2007<br />
19.9<br />
24.1<br />
Environmental management system<br />
The various departments of <strong>Cemig</strong> can apply for and receive certification under<br />
<strong>Cemig</strong>’s Environmental Management System (SGA), in accordance with ISO<br />
14001/2004, or adopt an Internal Management System, named SGA Level 1,<br />
which was developed on the principles of Brazilian Standard NBR ISO 14001.<br />
In 2007, the following have NBR ISO 14001/2004 certification: the Nova<br />
Ponte and Itutinga hydroelectric plants, the Galheiro Environmental Station,<br />
the management of the Western Region Plants, and the management office<br />
of the Generation Superintendent’s Department.<br />
In 2007, the following were certified:<br />
• Hydroelectric plants:<br />
• São Simão, Miranda and Rosal (2,173 MW) certified under NBR ISO<br />
14001:2004;<br />
• Emborcação and Salto Grande certified at SGA Level 1 (1,296 MW).<br />
• Transmission<br />
• The management unit of the Transmission Maintenance and Operation<br />
unit of the Minas “Triangle” area was certified under SGA Level 1, NBR<br />
ISO 9001 and OHSAS 18001 – 2,121 km of transmission lines.<br />
• The management of dam safety was certified under NBR ISO 14001:2004;<br />
ISO 9001:2000 and OHSAS 18001.<br />
With the expansion of implementation of the Environment Management<br />
Systems, our total installed generation capacity with certification increased<br />
from 1,939 MW in 2006 to 5,408 MW in 2007, 83% of the total.<br />
Sustainable development<br />
In 2007 <strong>Cemig</strong> was selected by the DJSI World – (Dow Jones Sustainability<br />
World Index), as world leader in the “supersector” of Utilities – which<br />
includes all companies providing services in electricity, gas distribution,<br />
water and associated public utility services all over the world. This<br />
achievement also represents the 8th year running (2007-8) in which <strong>Cemig</strong><br />
has been in the select list of companies of the DJSI World. <strong>Cemig</strong> has been<br />
part of this index since it was created in 1999, and is the only company in the<br />
Latin American electricity sector included in it. Its consecutive participation<br />
in the DJSI World throughout this period reflects its commitment to<br />
corporate sustainable development in its activities, including corporate<br />
governance practices, respect for the environment and the wellbeing of<br />
society, while effectively creating value for its stockholders.<br />
38.1<br />
20.0<br />
2004 2005 2006 2007<br />
7.3<br />
Environment Operation and maintenance (R$ million)<br />
36.8
Also, <strong>Cemig</strong> was selected for inclusion in the corporate sustainability index<br />
(ISE) of the São Paulo stock exchange (Bovespa) for the third time running.<br />
<strong>Cemig</strong> has been included in this index since it was created in 2005. The<br />
ISE reflects the return on a portfolio made up of shares of companies with<br />
recognized commitment to social responsibility and sustainability in the<br />
Brazilian corporate environment.<br />
As well as the commitment to protection of the environment, we invest<br />
in programs for conservation and efficiency in energy use, and in research<br />
on new energy sources, such as solar and photovoltaic energy, wind energy,<br />
hydrogen fuel cell research and the use of natural gas.<br />
Environmental licensing<br />
Our Environmental Licensing Team aims to ensure that all the studies and<br />
reports produced are properly analyzed, and all requirements of the bodies<br />
responsible for environmental issues promptly complied with. Our studies<br />
and monitoring are carried out through contracting of specialists, which<br />
include consultancy companies, research centers and universities.<br />
In 2007 <strong>Cemig</strong> obtained operational licenses for 8 transmission lines and<br />
renewal of the license of the Igarapava plant.<br />
It also obtained exemption from license for two transmission lines and 202<br />
substations.<br />
Management of waste<br />
<strong>Cemig</strong> seeks to provide the most appropriate possible application of the<br />
waste that it generates. In 2007, 320,875 fluorescent and public illumination<br />
lamps from the whole of its concession area were sent for recycling. Materials<br />
withdrawn from operation such as transformers, insulators, scrap, cables and<br />
wires are sent to the materials distribution centre, which is certified under<br />
the <strong>Cemig</strong> Environmental Management System, where they are separated for<br />
reuse or sale.<br />
In 2007, 4,685 tons of materials and equipment were sold or recycled, 31%<br />
more than in 2006. These materials include porcelain insulating parts, scrap<br />
metal parts of meters, reactors, cables, wires and batteries. Also, <strong>Cemig</strong> itself<br />
regenerated and re-used 435,000 liters of insulating mineral oil withdrawn<br />
from electrical equipment. A further 41 tons of wastes impregnated with<br />
oil (gloves, cloths and sawdust), and 201 tons of insulating mineral oil<br />
inappropriate for use in electrical equipment, were co-processed.<br />
Materials recycled or re-used, and wastes sent for processing –2004-2007, tons<br />
Waste<br />
Materials recycled or<br />
re-used<br />
453<br />
273<br />
4,685<br />
477<br />
1,716<br />
3,145<br />
3,518<br />
2004 2005 2006 2007<br />
The increase in the quantity of material recycled or re-used reflects the<br />
replacement of electric wire networks in recent years, and also development<br />
of <strong>Cemig</strong>’s abilities in management and selection and separation of<br />
materials. During the year, 4,108 tons of the total of 4,685 tons of materials<br />
were sold, providing revenue of R$ 11.2 million.<br />
We have had a continuous campaign, since 2002, for selective waste<br />
collection at our head office building under the name “I Love Recycling”.<br />
In 2007, 107 Ton of recyclable material was collected, made up of 64 Ton<br />
of paper, 26 Ton of cardboard and 17 Ton of plastic. These were passed to<br />
an NGO, Asmare (the Belo Horizonte Association of Collectors of Paper,<br />
Cardboard And Reusable Materials.<br />
Fish study programs<br />
The Peixe Vivo (“Live Fish”) program was launched in 2007 (http://www.<br />
portalpeixevivo.com.br/), which aims to create and expand actions for<br />
preservation of the aquatic fauna in the river basins of Minas Gerais state<br />
where there are <strong>Cemig</strong> generation plants. This program is implementing<br />
channels of communication that allow involvement of the community. The<br />
378<br />
22<br />
program distributes informative material and organizes lectures, meetings<br />
and workshops with various sections of society participating.<br />
To repopulate <strong>Cemig</strong>’s reservoirs and the rivers of Minas Gerais, maintaining<br />
biodiversity, we carried out 140 fish repopulation projects, at locations all<br />
over the state, with release of 808,000 minnows of various species native<br />
to the basins of the Grande, Paranaíba, São Francisco and Pardo Rivers.<br />
Some 10,000 people took part in these actions, including school pupils<br />
and representatives of various other sectors of society, in more than 70<br />
municipalities of Minas Gerais state.<br />
Fauna, flora and monitoring of water quality<br />
The company’s Environmental Stations have more than 4,000 hectares of<br />
protected areas, used for carrying out studies on fauna and flora, environmental<br />
education activities and programmed visits. A total of 700kg of seeds were<br />
collected, of 120 native forest species, destined for <strong>Cemig</strong>’s cultivation beds<br />
and interchanged with other institutions.<br />
We also produced 350,000 saplings of native species which were distributed<br />
to prefectures, NGOs and public bodies, and we planted 25 hectares of<br />
riverbank forests in partnership with rural producers.<br />
In its Profauna program the Peti Environmental Station nurtured the<br />
following species of fauna: Wild Duck, Brazilian Teal, Solitary Tinamou,<br />
Cutia and Ultramarine Grosbeak, which were subsequently released in<br />
<strong>Cemig</strong>’s other Natural Heritage Reserves (RPPNs). A further 261 recovered<br />
and readapted animals, apprehended by the environmental police and by the<br />
environmental authority Ibama, were returned to the natural environment in<br />
the company’s conservation units – which are registered under Ibama’s Forest<br />
Animals Release Area (ASAS) project.<br />
To control the quality of water of our reservoirs, we have a monitoring<br />
network covering eight basins (Grande, Paranaíba, Pardo, São Francisco,<br />
Doce, Paraíba do Sul, Itabapoana and Jequitinhonha) and 34 different subbasins,<br />
comprising a total of 46 reservoirs and 247 water collection stations.<br />
Urban trees<br />
To achieve harmonious co-existence between distribution networks and<br />
urban trees, <strong>Cemig</strong> carries out directional pruning, and gives courses in<br />
tree pruning for various prefectures in Minas Gerais. Through theoretical<br />
presentations and practical demonstration, participants receive information<br />
on implementation and maintenance of urban trees and the tree species that<br />
are appropriate for urban areas, among others subjects.<br />
In partnership with the Brazilian Urban Arborization Society (SBAU) and<br />
the International Society of Arboriculture (ISA), <strong>Cemig</strong> held the Seminar<br />
on handling of urban arborization in relation to electricity systems. This aimed to<br />
discuss and improve techniques for maintenance of trees that are close to<br />
electricity lines, based on exchange of information between professionals of<br />
the area, and also creation of closer relationships between prefectures and<br />
electricity concession holders.<br />
Environment Week<br />
On June 11 and 12, 2007 <strong>Cemig</strong> held its 2007 Environment Week, on the<br />
theme Sustainable Development and Global Warming. More than 4,000 pupils<br />
in primary education at the state and municipal 40 public schools of Belo<br />
Horizonte took part.<br />
The choice of theme aimed to alert the public that the responsibility<br />
to combat global warming is not only in the hands of governments and<br />
international organizations, but is a task for all – aiming to increase<br />
awareness of global warming, and more aware citizens with a differentiated<br />
view of nature, the future and human beings.<br />
Environmental education program<br />
In partnership with the Biodiversitas Foundation, <strong>Cemig</strong> launched the second<br />
stage of its Terra da Gente (“Our Land”) environmental education program (http://<br />
www.cemig.com.br/meio_ambiente/terra_gente/index.htm). In this stage the<br />
program expects to reach 247,000 people, 774 schools, in 235 municipalities of<br />
the Campo das Vertentes region and the south of Minas Gerais.<br />
“Terra da Gente” was created to promote environmental education for peoples<br />
in the 5th to 8th grades of basic education, and is supported by local<br />
universities wherever it is implemented. In this new phase the program has
the support of the Federal University of Lavras (EUFLA) and the Federal<br />
University of São João Del Rei (UFSJ).<br />
The Environmental Education Program that we run in our plants and<br />
environmental stations received visits from some 19,544 pupils from various<br />
schools throughout the state this year. During the visits, pupils receive<br />
information on generation of electricity and its relation to the environment,<br />
and messages about sustainable development and the need to conserve<br />
ecosystems.<br />
Research and Development – Environment<br />
<strong>Cemig</strong> has ongoing R&D projects in the environmental area, managed by<br />
Aneel, with universities and research institutions.<br />
Using funds from Aneel, five R&D projects related to the environment are<br />
in progress in fish management, immunology and environmental aspects of<br />
operation of generation plants, transposition systems and water resources.<br />
In 2006 the first transformer 100% insulated with vegetable oil was installed,<br />
in partnership with ABB. With the positive results of the first transformer, in<br />
2007, two more units of equipment were put in place in Arrudas Boulevard, to<br />
serve the Green Line in Belo Horizonte – making it possible to disseminate this<br />
technology to other areas of the company’s operations. The main advantage of<br />
vegetable oil for the environment is that it is biodegradable.<br />
<strong>Cemig</strong> and the Belo Horizonte Zoobotanical Foundation have renewed their<br />
contract for monitoring of the Lobo-Guará (the Brazilian wolf), for a sixth stage.<br />
This project develops the research on the ecology of this fox (Chrysocyon<br />
brachyurus) using GPS satellite technology, from the Galheiro environmental<br />
station of <strong>Cemig</strong> in the municipality of Perdizes, Minas Gerais.<br />
Recognition and awards<br />
<strong>Cemig</strong>’s efforts in 2007 led to recognition and awards reflecting the excellence of its<br />
activities by various sectors of society, among which we highlight the following:<br />
The Ponto Terra Environmental Award<br />
<strong>Cemig</strong> was winner of the Ponto Terra – Minas 2007 environmental prize in the<br />
Companies category with its project Solar Water Heating in Residential Buildings.<br />
The award is organized by the Ponto Terra organization, and was given during<br />
the 7th Latin American Conference on Environment and Social Responsibility<br />
(Ecolatina 2007). This is a pioneer project in Brazil, a partnership between <strong>Cemig</strong><br />
and the Minas Gerais state public housing company (CohabMG) and the state’s<br />
regional development and urban policy department (Sedru). The project was<br />
begun in 2002 and has so far benefited 1,671 families.<br />
The Minas Gerais 2007 Environmental Prize:<br />
<strong>Cemig</strong>’s Nova Ponte hydroelectric plant was one of the winners of the Minas<br />
Gerais 2007 environmental prize (PMGA), organized by the Brazilian Quality<br />
Union (UBQ) which highlighted innovative and differentiated environmental<br />
management practices. The plant is now certified by international environmental<br />
management, health and safety and quality standards.<br />
The Minas Gerais Quality Control Groups Prize<br />
<strong>Cemig</strong> was the champion participant in the 16th Minas Gerais Convention<br />
of Quality Control Groups (CCQs), and represented the state of Minas Gerais<br />
in the 13th Brazilian Nationwide Quality Control Groups Congress held in<br />
Gramado, in the state of Rio Grande de Sul. CCQ is a voluntary program<br />
where members of teams are trained in quality tools for solving problems.<br />
The company was represented by the Matrix Team with the “Oil vs. Oil”<br />
project, which presented an innovated solution to the problem of oil mist<br />
that contaminates electricity generators – the solution generated gains of<br />
R$ 14 million in each periodic maintenance cycle.<br />
Social Responsibility Award<br />
Two projects – Illuminating Lives and Public-spirited School Kit, developed by<br />
employees in the south of Minas working as volunteers, were finalists in the<br />
4th Assis Chateaubriand Social Responsibility Awards. Illuminating Lives,<br />
a partnership between <strong>Cemig</strong> and the Prisoners’ Protection and Assistance<br />
Association (Apac) and Usiparts, was selected as one of the 10 best projects<br />
submitted and received the Assis Chateaubriand Social Responsibility Trophy.<br />
The Public-spirited School Kit project received a special mention for its selection as<br />
among the 20 projects of greatest social importance in the region.<br />
23<br />
Dow Jones<br />
<strong>Cemig</strong> is the only Latin American company that has been selected by the Dow<br />
Jones Sustainability World Index (DJSI World) as the world leader in a sector of<br />
the economy worldwide, side-by-side with the giant companies of the US and<br />
Europe. In the 2007-8 index, <strong>Cemig</strong> was named the best company in the utilities<br />
“supersector” (which includes electricity, gas distribution, water/sewerage and<br />
other public utility services worldwide). The DJSI World index was created 8<br />
years ago and has become a worldwide reference for investors and fund managers.<br />
<strong>Cemig</strong> has been included in every edition of the index since its creation.<br />
Consumer Satisfaction Survey<br />
In a survey by Brazilian Energy Regulator, Aneel, of more than 19,000 clients<br />
of 64 electricity concessions in Brazil, <strong>Cemig</strong> was chosen as the best electricity<br />
concession holder in the Southeast Region, among those with more than 400,000<br />
consumers, in the IASC (Aneel Consumer Satisfaction Index) award for 2006.<br />
ISE Corporate Sustainability Index<br />
In 2007 <strong>Cemig</strong> was selected for the third time running for the São Paulo<br />
stock exchange ISE (Corporate Sustainability Index). The Company has been<br />
included in this index since its creation in 2005. Companies are assessed<br />
based on a questionnaire that reflects the company’s characteristics and its<br />
activities in the economic, environmental, social and corporate governance<br />
dimensions, and the nature of its products.<br />
The ISE, after three years’ existence, is recognized as a benchmark for investors<br />
interested in shares listed on the Bovespa of companies that practice corporate<br />
sustainability. The index also seeks to encourage Brazilian companies to<br />
practice good management.<br />
2007 Brazil Safety Award<br />
<strong>Cemig</strong> received the Prêmio Proteção Brasil 2007 award in the “Best Safety<br />
Example in Electricity” category. This is the third year the prize has been<br />
awarded – it recognizes the efforts of companies, employees and executives<br />
to improve work health and safety conditions. The “case” we presented<br />
dealt with our process of providing flame-resistant clothing, one of <strong>Cemig</strong>’s<br />
research and development projects.<br />
Accountants’ “Transparency Trophy”<br />
For the fourth year running, <strong>Cemig</strong> won the Transparency Trophy, awarded by<br />
three accounting-related organizations in the Listed Companies category. 14<br />
companies received awards: 10 listed and 4 unlisted. The prize has been given for<br />
the last 11 years by Anefac (the Brazilian Association of Finance, Administration<br />
and Accounting Executives), Fipecafi (the Accounting, Actuarial and Financial<br />
Research Institute Foundation) and the financial records institution Serasa.<br />
“Brazil’s 150 Best Companies To Work In” – 2007 Exame Guia Você S.A. award<br />
<strong>Cemig</strong> was chosen as the best of Brazil’s large companies surveyed by Exame<br />
magazine’s Você S.A. Guide’s survey “105 Best Companies for you to Work In,<br />
in 2007”. This is the second time in a row that <strong>Cemig</strong> has been included in<br />
the list of the best companies to work for – indicating the recognition given<br />
by our internal public to the success of the internal management practices<br />
that we have been putting in place.<br />
Investor relations<br />
<strong>Cemig</strong> received an honorable mention in three categories in the IR Magazine<br />
Brazil Awards for 2007: the “Grand Prix” for Best Investor Relations Program<br />
(Large Companies), Best Social-Environmental Sustainability; and Best Investment<br />
Analyst Community Meeting. The honorable mention is given to the five<br />
finalists of the award. Each year IR Magazine gives awards recognizing<br />
the best investor relations professionals and the best companies, in various<br />
categories, in accordance with an independent survey carried out by the<br />
Brazilian Economics Institute of the Getúlio Vargas Foundation (FGV).<br />
F<strong>IN</strong>AL REMARKS<br />
<strong>Cemig</strong>’s management is grateful to Minas Gerais state Governor Dr. Aécio<br />
Neves da Cunha for the trust and support he has shown during the year,<br />
and also the other federal, state and municipal authorities, the communities<br />
served by the company, our stockholders and other investors, and, especially,<br />
the dedication of our highly qualified workforce.
CONSOLIDATED SOCIAL ST<strong>ATEM</strong>ENT (Unaudited information)<br />
5 - Workforce indicators<br />
Number of employees at end of period 10,818 10,658<br />
Number of hirings during period 252 529<br />
Number of outsourced employees NA NA<br />
Number of interns 140 396<br />
Number of employees over 45 years old 4,164 3,346<br />
Number of women employed 1,469 1,454<br />
% of supervisory positions held by women 6.81 7.7<br />
Number of African-Brazilian employees 3,363 3,299<br />
% of supervisory positions held by African-Brazilians 9.09 9.30<br />
Number of employees with disabilities 53 NA<br />
6 - Corporate citizenship 2007 Metas 2008<br />
Ratio of highest to lowest compensation 17,80 ND<br />
Total number of work accidents4 1 - Basis of calculations 2007 2006<br />
R$ ’000 R$ ’000<br />
Net sales revenue (NR) R$ ‘000 10,245,914 8,466,642<br />
Operating result (OR) R$ ‘000 2,938,475 2,500,013<br />
Gross payroll (GP) R$ ‘000 995,456 893,475<br />
2 - Internal social indicators R$ ’000 % of GP % of NR R$ ’000 % of GP % of GP<br />
Food 69,116 6.94 0.67 70,027 7.84 0.83<br />
Mandatory charges and payments based on payroll 250,884 25.20 2.45 235,734 26.38 2.78<br />
Private pension plan 101,696 10.22 0.99 169,910 19.02 2.01<br />
Health 30,683 3.08 0.30 28,812 3.22 0.34<br />
Safety and medicine in the workplace 9,657 0.97 0.09 9,078 1.02 0.11<br />
Education 1,158 0.12 0.01 1,081 0.12 0.01<br />
Culture 112 0.01 – – – –<br />
Training and professional development 15,265 1.53 0.15 16,460 1.84 0.19<br />
Provision of or assistance for day-care centers 1,651 0.17 0.02 1,608 0.18 0.02<br />
Profi t sharing 486,483 48.87 4.75 209,991 23.50 2.48<br />
Other 12,032 1.21 0.12 11,073 1.24 0.13<br />
Internal social indicators - Total 978,737 98.32 9.55 753.774 84.36 8.90<br />
3 - External social indicators R$ ’000 % of GP % of NR R$ ’000 % of GP % of GP<br />
Education 2,427 0.08 0.02 – – –<br />
Culture 27,277 0.93 0.27 14,341 0.57 0.17<br />
Other donations/subventions/AS<strong>IN</strong> project 15,295 0.52 0.15 21,134 0.85 0.25<br />
Total contributions to society 44,999 1.53 0.44 35,475 1.42 0.42<br />
Taxes (excluding payroll taxes) 5,426,622 184.67 52.96 5,658,967 226.36 66.84<br />
External social indicators - Total 5,471,621 186.21 53.40 5,694,442 227.78 67.26<br />
4 - Environmental indicators R$ ’000 % of GP % of NR R$ ’000 % of GP % of GP<br />
Capital expenditure related to company operations 44,131 1.50 0.43 58,112 2.50 1.04<br />
Investments in external projects or programs – – – – – –<br />
In relation to setting of annual targets to minimize toxic waste and consumption ( x ) has no targets ( ) meets 51-75% ( x ) has no targets ( ) meets 51-75%<br />
during operations, and increasing the effi cacy of use of natural resources, the company ( ) meets 0-50% of targets ( ) meets 76-100% ( ) meets 0-50% of targets ( ) meets 76-100%<br />
108 ND<br />
Who selects the social and environmental ( ) senior<br />
( x ) senior ( ) all employees ( ) senior<br />
( x ) senior ( ) all employees<br />
projects developed by the company? management management and<br />
management management and<br />
functional managers<br />
functional managers<br />
Who decides the company’s work ( ) senior<br />
( x ) all employees ( ) All<br />
( ) senior<br />
( x ) all employees ( ) All<br />
environment health and safety standards? management and<br />
+ CIPA<br />
management and<br />
+ CIPA<br />
functional managers<br />
functional managers<br />
In relation to labor union freedom, the right ( ) doesn’t get ( x ) follows ILO ( ) encourages and ( ) will not get ( x ) will follow ILO ( ) will encourage<br />
to collective bargaining and/or internal involved<br />
employee representation, the company:<br />
rules<br />
follows ILO involved<br />
rules<br />
and follow ILO<br />
The company pension plan covers: ( ) senior<br />
( ) senior<br />
( x ) all employees ( ) senior<br />
( ) senior<br />
( x ) all employees<br />
management management and<br />
management management and<br />
functional managers<br />
functional managers<br />
The profi t-sharing program covers: ( ) senior<br />
( ) senior<br />
( x ) all employees ( ) senior<br />
( ) senior<br />
( x ) all employees<br />
management management and<br />
management management and<br />
functional managers<br />
functional managers<br />
In selection of suppliers, the standards ( ) are not considered ( ) are<br />
( x ) are<br />
( ) will not be ( ) will be ( x ) will be<br />
of ethics and social and environmental<br />
responsibility adopted by the company:<br />
suggested<br />
required<br />
considered suggested<br />
required<br />
In relation to volunteer work by employees, ( ) doesn’t get ( ) supports ( x ) organizes and ( ) will not get ( ) will support ( x ) will organize and<br />
the company:<br />
involved<br />
encourages involved<br />
encourage<br />
Total number of consumer complaints and at Company at Procon<br />
in Court<br />
at Company_ at Procon<br />
in Court<br />
criticisms raised:<br />
NA<br />
NA<br />
NA<br />
NA<br />
NA<br />
NA<br />
% of complaints and criticisms met or at Company at Procon<br />
in Court<br />
at Company at Procon<br />
in Court<br />
solved:<br />
NA %<br />
NA %<br />
NA %<br />
NA %<br />
NA %<br />
NA %<br />
Total added value distributable (R$ ’000) In 2007: 11.470.199 In 2006: 10.401.477<br />
Distribution of added value (DVA) 54.53% government 15.30% employees<br />
54.41% government 15.63% employees<br />
8.57% stockholders 14.03% others 7.57% retained 13.35% stockholders 13.37% others 3.24% retained<br />
7 - Other information<br />
I. Of total funds deployed on the environment in 2006, approximately R$ 7.3mn refers to the social-environmental programs put in place during the constructions of new hydroelectric<br />
plants and transmission lines.<br />
II. Waste generated is quantifi ed in accordance with corporate procedures for handling, transport, storage and disposal. These procedures are developing in the direction of setting of<br />
annual targets for waste reduction. We highlight the recycling of fl uorescent lamps and public illumination throughout the company’s concession area, totaling 321,000 lamps in<br />
2007. Also approx.436,000 liters of insulating oil from deactivated transformers were regenerated by <strong>Cemig</strong> itself and incorporated into the electrical system<br />
III. We quantify electricity and fuel consumption annually and do not have reduction targets.<br />
IV. 4,685 tons of material and equipment – 31% more than in 2006 – was sold or recycled. The materials include porcelain insulators, scrap metal from meters, reactors, cables, wires<br />
and batteries<br />
* Accounted in Investments related to production/operations.<br />
24
CEMIG <strong>IN</strong> NUMBERS<br />
(Consolidated data, unless otherwise indicated)<br />
Service 2003 2004 2005 2006 2007<br />
Number of consumers ( thousands ) 5,744 5,875 6,010 10,042 10,321<br />
Number of employees 11,302 10,668 10,271 10,658 10,818<br />
Number of consumers per employee 508 551 585 675 954<br />
Number of locations served 5,415 5,415 5,415 5,415 5,415<br />
Number of municipalities served<br />
Market<br />
774 774 774 805 805<br />
Concession area ( km<br />
(1) After discounting of the losses attributed to generation (652 GWh) and internal consumption by the plants themselves.<br />
(2) Calculated considering the quantity of stocks in December 31.2007.<br />
2 ) 567,478 567,478 567,478 578,448 578,448<br />
Own Generation (GWh) (1)<br />
Average supply tariffs – including ICMS ( R$ /MWh ) (1)<br />
27,025 26,922 30,411 32,187 33,130<br />
Residential 356,95 416,26 474,23 487,52 505,73<br />
Commercial 305,89 356,03 410,81 435,97 449,51<br />
Industrial 132,39 154,38 124,41 128,04 136,93<br />
Rural 186,42 214,42 249,13 265,27 270,65<br />
DEC = Average hours of outages per year 10.74 10.93 12.21 13.03 13.14<br />
FEC = Average number of outages per year 6.42 6.58 6.78 6.43 6.39<br />
Average minutes of outages per month per consumer<br />
Operational<br />
54 55 61 65 66<br />
Plants in operation 48 52 54 61 62<br />
Substations 427 434 440 469 472<br />
Transmission lines (km) 4,829 4,856 4,892 5,364 5,313<br />
Sub-transmission lines (km)<br />
Distribution lines (km)<br />
16,185 16,086 16,040 16,788 16,676<br />
Urbana 82,867 83,527 84,585 93,850 91,412<br />
Rural 276,437 283,910 294,815 308,689 337,987<br />
Installed generating capacity (MW)<br />
Financial<br />
5,771 5,949 6,113 6,692 6,678<br />
Operational revenue – R$ million 7,968 9,748 11,703 13,431 15,790<br />
Net operational revenue – R$ million 5,223 6,611 7,313 8,467 10,246<br />
Operating margin - % 22.99 28.69 33.68 30.11 32.16<br />
Ebitda - R$ million 1.771 2.480 3.058 3.222 4.073<br />
Net profi t (loss) – R$ million 1.198 1.385 2.003 1.719 1.735<br />
Net profi t (loss) (Holding company) 2.46 2.84 4.12 3.53 3.57<br />
Stockholders’ equity - R$ million 6.559 7.251 7.185 7.522 8.390<br />
Stockholders’ equity per share (Holding company) (2) 13.48 14.91 14.77 15.46 17.25<br />
Return on Stockholders’ equity - % 21.08 21.11 27.63 23.92 23.07<br />
Debt / Stockholders’ equity - % 128.67 131.15 175.55 206.03 184.40<br />
Current liquidity 0.73 0.86 0.91 1.11 1.32<br />
General liquidity 0.74 0.79 0.78 0.73 0.78<br />
BOARD OF DIRECTORS<br />
Members Substitute members<br />
Márcio Araújo de Lacerda Francisco de Assis Soares<br />
Djalma Bastos de Morais Lauro Sérgio Vasconcelos David<br />
Aécio Ferreira da Cunha Eduardo Lery Vieira<br />
Alexandre Heringer Lisboa Franklin Moreira Gonçalves<br />
Antônio Adriano Silva Marco Antônio Rodrigues da Cunha<br />
Francelino Pereira dos Santos Luiz Antônio Athayde Vasconcelos<br />
Maria Estela Kubitschek Lopes Fernando Henrique Schuffner Neto<br />
Wilson Nélio Brumer Guilherme Horta Gonçalves Júnior<br />
Wilton de Medeiros Daher<br />
Carlos Augusto Leite Brandão Eduardo Leite Hoffmann<br />
Andréa Paula Fernandes Pansa Maria Amália Delfi m de Melo Coutrim<br />
Evandro Veiga Negrão de Lima Andréa Leandro Silva<br />
José Augusto Pimentel Pessôa Nohad Toufi c Harati<br />
Haroldo Guimarães Brasil Antônio Renato do Nascimento<br />
THE AUDIT BOARD<br />
Members Substitute members<br />
Aristóteles Luiz Menezes Vasconcellos Marcus Eolo de Lamounier<br />
Drummond Bicalho<br />
Luiz Guaritá Neto Ronald Gastão Andrade Reis<br />
Luiz Otávio Nunes West Leonardo Guimarães Pinto<br />
Celene Carvalho de Jesus Ari Barcelos da Silva<br />
Thales de Souza Ramos Filho Aliomar Silva Lima<br />
MEMBERS OF CEMIG’S BOARDS<br />
25<br />
EXECUTIVE BOARD<br />
Name Position<br />
Djalma Bastos de Morais Chief Executive Offi cer<br />
José Carlos de Mattos Chief New Business Development<br />
Offi cer<br />
Luiz Fernando Rolla Chief Offi cer for Finance. Investor<br />
Relations and Control of Holdings<br />
Fernando Henrique Schüffner Neto Chief Generation and Transmission<br />
Offi cer<br />
José Maria de Macedo Chief Distribution and Sales Offi cer<br />
Marco Antonio Rodrigues da Cunha Chief Corporate Management Offi cer<br />
Bernardo Afonso Salomão de Alvarenga Chief Trading Offi cer<br />
<strong>IN</strong>VESTOR RELATIONS<br />
Investor Relations Offi ce<br />
Telephones: (31) 3506-5024 and 3506-5028<br />
Fax: (31) 3506-5025 and 3506-5026<br />
Web / mail<br />
Site: www.cemig.com.br<br />
Email: ri@cemig.com.br
BALANCE SHEETS<br />
AT DECEMBER 31. 2007 AND 2006<br />
ASSETS<br />
(R$ ’000)<br />
Consolidated Holding company<br />
2007<br />
2006<br />
Reclassifi ed<br />
2007<br />
2006<br />
Reclassifi ed<br />
CURRENT<br />
Cash and cash equivalents (Note 5) ............................................... 2,066,219 1,402,047 21,953 23,834<br />
Consumers and Traders (Note 6) ................................................... 2,025,124 2,074,983 – –<br />
Tariff recomposition and Portion “A” (Note 8) .............................. 450,817 355,599 – –<br />
Concession holders – power transportation ................................... 474,450 358,205 – –<br />
Taxes Subject to Offsetting (Note 11) ........................................... 810,293 284,197 32,996 12,443<br />
Anticipated expenses – CVA (Note 10) ......................................... 519,699 459,898 – –<br />
Traders – transactions in Free Energy (Note 9) .............................. 31,426 123,056 – –<br />
Tax credits (Note 12) .................................................................... 489,757 125,790 92,975 24,047<br />
Dividends receivable .................................................................... – – 1,383,893 1,152,772<br />
Regulatory asset – PIS–Pasep/Cofi ns (Note 15) ............................. 57,593 107,959 – –<br />
Deferred Tariff Adjustment (Note 13) .......................................... 463,491 791,231 – –<br />
Inventories ................................................................................... 42,415 34,980 – 17<br />
Other credits ............................................................................... 290,726 276,655 9,831 6,921<br />
TOTAL CURRENT ASSETS .................................................... 7,722,010 6,394,600 1,541,648 1,220,034<br />
NON–CURRENT<br />
Long term assets<br />
Accounts receivable from Minas Gerais state government (Note 14) .... 1,763,277 1,726,293 – –<br />
Receivables fund – FIDC (Note 14) .............................................. – – 772,891 744,502<br />
Tariff recomposition and Portion “A” (Note 8) .............................. 721,529 979,008 – –<br />
Anticipated expenses – CVA (Note 10) ......................................... 177,842 159,738 – –<br />
Tax credits (Note 12) .................................................................... 694,888 678,592 174,557 280,457<br />
Traders – transactions in Free Energy (Note 9) .............................. 13,646 34,637 – –<br />
Taxes offsettable (Note 11)............................................................ 365,101 601,091 259,626 289,024<br />
Deposits linked to legal actions ................................................... 271,915 254,905 92,843 82,923<br />
Consumers and Traders (Note 6) .................................................. 125,986 100,734 – –<br />
Regulatory asset – PIS. Pasep. Cofi ns (Note 15) ............................ 60,880 215,559 – –<br />
Deferred Tariff Adjustment (Note 13)........................................... 81,742 127,488 – –<br />
Other credits ............................................................................... 38,427 24,793 7,834 4,632<br />
TOTAL NON–CURRENT ASSETS ......................................... 4,315,233 4,902,838 1,307,751 1,401,538<br />
Fixed Assets<br />
Investments (Note 16) ................................................................ 1,070,854 998,875 7,068,513 6,838,844<br />
Property. Plant and Equipment (Note 17) ................................ 10,563,200 10,335,426 1,986 1,701<br />
Intangible (Note 17) ................................................................... 531,724 494,231 506 790<br />
Deferred ..................................................................................... 63,482 82,746 – –<br />
TOTAL FIXED ASSETS ........................................................... 16,544,493 16,814,116 8,378,756 8,242,873<br />
TOTAL ASSETS ........................................................................ 24,266,503 23,208,716 9,920,404 9,462,907<br />
The Explanatory Notes are an integral part of the fi nancial statements.<br />
26
BALANCE SHEETS<br />
DECEMBER 31. 2007 AND 2006<br />
LIABILITIES<br />
(R$ ’000)<br />
Consolidated Holding company<br />
2007 2006 2007 2006<br />
CURRENT<br />
Suppliers (Note 18) ...................................................................... 935,905 913,773 11,781 6,346<br />
Regulatory charges (Note 21) ....................................................... 395,894 436,535 – –<br />
Profi t shares (Note 33) .................................................................. 102,329 74,038 6,642 5,450<br />
Taxes. charges and contributions (Note 19) ................................... 1,078,159 994,577 39,192 22,991<br />
Interest on Equity. and dividends (Note 25).................................. 881,457 1,373,828 881,457 1,373,828<br />
Loans and fi nancings (Note 20) ..................................................... 969,603 800,434 5,735 6,792<br />
Debentures (Note 20) ................................................................... 50,638 33,514 – –<br />
Salaries and social contributions ................................................... 236,285 185,017 9,168 7,672<br />
Regulatory liabilities – CVA (Note 10) ......................................... 549,133 328,143 – –<br />
Regulatory liabilities – revision of transmission revenue (Note 23) ........ 15,717 – – –<br />
Post–employment obligations (Note 22)....................................... 107,061 139,113 4,362 5,933<br />
Provision for losses on fi nancial instruments (Note 36) ................. 166,448 176,575 – –<br />
Debt to related parties ................................................................. – – 76,949 3,025<br />
Other obligations ........................................................................ 372,806 293,183 30,772 21,476<br />
TOTAL CURRENT ................................................................... 5,861,435 5,748,730 1,066,058 1,453,513<br />
NON–CURRENT<br />
Long term liabilities<br />
Suppliers (Note 18) ...................................................................... 340,792 271,928 – –<br />
Regulatory liabilities – CVA (Note 10) ......................................... 196,140 119,907 – –<br />
Loans and fi nancings (Note 20) ..................................................... 4,961,138 5,620,190 73,587 73,587<br />
Debentures (Note 20) ................................................................... 1,657,655 1,194,799 – 30,009<br />
Taxes. charges and contributions (Note 19) .................................. 319,140 449,521 85,179 96,851<br />
Provisions for contingencies (Note 24) .......................................... 634,786 534,980 254,197 229,714<br />
Post–employment obligations (Note 22)....................................... 1,363,833 1,450,850 51,176 56,749<br />
Other obligations ........................................................................ 136,622 107,660 30 31<br />
TOTAL NON–CURRENT ........................................................ 9,610,106 9,749,835 464,169 486,941<br />
FUTURE EARN<strong>IN</strong>GS (Note 16) .................................................. 86,236 90,080 – –<br />
M<strong>IN</strong>ORITY <strong>IN</strong>TEREST .............................................................. 318,549 97,618 – –<br />
STOCKHOLDERS’ EQUITY<br />
Registered capital (Note 25) ......................................................... 2,432,307 1,621,538 2,432,307 1,621,538<br />
Capital reserves (Note 25) ............................................................. 4,032,222 4,032,222 4,032,222 4,032,222<br />
Profi t reserves (Note 25) ............................................................... 1,898,525 1,841,570 1,898,525 1,841,570<br />
Funds for capital increase ............................................................. 27,123 27,123 27,123 27,123<br />
TOTAL STOCKHOLDERS’ EQUITY ..................................... 8,390,177 7,522,453 8,390,177 7,522,453<br />
TOTAL LIABILITIES ................................................................. 24,266,503 23,208,716 9,920,404 9,462,907<br />
The Explanatory Notes are an integral part of the fi nancial statements.<br />
27
<strong>IN</strong>COME ST<strong>ATEM</strong>ENTS<br />
FOR THE YEARS ENDED DECEMBER 31 2007 AND 2006 (R$ ’000. EXCEPT NET PROFIT PER SHARE)<br />
Consolidated Holding company<br />
OPERATIONAL REVENUE<br />
2007<br />
2006<br />
Reclassifi ed<br />
2007<br />
2006<br />
Reclassifi ed<br />
Gross revenue from supply of electricity (Note 26) .......................................... 13,285,332 11,135,000 – –<br />
Revenue from use of the network – free consumers (Note 27) ........................... 1,945,930 1,789,471 – –<br />
Other operational revenues (Note 28) ............................................................... 558,269 506,900 40,738 1,457<br />
15,789,531 13,431,371 40,738 1,457<br />
DEDUCTIONS FROM OPERATIONAL REVENUE (Note 29) ..................... (5,543,617) (4,964,729) (4,195) (81)<br />
NET OPERATIONAL REVENUE ....................................................................<br />
OPERATIONAL COSTS<br />
COST OF ELECTRICITY AND GAS (Note 30)<br />
10,245,914 8,466,642 36,543 1,376<br />
Electricity purchased for resale ..................................................................... (2,793,722) (2,112,673) – –<br />
Charges for the use of the basic transmission grid ......................................... (649,737) (663,851) – –<br />
Gas purchased for resale ............................................................................... (154,241) (157,732) – –<br />
COST OF OPERATION (Note 30)<br />
(3,597,700) (2,934,256) – –<br />
Personnel and managers .................................................................................. (866,377) (992,765) – –<br />
Private pension plan entity .............................................................................. (110,354) (159,647) – –<br />
Materials ......................................................................................................... (89,930) (78,519) – –<br />
Raw materials and inputs for production ......................................................... (58,409) (36,812) – –<br />
Outsourced services ......................................................................................... (500,828) (411,318) – –<br />
Depreciation and amortization ........................................................................ (748,196) (626,926) – –<br />
Operational provisions .................................................................................... (49,914) (23,976) – –<br />
Financial compensation for use of water resources ............................................ (134,102) (138,955) – –<br />
Others ............................................................................................................. (168,285) (127,903) – –<br />
(2,726,395) (2,596,821) – –<br />
TOTAL COST ...................................................................................................... (6,324,095) (5,531,077) – –<br />
GROSS PROFIT .................................................................................................<br />
OPERATIONAL EXPENSES (Note 30)<br />
3,921,819 2,935,565 36,543 1,376<br />
Selling expenses .............................................................................................. (235,837) (152,719) – –<br />
General and administrative expenses .......................................................... (319,886) (78,139) (74,071) 17,472<br />
Other operational revenue (expenses) ......................................................... (71,516) (155,020) – –<br />
(627,239) (385,878) (74,071) 17,472<br />
Operational profi t before equity income and fi nancial revenues (expenses)..... 3,294,580 2,549,687 (37,528) 18,848<br />
EQUITY <strong>IN</strong>COME ............................................................................................. – – 1,911,530 1,594,595<br />
Net fi nancial revenue (expenses) (Note 31) ........................................................ (356,105) (49,674) 1,343 108,659<br />
OPERATIONAL PROFIT ................................................................................. 2,938,475 2,500,013 1,875,345 1,722,102<br />
NON–OPERATIONAL RESULT (Note 32) ....................................................... (10,356) (36,795) (11,043) (10,223)<br />
Profi t before tax and profi t sharing under the bylaws .................................... 2,928,119 2,463,218 1,864,302 1,711,879<br />
Income tax and Social Contribution (Note 12) ....................................................... (1,025,851) (599,300) (126,672) 26,217<br />
Deferred income tax and Social Contribution (Note 12) ......................................... 403,546 71,704 10,107 (9,934)<br />
Profi t shares of employees and managers (Note 33) ................................................ (454,885) (209,991) (12,288) (9,321)<br />
Profi t before minority interest .............................................................................. 1,850,929 1,725,631 1,735,449 1,718,841<br />
M<strong>IN</strong>ORITY <strong>IN</strong>TEREST .................................................................................... (115,480) (6,790) –<br />
NET PROFIT FOR THE YEAR ........................................................................ 1,735,449 1,718,841 1,735,449 1,718,841<br />
NET PROFIT PER SHARE – Reais .................................................................. 3.57 3.53<br />
The Explanatory Notes are an integral part of the fi nancial statements.<br />
ST<strong>ATEM</strong>ENTS OF CHANGES <strong>IN</strong> STOCKHOLDERS’ EQUITY FOR THE YEARS ENDED 31 DECEMBER 2007<br />
AND 2006 (R$ ’000. EXCEPT DIVIDENDS AND <strong>IN</strong>TEREST ON EQUITY PER SHARE)<br />
Registered<br />
capital<br />
BALANCES AT DECEMBER 31. 2005 .................................... 1,621,538 4,032,222 1,503,972 – 27,123 7,184,855<br />
Reversion of dividends – – 538 – – 538<br />
Net profi t for the year – – – 1,718,841 – 1,718,841<br />
Allocation of profi t proposed to AGM:<br />
Legal Reserve ............................................................................ – – 85,942 (85,942) – –<br />
Interest on Equity (R$ 1.04 per share) ...................................... – – – (169,067) – (169,067)<br />
Complementary dividends (R$ 4.41 per share) .......................... – – – (715,714) – (715,714)<br />
Profi t retention ......................................................................... – – 241,298 (241,298) – –<br />
Extraordinary dividends (R$ 3.07 per share) ............................. – – – (497,000) – (497,000)<br />
Reserve under the Bylaws ......................................................... – – 9,820 (9,820) – –<br />
BALANCES AT DECEMBER 31. 2006 .................................... 1,621,538 4,032,222 1,841,570 – 27,123 7,522,453<br />
Capital increase ........................................................................... 810,769 – (810,769) – – –<br />
Net profi t for the year .................................................................. – – – 1,735,449 – 1,735,449<br />
Allocation of profi t proposed to AGM:<br />
Legal Reserve ............................................................................ – – 86,772 (86,772) – –<br />
Dividends (R$ 1.78 per share) .................................................. – – – (867,725) – (867,725)<br />
Retained profi t ......................................................................... – – 780,952 (780,952) – –<br />
BALANCES AT DECEMBER 31. 2006 .................................... 2,432,307 4,032,222 1,898,525 – 27,123 8,390,177<br />
The Explanatory Notes are an integral part of the fi nancial statements.<br />
28<br />
Capital<br />
reserves<br />
Profi t<br />
reserves<br />
Earnings<br />
reserve<br />
Funds allocated<br />
to capital<br />
increase Total
ST<strong>ATEM</strong>ENTS OF SOURCES AND USES<br />
OF FUNDS YEARS END<strong>IN</strong>G DECEMBER 31. 2007 AND 2006 (R$ ’000)<br />
2007<br />
The Explanatory Notes are an integral part of the fi nancial statements.<br />
29<br />
Consolidated Holding company<br />
2006<br />
Reclassifi ed 2007<br />
2006<br />
Reclassifi ed<br />
ORIG<strong>IN</strong>S OF FUNDS<br />
From operations<br />
Net profi t for the period .................................................... 1,735,449 1,718,841 1,735,449 1,718,841<br />
Expenses (revenue) not affecting working capital<br />
Depreciation and amortization ......................................... 778,144 672,257 701 694<br />
Net disposal of fi xed assets ............................................... 30,084 21,596 – 4,182<br />
Equity income from subsidiaries ..................................... – – (1,911,530) (1,594,595)<br />
Post–employment obligations ......................................... 123,007 169,910 5,144 7,871<br />
Long term interest and monetary variations ..................... (468,159) (392,919) (62,013) (179,340)<br />
Deferred federal taxes ...................................................... (403,546) (71,704) (10,107) (9,934)<br />
Provision for losses in recovering amounts for the<br />
Extraordinary Tariff Adjustment and Free Energy .......... 174,832 86,154 26,594 29,217<br />
Provision (reversal) for operational losses ......................... 117,406 (124,208) 19,064 (142,565)<br />
Other ................................................................................... 114,359 (27,582) 13,136 19,978<br />
Funds from operations ........................................................... 2,201,576 2,052,345 (183,562) (145,651)<br />
From third parties and stockholders<br />
Financings obtained ............................................................. 1,055,910 2,265,902 – 30,000<br />
Sales of stockholdings ......................................................... 49,234 – – –<br />
Sale of interest in the FIDC .................................................. – – – 900,000<br />
Receipt of units in the FIDC ................................................ – – 7,267 26,611<br />
Reversion of dividends ......................................................... – 538 538<br />
Dividends receivable from subsidiaries ................................ – – 1,675,779 1,480,255<br />
Amortizations of accounts receivable from<br />
Minas Gerais state government ......................................... 122,007 78,760 – –<br />
Special obligations ............................................................... 267,897 304,642 – –<br />
1,495,048 2,649,842 1,683,046 2,437,404<br />
Other origins<br />
Initial working capital of subsidiaries acquired .................... – 262,390 – –<br />
Reduction in long–term receivables .................................... – 21,045 – –<br />
Transfer from Non–current to Current assets<br />
Anticipated expenses – CVA .............................................. 107,689 54,351 – –<br />
Regulatory assets PIS. Cofi ns ............................................ 129,671 184,071 – –<br />
Tax credits ......................................................................... 285,974 – 105,900 –<br />
Taxes subject to offsetting .................................................. 246,070 – 29,398 –<br />
Extraordinary Tariff Adjustment ........................................ 390,483 300,898 – –<br />
Deferred Tariff Adjustment................................................ 181,546 764,139 – –<br />
Traders – transactions in Free Energy ................................. 29,264 94,430 – –<br />
Other ................................................................................... 138,399 86,732 3,854 15,723<br />
1,509,096 1,768,056 139,152 15,723<br />
TOTAL SOURCES ............................................................... 5,205,720 6,470,243 1,638,636 2,307,476<br />
USES OF FUNDS<br />
Taxes able to be offset ......................................................... – 348,816 – 288,889<br />
Increase in non–current assets .............................................. 41,776 – – –<br />
Tax credits transferred from Current to Non–current<br />
assets ................................................................................. – 80,638 – 37,191<br />
Deposits paid into court....................................................... 17,068 120,428 9,920 –<br />
Anticipated expenses – CVA – Transfer from Current to<br />
Non–current assets ............................................................ – 50,697 – –<br />
Investments ......................................................................... 108,933 552,681 7,055 569,574<br />
In PP&E .............................................................................. 1,392,868 1,469,762 702 –<br />
In deferred ........................................................................... 4,405 1,998 – –<br />
Interest on Equity and Dividends ........................................ 867,725 1,381,781 867,725 1,381,781<br />
Transfer from Non–current to Current liabilities<br />
Loans and fi nancings .......................................................... 1,178,950 430,217 30,246 –<br />
Taxes and Social Contribution ............................................ 64,032 346,753 – –<br />
Suppliers – Wholesale electricity ....................................... 56,892 136,010 – –<br />
Post–employment obligations ........................................... 194,328 220,073 10,717 8,899<br />
Regulatory liabilities – CVA .............................................. – 34,683 – –<br />
Tax credits – transfer from Current assets to Non–current.. 58,757 20,689 – –<br />
Other ................................................................................... 5,281 107,303 3,202 15,236<br />
TOTAL. USES ...................................................................... 3,991,015 5,302,529 929,567 2,301,570<br />
CHANGE <strong>IN</strong> NET WORK<strong>IN</strong>G CAPITAL ........................ 1,214,705 1,167,714 709,069 5,906<br />
ST<strong>ATEM</strong>ENT OF CHANGE <strong>IN</strong> NET WORK<strong>IN</strong>G CAPITAL<br />
At end of period<br />
Current assets .................................................................... 7,722,010 6,394,600 1,541,648 1,220,034<br />
Current liabilities .............................................................. (5,861,435) (5,748,730) (1,066,058) (1,453,513)<br />
1,860,575 645,870 475,590 (233,479)<br />
At start of period ................................................................ 645,870 (521,844) (233,479) (239,385)<br />
CHANGE <strong>IN</strong> NETWORK<strong>IN</strong>G CAPITAL ......................... 1,214,705 1,167,714 709,069 5,906
EXPLANATORY NOTES TO<br />
THE F<strong>IN</strong>A<strong>NCIAL</strong> ST<strong>ATEM</strong>ENTS<br />
AT DECEMBER 31. 2007 AND 2006<br />
In R$ $ ’000. except where otherwise stated.<br />
1) OPERATIONAL CONTEXT<br />
Companhia Energética de Minas Gerais. “<strong>Cemig</strong>” or “the Holding<br />
company”. a listed corporation registered in the Brazilian Registry of<br />
Corporate Taxpayers (CPNJ) under number 17.155.730/0001-64. has<br />
been operating exclusively as a holding company since January 1. 2005.<br />
with stockholdings in companies controlled individually and jointly. the<br />
principal objectives of which are the construction and operation of systems<br />
for production. transformation. transmission. distribution and sale of<br />
electricity. and also activities in the various fields of energy. for the purpose<br />
of the respective commercial operation.<br />
On December 31. 2007 <strong>Cemig</strong> had stockholdings in the following<br />
companies in operation (the information on markets served. and installed<br />
capacity. has not been reviewed by our external auditors):<br />
� <strong>Cemig</strong> Geração e Transmissão S.A. (subsidiary. 100% stake): Registered<br />
with the CVM (Securities Commission): Generation and transmission<br />
of electricity. through 46 power plants. 43 being hydroelectric. one a<br />
wind power plant and two thermal plants. and their transmission lines.<br />
most of them part of the Brazilian national generation and transmission<br />
grid system. <strong>Cemig</strong> Geração e Transmissão S.A. has stockholdings in<br />
the following subsidiaries that are at development phase:<br />
- Hidrelétrica Cachoeirão S.A. (jointly controlled. 49.00% stake):<br />
Production and sale of electricity as an independent power producer.<br />
through the Cachoeirão hydroelectric power plant located at Pocrane.<br />
in the State of Minas Gerais. The power plant is in the construction<br />
phase. with startup expected in September 2008. It has generation<br />
capacity of 27 MW.<br />
- Guanhães Energia S.A. (jointly controlled – 49.00% stake): Production<br />
of sale and sale of electricity through building and commercial<br />
operation of the following Small Hydro Plants: Dores de Guanhães;<br />
Senhora do Porto; and Jacaré. located in the municipality of Dores de<br />
Guanhães; and Fortuna II. located in the municipality of Virginópolis.<br />
both in Minas Gerais State. The plants are in construction phase.<br />
with start of operation scheduled for 2009. and will have aggregate<br />
installed capacity of 44MW.<br />
- <strong>Cemig</strong> Baguari Energia S.A. (subsidiary – 100 stake): Production<br />
and sale of electricity as an independent producer. <strong>Cemig</strong> Geração<br />
and Transmissão expects to transfer the assets from the Baguari<br />
Consortium to this subsidiary. Operational startup of this plant is<br />
scheduled for 2009.<br />
- Madeira Energia S.A. – (jointly controlled – 10.00% stake):<br />
Implementation. construction. operation and commercial operation<br />
of the Santo Antônio hydroelectric plant in the Madeira River Basin.<br />
in the State of Rondônia. with power of 3.150 MW (information not<br />
audited) and commercial start up scheduled for 2012).<br />
� <strong>Cemig</strong> Distribuição S.A. (subsidiary – 100% stake): Registered with<br />
the CVM (Securities Commission): Distribution of electricity through<br />
distribution networks and lines in approximately 97.00% of the<br />
Brazilian state of Minas Gerais.<br />
� Rio Minas Energia Participações (“RME”) (jointly controlled – stake<br />
25.00%: This is the company that holds 52.25% of the registered capital<br />
of Light S.A. (“Light”). the holding company that has 100% control of<br />
the distribution concession holder Light Serviços de Eletricidade S.A.<br />
with 3.9 million consumers in municipalities of the state of Rio de<br />
Janeiro. and the generating company Light Energia S.A. which has<br />
generating capacity of 855 MW.<br />
� Sá Carvalho S.A. (subsidiary – 100.00% stake): Production and sale<br />
of electricity. as a holder of a concession for public electricity service.<br />
through the Sá Carvalho hydroelectric power plant.<br />
30<br />
� Usina Térmica Ipatinga S.A. (subsidiary – 100% stake): Production<br />
and sale. as an Independent Power Producer. of thermally produced<br />
electricity. through the Ipatinga thermal plant. located on the premises<br />
of Usiminas (Usinas Siderúrgicas de Minas Gerais S.A.).<br />
� Companhia de Gás de Minas Gerais – Gasmig (“Gasmig”) (jointly<br />
controlled – 55.19% stake): Acquisition. transport and distribution of<br />
combustible gas or sub-products and derivatives. through concession<br />
for distribution of gas in the State of Minas Gerais. granted by the<br />
government of the State of Minas Gerais.<br />
� Empresa de Infovias S.A. (“Infovias”) (subsidiary – 100.00% stake):<br />
Specialized services in the area of telecommunications. by means of<br />
an integrated system consisting of fiber optic cables. coaxial cables.<br />
electronic and associated equipment (multi-service network).<br />
� Efficientia S.A. (subsidiary – 100.00% stake): Provides electricity<br />
efficiency and optimization services and energy solutions through<br />
studies and execution of projects. as well as providing services of<br />
operation and maintenance in energy supply facilities.<br />
� Horizontes Energia S.A. (subsidiary – 100.00% stake): Production<br />
and sale of electricity. as an independent power producer. through the<br />
Machado Mineiro and Salto do Paraopeba hydroelectric power plants.<br />
in the State of Minas Gerais. and Salto do Voltão e Salto do Passo Velho.<br />
in the State of Santa Catarina.<br />
� Central Termelétrica de Cogeração S.A.: (subsidiary – 100.00% stake):<br />
Production and sale of thermally generated electricity. as an independent<br />
power producer. through the construction and operation of the UTE<br />
Barreiro thermal generation plant. located on the premises of Vallourec<br />
& Mannesmann Tubes. in the State of Minas Gerais. The concession was<br />
transferred to UTE Barreiro S.A. in the first quarter of 2006.<br />
� Rosal Energia S.A. (subsidiary – 100.00% stake): Production and sale<br />
of electricity. as a public electricity service concession holder. through<br />
the Rosal hydroelectric power plant located on the border between the<br />
States of Rio de Janeiro and Espírito Santo. Brazil.<br />
� Central Hidrelétrica Pai Joaquim S.A. (subsidiary – 100.00% stake):<br />
Production and sale of electricity as an independent power producer.<br />
through the Pai Joaquim hydroelectric power plant. The concession was<br />
transferred to <strong>Cemig</strong> PCH S.A. in the first quarter of 2006.<br />
� <strong>Cemig</strong> PCH S.A. (subsidiary – 100.00% stake): Production and sale of<br />
electricity as an independent power producer. through the Pai Joaquim<br />
hydroelectric power plant.<br />
� <strong>Cemig</strong> Capim Branco Energia S.A. (subsidiary – 100.00% stake):<br />
Production and sale of electricity as an independent producer. through<br />
the Capim Branco I and II hydroelectric power plants. built through a<br />
consortium with private-sector partners.<br />
� UTE Barreiro S.A (subsidiary – 100.00% stake): Production and sale<br />
of thermally generated electricity. as an independent producer. through<br />
the construction and operation of the UTE Barreiro thermal generation<br />
plant. located on the premises of Vallourec & Mannesmann Tubes. in<br />
the State of Minas Gerais.<br />
� Companhia Transleste de Transmissão (jointly controlled – 25.00%<br />
stake): Operation of a 345kV transmission line connecting the<br />
substation located in Montes Claros to the substation of the Irapé<br />
hydroelectric power plant.<br />
� <strong>Cemig</strong> Trading S.A. (subsidiary: 100.00% stake): Sale and intermediation<br />
of business transactions related to energy.<br />
� Companhia Transudeste de Transmissão (jointly controlled – 24.00%<br />
stake): Construction. implementation. operation and maintenance of<br />
electricity transmission facilities of the national grid – the 345 kV<br />
Itutinga–Juiz de Fora transmission line.<br />
� Companhia Transirapé de Transmissão (jointly controlled – 24.50%<br />
stake): Construction. implementation. operation and maintenance<br />
of electricity transmission facilities of the national grid – the 230kV<br />
Irapé–Araçuaí transmission line.<br />
Empresa Paraense de Transmissão de Energia S.A. (“ETEP”) (jointly<br />
�<br />
controlled – stake of 18.19%): Holder of a public service electricity
transmission concession for the 500kV transmission line originating at<br />
the Tucuruí Substation and ending at the Vila do Conde Substation in<br />
the State of Pará.<br />
� Empresa Norte de Transmissão de Energia S.A. (“ENTE”) (jointly<br />
controlled – 18.35% stake): Holder of a public service electricity<br />
transmission concession. for two 500kV transmission lines. the first<br />
from the Tucuruí Substation to the Marabá Substation in the State<br />
of Pará. and the second from the Marabá Station to the Açailândia<br />
Substation in the State of Maranhão.<br />
� Empresa Regional de Transmissão de Energia S.A. (“ERTE”) (jointly<br />
controlled – 18.35% holding): Holder of a public service electricity<br />
transmission concession. for the 230kV transmission line from the<br />
Vila do Conde Substation to the Santa Maria Substation in the State<br />
of Pará.<br />
� Empresa Amazonense de Transmissão de Energia S.A. (“EATE”) (jointly<br />
controlled – 15.79% stake): Holder of the public service electricity<br />
transmission concession for the 500kV transmission lines between the<br />
sectionalizing Substations of Tucuruí. Marabá. Imperatriz. Presidente<br />
Dutra and Açailândia.<br />
� Empresa Catarinense de Transmissão de Energia S.A. (“ECTE”) (jointly<br />
controlled. with 7.50% stake: Holder of the public service electricity<br />
transmission service concession. through the 525 kV transmission line<br />
from the Campos Novos Substation to the Blumenau Substation in the<br />
State of Santa Catarina.<br />
<strong>Cemig</strong> also has stockholdings in the companies listed below. which on<br />
December 31. 2007 were at pre-operational stage:<br />
� Companhia de Transmissão Centroeste de Minas (jointly controlled<br />
– 51.00% stake): Construction. implementation. operation and<br />
maintenance of the electricity transmission facilities of the basic network<br />
of the national grid – the 345kV Furnas–Pimenta transmission line.<br />
� Transchile Charrúa Transmisión S.A. – (“Transchile”) (jointly controlled<br />
– 49.00% stake): Implementation. operation and maintenance of the<br />
Charrúa–Nueva Temuco 220kV transmission line and two sections of<br />
transmission line at the Charrúa and Nueva Temuco substations. in the<br />
central region of Chile. The head office of Transchile is in Santiago.<br />
Chile.<br />
� Focus Soluções Tecnológicas S.A. (“AXXIOM”) (jointly controlled<br />
– 49.00% stake): Formed in August 2007 to provide services of<br />
implementation and management of systems for electricity sector<br />
companies. Start of operations is scheduled for 2008.<br />
Where <strong>Cemig</strong> exercises joint control it does so through stockholders’<br />
agreements with the other stockholders of the investee company.<br />
2) PRESENTATION OF THE F<strong>IN</strong>A<strong>NCIAL</strong> ST<strong>ATEM</strong>ENTS AND<br />
PR<strong>IN</strong>CIPAL ACCOUNT<strong>IN</strong>G PRACTICES<br />
2.1) Presentation Of The Financial Statements<br />
The financial statements of the holding company and the Consolidated<br />
Financial Statements were prepared in accordance with accounting practices<br />
adopted in Brazil. consisting of: the Corporate Law;; the rules of the<br />
Brazilian Securities Commission (CVM – Comissão de Valores Mobiliários);<br />
and the specific legislation applicable to electricity concession holders. put<br />
in place by the Brazilian regulator (Aneel – National Electricity Agency).<br />
The financial statements were prepared according to accounting principles.<br />
methods and criteria that are uniform in relation to those adopted and<br />
disclosed in full at the closing of the last business year.<br />
On December 28. 2006. Aneel published its Dispatch 3073 which changed<br />
rules of the Electricity Public Service Accounting Manual. coming into<br />
effect on January 1. 2007. ordering that the following consumer charges:<br />
the Energy Efficiency Program. the Energy Development Account (CDE).<br />
the Fuel Consumption Account (CCC). the National Scientific and<br />
Technological Development Fund (FNDCT). Expansion of the Energy<br />
System (EPE). and Research and Development be transferred from<br />
31<br />
Operational Expenses to Deductions from Operational Revenue. with<br />
the corresponding reclassifications for the amounts presented in the 2006<br />
business year.<br />
As a result of inclusion in the Company’s Bylaws in 2007 of a provision for<br />
payment of profit shares to the employees and managers of the company.<br />
this profit share has begun to be posted as an amount reducing net profit<br />
before tax and profit shares. where in 2006 it was posted under Personnel<br />
Expenses.<br />
Aiming to improve the information provided to the market. <strong>Cemig</strong><br />
is presenting. as complementary information. in Appendices I. II and<br />
III. statements of cash flow. of added value and of income statements<br />
segregated by Company. All the information presented was obtained<br />
from the Company’s accounting records and those of its subsidiaries.<br />
Reclassifications have been made of certain information contained in the<br />
traditional income statement. with a view to being considered in the added<br />
value statement as distribution of added value generated.<br />
The statements of cash flow were prepared in accordance with the criteria<br />
of FAS 95 – Statement of Cash Flows. with references made to the format of<br />
presentation. in the context of registry of the financial statements with the<br />
Securities and Exchange Commission (SEC).<br />
Change in the Brazilian Corporate Law<br />
On December 28. 2007. Law 11638/07 was passed. altering. repealing<br />
and creating new provisions in the Brazilian Corporate Law in the chapter<br />
relating to disclosure and preparation of financial statements. Among other<br />
aspects. this changes the criterion for recognition and valuation of certain<br />
assets and liabilities. These changes in accounting practices come into<br />
effect as from January 1. 2008.<br />
The aim of these changes is to increase the transparency of financial<br />
statements of Brazilian companies and eliminate some regulatory barriers<br />
that were an obstacle to the process of convergence of these financial<br />
statements with international financial reporting standards (IFRS):<br />
The main changes to the Law. coming into effect as from 2008. with the<br />
possibility of impacting the company’s financial statements. are as follows:<br />
• Replacement of the Statement of Sources and Uses of Funds by the Cash<br />
Flow Statement;<br />
• Inclusion of the Added Value Statement in the group of financial<br />
statements prepared. disclosed and which are to be approved by the<br />
Ordinary General Meeting of stockholders;<br />
• A new possibility was created. further to that originally specified in the<br />
corporate law. of separation of trading reporting and tax reporting. by<br />
establishing the alternative for the company of adopting in its trading<br />
reporting. and not only in auxiliary books. the provisions of the Tax<br />
Law. provided that. immediately afterward. after the calculation of the<br />
taxable profit base amount. the necessary adjustments are made for the<br />
financial statements to be in harmony with the Corporate Law and the<br />
fundamental principles of accounting;<br />
• Creation of two new subgroups of accounts: Intangible. in permanent<br />
assets. and Adjustments to valuations of assets and liabilities in<br />
Stockholders’ equity. The sub group of “Adjustments to Valuation of<br />
Assets and Liabilities” will essentially have the purpose of containing the<br />
counterpart of certain valuations of assets at market price. the valuation<br />
of certain financial instruments and. also. conversion adjustments as<br />
a result of FX variation on holdings in companies outside Brazil. still<br />
pending specific regulation by the CVM. (Securities Commission);<br />
• New criteria for classification and valuation of investments and financial<br />
instruments. including derivatives. These financial instruments will be<br />
classified in three categories (held for trading. held until maturity and<br />
available for sale) and their valuation at cost plus return or at market<br />
value will be made as a function of their classification in one of these<br />
categories;<br />
• Introduction of the concept of Adjustment to Present Value for longterm<br />
asset and liability transactions and for significant short-term<br />
transactions. still awaiting specific regulation by the CVM;
• In absorption. merger or split transactions (combination of companies).<br />
when carried out between non-related parties and linked to effective<br />
transfer of control. all the assets and liabilities of the absorbed. split or<br />
merged company must be identified. valued and accounted at market<br />
value.<br />
• Elimination of the possibility of spontaneous revaluations of fixed assets<br />
being made.<br />
As communicated to the market. the CVM intends. by the end of 2008.<br />
to complete its process of issue of regulations for the provisions of the<br />
corporate law that were altered and which need regulation. and will review<br />
all its normative acts that deal with accounting matters. so as to verify and<br />
eliminate any divergencies in relation to the specific alterations produced<br />
by the new law.<br />
2,2) Authorization for conclusion of the financial statements<br />
On February 21, 2008, the Company’s Executive Board authorized<br />
conclusion of the Financial Statements for the year ended December 31,<br />
2007, and consequent submission to the Board of Directors for approval.<br />
2,3) Principal accounting practices<br />
(a) Accounting practices specifi c to the electricity sector<br />
Management expenses: These are appropriated monthly to the cost of<br />
works in progress, by a sharing of up to 8% of the direct expenses<br />
on personnel and outsourced services, in proportion to the investments<br />
made,<br />
Activities of subsidiary not linked to the public electricity service<br />
concession: These refer basically to the Consortia for production and<br />
sale of electricity as Independent Power Producers, and the holding of<br />
32<br />
The Company's management is in the process of assessing the effects that<br />
the alterations mentioned above will produce on its stockholders' equity<br />
and profit for the year of 2008. and will also take into consideration the<br />
orientations and definitions to be issued by the regulatory bodies. At the<br />
present moment. management believes it is not possible to determine the<br />
effects of these alterations on the profit and stockholders' equity for the<br />
business year ended December 31. 2007.<br />
Reclassification of accounting balances<br />
The effects arising from the changes in accounting classifications of certain<br />
transactions. as mentioned above. are as follows:<br />
Reclassification of accounting balances<br />
The effects arising from the changes in accounting classifications of certain transactions, as mentioned before, are as follows:<br />
Original line<br />
Consolidated<br />
Net amounts<br />
Operational costs – Cost of operation<br />
Energy Effi ciency Program - PEE 104,530<br />
Energy Development Account – CDE 333,983<br />
CCC – the Fuel Consumption Account 554,448<br />
Research and development 38,521<br />
National Scientifi c and Technological Development Fund 29,615<br />
Energy system expansion research 15,031<br />
1,076,128<br />
Subsidiary<br />
Net Consolidated<br />
Original line<br />
Operational costs – Cost of operation<br />
amounts Net amounts<br />
Personnel and managers ........................ 9,321 209,991<br />
9,321 209,991<br />
Current Assets<br />
Other Credits ....................................... (445) (26,546)<br />
(445) (26,546)<br />
Current Liabilities<br />
Other Obligations ................................ (3,025) –<br />
(3,025) –<br />
Reclassifi ed to<br />
Deductions from operational revenue<br />
Consolidated<br />
Net amounts<br />
Energy Effi ciency Program - PEE....................................... (104,530)<br />
Energy Development Account – CDE ................................ (333,983)<br />
CCC – the Fuel Consumption Account .............................. (554,448)<br />
Research and development ................................................. (38,521)<br />
National Scientifi c and Technological Development Fund ...... (29,615)<br />
Energy system expansion research ...................................... (15,031)<br />
Reclassifi ed to<br />
Subsidiary<br />
Net amounts<br />
(1,076,128)<br />
Consolidated<br />
Net amounts<br />
Income statement<br />
Employees’ profi t shares ........................ (9,321) (209,991)<br />
(9,321) (209,991)<br />
Current Assets<br />
Cash and cash equivalents ..................... 445 26,546<br />
445 26,546<br />
Current Liabilities<br />
Debt to related parties .......................... 3,025 –<br />
3,025 –<br />
the subsidiary is registered in Investments, as described in Explanatory<br />
Note 16, The balances of assets, liabilities, revenue and expenses<br />
relating to the transactions mentioned are controlled monthly through<br />
the specific financial records and statements prepared by the Consortia,<br />
in obedience to the rules of the Electricity Public Service Accounting<br />
Manual, issued by Aneel.<br />
(b) General accounting practices<br />
Cash and cash equivalents: This includes cash balances, deposits in<br />
banks, and financial investments with immediate liquidity, valued<br />
at cost, plus the returns accruing up to the date of the financial<br />
statements.<br />
Consumers and traders: The supply of electricity billed and not billed on<br />
the date of the financial statements is accounted by the accrual regime.
Provision for doubtful credits: This is constituted in an amount<br />
considered sufficient to cover any losses on consumers and traders, The<br />
criteria for constitution of the provision are described in Explanatory<br />
Note 6.<br />
Inventories: These are valued at average acquisition cost, The materials<br />
in the inventory are classified in Current assets; the materials destined<br />
for works are classified in Fixed assets, and not depreciated.<br />
Non-controllable costs – CVA: The differences between the sums of the<br />
non-controllable costs (also known as “Portion A”) used as a reference<br />
in the calculation of the tariff adjustment of <strong>Cemig</strong> Distribution and<br />
Light and the disbursements actually made are offset in the adjustment<br />
of future tariffs, and recorded in Assets or Liabilities, After the inclusion<br />
of the differences in the tariff adjustment, the expenses are transferred<br />
monthly to the income statement in proportion to reimbursement by<br />
receipt of amounts in payment of client invoices.<br />
Investments: Holdings in subsidiaries are valued by the equity method,<br />
and other permanent stockholdings are valued at acquisition cost,<br />
reduced by any provision for losses, where applicable,<br />
Property, plant and equipment: The assets of property, plant and<br />
equipment are valued at the cost incurred on the date of their acquisition<br />
or formation, Those acquired or formed up to December 31, 1995 were<br />
subjected to monetary updating up to that date.<br />
Depreciation and amortization: These are calculated on the balance<br />
of Fixed assets in service and Investments in consortia, by the linear<br />
method, using the rates determined by Aneel for the assets related to<br />
electricity activities, and reflect the estimated useful life of the assets.<br />
Special obligations linked to the concession: These are posted at the<br />
value received from clients, shown as adjustments to Property, plant<br />
and equipment, These obligations are directly linked to the Public<br />
Electricity Service Concession and, in accordance with Aneel Normative<br />
Resolution 234 of October 31, 2006 and SFF/Aneel Circular Letter<br />
1314/2007 of June 27, 2007, will be amortized as from the second<br />
periodic tariff review (March 2008) at a rate to be defined by Aneel<br />
corresponding to the average rate of assets in service.<br />
Other current and non-current assets and liabilities: Those subject<br />
to monetary updating by reason of legislation or contractual clauses<br />
are updated based on the indices specified therein, so as to reflect the<br />
updated amounts on the date of the financial statements, The others are<br />
presented at the values incurred on the date of formation, and in the<br />
case of assets reduced by provisions for losses, where applicable.<br />
Capitalization of interest charges on loans and financings: The interest<br />
and other financial charges incurred on financings linked to works<br />
in progress are appropriated to Fixed assets in progress and consortia<br />
during the period of construction.<br />
Post-employment obligations: The costs, contributions and actuarial<br />
liabilities related to supplementary pension plans and the other postemployment<br />
benefits are determined annually and recognized as<br />
obligations and posted based on a valuation carried out by independent<br />
actuaries, using the Projected Unit Credit Method to determine the<br />
present value of the obligations, in accordance with CVM Decision<br />
371/00.<br />
Interest on Equity: The Interest on Equity paid in substitution of<br />
dividends, although registered in accounting terms as a financial<br />
expense, is presented in the financial statements as an amount reducing<br />
Stockholders’ equity, so as to reflect the essence of the transaction.<br />
Income tax and deferred Social Contribution: Provisions or credits are<br />
constituted on temporary additions, considering the rates in effect on<br />
these taxes, in accordance with CVM Decision 273 of August 20, 1998<br />
and CVM Instruction 371 of June 27, 2002, and take into account the<br />
past profitability and the expectation of generation of future taxable<br />
profits based on a technical feasibility study.<br />
33<br />
Future earnings: This refers to the discount ascertained by the subsidiary<br />
RME on the acquisition of Light S,A,, based on the expectation of<br />
future profitability of the company acquired, and amortization during<br />
the period of the concession (2026).<br />
Employees' profit shares: These are provisioned in accordance with<br />
the collective labor agreement made with the unions representing the<br />
employees and are posted as amounts reducing Profit before tax and<br />
employee profit shares under the Bylaws, as a result of the inclusion of<br />
this procedure in the Company’s bylaws in 2007.<br />
Income statement: Revenues and expenses are recognized by the accrual<br />
method.<br />
Net profit per thousand shares: This is calculated on the basis of the<br />
number of shares, excluding Shares held in Treasury, on the date of the<br />
financial statements.<br />
Use of estimates: The preparation of financial statements requires<br />
management to use estimates for the posting of certain transactions,<br />
which affect assets and liabilities, revenues and expenses of <strong>Cemig</strong><br />
and of the subsidiaries, and also the disclosure of information on data<br />
of their financial statements, The final results of these transactions<br />
and information, when they are actually carried out in subsequent<br />
periods, may be different from these estimates, The Company revises<br />
the estimates and assumptions at least quarterly, except in relation<br />
to the Post-employment obligations, as specified in the note above,<br />
The main estimates related to the financial statements referred<br />
to the posting of the effects arising from the Rationing Program,<br />
the General Agreement for the Electricity Sector, transactions in<br />
the Electricity Sale Chamber (“CCEE”), the Provision for doubtful<br />
credits, Non-controllable costs – CVA, Accounts receivable from<br />
the Minas Gerais state government, Tax credits, Post-employment<br />
obligations, Depreciation, Provisions for contingencies, and<br />
Unbilled supply of electricity.<br />
Provisions: A provision is recognized in the balance sheet when the<br />
company has a legal obligation or an obligation constituted as a result<br />
of a past event, and it is probable that the funds will be required to<br />
settle it, Provisions are registered on the basis of the best estimates of<br />
the risk involved.<br />
3) – PR<strong>IN</strong>CIPLES OF CONSOLIDATION<br />
The financial statements of the subsidiaries and jointly controlled<br />
companies mentioned in Explanatory Note 1 were consolidated, The data<br />
of the controlled subsidiaries as a whole was consolidated based on the<br />
method of proportional consolidation, applicable to each component of the<br />
financial statements of the investees, All the subsidiaries, including those<br />
that are jointly controlled, follow accounting practices that are consistent<br />
with those of the holding company.<br />
In the consolidation, the holdings of the holding company in the<br />
Stockholders’ equity of investee companies, and the significant balances of<br />
assets, liabilities, revenues and expenses arising from transactions effected<br />
between the companies, have been eliminated.<br />
The portion relating to the minority holdings in Stockholders’ equity of<br />
the subsidiaries is shown separately in Liabilities.<br />
The financial statements of Transchile, for the purpose of consolidation,<br />
are converted from Chilean accounting principles to Brazilian accounting<br />
principles, with Chilean pesos being converted to Reais at the exchange<br />
rate of the last day of the year.<br />
It should be noted that starting in the third quarter of 2006, <strong>Cemig</strong> now<br />
partially consolidates the financial statements of RME and the transmission<br />
companies EPTE, ENTE, ERTE, EATE and ECTE, posting the results as<br />
equity income in the consolidated results as from August 1, 2006.<br />
The dates of the financial statements of the investee companies used for<br />
calculation of equity income and consolidation coincide with those of the<br />
holding company.
4) – CONCESSIONS<br />
CEMIG and its subsidiaries have the following concessions from Aneel:<br />
Location<br />
34<br />
Installed capacity,<br />
MW<br />
Information not audited<br />
Date of concession or<br />
authorization Expires<br />
GENERATION<br />
Hydroelectric plants-<br />
São Simão Rio Paranaíba 1,710,000 01/1965 01/2015<br />
Emborcação Rio Paranaíba 1,192,000 07/1975 07/2005<br />
Nova Ponte Rio Araguari 510,000 07/1975 07/2005<br />
Jaguara Rio Grande 424,000 08/1963 08/2013<br />
Miranda Rio Araguari 408,000 12/1986 12/2016<br />
Três Marias Rio São Francisco 396,000 04/1958 07/2015<br />
Volta Grande Rio Grande 380,000 02/1967 02/2017<br />
Irapé Rio Jequitinhonha 360,000 01/1999 02/2035<br />
Aimorés Rio Doce 161,700 07/2000 12/2035<br />
Salto Grande Rio Santo Antônio 102,000 10/1963 07/2015<br />
Funil Rio Grande 88,200 10/1964 12/2035<br />
Queimado Rio Preto 86,625 11/1997 01/2033<br />
Itutinga Rio Grande 52,000 01/1953 07/2015<br />
Capim Branco I Rio Araguari 50,526 08/2001 08/2036<br />
Capim Branco II Rio Araguari 44,210 08/2001 08/2036<br />
Camargos Rio Grande 46,000 08/1958 07/2015<br />
Porto Estrela Rio Santo Antônio 37,333 05/1997 07/2032<br />
Igarapava Rio Grande 30,450 05/1995 12/2028<br />
Piau Rio Piau / Pinho 18,012 10/1964 07/2015<br />
Gafanhoto Rio Pará 14,000 09/1953 07/2015<br />
Sá Carvalho Rio Piracicaba 78,000 12/1994 12/2024<br />
Rosal Itabapoana - RJ 55,000 04/1997 05/2032<br />
Pai Joaquim Rio Araguari 23,000 12/2005 04/2032<br />
Others Various 115,210 Various Various<br />
Light – Fontes Nova Ribeirão dos Lajes 17,243 07/1996 06/2026<br />
Light – Nilo Peçanha Ribeirão dos Lajes 49,638 07/1996 06/2026<br />
Light – Pereira Passos Ribeirão dos Lajes 13,063 07/1996 06/2026<br />
Light – Ilha dos Pombos Rio Paraíba do Sul 23,904 07/1996 06/2026<br />
Light – Santa Branca<br />
Wind plant–<br />
Rio Paraíba do Sul 7,446<br />
6,493,560<br />
07/1996 06/2026<br />
Morro do Camelinho ........................................................ Gouveia – MG<br />
Thermal plants–<br />
1,000 03/2000 –<br />
Igarapé ............................................................................ Juatuba – MG 131,000 01/2005 08/2024<br />
Formoso ........................................................................... Formoso – MG 0,440 04/1999 –<br />
Ipatinga ........................................................................... Ipatinga – MG 40,000 11/2000 12/2014<br />
Barreiro ........................................................................... Belo Horizonte<br />
Works in progress<br />
11,398<br />
182,838<br />
02/2006 04/2023<br />
Baguari hydroelectric plant .............................................. Rio Doce 47,600 08/2006 08/2041<br />
Cachoeirão Small Hydro Plant (PHC) .............................. Rio Manhuaçu 13,230 07/2000 07/2030<br />
Dores dos Guanhães PHC ................................................ Rio Guanhães 6,860 11/2002 11/2032<br />
Fortuna II PHC ............................................................... Rio Guanhães 4,410 12/2001 12/2031<br />
Senhora do Porto PHC ..................................................... Rio Guanhães 5,880 10/2002 10/2032<br />
Jacaré PHC ...................................................................... Rio Guanhães 4,410 10/2002 10/2032<br />
.................................................................................. 82,390<br />
TOTAL GENERATION ...................................................<br />
TRANSMISSION<br />
6,759,788<br />
National grid ................................................................. Minas Gerais<br />
Substations<br />
– 07/1997 07/2015<br />
Itajubá – 3 ...................................................................... Minas Gerais<br />
Transmission lines<br />
– 10/2000 10/2030<br />
Transleste: Irapé – Montes Claros .................................... Minas Gerais – 02/2004 02/2034<br />
Transudeste: Itutinga – Juiz de Fora ............................... Minas Gerais – 03/2005 03/2035<br />
Transirapé: Irapé–Araçuaí ............................................... Minas Gerais – 03/2005 03/2035<br />
ETEP: Tucuruí–Vila do Conde ........................................ Pará – 06/2001 06/2031<br />
ENTE: Tucuruí–Marabá–Açailândia ............................... Pará/Maranhão – 12/2002 12/2032<br />
ERTE: Vila do Conde–Santa Maria .................................. Pará – 12/2002 12/2032<br />
EATE: Tucuruí–Presidente Dutra ................................... Pará – 06/2001 06/2031<br />
ECTE: Campos Novos–Blumenau ................................... Santa Catarina – 11/2000 11/2030<br />
Works in progress:<br />
Transchile: Charrúa–Nova Temuco ................................. Chile – 04/2005 07/2028<br />
Centroeste de Minas: Furnas–Pimenta ............................ Minas Gerais – 03/2005 03/2035
DISTRIBUTION<br />
North .............................................................................. Minas Gerais – 04/1997 02/2016<br />
South ............................................................................... Minas Gerais – 04/1997 02/2016<br />
East ................................................................................. Minas Gerais – 04/1997 02/2016<br />
West ................................................................................ Minas Gerais – 04/1997 02/2016<br />
Light ............................................................................... Rio de Janeiro – 07/1996 06/2026<br />
RENEWAL OF CONCESSIONS OF ELECTRICITY<br />
GENERATION PLANTS<br />
On June 14, 2007, the Mining and Energy Ministry (MME), by Ministerial<br />
Order MME 124/2007, renewed the period of concession for <strong>Cemig</strong> Geração<br />
e Transmissão for 20 years from the date of expiry for the following plants –<br />
Rio das Pedras, Poço Fundo, São Bernardo, Xicão, Luiz Dias, Emborcação,<br />
Nova Ponte and Santa Luzia – which have total installed capacity of<br />
1,735 MW (unaudited information).<br />
Extension of concessions will be put into effect by signature of the<br />
Amendment to Concession Contract 007/97 – which will obey the<br />
rules and conditions established by the relevant legislation, and also<br />
Project<br />
Nominal value on<br />
31/12/07<br />
Location<br />
35<br />
Installed capacity,<br />
MW<br />
Date of concession or<br />
authorization Expires<br />
The installed capacities shown refer to <strong>Cemig</strong>’s stockholding interest in the subsidiaries and in consortia with the private sector, See further information in<br />
Explanatory Note 16.<br />
those in Law 10848, of March 15, 2004, and its respective regulations,<br />
The proceedings are under analysis by the National Electricity Agency<br />
(Aneel) and signature of the Amendment will probably take place in<br />
the first half of 2008.<br />
Payments for concessions<br />
In obtaining the concessions for construction of some generation projects,<br />
the CEMIG Geração e Transmissão S,A, undertook to make payments to<br />
the concession-granting power, over the period of validity of the contract,<br />
as compensation for commercial operation, The information on the<br />
concessions, and the amounts to be paid, are as follows:<br />
Present value on<br />
31/12/07 Period of amortization Indexor<br />
Porto Estrela (consortium) ................................ 292,393 75,387 08/2001 to 07/2032 IGP-M<br />
Irapé ................................................................. 29,356 10,471 03/2006 to 02/2035 IGP-M<br />
Capim Branco (consortium) .............................. 18,444 6,398 09/2007 to 08/2035 IGP-M<br />
Queimado (consortium) .................................... 7,753 2,943 01/2004 to 12/2032 IGP-M<br />
The portions paid to the concession-granting power for the Porto Estrela,<br />
Irapé, Capim Branco and Queimado plants in 2007 were respectively<br />
R$ 1,000, R$ 284, R$ 155 and R$ 97.<br />
The present value of the concessions of Porto Estrela, Irapé, Capim Branco<br />
and Queimado was calculated at a rate of 10,00% per year and the present<br />
value of the portions to be paid in the 12 month period correspond to R$<br />
1,019, R $624, R$ 294 and R$ 97, (nominal value of R$ 1,070, R$ 657,<br />
R$ 308 and R$ 102), respectively.<br />
5) – CASH AND CASH EQUIVALENTS<br />
The concessions to be paid to the concession-granting power provide for<br />
monthly portions with different values over time, For the purposes of<br />
accounting and recognition of costs, however, the company recognizes<br />
the expenses incurred in a counterpart entry in Non-current liabilities<br />
– Others, in a linear manner, based on the adjusted normal value, as<br />
previously indicated, in accordance with the accrual principle.<br />
At the end of the concession, the residual value of the projects is to be<br />
reimbursed to the company by the concession-granting power.<br />
Consolidated Holding company<br />
2007 2006 2007 2006<br />
Bank accounts .................................................................................................<br />
Cash investments<br />
443,490 134,324 5,739 1,847<br />
Bank certifi cates of deposit ........................................................................... 1,351,880 1,028,630 16,214 21,987<br />
Treasury fi nancial notes ................................................................................. 97,101 67,174 – –<br />
National Treasury notes ................................................................................ 105,869 141,527 – –<br />
Others .......................................................................................................... 67,879 30,392 – –<br />
1,622,729 1,267,723 16,214 21,987<br />
2,066,219 1,402,047 21,953 23,834<br />
Cash investments consist of transactions carried out with Brazilian financial institutions, contracted on normal market conditions and under normal market<br />
rates, and are available to be used in the Company’s operations.
6) – CONSUMERS AND TRADERS<br />
Consolidated<br />
Consumer category Not yet due<br />
Overdue up to<br />
90 days<br />
Overdue more<br />
than 90 days<br />
Total<br />
2007 2007 2007 2007 2006<br />
Residential ...................................................................... 443,580 199,704 210,296 853,580 809,616<br />
Industrial ........................................................................ 321,968 58,049 274,192 654,209 673,544<br />
Commercial, services and others ...................................... 265,628 68,044 97,928 431,600 432,835<br />
Rural ............................................................................... 66,734 21,765 20,012 108,511 91,360<br />
Public authorities ............................................................ 62,827 16,291 30,311 109,429 93,065<br />
Public illumination ........................................................ 99,839 9,869 18,746 128,454 122,928<br />
Public service .................................................................. 50,432 5,597 5,167 61,196 164,644<br />
Sub-total – consumers .................................................. 1,311,008 379,319 656,652 2,346,979 2,387,992<br />
Supply to other concession holders ................................... 140,305 135 902 141,342 145,904<br />
Provision for doubtful credits .......................................... – – (463,197) (463,197) (458,913)<br />
1,451,313 379,454 194,357 2,025,124 2,074,983<br />
Holding company<br />
Consumer category Not yet due<br />
Overdue up to<br />
90 days<br />
Overdue more<br />
than 90 days<br />
Total<br />
2007 2007 2007 2007 2006<br />
Residential ...................................................................... – – 6,712 6,712 29,363<br />
Industrial ........................................................................ – – 38,315 38,315 42,044<br />
Commercial, services and others ...................................... – – 10,160 10,160 22,031<br />
Rural ............................................................................... – – 4,087 4,087 5,245<br />
Public authorities ............................................................ – – 1,357 1,357 1,452<br />
Public illumination ........................................................ – – 2,666 2,666 2,676<br />
Public service .................................................................. – – 1,029 1,029 1,113<br />
Sub–total – consumers .................................................. – – 64,326 64,326 103,924<br />
Provision for doubtful credits .......................................... – – (64,326) (64,326) (103,924)<br />
– – – – –<br />
The provision for doubtful credits made is considered to be sufficient to<br />
cover any losses in the realization of these assets.<br />
Receivables in the amount of R$ 44,469 are recorded in non-current assets<br />
(long-term receivables) at December 31, 2007 (R$50,357 at December<br />
31, 2006), in relation to the renegotiation of receivables owed by Copasa<br />
(Minas Gerais Water Company) and the prefecture of Belo Horizonte, to be<br />
paid by September 2012 and March 2010, respectively.<br />
Credits receivable from an industrial consumer in the amount of R$ 90,834,<br />
not paid due to an injunction that allowed this payment not to be made<br />
until final judgment of a legal action challenging the tariff increase during<br />
the Cruzado Economic Plan, by Ministerial Order 045/86, are recorded in<br />
the accounts, The Company expects this action to be concluded before the<br />
end of 2008, and expects the amounts referred to be received in full.<br />
The breakdown of the provision for doubtful receivables, by consumer<br />
category, is as follows:<br />
Consolidated Holding company<br />
2007 2006 2007 2006<br />
Residential 174,226 159,599 6,713 29,363<br />
Industrial<br />
Commercial, services<br />
163,953 132,065 38,314 42,044<br />
and others 74,932 86,335 10,160 22,031<br />
Rural 12,595 12,922 4,087 5,245<br />
Public authorities 20,538 17,848 1,357 1,452<br />
Public illumination 13,235 13,990 2,666 2,676<br />
Public service 3,718 36,154 1,029 1,113<br />
463,197 458,913 64,326 103,924<br />
36<br />
Changes in the provision for doubtful receivables in 2007 were as<br />
follows:<br />
Consolidated<br />
Holding<br />
company<br />
Balance on December 31, 2006 ............... 458,913 103,924<br />
Constitution (reversal) of provision ......... 143,190 (6,994)<br />
Deducted from accounts receivable .......... (138,906) (32,604)<br />
Balance on December 31, 2007 ............ 463,197 64,326<br />
According to rules laid down by Aneel, the criteria for constitution of<br />
provisions are as follows: (i) for consumers with significant debts payable,<br />
an individual analysis is made of the balance, taking into account the history<br />
of default, negotiations in progress and the existence of real guarantees;<br />
(ii) for other consumers, the debts receivable and unpaid for more than<br />
90 days from residential consumers, more than 180 days from commercial<br />
consumers and more than 360 days for the other consumer categories are<br />
provisioned in full.<br />
7) – REGULATORY ASSETS AND LIABILITIES<br />
The General Agreement for the Electricity Sector, signed in 2001, and the<br />
new regulations governing the electricity sector, result in the constitution<br />
of several regulatory assets and liabilities, and also in deferral of federal<br />
taxes applicable to these assets and liabilities (which are settled as and when<br />
the assets and liabilities are received and/or paid), as shown here:
Consolidated<br />
2007 2006<br />
Assets<br />
Extraordinary Tariff Recomposition and<br />
Portion “A” – Note 8 ..................................................<br />
Traders – transactions in Free Energy during the<br />
1,172,346 1,334,607<br />
rationing program – Note 9 ...................................... 45,072 157,693<br />
Deferred tariff adjustment – Note 13 ............................ 545,233 918,719<br />
PIS, COF<strong>IN</strong>S and PASEP taxes – Note 15 ................... 118,473 323,518<br />
Anticipated expenses – CVA – Note 10 ......................<br />
Revision of the Tariff for Use of the Distribution<br />
697,541 619,636<br />
System – TUSD .......................................................... 3,089 –<br />
Recovery of discounts on the TUSD ............................. 3,327 1,997<br />
Low–income subsidy ...................................................... 116,361 30,987<br />
2,701,442 3,387,157<br />
Liabilities<br />
Suppliers – passthrough to generators<br />
for purchase of Free Energy – Note 18 ....................... (342,370) (352,039)<br />
Purchase of energy during Rationing – Note 18 .......... (51,600) (78,989)<br />
Review of transmission revenue – Note 23 ..................<br />
Amounts to be restituted in the tariff –<br />
(23,448) –<br />
CVA – Note 10 ........................................................... (745,273) (448,050)<br />
Revision of the distribution system – TUSD ................ (15,955) –<br />
(1,178,646) (879,078)<br />
Taxes and contributions – deferred liabilities –<br />
Note 19 ....................................................................... (625,712) (957,085)<br />
(1,804,358) (1,836,163)<br />
Total .................................................................. 897,084 1,550,994<br />
8) –THE EXTRAORD<strong>IN</strong>ARY TARIFF RECOMPOSITION, AND<br />
PORTION “A”<br />
The Brazilian federal government, through the Electricity Emergency<br />
Chamber (GCE), signed an accord with the electricity distributors and<br />
generators in 2001, named “The General Agreement for the Electricity<br />
Sector”, which set criteria for ensuring the economic and financial<br />
equilibrium of the concession contracts and for “recomposition” of the<br />
extraordinary revenues and losses which occurred during the Rationing<br />
Program, through an Extraordinary Tariff Recomposition (“RTE”), given<br />
to compensate for the variation in non-manageable costs of Portion “A”<br />
taking place in the period from January 1 to October 25, 2001.<br />
a) The Extraordinary Tariff Recomposition<br />
Resolution 91 of the Emergency Electricity Council (GCE), of December<br />
21, 2001 and Law 10438 of April 26, 2002, established the procedures<br />
for implementation of the Extraordinary Tariff Recomposition (RTE),<br />
coming into force on December 27, 2001, The tariff adjustments were set<br />
by Resolution 130 of the GCE, on April 30, 2002, as follows:<br />
� Adjustment of 2,90% for consumers in the residential classes (excluding<br />
low-rental consumers), and the rural, public-illumination and industrial<br />
high-voltage consumer classes for whom the cost of electricity represents<br />
18,00% or more of the average cost of production and which meets<br />
certain requirements related to load factor and electricity demand,<br />
specified in the Resolution.<br />
� Increase of 7,90% for other consumers.<br />
The RTE described above is being used to compensate the following items:<br />
� Losses of invoiced sales revenue in the period from June 1, 2001 to<br />
February 28, 2002, corresponding to the difference between estimated<br />
revenue if the rationing program had not been put in place and the<br />
actual revenue while the program was in place, according to a formula<br />
published by Aneel, Calculation of this value did not take into account<br />
any losses from default by consumers,<br />
� Passthrough to be made to the generators who bought energy in the<br />
MAE – which was succeeded in 2004 by the Electricity Sale Chamber<br />
(the “CCEE/MAE”), in the period from June 1, 2001 to February 28,<br />
2002, with price in excess of R$ 49,26/MWh (“free energy”).<br />
37<br />
The recovery of the credits through the RTE, in accordance with Normative<br />
Resolution 45, of March 3, 2004, is carried out in the proportion of 64,29%<br />
and 35,71% for the credits relating to the losses of billing and free energy,<br />
respectively.<br />
The RTE credits, relating to losses from rationing, are being updated by the<br />
variation in the Selic rate up to the month in which they are actually offset.<br />
The RTE credits relating to free energy are updated by the Selic rate with<br />
the addition of 1,00% per annum of interest for the amounts to be passed<br />
through to the generators who obtained loans from the BNDES,<br />
The ICMS tax applicable to the consolidated balance of the RTE,<br />
corresponding to the revenues to be invoiced, which is estimated at<br />
R$ 96,269 on December 31, 2007 (R$165,890 on December 31, 2006)<br />
is due only at the time of issuance of the respective electricity bill to<br />
consumers, The company operates as a mere passthrough agent of this tax<br />
between consumers and the state tax authority, and thus did not make any<br />
record of the said obligation in advance,<br />
Provision for losses in realization<br />
<strong>Cemig</strong> and its subsidiaries have prepared studies to ascertain whether the<br />
period stipulated by Aneel for recovery of the amounts homologated will be<br />
sufficient, The preparation of this study is based on certain assumptions, the<br />
most important being those referring to the projections for tariff increases,<br />
inflation rates, the Selic rate and the growth of the electricity market.<br />
Based on this study, we estimated the provision for losses in the realization<br />
of the RTE amounts on 2007 December at R$ 452,633 (R$ 406,216 on<br />
31 June, 2006).<br />
b) Portion “A”<br />
The items of Portion “A” are defined as being the sum of the differences,<br />
positive or negative, in the period January 1 to October 25, 2001, between<br />
the amounts of the non-manageable costs presented on the basis of the<br />
calculation for determination of the last annual tariff adjustment and the<br />
disbursements which effectively took place in the period.<br />
Through Normative Resolution No, 1, of January 12, 2004, Aneel laid<br />
down that the values of the variations in the non-manageable items of<br />
Portion “A” would cease to be included in the limit period of validity of<br />
the RTE, and their recovery would begin immediately after the end of the<br />
period of validity of the RTE, using the same mechanisms of recovery, that<br />
is to say, the adjustment applied to the tariffs for compensation of the RTE<br />
values will remain in effect for compensation of the items of Portion “A”.<br />
The Portion “A” credits are updated by the variation in the Selic rate up to<br />
the month in which they are actually offset.<br />
c) Composition of the balances of the RTE and Portion “A”<br />
The amounts to be received in relation to the RTE and Portion “A”,<br />
recorded in Assets, are:<br />
Consolidated<br />
2007 2006<br />
Total Total<br />
CEMIG – Holding company<br />
Losses from rationing ........................................ 250,527 223,933<br />
(–) Provision for losses in realization of the RTE ... (250,527) (223,933)<br />
– –<br />
<strong>Cemig</strong> Distribuição S,A<br />
Losses from rationing ........................................ 127,806 299,069<br />
Passthrough to be made to the generators ......... 333,866 337,370<br />
Portion A ......................................................... 707,422 632,388<br />
(–) Provision for losses in realization of the RTE.... (92,329) (90,044)<br />
1,076,765 1,178,783<br />
RME – Light<br />
Losses from rationing ........................................ 79,876 101,507<br />
Passthrough to be made to the generators ......... 40,640 70,720<br />
Portion A ......................................................... 84,842 75,836<br />
(–) Provision for losses in realization of the RTE ... (109,777) (92,239)<br />
95,581 155,824<br />
Total of RTE and Portion “A” ....................... 1,172,346 1,334,607<br />
Current assets ................................................... 450,817 355,599<br />
Non-current assets ............................................ 721,529 979,008
The RTE amounts to be passed through to the generators refer to free energy,<br />
and are posted in Current assets and Non-current assets, in Suppliers, in the<br />
amounts of R$ 27,381 and R$ 314,989, (R$ 124,557 and R$ 227,482 on<br />
December 31, 2006) respectively.<br />
9) – TRADERS – TRANSACTIONS <strong>IN</strong> FREE ENERGY<br />
The rights of the subsidiary <strong>Cemig</strong> Geração e Transmissão in relation to<br />
the transactions in free energy in the Electricity Trading Chamber (CCEE,<br />
formerly MAE) during the Rationing Program are as follows:<br />
Consolidated<br />
2007 2006<br />
ASSETS<br />
Amounts to be received from distributors ... 436,084 402,752<br />
Provision for losses in realization ................ (391,012) (245,059)<br />
45,072 157,693<br />
Current ....................................................... 31,426 123,056<br />
Non-current ............................................... 13,646 34,637<br />
The amounts to be received refer to the difference between the prices paid by<br />
the Company in the transactions in energy on the CCEE/MAE, during the<br />
period when the Rationing Program was in force, and the amount of R$ 49,26/<br />
MWh, which is to be reimbursed through the amounts raised by means of the<br />
RTE, as defined in the General Accord for the Electricity Sector.<br />
In accordance with Aneel Resolution 36 of January 29, 2003, the electricity<br />
distributors raise and passthrough the amounts obtained monthly by means<br />
of the RTE to the generators and distributors who have amounts to be<br />
received, among which the Company is included, since March 2003.<br />
The rights of the subsidiary <strong>Cemig</strong> Geração e Transmissão are updated by<br />
the variation in the Selic rate plus 1,00% interest per year.<br />
The conclusion of some court proceedings in progress, brought by market<br />
agents, in relation to the interpretation of the rules in force at the time of<br />
the realization of the transactions in the ambit of the CCEE/MAE, may<br />
result in changes in the amounts recorded.<br />
Provision for losses in realization<br />
The subsidiary <strong>Cemig</strong> Geração e Transmissão receives the amounts of the<br />
RTE from other distributors, who have a limit period, stipulated by Aneel,<br />
to raise the RTE from consumers and pass through the amounts owed to<br />
the company.<br />
A study was carried out of the amounts of average passthroughs received by<br />
the distributors, to verify whether the period stipulated for the distributors<br />
to make the passthrough would be enough for recovery of the amounts<br />
homologated by Aneel, Based on this study, the provision for losses on<br />
realization of the free energy credits on December 31, 2007 was estimated at<br />
R$ 391,012 (R$ 245,059 on December 31, 2006), and this was registered<br />
as an amount reducing the respective asset.<br />
In the second half of 2007 the Company reviewed the calculations of<br />
financial updating of the amounts receivable by the distributors based on<br />
the criteria supplied by Aneel, which resulted in an increase in the value<br />
of the asset, As a consequence, there was also an equivalent increase in the<br />
value of the provision for losses, These adjustments generated no net effect<br />
on the profit for the year.<br />
10) – ANTICIPATED EXPENSES AND REGULATORY LIABILITIES<br />
– CVA<br />
The balance on the Account to Compensate for Variation of Portion “A”<br />
items (CVA) refers to the positive and negative variations between the<br />
estimate of <strong>Cemig</strong>’s non-manageable costs, used for deciding the tariff<br />
adjustment, and the payments actually made, The variations ascertained<br />
are compensated in the subsequent tariff adjustments.<br />
38<br />
The balance on the CVA is shown below:<br />
Consolidated<br />
2007 2006<br />
<strong>Cemig</strong> Distribuição ...................................... (35,092) 143,204<br />
RME – Light ................................................ (12,640) 28,382<br />
............................................................ (47,732) 171,586<br />
Current assets ............................................... 519,699 459,898<br />
Non-current assets ........................................ 177,842 159,738<br />
Current liabilities ......................................... (549,133) (328,143)<br />
Non-current liabilities .................................. (196,140) (119,907)<br />
Net amounts ................................................ (47,732) 171,586<br />
11) – TAXES SUBJECT TO OFFSETT<strong>IN</strong>G<br />
Consolidated Holding company<br />
2007 2006 2007 2006<br />
Current<br />
ICMS recoverable ....... 193,055 15,088 3,561 3,508<br />
Income tax ................. 314,245 144,350 – 7,325<br />
Social Contribution ... 104,564 42,893 – 5<br />
PASEP ....................... 35,782 5,877 4,571 13<br />
COF<strong>IN</strong>S .................... 135,960 32,769 21,184 206<br />
Others ....................... 26,687 43,220 3,680 1,386<br />
Non–current<br />
810,293 284,197 32,996 12,443<br />
ICMS recoverable ....... 84,774 312,434 367 367<br />
Income tax ................. 233,275 260,013 233,275 260,013<br />
Social Contribution ... 25,984 28,644 25,984 28,644<br />
Pasep and Cofi ns taxes 21,068 – – –<br />
365,101 601,091 259,626 289,024<br />
1,175,394 885,288 292,622 301,467<br />
The amounts of the Pasep and Cofins taxes registered in the holding<br />
company refer to the constitution of assets recoverable corresponding to<br />
the difference of taxation of these contributions under the non-cumulative<br />
regime (9,25%) and the cumulative regime (3,65%) applied to revenues<br />
from transmission from the period February-December 2004, arising from<br />
contracts signed on dates prior to October 31, 2003 (pre-set price),<br />
The balances of income tax and Social Contribution refer to tax credits<br />
in corporate income tax returns of previous years, and payments made<br />
in 2007, which will be offset in the Income Tax and Social Contribution<br />
payable in 2008,<br />
The credits of ICMS recoverable, posted in Non-current assets, arise from<br />
acquisitions of fixed assets and are offset in 48 months, The company is in<br />
the process of adaptation to the new requirements for electronic information<br />
laid down by the government of the state of Minas Gerais, which will allow<br />
for the offsetting of the credits as from the first quarter of 2008,<br />
12) – TAX CREDITS<br />
a) Deferred income tax and Social Contribution<br />
<strong>Cemig</strong> and its subsidiaries have deferred income tax credits posted<br />
in Current assets and Non-current assets, constituted at the rate of<br />
25,00% and deferred Social Contribution credits, at the rate of 9,00%,<br />
as follows:
Consolidated Holding company<br />
2007 2006 2007 2006<br />
Tax credits on temporary<br />
differences<br />
Tax loss/negative base ........... 283,859 367,944 81,712 108,152<br />
Contingency provisions .........<br />
Provisions for losses on<br />
realization of amounts<br />
receivable under the<br />
Extraordinary Tariff<br />
Recomposition and<br />
190,426 163,185 76,326 73,668<br />
free energy ........................ 249,515 190,072 85,179 76,137<br />
Post–employment obligations<br />
Provision for doubtful<br />
54,132 49,279 1,101 2,423<br />
receivables .........................<br />
Provision for Pasep/Cofi ns –<br />
Extraordinary Tariff<br />
185,015 166,697 21,871 35,334<br />
Recomposition ...................<br />
Provision for non–recovery<br />
19,315 58,524 – 7,455<br />
of tax credits – Light .......... (29,616) (239,472) – –<br />
Financial instruments ........... 79,625 – – –<br />
FX variation ......................... 66,924 – – –<br />
Others .................................. 85,450 48,153 1,343 1,335<br />
1,184,645 804,382 267,532 304,504<br />
Current assets .......................... 489,757 125,790 92,975 24,047<br />
Non–current assets .................. 694,888 678,592 174,557 280,457<br />
At its meeting on March 6, 2008, the Board of Directors approved the<br />
technical study prepared by the CFO’s department on the forecasts for<br />
future profitability adjusted to present value, which show capacity for<br />
realization of the deferred tax asset in a maximum period of 10 years,<br />
as defined in CVM Instruction 371, This study includes <strong>Cemig</strong> and its<br />
subsidiaries <strong>Cemig</strong> Generation and Transmission and <strong>Cemig</strong> Distribution,<br />
and was submitted to <strong>Cemig</strong>’s Audit Board for examination on March 6,<br />
2008.<br />
In accordance with the individual estimates of <strong>Cemig</strong> and its subsidiaries,<br />
future taxable profits enable the deferred tax asset existing on December<br />
31, 2007 to be realized according to the following estimate:<br />
Consolidated<br />
Holding<br />
company<br />
2008 489,757 92,975<br />
2009 194,453 41,404<br />
2010 112,523 36,803<br />
2011 119,130 34,329<br />
2012 104,613 33,372<br />
2013 to 2015 111,104 28,429<br />
2016 and 2017<br />
( –) Provision for losses on recovery of<br />
82,681 220<br />
tax credits: RME/Light (29,616) –<br />
1,184,645 267,532<br />
As well as the provision for non-recovery of tax credits of Light, on March 31, 2007<br />
the holding company had tax credits not recognized in its financial statements,<br />
in the amount of R$ 444,269 (R$ 442,760 on December 31, 2006).<br />
The credits not recognized refer basically to the effective loss arising<br />
from the assignment of the credits of accounts receivable from the state<br />
government to the Credit Receivables Fund in the first quarter of 2006<br />
(as per Explanatory Note 14), As a result of this assignment the provision<br />
39<br />
for losses on recovery of the amounts constituted in previous years became<br />
deductible for the purposes of income tax and Social Contribution, The<br />
portion not recognized in relation to this issue is R$ 437,509.<br />
From the business year 2002 to 2006, Light did not recognize in its accounts<br />
new deferred tax credits on temporary differences and tax losses in accordance<br />
with CVM Instruction 371/02, because at that time it did not have taxable<br />
profit for at least three years of a minimum period of five years, Starting<br />
with the business year 2007, when the conditions of this CVM rule began to<br />
be met, Light began to recognize new deferred tax assets on the temporary<br />
differences and also accounted the tax credits accumulated since 2003, in the<br />
amount of R$ 212,812 (corresponding to 25,00% of the total, in accordance<br />
with the proportional consolidation made by the Company).<br />
b) Reconciliation of the expense on income tax and Social<br />
Contribution:<br />
The reconciliation of the nominal expense on income tax (rate 25%) and<br />
Social Contribution (rate 9%) with the actual expense shown in the Income<br />
Statement is as follows:<br />
Consolidated Holding company<br />
2007 2006 2007 2006<br />
Profi t before income tax and<br />
Social Contribution ............... 2,928,119 2,463,218 1,864,302 1,711,879<br />
Income tax and Social<br />
Contribution – nominal<br />
expense ................................. (995,560) (837,494) (633,863) (582,039)<br />
Tax effects applicable to:<br />
Provision (reversal) for loss on<br />
accounts receivable from the<br />
government of the State of<br />
Minas Gerais ......................... – 142,577 – 142,577<br />
Equity income from subsidiaries – – 523,110 401,894<br />
Recognition of deferred assets .. 218,763 – – –<br />
Employee profi t shares ............. 154,518 71,397 4,178 3,169<br />
Interest on Equity ....................<br />
Non-deductible contributions<br />
– 57,483 – 57,483<br />
and donations ....................... (12,330) (9,179) (296) (233)<br />
Tax incentive amounts ............. 24,178 16,305 – –<br />
Tax credits not recognized .......<br />
Amortization of premium/<br />
(11,476) (11,413) (776) (130)<br />
goodwill .............................. (7,686) – (7,686) –<br />
Others .....................................<br />
Income tax and Social<br />
Contribution – effective<br />
7,288 42,728 (1,232) (6,438)<br />
expense ............................... (622,305) (527,596) (116,565) 16,283<br />
13) – DEFERRED TARIFF ADJUSTMENT<br />
Aneel, through Homologating Resolution 71, which was published with<br />
backdated effect on April 4, 2004, defined the results of the periodic tariff<br />
revision of <strong>Cemig</strong> Distribuição.<br />
The periodic tariff revision includes the repositioning of the electricity retail<br />
supply tariffs at a level compatible with the preservation of the economicfinancial<br />
equilibrium of the concession contract, providing sufficient<br />
revenue to cover efficient operational costs and adequate remuneration of<br />
the investments.<br />
The average adjustment applied to <strong>Cemig</strong>’s tariffs on April 8, 2003, on a<br />
provisional basis, was 31,53%, However, as described in the Resolution<br />
mentioned, the final tariff repositioning for <strong>Cemig</strong> should be 44,41%, The<br />
percentage difference of 12,88% was to be offset through an increase of<br />
R$ 301,334, at April 2003 values, in the tariff adjustments scheduled to<br />
take place in 2004 through 2007, cumulatively.<br />
The last portion that should have been included in the tariff adjustment of<br />
April 8, 2007 was postponed to the year 2008.<br />
The difference between the tariff repositioning to which <strong>Cemig</strong> Distribuição<br />
has the right and the tariff actually charged to consumers is recognized as<br />
a Regulatory Asset.
The amounts relating to the deferred tariff adjustment are updated in<br />
monetary terms by the IGP-M Index plus interest of 11,26% per year.<br />
Consolidated<br />
2007 2006<br />
Deferred tariff adjustment –<br />
since April 8, 2003 ...................................... 949,612 949,612<br />
Interest (defi ned by Aneel – 11,26% p,a,) ........ 434,188 351,044<br />
Monetary updating – IGP-M Infl ation Index ....... 189,763 137,107<br />
(–) Amounts raised ......................................... (1,028,330) (519,044)<br />
545,233 918,719<br />
Current assets ................................................. 463,491 791,231<br />
Non-current assets .......................................... 81,742 127,488<br />
Additionally, deferred taxes applicable to actual revenue were recognized,<br />
the balance of which on December 31 2007 was R$ 235,813<br />
14) – ACCOUNTS RECEIVABLE FROM M<strong>IN</strong>AS GERAIS STATE<br />
GOVERNMENT AND RECEIVABLES FUND (“FIDC”)<br />
The outstanding credit balance receivable on the CRC (Results<br />
Compensation) Account was passed to the State of Minas Gerais in 1995,<br />
under an agreement to assign that account (“the CRC Contract”), in<br />
accordance with Law 8724/93, for monthly amortization over 17 years<br />
starting on June 1, 1998, with annual interest of 6% plus inflation<br />
correction by the Ufir index.<br />
On January 24, 2001 the First Amendment was signed, replacing the<br />
inflation indexation unit in the contract, which was the Ufir, with the<br />
IGP-DI, backdated to November 2000, due to the abolition of the Ufir<br />
in October 2000.<br />
In October 2002 the Second and Third Amendments to the CRC Contract<br />
were signed, setting new conditions for amortization of the credits<br />
receivable from the State of Minas Gerais, The main clauses were: (i) the<br />
monetary updating by the IGP-DI inflation index; (ii) amortization of the<br />
two amendments by May 2015; (iii) interest rates at 6,00% and 12,00%<br />
for the Second and Third Amendments, respectively; and (iv) guarantee of<br />
full retention of the dividends owed to Minas Gerais state for settlement of<br />
the Third Amendment.<br />
a) The Fourth Amendment to the CRC contract<br />
As a result of the default in the receipt of the credits referred to in the<br />
Second and Third Amendments, the Fourth Amendment was signed with<br />
the aim of making possible the full receipt of the CRC through retention<br />
of dividends as and when the government of the state becomes entitled to<br />
them, This agreement was approved by the Extraordinary General Meeting<br />
of Stockholders completed on January 12, 2006.<br />
The Fourth Amendment to the CRC contract had backdated effect on the<br />
outstanding balance existing on December 31, 2004, and consolidated<br />
the amounts receivable under the Second and Third Amendments,<br />
corresponding to R$ 2,941,599 on December 31, 2004.<br />
As a result of the reconciliation made between <strong>Cemig</strong> and the State of the<br />
criteria for updating of the contract, since its signature, as established in<br />
the sole sub-paragraph of Clause 1 of the fourth amendment to the CRC<br />
contract, the balance payable will be reduced by R$ 102,131, arriving at<br />
the value of R$2,839,468, on base date December 31, 2004 which updated<br />
to December 31, 2007 is R$3,661,160.<br />
The government of the state will amortize the debit in 61 consecutive halfyearly<br />
installments, becoming due by June 30 and December 31 of each<br />
year, over the period from June 2005 to June 2035 inclusive, The amounts<br />
of the portions for amortization of the principal, updated by the IGP-DI<br />
index, increase over the period, from R$ 28,828 for the 1st, and R$ 83,686<br />
for the 61st – expressed in currency of December 31, 2007.<br />
The amortization of the debt will primarily be effected by means of<br />
retention of 65,00% of the minimum obligatory dividends payable to the<br />
40<br />
government of the State, If the amount is not sufficient to amortize the<br />
portion becoming due the retention may be of up to 65% of all and any<br />
amount of extraordinary dividends or Interest on Equity, These dividends<br />
retained are used to amortize the contract in the following order: (i)<br />
settlement of past due installments; (ii) settlement of an installment for the<br />
current half-year; (iii) anticipated settlement of up to 2 installments; and,<br />
(iv) amortization of the debtor balance.<br />
On December 31, 2007 the installments of the contract becoming due on<br />
June 30 and December 31, 2008 had already been amortized.<br />
The signature of the Fourth Amendment to the contract provides that, so as<br />
to ensure complete receipt of the credits, the provisions of Clause 11 of the<br />
Bylaws must be obeyed – they define certain targets to be met annually in<br />
conformity with the Strategic Plan, which must be complied with.<br />
Target Required Ratio<br />
Debt/Ebitda Less than 2 (1)<br />
Debt/(Debt plus stockholders equity) Less than or equal to 40,00% (2)<br />
Capital expenditure and acquisition Less than or equal to 40,00% of Ebitda (3)<br />
of assets<br />
Ebitda = earnings before interest, taxes on profit, depreciation and<br />
amortization.<br />
(1) Less than 2,5 in certain situations specified in the Bylaws.<br />
(2) Less than equal to 50% in certain situations specified in the Bylaws.<br />
(3) For 2006 and 2007 the indices required are 65,00% and 55,00%<br />
respectively.<br />
b) Transfer of the CRC credits to a Receivables Investment Fund<br />
(“FIDC”)<br />
On January 27, 2006 <strong>Cemig</strong> transferred the CRC credits into a Receivables<br />
Investment Fund (“FIDC”), The amount of the FIDC was established by<br />
the administrator based on long-term financial projections for <strong>Cemig</strong>,<br />
estimating the dividends that will be retained for amortization of the<br />
outstanding debtor balance on the CRC contract, Based on these projections<br />
the FIDC was valued at a total of R$ 1,659,125, of which R$ 900,000 in<br />
senior units and R$ 759,125 in subordinated units.<br />
The senior units were subscribed and acquired by financial institutions and will<br />
be amortized in 20 half-yearly installments, from June 2006, updated by the<br />
variation of the CDI + 1,7% of interest per year, guaranteed by <strong>Cemig</strong>.<br />
The subordinated units were subscribed by <strong>Cemig</strong> and correspond to the<br />
difference between the total value of the FIDC and the value of the senior units.<br />
The updating of the subordinated units corresponds to the difference<br />
between the valuation of the FIDC using a rate of 10,00% per year, and<br />
the increase in value of the senior units by the variation of the CDI plus<br />
interest of 1,70% per year.<br />
The movement on the FIDC account in 2007 was as follows:<br />
Balance at December 31, 2006 ................................<br />
Consolidated and<br />
Holding company<br />
1,726,293<br />
Monetary updating on the senior units ....................... 123,335<br />
Monetary updating on the subordinated units ............ 35,656<br />
Amortization of the senior units ................................. (114,740)<br />
Amortization of the subordinated units ...................... (7,267)<br />
Balance at December 31, 2007 ...................................<br />
Balance at December 31, 2007<br />
1,763,277<br />
- Senior units held by third parties ............................. 990,386<br />
- Subordinated units held by <strong>Cemig</strong> ........................... 708,451<br />
Dividends held by the Fund ................................... 64,440<br />
772,891<br />
TOTAL ...................................................................... 1,763,277
<strong>Cemig</strong> made payments of dividends on December 28, 2007, which were<br />
used to amortize the senior and subordinated units, and operational<br />
expenses, of the FIDC, in the amount of R$ 62,252, R$ 899, and R$ 923<br />
respectively, However, the amortization was made in fact on January 2,<br />
2008,<br />
The dividends and Interest on Equity proposed by the Executive Board to<br />
the Board of Directors, to be distributed to stockholders for the business year<br />
2007, are posted in Current Liabilities, Of the dividends to be distributed,<br />
R$ 193,350 is payable to the Minas Gerais State Government, R$ 125,677<br />
will be retained for repayment of part of the due receivables on the CRC,<br />
The remaining amount of R$67,673 is to be paid to the government of the<br />
State of Minas Gerais,<br />
c) Consolidation criterion of the FIDC<br />
Due to the guarantee offered by <strong>Cemig</strong> of settlement of the senior units in<br />
the event that the dividends due to the state government are not sufficient<br />
for amortization of the installments, the Consolidated Financial Statements<br />
present the balance of the FIDC registered in full in <strong>Cemig</strong> and the senior<br />
units are presented as a debt under loans and financings in short and longterm<br />
liabilities, Similarly, in the consolidation the monetary updating of<br />
the FIDC was recognized in full as a financial expense, and in counterpart<br />
the amount of the monetary updating of the senior units was registered as<br />
a cost of debt,<br />
41<br />
15) REGULATORY ASSET – PIS/PASEP AND COF<strong>IN</strong>S<br />
Federal Laws 10637 and 10833 changed the bases of application, and<br />
increased the rate, of the PIS/Pasep and Cofins taxes, As a result of these<br />
alterations there was an increase in PIS/Pasep expenses from December<br />
2002 to March 2005 and in expenses on the Cofins tax from February 2004<br />
to June 2005,<br />
In view of the fact that this increase in the expense should be repaid to the<br />
company through tariffs, the credits were registered, in accordance with a<br />
criterion defined by Aneel, as a regulatory asset and there was a counterpart<br />
reduction in the expense on PIS/Pasep and Cofins taxes,<br />
Consolidated<br />
2007 2006<br />
<strong>Cemig</strong> Distribuição ..................... 116,127 298,510<br />
<strong>Cemig</strong> Geração e Transmissão ...... 826 –<br />
RME – Light ............................... 1,520 25,008<br />
118,473 323,518<br />
Current assets .............................. 57,593 107,959<br />
Long term assets .......................... 60,880 215,559<br />
16) <strong>IN</strong>VESTMENTS<br />
Consolidated Holding company<br />
2007 2006 2007 2006<br />
In subsidiaries and jointly controlled companies<br />
<strong>Cemig</strong> Geração e Transmissão ............................................................... – – 2,988,263 2,950,912<br />
<strong>Cemig</strong> Distribuição .............................................................................. – – 2,440,542 2,349,982<br />
Rio Minas Energia Participações ........................................................... – – 265,557 212,015<br />
Infovias ................................................................................................. – – 329,705 297,471<br />
GASMIG .............................................................................................. – – 192,098 152,317<br />
Rosal Energia ........................................................................................ – – 90,292 105,105<br />
Sá Carvalho ........................................................................................... – – 94,078 92,876<br />
Horizontes Energia ............................................................................... – – 66,349 66,098<br />
Usina Térmica Ipatinga ......................................................................... – – 65,848 65,488<br />
<strong>Cemig</strong> PCH .......................................................................................... – – 51,690 51,438<br />
<strong>Cemig</strong> Capim Branco Energia ............................................................... – – 51,706 46,484<br />
Companhia Transleste de Transmissão ................................................... – – 13,943 14,610<br />
UTE Barreiro ........................................................................................ – – 6,690 10,163<br />
Companhia Transudeste de Transmissão ................................................ – – 7,776 7,200<br />
Central Hidrelétrica Pai Joaquim .......................................................... – – 477 192<br />
Companhia Transirapé de Transmissão .................................................. – – 5,767 5,473<br />
Transchile ............................................................................................. – – 11,675 13,370<br />
Effi cientia ............................................................................................. – – 4,198 3,208<br />
Central Termelétrica de Cogeração ........................................................ – – 334 1,609<br />
Companhia de Transmissão Centroeste de Minas ................................... – – 6,703 6,662<br />
<strong>Cemig</strong> Trading ..................................................................................... – – 154 253<br />
Empresa Paraense de Transmissão de Energia–EPTE ............................. – – 14,362 14,942<br />
Empresa Norte de Transmissão de Energia–ENTE ................................ – – 28,508 27,026<br />
Empresa Regional de Transmissão de Energia–ERTE ............................ – – 6,266 6,019<br />
Empresa Amazonense de Transmissão de Energia–EATE ....................... – – 46,445 51,252<br />
Empresa Catarinense de Transmissão de Energia–ECTE ........................ 4,489 5,330<br />
Focus Soluções Tecnológicas .................................................................. – – 235 –<br />
– – 6,794,150 6,557,495<br />
In consortia ............................................................................................. 1,050,496 979,485 – –<br />
Goodwill on acquisition of the stake in Infovias ....................................... – – 3,077 7,272<br />
Goodwill on acquisition of the stake in Rosal Energia .............................. – – 38,680 31,597<br />
Goodwill on acquisition of the stake in EPTE .......................................... – – 26,297 27,420<br />
Goodwill on acquisition of the stake in ENTE ......................................... – – 38,984 40,549<br />
Goodwill on acquisition of the stake in ERTE.......................................... – – 8,927 9,286<br />
Goodwill on acquisition of the stake in EATE.......................................... – – 147,739 154,047<br />
Goodwill on acquisition of the stake in ECTE ......................................... – – 7,153 7,467<br />
In other investments ................................................................................ 20,358 19,390 3,506 3,711<br />
1,070,854 998,875 274,363 281,349<br />
1,070,854 998,875 7,068,513 6,838,844
a) The main information on the investees is as follows:<br />
BALANCE AT DECEMBER 31, 2007 January to December 2007<br />
Controlled companies<br />
Number of<br />
shares<br />
<strong>Cemig</strong> stake<br />
%<br />
Registered<br />
capital<br />
Stockholders’<br />
equity Dividends<br />
Profi t<br />
(Loss)<br />
<strong>Cemig</strong> Geração e Transmissão ................................................ 2,896,785,358 100.00 2,896,785 2,988,263 709,673 747,024<br />
<strong>Cemig</strong> Distribuição ............................................................... 2,261,997,787 100.00 2,261,998 2,440,542 680,648 771,208<br />
Infovias .................................................................................. 331,066,000 100.00 300,083 329,705 26,801 56,422<br />
Rosal Energia ........................................................................ 86,944,467 100.00 86,944 90,292 18,008 18,956<br />
Sá Carvalho ............................................................................ 860,000,000 100.00 86,833 94,078 22,842 24,044<br />
GASMIG ............................................................................... 196,155,000 55.19 154,657 348,051 13,044 83,593<br />
Horizontes Energia ................................................................ 64,257,563 100.00 64,258 66,349 4,748 8,184<br />
Usina Térmica Ipatinga ......................................................... 64,174,281 100.00 64,174 65,848 6,840 7,200<br />
<strong>Cemig</strong> PCH........................................................................... 50,952,000 100.00 50,953 51,690 15,296 14,742<br />
<strong>Cemig</strong> Capim Branco Energia ................................................ 45,528,000 100.00 45,528 51,706 38,163 39,166<br />
Companhia Transleste de Transmissão .................................... 33,051,000 25.00 49,569 55,776 2,363 7,572<br />
UTE Barreiro ......................................................................... 11,918,000 100.00 11,918 6,690 – (2,742)<br />
Companhia Transudeste de Transmissão ................................. 301,000 24.00 30,000 32,400 179 3,148<br />
Central Hidrelétrica Pai Joaquim........................................... 1,000 100.00 1 477 – 12<br />
Companhia Transirapé de Transmissão ................................... 1,000 24.50 22,340 23,540 – 1,200<br />
Transchile .............................................................................. 22,000 49.00 23,827 23,827 – –<br />
Effi cientia .............................................................................. 3,742,249 100.00 3,742 4,198 205 1,195<br />
Central Termelétrica de Cogeração ......................................... 1,000 100.00 1 334 – 334<br />
Companhia de Transmissão Centroeste de Minas .................... 50,000 51.00 51 13,143 – –<br />
Rio Minas Energia ................................................................. 12,000 25.00 709,310 1,062,224 94,228 591,113<br />
<strong>Cemig</strong> Trading ...................................................................... 160,000 100.00 160 154 51 (8)<br />
Empresa Paraense de Transmissão de Energia - ETEP ............ 45,000,010 18.19 63,475 78,183 5,840 20,613<br />
Empresa Norte de Transmissão de Energia - ENTE ................ 100,840,000 18.35 109,907 155,355 7,868) 40,768<br />
Empresa Regional de Transmissão de Energia - ERTE ............ 23,400,000 18.35 23,400 34,146 1,542 9,749<br />
Empresa Amazonense de Transmissão de Energia - EATE ...... 180,000,010 15.79 250,009 289,561 25,227 90,469<br />
Empresa Catarinense de Transmissão de Energia ECTE .......... 42,095,000 7.50 42,095 59,844 2,213 18,274<br />
Focus Soluções Tecnológicas ................................................... 2,000 49.00 200 1,150 – –<br />
BALANCE AT DECEMBER 31, 2006 January to December 2006<br />
Controlled companies<br />
Number of<br />
shares<br />
<strong>Cemig</strong> stake<br />
%<br />
Registered<br />
Capital<br />
Stockholders’<br />
equity Dividends<br />
Profi t<br />
(Loss)<br />
<strong>Cemig</strong> Geração e Transmissão ............................................. 2,896,785,358 100.00 2,896,785 2,950,912 583,403 614,108<br />
<strong>Cemig</strong> Distribuição ............................................................ 2,261,997,787 100.00 2,261,998 2,349,982 731,089 769,567<br />
Infovias ............................................................................... 331,066,000 100.00 331,066 247,514 – 23,405<br />
Rosal Energia ..................................................................... 86,944,467 100.00 86,945 105,105 30,630 18,239<br />
Sá Carvalho ......................................................................... 860,000,000 100.00 86,833 92,876 44,185 24,583<br />
GASMIG ............................................................................ 196,155,000 55.19 137,058 275,974 13,370 79,620<br />
Horizontes Energia ............................................................. 64,257,563 100.00 64,258 66,098 16,384 11,809<br />
Usina Térmica Ipatinga ...................................................... 64,174,281 100.00 64,174 65,488 13,378 6,818<br />
<strong>Cemig</strong> PCH........................................................................ 50,952,000 100.00 50,952 51,438 9,232 9,718<br />
<strong>Cemig</strong> Capim Branco Energia ............................................. 45,528,000 100.00 45,528 46,484 18,171 19,127<br />
Companhia Transleste de Transmissão ................................. 33,051,000 25.00 49,569 58,436 576 8,837<br />
UTE Barreiro ...................................................................... 11,918,000 100.00 11,918 10,163 – (1,755)<br />
Companhia Transudeste de Transmissão .............................. 301,000 24.00 50,000 30,000 – –<br />
Central Hidrelétrica Pai Joaquim........................................ 1,000 100.00 1 192 5,503 180<br />
Companhia Transirapé de Transmissão ................................ 1,000 24.50 22,340 22,340 – –<br />
Transchile ........................................................................... 22,000 49.00 27,286 27,286 – –<br />
Effi cientia ........................................................................... 3,742,249 100.00 3,742 3,208 238 414<br />
Central Termelétrica de Cogeração ...................................... 1,000 100.00 1 1,609 2,794 1,602<br />
Companhia de Transmissão Centroeste de Minas ................. 50,000 51.00 51 13,063 – –<br />
Rio Minas Energia .............................................................. 12,000 25.00 709,310 848,056 – 138,746<br />
<strong>Cemig</strong> Trading ................................................................... 10,000 100.00 160 253 – 93<br />
Empresa Paraense de Transmissão de Energia - ETEP ......... 45,000,010 17.51 58,751 85,335 – 19,489<br />
Empresa Norte de Transmissão de Energia - ENTE ............. 100,840,000 18.35 100,840 138,986 43,005 34,492<br />
Empresa Regional de Transmissão de Energia - ERTE ......... 23,400,000 18.35 23,400 30,702 7,485 8,848<br />
Empresa Amazonense de Transmissão de Energia - EATE ... 180,000,010 14.94 232,328 343,147 – 84,368<br />
Empresa Catarinense de Transmissão de Energia ECTE ....... 42,095,000 7.50 42,095 64,783 22,028 26,486<br />
42
The movement on investment in subsidiaries is as follows:<br />
Equity Injection of Dividends<br />
31.12.2006 income capital proposed Others 31.12.2007<br />
<strong>Cemig</strong> Geração e Transmissão ............................................. 2,950,912 747,024 – (709,673) – 2,988,263<br />
<strong>Cemig</strong> Distribuição ............................................................ 2,349,982 771,208 – (680,648) – 2,440,542<br />
Infovias ............................................................................... 297,471 56,422 – (26,801) 2,613 329,705<br />
Rosal Energia ..................................................................... 105,105 18,956 – (18,008) (15,761) 90,292<br />
Sá Carvalho ......................................................................... 92,876 24,044 – (22,842) – 94,078<br />
GASMIG ........................................................................... 152,317 46,137 9,713 (13,044) (3,025) 192,098<br />
Horizontes Energia ............................................................. 66,098 8,184 – (4,748) (3,185) 66,349<br />
Usina Térmica Ipatinga ...................................................... 65,488 7,200 – (6,840) – 65,848<br />
<strong>Cemig</strong> PCH........................................................................ 51,438 14,742 – (15,296) 806 51,690<br />
<strong>Cemig</strong> Capim Branco Energia ............................................. 46,484 39,166 4,219 (38,163) – 51,706<br />
Companhia Transleste de Transmissão ................................. 14,610 1,891 – (2,363) (195) 13,943<br />
UTE Barreiro ...................................................................... 10,163 (2,742) – – (731) 6,690<br />
Companhia Transudeste de Transmissão .............................. 7,200 757 – (179) (2) 7,776<br />
Central Hidrelétrica Pai Joaquim........................................ 192 12 – – 273 477<br />
Companhia Transirapé de Transmissão ................................ 5,473 293 – – 1 5,767<br />
Transchile ........................................................................... 13,370 – – – (1,695) 11,675<br />
Effi cientia ........................................................................... 3,208 1,195 – (205) – 4,198<br />
Central Termelétrica de Cogeração ...................................... 1,609 334 – – (1,609) 334<br />
Companhia de Transmissão Centroeste de Minas ................. 6,662 – 41 – – 6,703<br />
Rio Minas Energia .............................................................. 212,015 147,779 – (94,228) (9) 265,557<br />
<strong>Cemig</strong> Trading ................................................................... 253 (8) – (51) (40) 154<br />
Empresa Paraense de Transmissão de Energia - ETEP ......... 14,942 3,788 – (5,840) 1,472 14,362<br />
Empresa Norte de Transmissão de Energia - ENTE ............. 27,026 7,481 589 (7,868) 1,280 28,508<br />
Empresa Regional de Transmissão de Energia - ERTE ......... 6,019 1,789 – (1,542) – 6,266<br />
Empresa Amazonense de Transmissão de Energia – EATE ... 51,252 14,509 2,992 (25,227) 2,919 46,445<br />
Empresa Catarinense de Transmissão de Energia - ECTE ..... 5,330 1,369 – (2,213) 3 4,489<br />
Focus Soluções Tecnológicas ................................................ – – 235 – – 235<br />
6,557,495 1,911,530 17,789 (1,675,779) (16,885) 6,794,150<br />
The full balances of the subsidiaries that were consolidated proportionally in 2007 are as follows:<br />
Gasmig Transleste Transirapé Centroeste Transudeste Transchile<br />
ASSETS<br />
Current ................................................................................... 505,759 10,065 4,246 96 5,910 9,495<br />
Non-current ........................................................................... 186,388 118,911 69,317 13,090 82,123 78,736<br />
Total fi xed assets .....................................................................<br />
LIABILITIES<br />
692,147 128,976 73,563 13,186 88,033 88,231<br />
Current ................................................................................... 344,059 11,524 9,553 43 11,738 64,404<br />
Non-current ........................................................................... 37 61,676 40,470 – 43,895 –<br />
Stockholders’ equity ............................................................... 348,051 55,776 23,540 13,143 32,400 23,827<br />
Total fi xed assets .....................................................................<br />
<strong>IN</strong>COME ST<strong>ATEM</strong>ENT<br />
692,147 128,976 73,563 13,186 88,033 88,231<br />
Gross revenue from sales ......................................................... 538,755 20,980 6,923 – 11,241 –<br />
Deductions from gross revenue ............................................... (118,867) (1,500) (492) – (797) –<br />
Net sales revenue .................................................................... 419,888 19,480 6,431 – 10,444 –<br />
Cost of sales ............................................................................ (279,459) – – – – –<br />
Gross profi t ............................................................................ 140,429 19,480 6,431 – 0,444 –<br />
General and administrative expenses ....................................... (47,495) (6,635) (2,123) – (3,249) –<br />
NET F<strong>IN</strong>A<strong>NCIAL</strong> REVENUE (EXPENSES) ........................ 20,258 (3,367) (2,299) – (3,051) –<br />
OPERATIONAL PROFIT ..................................................... 113,192 9,478 2,009 – 4,144 –<br />
Income tax and Social Contribution ........................................ (29,599) (1,906) (809) – (996) –<br />
Net profi t for the year ............................................................. 83,593 7,572 1,200 – 3,148 –<br />
RME ETEP ENTE ERTE EATE ECTE<br />
ASSETS<br />
Current ................................................................................ 2,920,232 38,152 36,594 6,851 189,649 21,495<br />
Non-current ........................................................................ 6,026,304 133,781 422,402 75,380 606,395 137,017<br />
Total fi xed assets ..................................................................<br />
LIABILITIES<br />
8,946,536 171,933 458,996 82,231 796,044 158,512<br />
Current ................................................................................ 1,737,121 22,143 83,950 12,768 125,944 26,650<br />
Non-current ........................................................................ 6,147,191 71,607 219,691 35,317 380,539 72,018<br />
Stockholders’ equity............................................................. 1,062,224 78,183 155,355 34,146 289,561 59,844<br />
Total fi xed assets ..................................................................<br />
<strong>IN</strong>COME ST<strong>ATEM</strong>ENT<br />
8,946,536 171,933 458,996 82,231 796,044 158,512<br />
Gross revenue from sales ...................................................... 8,156,915 51,055 114,019 20,272 219,980 49,549<br />
Deductions from gross revenue ............................................ (3,145,987) (3,525) (8,134) (1,449) (15,137) (3,497)<br />
Net sales revenue ................................................................. 5,010,928 47,530 105,885 18,823 204,843 46,052<br />
Cost of sales ......................................................................... (2,585,781) – – – – –<br />
Gross profi t .......................................................................... 2,425,147 47,530 105,885 18,823 204,843 46,052<br />
General and administrative expenses .................................... (1,767,986) (9,916) (22,854) (4,770) (42,226) (7,656)<br />
NET F<strong>IN</strong>A<strong>NCIAL</strong> REVENUE (EXPENSES) ...................... (209,013) (6,750) (22,851) (3,483) (28,346) (10,536)<br />
OPERATIONAL PROFIT .................................................. 448,148 30,864 60,180 10,570 134,271 27,860<br />
Income tax and Social Contribution ..................................... 604,886 (10,251) (19,412) (821) (43,802) (9,586)<br />
Profi t before minority interests ........................................... 1,053,034 20,613 40,768 9,749 90,469 18,274<br />
Minority interests ................................................................ (461,921) – – – – –<br />
Net profi t for the year .......................................................... 591,113 20,613 40,768 9,749 90,469 18,274<br />
43
) Stockholding in Light<br />
A discount was ascertained on the acquisition, corresponding to the<br />
difference between the amount paid by RME and the book value of the<br />
stake in the stockholders’ equity of Light, in the amount of R$ 364,961<br />
(<strong>Cemig</strong>’s portion is 25,00%), This discount arises from the estimate of<br />
the results of future years as a function of the commercial operation of<br />
the electricity distribution and generation concessions and thus is being<br />
amortized from October 2006 to May 2026, the date of the termination<br />
of the distribution concession on a linear basis, In the consolidation the<br />
amount of the discount (R$ 86,236) is presented as Future earnings.<br />
On May 16, 2007 the Brazilian Development Bank (“BNDES”) converted<br />
90% of its debentures into shares in Light S,A,, corresponding to 31,40%<br />
of the registered capital, This reduced the stake held by Rio Minas<br />
Energia Participações S,A, (“RME”) in Light S,A, 79,39% to 54,20%,<br />
and consequently the stake held by <strong>Cemig</strong> from 19,85% to 13,55%,<br />
Subsequently, on October 19, 2007, the BNDES exercised the right given<br />
by 72,727 warrants, which reduced RME’s stake to 52,25%, and the stake<br />
held by <strong>Cemig</strong> to 13,06%.<br />
c) Acquisition of stake in electricity transmission companies<br />
Premium/goodwill on acquisition of electricity companies: The goodwill<br />
on the acquisition of the companies Empresa Amazonense de Transmissão<br />
de Energia S,A, EATE, Empresa Paraense de Transmissão de Energia S,A,<br />
-ETEP, Empresa Norte de Transmissão de Energia S,A, -ENTE, Empresa<br />
Regional de Transmissão de Energia S,A,- ERTE and Empresa Catarinense<br />
de Transmissão de Energia S,A, - ECTE,, corresponding to the amount<br />
paid and the book value of the stake in the stockholders’ equity of the<br />
jointly controlled subsidiaries, arises from expectation of future earnings<br />
on the basis of the commercial operation of the transmission concessions,<br />
The amortization of the goodwill will take place over the remaining period<br />
of validity of the concessions (from August 2006 to 2030/2032), In the<br />
consolidated financial statements the value of the premium was included<br />
in PP&E – Intangible.<br />
d) Investments in Infovias<br />
The goodwill on the acquisition of Infovias is attributable to the expectation<br />
of future profitability, calculated on the projected cash flow and is being<br />
amortized in a linear manner over the period from January 2005, to<br />
June 2012, In the consolidated statements the value of the goodwill was<br />
transferred to Deferred.<br />
Sale of Way TV by Infovias<br />
At an auction held on July 27, 2006 Way TV Belo Horizonte S,A,, an<br />
indirect subsidiary of <strong>Cemig</strong> (through its investment of 65,25% in Infovias)<br />
was sold in full (100% of the shares) to TNL PCS Participações S,A,, a<br />
subsidiary of Tele Norte Leste Participações S,A, Of the total sale price,<br />
R$ 103 million was payable to Infovias, The price represents a premium<br />
of 65% on the minimum auction price, and the sale was conditional upon<br />
approval by the Brazilian Telecoms Regulator, Anatel.<br />
On October 23, 2007 Anatel approved the transaction, pending publication in<br />
the federal Official Gazette, after reconsidering a decision made on March 19,<br />
2007, when it had refused approval for the transfer of stockholding control.<br />
The profit of Infovias from this sale, in the amount of R$ 54,079,000 was<br />
recognized in the 4th quarter of 2007, when the approval was published in<br />
the federal Official Gazette.<br />
Loan Contracts<br />
On November 14, 2007 , Infovias and CEMIG signed a loan contract in the<br />
amount of R$89,957 thousand and with the financial charges is 101,5% of<br />
the variation of CDI, This contract was extinguished by CEMIG in January,<br />
2008 through share reduction of the registered capital of Infovias.<br />
e) Consortia<br />
<strong>Cemig</strong> participates in consortia for electricity generation concessions, for<br />
which companies with an independent legal existence were not constituted<br />
to administer the object of the concession, the controls being maintained<br />
in the books of account of <strong>Cemig</strong>, of the specific portion equivalent to the<br />
investments made, as follows:<br />
44<br />
Stake<br />
Average<br />
annual<br />
in the depreciaConsoliConsoli- energy tion rate dateddated generated % 2007 2006<br />
Subsidiary<br />
In progress<br />
Porto Estrela Plant ........ 33.33 2.48 38,625 38,625<br />
Igarapava Plant .............. 14.50 2.58 55,554 55,554<br />
FuniI Plant .................... 49.00 2.77 171,856 171,856<br />
Queimado Plant ............ 82.50 2.45 193,599 193,599<br />
Aimorés Plant ............... 49.00 2.50 512,946 512,946<br />
Capim Branco I Plant .... 21.05 2.51 49,742 25,378<br />
Accumulated depreciation (85,268) (57,645)<br />
Total in operation ..........<br />
In progress<br />
937,054 940,313<br />
Queimado Plant ............ 82.50 13,125 297<br />
FuniI Plant .................... 49.00 9,531 9,041<br />
Aimorés Plant ............... 49.00 23,369 7,073<br />
Baguari Plant ................<br />
Capim Branco I<br />
34.00 67,417 4,826<br />
and II Plant ................. 21.05 – 17,935<br />
Total under construction 113,442 39,172<br />
Total consortia .................. 1,050,496 979,485<br />
The depreciation of the goods contained in the property, plant and<br />
equipment of the consortia is calculated by the linear method, based on<br />
rates established by Aneel,<br />
The interests of the other members of the consortia in the energy generated<br />
by the projects are as follows:<br />
In consortia Other stockholders<br />
Minority<br />
shares (%)<br />
Porto Estrela Plant Companhia de Tecidos Norte<br />
de Minas Gerais – COTEM<strong>IN</strong>AS<br />
33.34<br />
Companhia Vale do Rio Doce – CVRD 33.33<br />
Igarapava Plant Companhia Vale do Rio Doce – CVRD 38.15<br />
Companhia Mineira de Metais – CMN 23.93<br />
Companhia Siderúrgica Nacional – CSN 17.92<br />
Mineração Morro Velho – MMV 5.50<br />
FuniI Plant Companhia Vale do Rio Doce – CVRD 51.00<br />
Queimado Plant Companhia Energética de Brasília 17.50<br />
Aimorés Plant Companhia Vale do Rio Doce – CVRD 51.00<br />
Capim Branco I Companhia Vale do Rio Doce – CVRD 48.43<br />
and II Plant Comercial e Agrícola Paineiras Ltda, 17.89<br />
Companhia Mineira de Metais – CMN 12.63<br />
Baguari Plant Furnas Centrais Elétricas S,A, 15.00<br />
Baguari I Geração de Energia Elétrica S,A, 51.00
17) – ASSETS AND <strong>IN</strong>TANGIBLE ASSETS<br />
Consolidated<br />
2007<br />
Accumulated<br />
2006<br />
Historic cost depreciation Net amounts Net amounts<br />
In progress...................................................................... 20,933,085 (8,816,314) 12,116,771 11,118,138<br />
- Distribution ................................................................ 10,846,123 (4,699,441) 6,146,682 5,018,455<br />
Intangible ................................................................. 93,719 (53,326) 40,393 20,686<br />
Land .......................................................................... 32,646 – 32,646 31,044<br />
Reservoirs, dams and water courses ............................ 304,280 (149,416) 154,864 147,745<br />
Machines and equipment ........................................... 10,328,443 (4,450,617) 5,877,826 4,799,443<br />
Vehicles ..................................................................... 65,422 (29,600) 35,822 14,298<br />
Furniture and utensils ............................................... 21,613 (16,482) 5,131 5,239<br />
- Generation .................................................................. 7,298,823 (2,948,000) 4,350,823 4,517,423<br />
Intangible ................................................................. 86,821 (44,448) 42,373 48,586<br />
Land .......................................................................... 202,333 – 202,333 219,858<br />
Reservoirs, dams and water courses ............................ 3,890,828 (1,369,511) 2,521,317 2,594,150<br />
Reservoirs, dams and water courses ............................ 909,115 (345,623) 563,492 631,347<br />
Machines and equipment ........................................... 2,203,146 (1,182,666) 1,020,480 1,022,484<br />
Vehicles ..................................................................... 3,211 (2,809) 402 523<br />
Furniture and utensils ............................................... 3,369 (2,943) 426 475<br />
- Transmission ............................................................... 1,833,289 (652,304) 1,180,985 1,105,334<br />
Intangible ................................................................. 239,930 (2,321) 237,609 245,336<br />
Land .......................................................................... 2,226 – 2,226 2,973<br />
Reservoirs, dams and water courses ............................ 103,817 (53,818) 49,999 49,388<br />
Machines and equipment ........................................... 1,486,295 (595,516) 890,779 807,410<br />
Vehicles ..................................................................... 301 (134) 167 60<br />
Furniture and utensils ............................................... 720 (515) 205 167<br />
- Administration ............................................................ 550,072 (358,565) 191,507 160,621<br />
Intangible ................................................................. 145,293 (92,285) 53,008 31,539<br />
Land .......................................................................... 3,662 – 3,662 3,995<br />
Reservoirs, dams and water courses ............................ 77,190 (39,924) 37,266 37,894<br />
Machines and equipment ........................................... 233,064 (159,003) 74,061 68,941<br />
Vehicles ..................................................................... 44,268 (31,588) 12,680 7,252<br />
Furniture and utensils ............................................... 46,595 (35,765) 10,830 11,000<br />
- Telecommunications ................................................... 321,017 (134,657) 186,360 251,764<br />
Intangible ................................................................. – – – 24,109<br />
Land .......................................................................... 70 – 70 70<br />
Reservoirs, dams and water courses ............................ 55 (7) 48 151<br />
Machines and equipment ........................................... 320,488 (134,390) 186,098 227,052<br />
Furniture and utensils ............................................... 404 (260) 144 382<br />
- Gas .............................................................................. 83,761 (23,347) 60,414 64,541<br />
Intangible ................................................................. 780 – 780 577<br />
Land .......................................................................... 42 – 42 42<br />
Reservoirs, dams and water courses ............................ 2,198 (479) 1,719 1,230<br />
Machines and equipment ........................................... 80,382 (22,727) 57,655 62,455<br />
Furniture and utensils ............................................... 359 (141) 218 237<br />
In progress...................................................................... 1,496,755 – 1,496,755 1,961,595<br />
- Distribution ................................................................ 1,503,768<br />
Intangible ................................................................. 39,019 – 39,019 46,100<br />
Fixed assets ................................................................ 812,814 – 812,814 1,457,668<br />
- Generation .................................................................. 116,281<br />
Intangible ................................................................. 26,969 – 26,969 1,424<br />
Fixed assets ................................................................ 257,703 – 257,703 114,857<br />
- Transmission ............................................................... 163,733<br />
Intangible ................................................................. 364 – 364 4,323<br />
Fixed assets ................................................................ 106,785 – 106,785 159,410<br />
- Administration ............................................................ 148,285<br />
Intangible ................................................................. 91,208 – 91,208 71,551<br />
Fixed assets ................................................................ 126,185 – 126,185 76,734<br />
- Telecommunications ................................................... 6,810 – 6,810 6,611<br />
- Gas .............................................................................. 28,898 – 28,898 22,917<br />
Total fi xed and intangible assets ................................... 22,429,840 (8,816,314) 13,613,526 13,079,733<br />
Special Obligations linked to the concession ..................... (2,518,602) – (2,518,602) (2,250,076)<br />
Net fi xed and intangible assets ..................................... 19,911,238 (8,816,314) 11,094,924 10,829,657<br />
45
Special Obligations refer basically to the contributions by consumers for<br />
execution of the undertakings necessary to comply with requests for retail<br />
supply of electricity, and any settlement of these obligations depends<br />
on the will of Aneel, at the termination of the distribution concessions,<br />
by reduction of the residual value of the fixed asset for the purposes of<br />
determining the amount which the Concession-granting Power will pay to<br />
the concession holder.<br />
Under Aneel Resolution 234 of October 31, 2006, and Aneel Circular<br />
1314/2007, of June 27, 2007, the balances of the “Special Obligations”<br />
linked to assets will now be amortized as from the second cycle of tariff<br />
reviews, which in the case of <strong>Cemig</strong> is from April 8, 2008, at a rate yet to be<br />
set by Aneel, corresponding to the average rate of the assets in service.<br />
The amount of R$ 307,389 is recorded in Fixed assets in progress –<br />
Distribution on December 31, 2007 (R$930,639 on December 31, 2006),<br />
relating to the “Light for Everyone” program.<br />
Under the Light for Everyone Program, approximately 180,000 consumers<br />
(unaudited information) were connected, mainly in rural areas, for a total<br />
cost, up to December 31, 2007, of R$ 1,598,709, The program is being<br />
carried out with funds from the federal and state governments, in the<br />
18) – SUPPLIERS<br />
46<br />
amounts, respectively, of R$ 593,302 and R$ 78,706, The remaining<br />
amount, R$ 726,701, will be financed with the Company’s own funds.<br />
Some land sites and buildings of the subsidiaries which were given in<br />
guarantee in law suits involving tax, labor-law, civil and other disputes<br />
are recorded in Fixed assets – Administration, These were posted at the<br />
amount of R$ 10,207 on December 31, 2007, net of depreciation.<br />
The average annual depreciation rates applied in the subsidiaries on<br />
December 31, 2007 are as follows:<br />
Generation<br />
Hydroelectric .................................................................. 2.47%<br />
Thermal .......................................................................... 3.90%<br />
Transmission ........................................................................ 3.03%<br />
Distribution (including the Associated<br />
Transmission System) .......................................................... 5.08%<br />
Administration and other ..................................................... 14.57%<br />
Telecommunications ............................................................. 8.34%<br />
Gas .................................................................................... 5.31%<br />
Consolidated Holding company<br />
2007 2006 2007 2006<br />
Current<br />
Wholesale supply and transport of electricity –<br />
Eletrobrás – energy from Itaipu ............................................................ 230,620 224,052 – –<br />
Furnas .................................................................................................. 78,231 65,816 – –<br />
CCEE ................................................................................................... 81,756 – – –<br />
Purchase of free energy during rationing ............................................... 25,797 34,543<br />
Passthrough to generators ..................................................................... 27,381 124,557 – –<br />
Others .................................................................................................. 142,796 187,102 – –<br />
586,581 636,070 – –<br />
Materials and services .............................................................................. 349,324 277,703 11,781 6,346<br />
Non–current<br />
Wholesale electricity supply –<br />
935,905 913,773 11,781 6,346<br />
Passthrough to generators ..................................................................... 314,989 227,482 – –<br />
Purchase of free energy during rationing ............................................... 25,803 44,446 – –<br />
340,792 271,928 – –<br />
Of the amounts owed to CCEE, a substantial part will be paid by September 2009, with inflation adjustment of the Selic plus 1,00% in interest per year The<br />
conclusion of some court proceedings in progress, brought by market agents, in relation to the interpretation of the rules in force at the time of the realization<br />
of the transactions in the ambit of the CCEE/MAE, may result in changes in the amounts recorded.<br />
19) TAXES, CHARGES AND CONTRIBUTIONS<br />
Consolidated Holding company<br />
2007 2006 2007 2006<br />
Current<br />
Income tax ............................................................................................ 121,991 65,872 – –<br />
Social Contribution ............................................................................... 47,974 25,250 – –<br />
ICMS .................................................................................................... 269,076 262,084 17,813 19,800<br />
Cofi ns ................................................................................................... 92,880 74,395 15,436 2,279<br />
Pasep .................................................................................................... 22,122 17,155 3,351 497<br />
Social security system ........................................................................... 21,637 17,110 1,358 –<br />
Others .................................................................................................. 32,711 25,147 1,234 415<br />
Deferred obligations<br />
608,391 487,013 39,192 22,991<br />
Income tax ......................................................................................... 303,540 299,152 – –<br />
Social Contribution ............................................................................ 109,420 107,695 – –<br />
Cofi ns ................................................................................................ 46,674 82,752 – –<br />
Pasep ................................................................................................. 10,134 17,965 – –<br />
469,768 507,564 – –<br />
Non–current<br />
Deferred obligations<br />
1,078,159 994,577 39,192 22,991<br />
Income tax ......................................................................................... 240,655 264,310 62,632 55,983<br />
Social Contribution ............................................................................ 65,747 94,500 22,547 20,154<br />
COF<strong>IN</strong>S ............................................................................................ 3,834 67,425 – 17,019<br />
PASEP ............................................................................................... – 12,522 – 3,695<br />
Others ............................................................................................... 8,904 10,764 – –<br />
319,140 449,521 85,179 96,851<br />
The net deferred obligations are related to the regulatory assets and liabilities and are owed to the extent that these assets and liabilities are received or paid, respectively.
20) – LOANS, F<strong>IN</strong>ANC<strong>IN</strong>GS AND DEBENTURES<br />
Consolidated<br />
31/12/2007 31/12/2006<br />
Principal<br />
Non-<br />
F<strong>IN</strong>ANC<strong>IN</strong>G SOURCES<br />
FOREIGN CURRENCY<br />
maturity Annual cost (%) Currency Current current Total Total<br />
ABN AMRO Bank – N, ( ) (3) ..................... 2013 6.00 US$ 74 88,565 88,639 106,989<br />
ABN AMRO Real S,A, (4) ...........................<br />
Banco do Brasil –A – Banco do Brasil S,A, –<br />
2009 6.35 US$ 13,263 12,842 26,105 47,101<br />
various bonds (1) ......................................... 2024 Various US$ 12,526 80,095 92,621 132,718<br />
Banco do Brasil S,A, (5) ................................ 2009 3.90 JPY 47 61,436 61,483 69,678<br />
Banco Paribas ................................................. 2012 5.89 EURO 3,220 10,169 13,389 17,692<br />
Banco Paribas ................................................. 2010 Libor + 1,875 US$ 21,388 30,855 52,243 63,114<br />
KFW ............................................................. 2016 4.50 EURO 1,721 13,764 15,485 18,601<br />
UNIBANCO (6) .......................................... 2009 6.50 US$ 115 8,256 8,371 153,434<br />
UNIBANCO (7) .......................................... 2009 5.50 US$ 25 3,611 3,636 4,389<br />
UNIBANCO (8) .......................................... 2009 5.00 US$ 66 15,202 15,268 18,428<br />
MBK Furukawa Sistemas S,A, / UNIBANCO ... 2008 Libor + 5.45 US$ 5,615 – 5,615 20,106<br />
Brazilian Nacional (10) ................................ 2024 Libor + Spread US$ 4,632 30,886 35,518 48,769<br />
Deutsche Bank (10) ..................................... 2010 Libor + 4.35 US$ – – – 87,118<br />
J, P, Morgan – Tranches A/B/C (10) .............. 2012 Libor + 3.00 US$ – – – 200,931<br />
Banco Inter–Americano del Desarrollo (13) .. 2026 6.34 US$ 21,896 – 21,896 –<br />
Others ............................................................ 2025 Various Various 7,797 8,476 16,273 25,684<br />
Debt in foreign currency ............................<br />
BRAZILIAN CURRENCY<br />
92,385 364,157 456,542 1,014,752<br />
Banco Credit Suisse First Boston S,A, ............ 2010 106.00 do CDI R$ 133 75,000 75,133 75,156<br />
Banco do Brasil ............................................... 2009 111.00 do CDI R$ 1,709 118,822 120,531 120,845<br />
Banco do Brasil ............................................... 2013 CDI + 1.70 R$ 4,211 109,277 113,488 114,299<br />
Banco do Brasil ............................................... 2013 107.60 do CDI R$ 10,161 126,000 136,161 138,698<br />
Banco do Brasil ............................................... 2014 104.10 do CDI R$ 23,732 1,200,000 1,223,732 1,228,391<br />
Banco Itaú – BBA ....................................... 2008 IGP–M + 10.48 R$ 179,846 – 179,846 174,148<br />
Banco Itaú – BBA ......................................... 2008 CDI + 2.00 R$ 40,850 – 40,850 40,961<br />
Banco Itaú – BBA .......................................... 2014 CDI + 1.70 R$ 14,033 304,338 318,371 317,035<br />
HSBC Bank Brasil S,A ................................. 2008 CDI + 2.00 R$ 61,275 – 61,275 61,442<br />
Banco Votorantim S,A, ................................... 2010 113.50 do CDI R$ 2,709 54,372 57,081 57,736<br />
Banco Votorantim S,A, ................................... 2013 CDI + 1.70 R$ 5,237 101,316 106,553 107,619<br />
Banco WESTLB do Brasil ............................... 2008 IGP–M + 10.48 R$ 44,961 – 44,961 43,544<br />
BNDES .......................................................... 2008 SELIC + 1.00 R$ 25,820 – 25,820 169,827<br />
Bradesco ......................................................... 2014 CDI + 1.70 R$ 18,631 379,073 397,704 399,177<br />
Debentures (12) ............................................ 2009 CDI + 1.20 R$ 6,402 349,556 355,958 357,071<br />
Debentures (12) ............................................ 2011 104 do CDI R$ 4,084 238,816 242,900 243,690<br />
Debentures – Minas Gerais state govt, (12) .... 2030 IGP–M R$ – 145,705 145,705 106,479<br />
Debentures – Minas Gerais state govt, (2) ...... 2031 IGP–M R$ – – – 30,009<br />
Debentures (12) ............................................ 2014 IGP–M + 10.50 R$ 16,452 278,217 294,669 273,659<br />
Debentures (12) ............................................ 2017 IPCA + 7.96 R$ 1,220 400,719 401,939 –<br />
ELETROBRÁS............................................... 2013 F<strong>IN</strong>EL + 7.50 a 8.50 R$ 19,219 59,665 78,884 94,823<br />
ELETROBRÁS............................................... 2023 UFIR, RGR + 6.00 a 8.00 R$ 47,046 290,576 337,622 213,038<br />
Santander ....................................................... 2013 CDI + 1.70 R$ 1,124 79,673 80,797 84,698<br />
UNIBANCO .................................................. 2009 CDI + 2.98 R$ 2,514 104,095 106,609 106,972<br />
UNIBANCO .................................................. 2013 CDI + 1.70 R$ 10,502 309,285 319,787 321,052<br />
UNIBANCO (2) .......................................... 2013 CDI + 1.70 R$ 5,735 73,587 79,322 80,379<br />
Caixa Econômica Federal ................................ 2008 101.50 do CDI R$ 200,425 – 200,425 –<br />
Itaú and Bradesco (9) .................................... 2015 CDI + 1.70 R$ 116,851 873,535 990,386 981,791<br />
Banco de Desenvolvimento de Minas Gerais ... 2025 10.00 R$ 699 10,315 11,014 11,590<br />
BNDES – F<strong>IN</strong>EM (10) ................................. 2014 TLJP + 4.30 R$ 232 60,642 60,874 –<br />
Debentures I and IV (10) ............................. 2010/2015 TJLP + 4.00 R$ 4,310 7,142 11,452 217,405<br />
Debentures V (10) ....................................... 2014 CDI + 1.50 R$ 18,170 237,500 255,670 –<br />
BNDES – Margin recovery (10) ................... 2007 SELIC + 1.00 R$ – – – 77,776<br />
CCB Bradesco (10) ...................................... 2017 CDI + 0.85 R$ 2,662 112,500 115,162 –<br />
Bradesco Tranche A/B (10) .......................... 2012 CDI + 2.00 R$ – – – 60,473<br />
Banco Itaú Tranche A/B (10) ....................... 2012 CDI + 2.00 R$ – – – 26,031<br />
Unibanco Tranche A/B (10) ......................... 2012 CDI + 2.00 R$ – – – 69,103<br />
BNDES – Principal Subcredit A/B/C/D (11) ....... 2014/2016 Various R$ 18,845 122,676 141,521 155,694<br />
Others ............................................................ 2007/2017 Various R$ 18,056 32,234 50,290 73,574<br />
Debt in Brazilian currency .......................... 927,856 6,254,636 7,182,492 6,634,185<br />
Total, consolidated ....................................... 1,020,241 6,618,793 7,639,034 7,648,937<br />
(1) Interest rates vary: 2.00 to 8.00% per year;<br />
(2)<br />
Six-month Libor plus spread of 0.81 to 0.88% per year;<br />
Loans of the holding company;<br />
(3) to (8) “Swaps” for exchange of rates were contracted, The following are the rates for the loans and financings taking the swaps into account: (3) CDI + 1.50% p,a,;<br />
(4) CDI + 2.12% p,a,; (5) 111.00% of CDI; (6) CDI + 2.98% p,a,; (7) and (8) CDI + 3.01% p,a,;<br />
(9) Refers to the senior units of the credit rights funds, See Explanatory Note nº14<br />
(10) Loans, financings and debentures of RME (Light S,A,);<br />
(11) Consolidated loans and financings of the transmission companies acquired in August 2006.<br />
(12) Debentures not convertible into shares, unsecured, without preference, nominal, book-entry.<br />
(13) Financing of Transchile.<br />
47
On December 2007, <strong>Cemig</strong> Distribuição concluded its second issue of non<br />
convertible debenture, issuing a single series of 40,000 non-convertible,<br />
unsecured debentures, with nominal unit value of R$ 10, totaling<br />
R$ 400,000, These have tenor of 120 months from the issue date,<br />
with interest paid annually and payment of the principal in three equal<br />
installments in December 2015, 2016 and 2017, The nominal value of the<br />
debentures will be updated by the variation of the IPCA inflation index,<br />
plus remuneration interest of 7,96% per year.<br />
48<br />
On December 21,2007, <strong>Cemig</strong> Geração e Transmissão concluded its second<br />
issue of Commercial Paper inthe amount of R$ 200 millions, with maturity<br />
of 180 days, The nominal value of the Comercial Papers will have interest<br />
of 101,5% of CDI, They don´t have guarantee of CEMIG.<br />
The consolidated composition of loans, by currency and indexor, with the<br />
respective amortization is as follows:<br />
2008 2009 2010 2011 2012 2013 2014 2015<br />
2016 and<br />
subsequent<br />
years Total<br />
CURRENCY<br />
US dollar ................................................ 86,739 76,236 44,462 33,779 30,742 27,706 2,863 214 58,911 361,652<br />
Euro ....................................................... 4,941 4,626 4,626 4,626 3,175 1,721 1,721 1,721 1,717 28,874<br />
Yen ....................................................... 47 61,436 – – – – – – – 61,483<br />
UMBNDES ( ** ) ................................... 658 659 436 324 324 324 324 324 1,160 4,533<br />
92,385 142,957 49,524 38,729 34,241 29,751 4,908 2,259 61,788 456,542<br />
Indexors<br />
IPCA – Expanded Consumer Price Index .... 1,220 – – – – – – 133,573 267,146 401,939<br />
UFIR – Fiscal Reference Unit ................. 48,363 42,663 36,948 36,734 33,260 28,601 28,547 28,547 57,061 340,724<br />
Selic Rate ( * ) ........................................ 25,820 – – – – – – – – 25,820<br />
Interbank CD rate – CDI ........................ 553,291 695,483 604,748 716,464 923,758 1,064,346 602,467 202,369 37,501 5,400,427<br />
Eletrobrás Finel internal index ................ 19,219 12,135 12,135 12,135 12,135 11,125 – – – 78,884<br />
URTJ ( ** ) ............................................ 31,645 30,509 31,198 29,058 29,058 29,055 26,107 9,717 10,511 226,858<br />
IGP–M – General Market Price Index .... 242,881 1,368 1,368 1,368 1,368 1,368 279,565 888 153,423 683,597<br />
UMBNDES ( *** ) ................................. 2,646 2,632 2,632 2,632 2,632 2,632 2,632 877 – 19,315<br />
Others (IGP–DI, <strong>IN</strong>PC and TR) ( **** ) .... 2,771 206 206 206 309 309 675 246 – 4,928<br />
927,856 784,996 689,235 798,597 1,002,520 1,137,436 939,993 376,217 525,642 7,182,492<br />
1,020,241 927,953 738,759 837,326 1,036,761 1,167,187 944,901 378,476 587,430 7,639,034<br />
(*) Selic = Special Settlement and Custody System<br />
(**) URTJ = Interest Rate Reference Unit,<br />
(***) UMBNDES = BNDES Monetary Unit,<br />
(****) IGP-DI = General Price Index – Internal Availability<br />
<strong>IN</strong>PC = National Consumer price Indexmidor<br />
TR = Reference Rate<br />
The principal currencies and indexors used for monetary updating of the loans, financings and debenture had the following variations:<br />
Accumulated<br />
change in 2007<br />
Accumulated<br />
change in 2006<br />
Accumulated<br />
change in 2007<br />
Accumulated<br />
change in 2006<br />
CURRENCY<br />
%<br />
% Indexors<br />
%<br />
%<br />
US dollar (17.15) (8.66) IGP-M 7.75 3.83<br />
Euro (7.50) 1.85 F<strong>IN</strong>EL 1.51 0.76<br />
Yen (11.78) (9.47) CDI 11.82 15.03<br />
SELIC 11.88 15.07<br />
UMBNDES (16.57) (8.52)<br />
The movement on loans, financings and debentures is as follows:<br />
Consolidated Holding company<br />
2007 2006 2007 2006<br />
Balance at beginning of year ...................................................... 7,648,937 4,935,533 110,388 82,300<br />
Initial balance – acquisition of subsidiaries ................................ – 1,100,890 – –<br />
Loans and fi nancings .................................................................. 1,855,910 3,465,902 – 30,000<br />
Monetary and FX variation ........................................................ 66,286 100,718 237 9<br />
Financial charges provisioned..................................................... 737,180 753,486 10,186 12,664<br />
Financial charges paid ................................................................ (814,184) (781,052) (11,243) (14,585)<br />
Amortization of fi nancings ........................................................ (1,855,095) (1,926,540) (30,246) –<br />
Balance at end of year ............................................................ 7,639,034 7,648,937 79,322 110,388
The consolidated totals of funds raised in 2007 are as follows:<br />
Loans / fi nancing sources<br />
BRAZILIAN CURRENCY<br />
<strong>Cemig</strong> Distribuição<br />
Principal maturity Annual cost Amount raised<br />
Citibank .......................................................................................................... 2007 102.00% of CDI 200,000<br />
Caixa Econômica Federal ................................................................................. 2007 101.60% of CDI 400,000<br />
Debentures ..................................................................................................... 2017 IPCA + 7.96% 400,000<br />
ELETROBRÁS................................................................................................ 2018 6.00% 141,136<br />
ELETROBRÁS................................................................................................ 2009 6.50% 15,555<br />
ELETROBRÁS................................................................................................ 2013 6.50% 722<br />
ELETROBRÁS ............................................................................................... 2011 6.50% 1,254<br />
F<strong>IN</strong>EP .............................................................................................................<br />
<strong>Cemig</strong> Geração e Transmissão<br />
2010 10.00% 207<br />
Caixa Econômica Federal ................................................................................. 2008 101.50% of CDI 200,000<br />
Debentures – Minas Gerais state government ................................................ 2031 IGP-M 30,246<br />
Banco do Brasil S.A. .......................................................................................<br />
Affi liates and subsidiaries<br />
2020 TJLP + 2.55% 5,067<br />
Banco Bradesco S.A. ....................................................................................... 2014 CDI + 1.50% 83,990<br />
Banco Itaú BBA S.A. ...................................................................................... 2014 CDI + 1.50% 53,332<br />
Unibanco ......................................................................................................... 2014 CDI + 1.50% 83,335<br />
BNP Paribas .................................................................................................... 2014 CDI + 1.50% 10,000<br />
Citibank .......................................................................................................... 2014 CDI + 1.50% 20,000<br />
Banco Bradesco S.A. ....................................................................................... 2017 CDI + 0.85% 112,500<br />
Banco Bradesco S.A. ....................................................................................... 2014 TJLP + 4.30% 13,816<br />
Caixa Econômica Federal ................................................................................. 2014 TJLP + 4.30% 10,132<br />
Banco Itaú BBA S.A. ...................................................................................... 2014 TJLP + 4.30% 9,156<br />
Unibanco ......................................................................................................... 2014 TJLP + 4.30% 9,156<br />
Banco Santander S.A. ...................................................................................... 2014 TJLP + 4.30% 8,235<br />
Banco Alfa de Investimento S.A. ..................................................................... 2014 TJLP + 4.30% 5,527<br />
Banco Safra S,A, .............................................................................................. 2014 TJLP + 4.30% 4,605<br />
Banco de Desenvolvimento de Minas Gerais .................................................... 2019 TJLP + 4.50% 1,292<br />
Banco Santander .............................................................................................. 2019 TJLP + 4.00% 1,292<br />
Brazilian Development Bank (BNDES) ...........................................................<br />
Foreign currency<br />
Affi liates and subsidiaries<br />
2019 TJLP + 4.50% 1,349<br />
Banco de Desenvolvimento de Minas Gerais .................................................... 2019 UMBNDES + 4.50% 276<br />
Banco Santander .............................................................................................. 2019 UMBNDES + 4.00% 276<br />
Brazilian Development Bank (BNDES) ......................................................... 2019 UMBNDES + 4.50% 287<br />
Inter-American Development Bank ................................................................. 2026 6.34% 33,167<br />
Total raised .................................................................................................... 1,855,910<br />
(*) UMBNDES = BNDES Monetary Unit,<br />
a) Restrictive covenant clauses<br />
<strong>Cemig</strong> and its subsidiaries have loans and financings with restrictive covenant clauses, These were fully complied on December 31, 2007 and during the whole<br />
year of 2007,<br />
The main covenants in existence on December 31, 2007 are as follows:<br />
Subject of covenant Index required<br />
Debt / Ebitda .......................................................................................................................................................... Less than or equal to 2.5<br />
Debt / Ebitda .......................................................................................................................................................... Less than or equal to 3.36<br />
Net debt/Ebitda ...................................................................................................................................................... Less than or equal to 3.25<br />
Current debt/Ebitda ................................................................................................................................................ Less than or equal to 90%<br />
Debt/Stockholders’ equity + debt ............................................................................................................................ Less than or equal to 53%<br />
Ebitda/Interest on debt ............................................................................................................................................ More than or equal to 2.8<br />
Ebitda / Interest ...................................................................................................................................................... More than or equal to 3.0<br />
Ebitda/(Financial revenue (expenses) ........................................................................................................................ More than or equal to 2.0<br />
CAPITAL EXPENDITURE .................................................................................................................................... Less than or equal to 60%<br />
Net debt = Total debt less (cash balance plus tradable securities)<br />
Ebitda= Ebitda = earnings before interest, taxes on profit, depreciation and amortization, In some contracts specific criteria are established for calculation of<br />
Ebitda, with some variations from this formula,<br />
49
21) – REGULATORY CHARGES<br />
RGR – Global Reversion Reserve ................................................................................................................ 25,529 11,285<br />
CCC (fuel consumption) account ................................................................................................................. 33,572 83,210<br />
Energy Development Account – CDE .......................................................................................................... 38,099 36,093<br />
Eletrobrás – Compulsory loan ...................................................................................................................... 1,207 1,207<br />
Aneel inspection charge ............................................................................................................................... 3,199 2,832<br />
Energy effi ciency.......................................................................................................................................... 138,630 146,410<br />
Research and development ........................................................................................................................... 114,573 85,798<br />
Energy system expansion research ................................................................................................................<br />
National Scientifi c and Technological<br />
17,928 32,407<br />
Development Fund ................................................................................................................................... 36,100 39,477<br />
Alternative Energy Program – Proinfa ......................................................................................................... 1,851 1,351<br />
410,688 440,070<br />
Current liabilities ........................................................................................................................................ 395,894 436,535<br />
Non-current liabilities ................................................................................................................................. 14,794 3,535<br />
22) – POST-EMPLOYMENT OBLIGATIONS<br />
a) The Forluz Pension Fund<br />
<strong>Cemig</strong> is sponsor of the Forluminas Social Security Foundation – Forluz,<br />
a non-profit legal entity whose object is to provide its associates and<br />
participants and their dependents and beneficiaries with a financial income<br />
supplementing retirement and pension, in accordance with the private<br />
pension plan to which they are linked.<br />
The actuarial obligations and assets of the plan on December 31, 2004<br />
were segregated between <strong>Cemig</strong>, <strong>Cemig</strong> Geração e Transmissão and <strong>Cemig</strong><br />
Distribuição on the basis of the allocation of the employees to each of these<br />
companies.<br />
<strong>Cemig</strong>, <strong>Cemig</strong> Geração e Transmissão and <strong>Cemig</strong> Distribuição also<br />
maintain, independently of the plans made available by Forluz, payments<br />
of part of the life insurance premium for the retirees and contribute to a<br />
health plan and a dental plan for the employees, retirees and dependents,<br />
administered by Forluz.<br />
Forluz makes the following supplementary pension benefit plans available<br />
to its participants:<br />
Mixed Social Security Benefits Plan (“Plan B”): A defined-contribution<br />
plan in the phase of accumulation of funds, for retirement benefits for<br />
normal time of service and defined-benefit coverage for disability or<br />
death of the active participant, and also on receipt of benefits for time<br />
of contribution, The contributions of the Sponsor are equal to the basic<br />
monthly contributions of the participants, and this is the only plan open<br />
for joining by new participants.<br />
The contribution of the Sponsors to this plan is 27,52% for the portion<br />
with defined benefit characteristics, relating to the coverage for invalidity<br />
or death for the active participant, and this is used for amortization of<br />
the defined obligation through an actuarial calculation, The remaining<br />
72,48%, relating to the portion of the plan with defined-contribution<br />
characteristics, goes to the nominal accounts of the participants and is<br />
recognized in the income statement for the year by the cash method, under<br />
Personnel expenses.<br />
Hence the obligations for payment of supplementary pension benefits under<br />
the Mixed Plan, with characteristics of defined contribution, and their<br />
respective assets, in the same amount of R$ 2,130,864, are not presented<br />
in this Explanatory Note.<br />
Pension Benefits Balances Plan (“Plan A”): This includes all the active<br />
and assisted participants who opted to migrate from the previous Defined<br />
50<br />
Consolidated<br />
2007 2006<br />
Benefit Plan, and are entitled to a proportional benefit by balances, In the<br />
case of the assets, this benefit was deferred to the retirement date.<br />
Defined Benefit Plan: This is the benefit plan adopted by Forluz up to<br />
1998, through which the average real salary of the last three years of<br />
activity of the employee in the Sponsor companies is complemented in<br />
relation to the amount of the Official Social Security benefit, After the<br />
process of migration that was carried out in June 2007, approved by the<br />
Private Pension Plans Secretariat (SPC), in which more than 80% of the<br />
participants migrated to Plans A and B, 51 participants remained in the<br />
defined benefit plan, Of these, seven are active employees, and 44 are<br />
retirees or pension holders.<br />
<strong>Cemig</strong>, <strong>Cemig</strong> Geração e Transmissão and <strong>Cemig</strong> Distribuição also<br />
maintain, independently of the plans made available by Forluz, payments<br />
of part of the life insurance premium for the retirees and contribute to a<br />
health plan and a dental plan for the employees, retirees and dependents,<br />
administered by Forluz.<br />
Amortization of actuarial obligations<br />
Part of the consolidated actuarial obligation with post-employment benefits<br />
in the amount of R$ 1,062,998 of December 31, 2007 (R$ 1,317,424 on<br />
December 31, 2006) was recognized as an obligation payable by <strong>Cemig</strong> and<br />
its subsidiaries mentioned and is being amortized by June 2024, through<br />
monthly installments calculated by the system of constant installments<br />
(the so-called “Price” table), Part of the amounts is adjusted annually based<br />
on the actuarial indexor of the defined benefit plan (the index for salary<br />
adjustment of the employees of <strong>Cemig</strong>, <strong>Cemig</strong> Geração e Transmissão and<br />
<strong>Cemig</strong> Distribuição, excluding productivity); and for the Balances Plan,<br />
adjusted by the IPCA Index published by the IBGE (Brazilian Geography<br />
and Statistics Institute), plus 6% per year.<br />
The technical surpluses that Forluz may present for a period of three<br />
consecutive years may be used for the reduction of part of the obligations<br />
payable recognized as provided for contractually.<br />
The liabilities and the expenses recognized by Light in connection with the<br />
Supplementary Retirement Plan are adjusted in accordance with the terms<br />
of CVM Decision CVM 371 and the Opinion prepared by independent<br />
actuaries, The last actuarial valuation was effected in relation to the base<br />
date December 31, 2007.<br />
The amounts recognized in the balance sheet at December 31, 2007, as<br />
they appear in the opinion prepared by an external actuary in conformity<br />
with CVM Decision 371, of December 13, 2000, are presented in the tables<br />
after Item b below.
) The Braslight Pension Fund<br />
Light, a subsidiary of RME, is the sponsor institution Fundação de<br />
Seguridade Social Braslight, a non-profit private pension plan entity whose<br />
purpose is to guarantee revenue to the employees of the company linked to<br />
the Foundation and to provide pension to their dependents.<br />
Braslight was instituted in April 1974, and has three plans – A, B and C –<br />
put in place in 1975, 1984 and 1998 respectively. About 96% of the active<br />
participants of the other plans have migrated to plan C.<br />
In plans A and B the benefits are of the defined benefit type. In plan C, which<br />
is of the mixed type, the programmable benefits (retirement not arising from<br />
invalidity and the respective reversal in pension), during the capitalization<br />
phase are of the defined contribution type, without any link to the <strong>IN</strong>SS, and<br />
the risk benefits (illness assistance, retirement for invalidity and pension for<br />
Consolidated<br />
Pension plans and supplementary<br />
retirement plans<br />
FORLUZ BRAS LIGHT Health plans Dental plan<br />
Present value of actuarial obligations for rights payable .................... 4,994,903 411,992 363,893 19,622 169,543<br />
Present value of actuarial obligations for rights not yet due ............. 793,854 101,692 141,501 6,670 198,458<br />
Total obligations for post–employment benefi ts ............................... 5,788,757 513,684 505,394 26,292 368,001<br />
Fair value of the Plan’s assets ............................................................ (4,384,511) (263,422) (31,750) (1,365) –<br />
Present value of uncovered obligations .............................................. 1,404,246 250,262 473,644 24,927 368,001<br />
Actuarial gains (losses) not recognized .............................................. (834,945) – (155,734) 15,194 39,957<br />
Cost of past service not recognized ................................................... (74,896) – (6,671) (26,429) (6,662)<br />
Net value in the balance sheet ..................................................... 494,405 250,262 311,239 13,692 401,296<br />
51<br />
death of an active participant, invalid and receiving illness assistance), as well<br />
as those of continued income, once granted, are of the defined benefit type.<br />
On October 2, 2001, the Private Pension Plans Secretariat approved a contract<br />
for solution to the technical deficit and the refinancing of the reserve to be<br />
amortized relating to the pension plans of Braslight, which were recorded<br />
in full, this is being paid in 300 monthly installments, starting from July<br />
2001, updated by the variation of the IGP-DI inflation index and interest of<br />
6,00% per year, totaling R$ 891,915 at 31 December, 2007.<br />
The liabilities and the expenses recognized by Light in connection with the<br />
Supplementary Retirement Plan are adjusted in accordance with the terms<br />
of CVM Decision CVM 371 and the Opinion prepared by independent<br />
actuaries. The last actuarial valuation was effected in relation to the base<br />
date December 31, 2007.<br />
Pension plans and<br />
supplementary<br />
retirement plans<br />
FORLUZ<br />
Subsidiary<br />
Health Plan Dental plan<br />
Life<br />
insurance<br />
Life<br />
insurance<br />
Present value of actuarial obligations for rights payable .......................................... 261,233 19,032 1,026 8,244<br />
Present value of actuarial obligations for rights not yet due ................................... 53,661 6,162 328 10,379<br />
Total obligations for post–employment benefi ts ..................................................... 314,894 25,194 1,354 18,623<br />
Fair value of the Plan’s assets ................................................................................. (238,515) (1,583) (70) –<br />
Present value of uncovered obligations .................................................................... 76,379 23,611 1,284 18,623<br />
Actuarial gains (losses) not recognized .................................................................... (49,595) (7,979) 688 (1,830)<br />
Cost of past service not recognized ......................................................................... (3,685) (329) (1,301) (328)<br />
Net value in the balance sheet ........................................................................... 23,099 15,303 671 16,465<br />
The actuarial gains and losses not recognized that exceeded 10,00% of the total of obligations on post-employment benefits will be recognized in the income<br />
statement in approximately 11 years (the average future time of service of present active participants), from 2007. In this condition, the holding company will<br />
recognize actuarial losses of R$ 18,106 on the Benefit Plan and R$ 5,460 on the Health Plan, and actuarial gains of R$ 553 on the Dental Plan, in compliance<br />
with CVM Instruction 371.<br />
The movement in the net liabilities has been as follows:<br />
Consolidated<br />
Pension plans and supplementary<br />
retirement plans<br />
FORLUZ BRAS LIGHT Health plans Dental plan<br />
Life<br />
insurance<br />
BALANCE AT DECEMBER 31, 2006 ............................................. 686,173 244,771 278,934 9,296 370,789<br />
Expense (revenue) recognized in the income statement .................... (1,264) 21,310 57,509 6,508 38,944<br />
Contributions paid ........................................................................... (190,504) (15,819) (25,204) (2,112) (8,437)<br />
BALANCE AT DECEMBER 31, 2007 ............................................. 494,405 250,262 311,239 13,692 401,296<br />
Current liabilities ............................................................................. 88,665 18,396 – – –<br />
Non–current liabilities .................................................................. 405,740 231,866 311,239 13,692 401,296
BALANCE AT DECEMBER 31, 2006 ................................................................... 32,339 13,724 457 16,162<br />
Expense (revenue) recognized in the income statement ........................................... (62) 2,829 320 2,057<br />
Contributions paid ................................................................................................. (9,178) (1,250) (106) (1,754)<br />
BALANCE AT DECEMBER 31, 2007 ................................................................... 23,099 15,303 671 16,465<br />
Current liabilities ................................................................................................... 4,362 – – –<br />
Non–current liabilities ........................................................................................... 18,737 15,303 671 16,465<br />
52<br />
Subsidiary<br />
Pension plans and<br />
supplementary<br />
retirement plans Health<br />
FORLUZ<br />
plans Dental plan<br />
The amounts registered in current liabilities refer to the contributions to be made by <strong>Cemig</strong> in 2007 for amortization of the actuarial liabilities.<br />
The amounts recognized in the income statement for 2007 are as follows:<br />
Consolidated<br />
Pension plans and supplementary<br />
retirement plans<br />
FORLUZ BRAS LIGHT Health plans Dental plan<br />
Life<br />
insurance<br />
Life<br />
insurance<br />
Cost of current service ....................................................................... 5,564 420 29,837 532 5,200<br />
Interest on the actuarial obligation ................................................... 545,732 48,525 47,184 2,914 35,129<br />
Return expected on the Plan’s assets ................................................. (566,324) (27,611) (3,295) (123) –<br />
Actuarial losses (gains) not recognized ............................................... – 7,730 908 (2,899)<br />
Cost of past service ............................................................................ 13,870 1,517 2,556 1,514<br />
Employee profi t shares ....................................................................... (106) (24) (25,464) (279) –<br />
Expense (revenue) in 2007 .............................................................. (1,264) 21,310 57,509 6,508 38,944<br />
Pension plans<br />
and supplementary<br />
retirement plans<br />
FORLUZ<br />
Subsidiary<br />
Health plans Dental plan Life insurance<br />
Cost of current service ............................................................................. 274 1,468 26 256<br />
Interest on the actuarial obligation ......................................................... 26,850 2,321 143 1,727<br />
Return expected on the Plan’s assets ....................................................... (27,863) (162) (6) –<br />
Actuarial losses (gains) not recognized ..................................................... – 380 45 –<br />
Cost of past service .................................................................................. 682 75 126 74<br />
Employee profi t shares ............................................................................. (5) (1,253) (14) –<br />
Expense (revenue) in 2007 .................................................................... (62) 2,829 320 2,057<br />
The external actuary’s estimate for the expense to be recognized for the year of 2008 is as follows:<br />
Pension plans<br />
and supplementary<br />
retirement plans<br />
FORLUZ BRASLIGHT<br />
Consolidated<br />
Health plans Dental plan Life insurance<br />
Cost of current service ........................................................ 5,413 420 38,803 226 5,877<br />
Interest on the actuarial obligation .................................... 543,275 48,525 46,246 2,556 35,334<br />
Return expected on the Plan’s assets .................................. (481,194) (27,611) (3,669) (343) –<br />
Actuarial losses (gains) not recognized ................................ 23,028 – 9,460 (1,131) (664)<br />
Cost of past service ............................................................. 13,870 – 1,517 2,556 1,514<br />
Employee profi t shares ........................................................ (37) (24) (33,525) (1,236) –<br />
Expense in 2008 ............................................................... 104,355 21,310 58,832 2,628 42,061
Pension plans<br />
and supplementary<br />
retirement plans<br />
FORLUZ<br />
Cost of current service ............................................................................. 267 1,947 11 269<br />
Interest on the actuarial obligation ......................................................... 29,553 2,305 132 1,789<br />
Return expected on the Plan’s assets ....................................................... (26,177) (183) (18) –<br />
Actuarial losses (gains) not recognized ..................................................... 1,628 491 (50) –<br />
Cost of past service .................................................................................. 682 75 126 74<br />
Employee profi t shares ............................................................................. (2) (1,671) (64) –<br />
Expense in 2008 ...................................................................................... 5,951 2,964 137 2,132<br />
The principal actuarial assumptions on the date of the financial statements are as follows:<br />
53<br />
Subsidiary<br />
Health plans Dental plan Life insurance<br />
CEMIG and Other Subsidiaries<br />
2007 2006<br />
Real Nominal Real Nominal<br />
Annual rate for discount to present value of the actuarial obligation ........................... 5.50% 9.72% 6.00% 11.30%<br />
Annual rate of return expected on the Plan’s assets ..................................................... 7.00% 11.28% 9.00% 14.45%<br />
Annual long–term infl ation rate ................................................................................. – 4.00% – 5.00%<br />
Index of annual estimate for future salary increases ..................................................... 2.00% 6.08% 2.00% 7.10%<br />
Annual rate of real growth of the continued–income benefi ts ..................................... – 4.00% – 5.00%<br />
Biometric model for general mortality ........................................................................ AT – 83 AT – 83<br />
Biometric model for accounts of disability .................................................................. Light Medium Light Medium<br />
Biometric model for mortality of disabled ................................................................. IAPB–57 IAPB–57<br />
Annual expected turnover rate .................................................................................... 2.00% 2.00%<br />
2007 and 2006<br />
BRASLIGHT<br />
Real Nominal<br />
Annual rate for discount to present value of the actuarial obligation ..................................................................................... 6.00% 10.59%<br />
Annual rate of return expected on the Plan’s assets ............................................................................................................... 8.00% 12.68%<br />
Annual long–term infl ation rate ........................................................................................................................................... – 4.33%<br />
Index of annual estimate for future salary increases ............................................................................................................... 0.60% 4.96%<br />
Annual rate of real growth of the continued–income benefi ts ............................................................................................... – 4.33%<br />
Biometric model for general mortality .................................................................................................................................. AT – 83<br />
Biometric model for accounts of disability ............................................................................................................................ Light Forte<br />
Biometric model for mortality of disabled ........................................................................................................................... IAPB–57<br />
Annual expected turnover rate .............................................................................................................................................. Based on age<br />
23) – REGULATORY LIABILITIES - REVIEW OF TRANSMISSION<br />
REVENUE<br />
As a result of the publication of Homologation Resolution 496 of June 26,<br />
2007 and Technical Note 046/2007 of June 5, 2007 by Aneel, there was a<br />
revision of the values of permitted annual revenues linked to the transmission<br />
facilities that are part of the national grid and other transmission facilities,<br />
for holders of public electricity transmission service concessions, which<br />
were backdated to July 1, 2005, The result of the calculation is that the<br />
subsidiary Geração e Transmissão received excess revenue in the previous<br />
periods, giving rise to a liability of R$ 30,919, which will be amortized<br />
in two portions, the first in the 2007-2008 cycle and the second in the<br />
2008-2009 cycle, The balance not amortized at December 31, 2007 is<br />
R$ 23,448, of which R$ 15,717 is classified in current liabilities, and R$<br />
7,731 in non-current liabilities.<br />
24) – CONT<strong>IN</strong>GENCIES FOR LEGAL PROCEED<strong>IN</strong>GS<br />
<strong>Cemig</strong> and its subsidiaries are parties in court and administrative<br />
proceedings before various courts and government bodies, arising from the<br />
normal cause of business, involving tax, labor-law, civil and other issues.<br />
Actions in which the company is creditor with success judged<br />
“probable”
Pasep and Cofins – widening of the calculation base<br />
The holding company has legal proceedings challenging the widening of<br />
the calculation base over the Pasep and Cofins taxes on financial revenue<br />
and other non-operational revenues, in the period from 1999 to January<br />
2004, through Law 9718 of November 27, 1998 and has a judgment in<br />
favor at the first instance, In the event that this action is won in the final<br />
instance (subject to no further appeal), and we would note that the Federal<br />
Supreme Court has ruled on several proceedings in favor of the taxpayer,<br />
the gain to be registered in the results of the year will be R$ 156,442, net<br />
54<br />
of income tax and Social Contribution Tax.<br />
Actions in which the company is debtor<br />
For those contingencies whose negative outcomes are considered probable,<br />
the company and its subsidiaries have constituted provisions for losses.<br />
<strong>Cemig</strong>’s management believes that any disbursements in excess of the<br />
amounts provisioned, when the respective processes are completed, if any,<br />
will not significantly affect the result of operations or the financial position<br />
of the holding company nor the consolidated result.<br />
Consolidated<br />
Net balance, Additions<br />
Deposits<br />
paid into Balance on<br />
2006 ( * ) (reversal) Written off Balance court 2007<br />
Labor–law contingencies<br />
Various ............................................................................ 68,330 54,131 (4,282) 118,179 (16,182) 101,997<br />
Civil<br />
Personal damages ............................................................. 7,694 1,417 (928) 8,183 – 8,183<br />
Tariff increases ................................................................. 125,202 30,583 (60,690) 95,095 (11,686) 83,409<br />
Others ............................................................................. 107,964 24,621 (19,143) 113,442 (8,940) 104,502<br />
Tax<br />
F<strong>IN</strong>SOCIAL .................................................................... 20,613 280 – 20,893 (1,615) 19,278<br />
PIS/COF<strong>IN</strong>S .................................................................... 147,963 12,304 – 160,267 – 160,267<br />
ICMS ............................................................................... 20,898 (955) – 19,943 – 19,943<br />
Taxes and contributions – demandabilities suspended ...... 40,090 6,752 – 46,842 – 46,842<br />
Social Contribution ......................................................... 6,289 232 – 6,521 – 6,521<br />
SOCIAL SECURITY SYSTEM ........................................ 33,224 633 – 33,857 – 33,857<br />
Others ............................................................................. 2,524 11,974 – 14,498 (7,459) 7,039<br />
Regulatory<br />
Aneel administrative proceedings .................................... 6,072 42,948 – 49,020 (6,072) 42,948<br />
Total ............................................................................... 586,863 184,920 (85,043) 686,740 (51,954) 634,786<br />
(*) Balance of contingencies without the effect of payments into court.<br />
Balance on<br />
2006 (*)<br />
Subsidiary<br />
Additions<br />
(reversal) Written off Balance<br />
Deposits paid<br />
into court<br />
Balance on<br />
2007<br />
Labor-law contingencies<br />
Various ............................................................................<br />
Civil<br />
31,933 40,862 – 72,795 (10,483) 62,312<br />
Personal damages ............................................................. 7,694 – (928) 6,766 – 6,766<br />
Tariff increases ................................................................. 104,253 (7,371) (27,037) 69,845 (11,686) 58,159<br />
Others .............................................................................<br />
Tax<br />
61,523 – (10,213) 51,310 (3,140) 48,170<br />
Finsocial .......................................................................... 20,613 280 – 20,893 (1,615) 19,278<br />
ICMS ............................................................................... 1,800 391 – 2,191 – 2,191<br />
Taxes and contributions – demandabilities suspended ...... 40,090 6,752 – 46,842 – 46,842<br />
Social security system ...................................................... 870 97 – 967 – 967<br />
Others .............................................................................<br />
Regulatory<br />
2,524 5,409 – 7,933 (5,030) 2,903<br />
Aneel administrative proceedings .................................... 6,072 6,609 – 12,681 (6,072) 6,609<br />
Total ................................................................................ 277,372 53,029 (38,178) 292,223 (38,026) 254,197<br />
(*) Balance of contingencies without the efect of payments into court.
The details on the provisions constituted are as follows:<br />
(a) Labor-law contingencies<br />
The complaints under the labor laws refer basically to disputes of<br />
overtime and additional amounts for dangerous work.<br />
(b) Civil disputes – tariff increase<br />
Several industrial consumers filed actions against <strong>Cemig</strong> seeking<br />
reimbursement for the amounts paid as a result of the tariff increase<br />
during the federal government’s economic stabilization plan known as<br />
the “Cruzado Plan” in 1986, alleging that the said increase violated the<br />
control of prices instituted by that plan, <strong>Cemig</strong> estimates the amounts<br />
to be provisioned based on the disputed amounts billed and based on<br />
recent judicial decisions, The total value of the exposure of <strong>Cemig</strong> and<br />
its subsidiaries in this matter, 100% provisioned, is R$ 95,095.<br />
(c) PIS/Cofins<br />
Light, controlled by RME, has challenged the changes made by Law<br />
9718/98 in the system of calculation of the PIS and Cofins taxes, in<br />
relation to the expansion of the basis of calculation of those taxes and<br />
increase of the rate of Cofins from 2% to 3%,<br />
The amounts not paid are provisioned and have been updated by the<br />
Selic rate, On November 9, 2005, the full panel of the Federal Supreme<br />
Court considered the widening of the base of the calculation of the<br />
Cofins tax unconstitutional, The same theory is applied to the PIS.<br />
The amounts provisioned up to December 31, 2007 in the company<br />
are as follows:<br />
R$ 105,169 in relation to the widening of the calculation base, subject<br />
to the judgment in a similar action in which the Federal Supreme Court<br />
decides in favor of the taxpayers; and<br />
R$ 50,774 referring to the increase in the rate of Cofins from the rate of<br />
2% to 3%, which has not yet been judged on the merits.<br />
Light is awaiting judgment on the case of a resolution by the Senate, based<br />
on the Supreme Court decision that declared this law unconstitutional,<br />
which will make it possible to reverse the said provision, in relation to the<br />
portion related to expansion of the calculation base for PIS and Cofins.<br />
The values given above correspond to 25% of the total, in accordance<br />
with the proportional consolidation as recorded.<br />
(d) ICMS<br />
Since 1999, Light has suffered various inspections by the tax authority<br />
of Rio de Janeiro State in relation to the ICMS value added tax, charge<br />
by states, The infringement notices received so far and not paid are<br />
the subject of contestation in the administrative and legal spheres,<br />
Management, based on the opinion of its counsel and calculation of the<br />
amounts involved in the infringement notices, believes that only a part<br />
of this amounts represents “probable” risk of loss, and the amount of<br />
R$ 17,752 is provisioned.<br />
(e) Taxes and contributions – demandabilities suspended<br />
The provision constituted of R$ 46,842 (R$ 40,090 on December<br />
31, 2006) refers to the deduction in the calculation base for corporate<br />
income tax of the expense on the Social Contribution tax paid since<br />
1998, <strong>Cemig</strong> has been awarded an injunction by the 8th Court of the<br />
Federal Judiciary, on April 17, 1998, allowing it not to pay this tax.<br />
(f) Social Security System<br />
In December 1999 the National Social Security Institute) (<strong>IN</strong>SS) issued<br />
infringement notices against Light for alleged subsidiary responsibility<br />
to withhold payments at source on services of contractors and the<br />
incidents of the social security contribution on employees’ profit<br />
shares.<br />
Light challenged the legality of Law 7787/89 which increased the Social<br />
Security contribution percentage applying to payrolls, believing that it<br />
also changed the basis of calculations of Social Security contributions<br />
during the period July to September 1989, As a result of the provisional<br />
remedy given by the Court, the Company has offset the amounts payable<br />
for social security contribution.<br />
55<br />
The expectations of laws in the actions mentioned is deemed to be<br />
“probable”, and demands provisions for the actions brought by the<br />
<strong>IN</strong>SS represent the amount of R$ 33,857 (R$ 33,224 on December 31,<br />
2006).<br />
(g) Aneel administrative proceedings<br />
On January 9, 2007, Aneel notified <strong>Cemig</strong> Distribuição S,A, that it<br />
considered certain criteria adopted by the company in calculation of<br />
the revenue from subvention for low-income consumers to be incorrect,<br />
questioning the criteria for identification of the consumers who should<br />
receive the benefit and also the calculation of the difference to be<br />
reimbursed by Eletrobrás, in the estimated amount of R$ 143,000,<br />
The Company has made a provision corresponding to the loss that it<br />
considers probable in this dispute, in the amount of R$ 36,339.<br />
<strong>Cemig</strong> Geração e Transmissão was served an infringement notice by<br />
the Minas Gerais State Forests Institute (IEF), alleging that it omitted<br />
to take measures to protect the fish population, causing fish deaths, as<br />
a result of the flow and operation of the machinery of the Três Marias<br />
Hydroelectric Plant, The company prevented a defense and rates the<br />
risk of loss in this action as “probable” in the amount of R$ 5,454.<br />
(h) Others<br />
This refers to various claims by people alleging damages, mainly due to<br />
accidents allegedly occurring as a result of the Company’s business, and<br />
damages as a result of power outages, The provision at December 31,<br />
2007 represents the potential loss on these claims.<br />
(i) Actions in which loss is considered possible or remote<br />
<strong>Cemig</strong> and its subsidiaries are disputing in the courts other actions for<br />
which it considers the outcome of a loss in the action to be possible<br />
or remote, and the following are the details of the most important<br />
actions:<br />
(i) Income tax and Social Contribution on post-employment benefits<br />
The federal tax authority, on October 11, 2001, issued a Notice of<br />
Infringement, in the updated amount of R$ 305,311 as a result of the<br />
use of tax credits which resulted in the rectification, for the reduction of<br />
taxes payable, of the income tax declarations for 1997, 1998 and 1999,<br />
The income tax returns were rectified as a result of the change in the<br />
method of accounting of the post-employment benefit liabilities, The<br />
additional post-employment benefits which resulted from the changes<br />
in the method of accounting were recognized in the tax years rectified,<br />
resulting in a tax loss and a negative basis for calculation of the Social<br />
Contribution.<br />
<strong>Cemig</strong> presented an administrative appeal in the Finance Ministry<br />
Taxpayers’ Council, obtaining a favorable decision for the years of 1997<br />
and 1998 and an adverse decision in relation to the year 1999, This<br />
adverse decision would result in a reduction of the negative basis for<br />
calculation of loss tax, registered as tax credits, in the historic amount<br />
of R$ 26,631, The tax credits were not reduced, and a provision for<br />
contingencies for any losses as a result of this decision was not made,<br />
since <strong>Cemig</strong> believes that it has solid legal argument and grounds for<br />
the procedures adopted for recovery of the said tax credits in the Courts,<br />
Thus, it considers the possibility of loss in this action to be remote.<br />
The tax credits constituted, mentioned in the previous paragraph,<br />
were used by <strong>Cemig</strong> to offset federal taxes and contributions paid in<br />
the business years of 2002 and 2003, Due to this fact, <strong>Cemig</strong> had the<br />
compensation proceedings refused by the federal tax authority and would<br />
be exposed to an additional penalty, updated to December 31, 2007 of<br />
R$ 271,355, With the decision of the Taxpayers’ Council, mentioned<br />
above, <strong>Cemig</strong> considers that the refusal of this process of offsetting<br />
becomes null, Thus, no contingency provision was constituted to meet<br />
any losses, since <strong>Cemig</strong> believes that it has solid legal grounds for the<br />
procedures adopted and considers the likelihood of loss in this action<br />
to be remote.<br />
(ii) Tax on Inheritance and Donations (ITCMD)<br />
The State of Minas Gerais sued the company for non-payment of the tax<br />
on inheritance and donation (ITCMD) in relation to the contributions
of consumers the amount of which on December 31, 2007 was<br />
R$ 131,464, No provision was constituted for this dispute, since the<br />
Company believes it has arguments on the merit for defense against this<br />
claim, The expectation of loss attributed to this action is “remote”.<br />
(iii) Acts of the Regulatory Agency and the Federal Audit Board<br />
Aneel filed an administrative action against <strong>Cemig</strong> stating that the<br />
company owes R$ 670,546 to the federal government as a result of<br />
an alleged error in the calculation of credits under the CRC (Results<br />
Compensation) Account, which were previously utilized to reduce the<br />
amounts owed to the federal government, On October 31, 2002 Aneel<br />
issued a final administrative decision against <strong>Cemig</strong>, On January 9,<br />
2004 the National Treasury issued a claim against the Company for the<br />
amount of R$ 516,246, <strong>Cemig</strong> did not make the payment because it<br />
believes that it has arguments on the merit for defense in Course and,<br />
thus, has not constituted a provision for this action, The likelihood of<br />
loss in this action is considered “possible”.<br />
On November 14, 2003, the Federal Audit Board began an administrative<br />
proceeding against Aneel to assess the criteria adopted by the agency<br />
in the Emergency Electricity Consumption Reduction Program, The<br />
Audit Board requested <strong>Cemig</strong> to provide certain information relating<br />
to its tariffs, which, according to the Federal Audit Board, had been<br />
incorrectly approved by Aneel.<br />
Additionally, the Federal Audit Court contested the index and X<br />
Factor used by Aneel in the tariff review of 2003, <strong>Cemig</strong> appealed<br />
in administrative proceedings before the Audit Court contested the<br />
decision.<br />
The potential loss on these actions in the Audit Court is R$ 84,979,<br />
The Company has not posted any provision and rates the chance of loss<br />
on this action as “possible”.<br />
(iv) Social Security and tax obligations – indemnity for the “Anuênio”<br />
and profit shares.<br />
<strong>Cemig</strong> and its subsidiaries <strong>Cemig</strong> Geração e Transmissão and <strong>Cemig</strong><br />
Distribuição paid an indemnity to the employees in 2006 in the<br />
amount of R$ 177,685, in exchange for the rights to future payments<br />
known as the “Anuênio” which would be incorporated into salaries, The<br />
company and its subsidiaries did not make the payments of income tax<br />
and social security contribution on this amount because it considered<br />
that these obligations are not applicable to amounts paid as indemnity,<br />
However, to avoid the risk of a future fine arising from a different<br />
interpretation by the federal tax authority and the National Social<br />
Security Institution, the company and its subsidiaries decided to file<br />
for orders of mandamus to allow payment into Court of the amount<br />
of any obligations, in the amount of R$ 121,835, posted in Deposits<br />
connected to legal actions, No provision was made for possible losses<br />
in this matter since the company and its subsidiaries classify the risk of<br />
loss in this action as “possible”.<br />
In September 2006 <strong>Cemig</strong> was notified by the <strong>IN</strong>SS as a result of the<br />
non-payment of the Social Security contribution on the amounts paid<br />
56<br />
as profit shares in the period 2000 to 2004, representing the amount of<br />
R$101,452, The Company has appealed in administrative proceedings<br />
against the decision, No provision has been constituted for possible<br />
losses and <strong>Cemig</strong> believes it has arguments on the merit for defense, and<br />
the expectation of loss in this action is considered to be “possible”.<br />
(V) ICMS<br />
Since 2002 the company has received a subvention from Eletrobrás in<br />
relation to the discounts given to low-income consumers, The Minas<br />
Gerais state office of the Federal Tax Authority served an infringement<br />
notice on <strong>Cemig</strong>, relating to the period from 2002 to 2005, on the<br />
argument that the subvention should be subject to the ICMS tax, The<br />
potential for loss in this action is RR$102,644, not including the ICMS<br />
tax, which could be questioned by the Secretariat relating to period<br />
subsequent to the infringement notice, No provision was constituted<br />
for the result of this dispute, since the company believes the legal<br />
obligation is non-existent and that it has arguments on the merit for<br />
defense against this demand, The expectation of loss attributed to this<br />
action is “possible”.<br />
<strong>Cemig</strong> was served an infringement notice, as a co-responsible party, in<br />
relation to sales of excess electricity by industrial consumers during<br />
the period of electricity rationing, in which the Minas Gerais State Tax<br />
Authority demanded payment of the ICMS tax on these transactions,<br />
in the amount of R$ 33,531, If the Company does have to pay the<br />
ICMS on these transactions, it can charge consumers the same amount<br />
to recover the amount of the tax plus any possible penalty charge, The<br />
expectation of loss in this action is classified as “possible”.<br />
(vi) Civil claims - consumers<br />
Several consumers and the Public Attorney of the State of Minas Gerais<br />
brought civil actions against <strong>Cemig</strong> contesting tariff increases applied<br />
in previous years, including: the tariff subsidies granted to low-income<br />
consumers, the extraordinary tariff recomposition and the inflation index<br />
used to increase the tariff for electricity in April 2003, and requesting<br />
twice of reimbursement on the amounts considered charge in error by the<br />
company, The company believes it has arguments on the merit for a legal<br />
defense and thus has not made a provision for these actions.<br />
The company is defendant in legal proceedings challenging the<br />
criteria for measurement of amounts to be charged in relation to the<br />
contribution of public illumination, in the total amount of R$ 525,579,<br />
The Company believes that it has arguments on the merit for defense in<br />
this dispute and as a result has not constituted provision for this action,<br />
The likelihood of loss in this action is considered “possible”.<br />
In addition to the issues described above, <strong>Cemig</strong> and its subsidiaries are<br />
involved, as Plaintiff or Defendant, in other cases, of less importance, related<br />
to the normal course of their operations, The management believes that it<br />
has adequate defense for this litigation, and significant losses relating to<br />
these issues which might have an adverse effect on the company’s financial<br />
position or consolidated result of its operations are not expected.<br />
25) – STOCKHOLDER’S EQUITY AND REMUNERATION TO STOCKHOLDERS<br />
(a) Registered capital<br />
<strong>Cemig</strong>’s shares on December 31, 2007 have nominal value of R$ 5.00 per share and are owned as follows:<br />
Quantidade de Ações em 31 de dezembro de 2007<br />
Shareholders Common % Preferred % Total %<br />
State of Minas Gerais ......................................... 108,348,914 51 – – 108,348,914 22<br />
Other entities of the state .................................. 28,657 – 5,329,764 2 5,358,421 1<br />
Southern Electric Brasil Participações ................<br />
Others<br />
70,088,868 33 – – 70,088,868 14<br />
Brazilian investors ......................................... 19,663,422 9 82,310,555 30 101,973,977 21<br />
Non-Brazilian investors................................. 14,492,642 7 186,198,634 68 200,691,276 42<br />
Total...................................................... 212,622,503 100 273,838,953 100 486,461,456 100
Quantidade de Ações em 31 de dezembro de 2006<br />
Shareholders Common % Preferred % Total %<br />
State of Minas Gerais ......................................... 36,116,304,884 51 102 – 36,116,304,986 22<br />
Other entities of the state .................................. 9,552,515 – 1,776,588,306 2 1,786,140,821 1<br />
Southern Electric Brasil Participações ................<br />
Others<br />
23,362,956,173 33 – – 23,362,956,173 14<br />
Brazilian investors ......................................... 6,834,237,214 10 26,090,932,914 29 32,925,170,128 21<br />
Non-Brazilian investors................................. 4,551,117,137 6 63,412,129,780 69 67,963,246,917 42<br />
Total...................................................... 70,874,167,923 100 91,279,651,102 100 162,153,819,025 100<br />
Stockholders’ Agreement<br />
In 1997 the Government of the State of Minas Gerais sold approximately<br />
33% of the Company’s common shares to a group of investors led by<br />
Southern Electric Brasil Participações Ltda, (“Southern”), As part of this<br />
transaction the State of Minas Gerais and Southern signed a Stockholders’<br />
Agreement which among other provisions contained the requirement for<br />
a qualified quorum in decisions on significant corporate actions, certain<br />
changes to <strong>Cemig</strong>’s bylaws, issuance of debentures and convertible<br />
securities, distribution of dividends other than those specified in the<br />
bylaws, and changes in the stockholding structure.<br />
In September 1999 the government of the State of Minas Gerais brought<br />
an action for annulment, with a request for anticipatory remedy, against the<br />
stockholders’ agreement signed in 1997, The Minas Gerais State Appeal<br />
Court annulled that Stockholders’ Agreement in 2003, Appeals brought<br />
by Southern are before the Brazilian federal courts.<br />
Increase in registered capital<br />
The General Meeting of Stockholders on April 26, 2007 approved an<br />
increase in the registered capital through use of the Earnings reserve so as<br />
to comply with the terms of Article 199 of the Corporate Law, which limits<br />
the balance of reserves to the value of the company’s registered capital.<br />
As a result, an increase in the registered capital of <strong>Cemig</strong> from<br />
R$ 1,621,538 to R$ 2,432,307 was approved, with issuance of new shares<br />
upon capitalization of R$ 810,769 of the balance of the retained earnings<br />
reserve, distributing to stockholders as a consequence a 50% stock bonus,<br />
in new shares, in the same type as that as held, and with a nominal unit<br />
value R$ 0,01.<br />
Reverse split<br />
The General Meeting also approved a reverse split of the Company’s shares,<br />
substituting each lot of 500 shares with nominal value R$ 0,01 by 1 share<br />
of nominal value R$ 5,00, which was effected on June 4, 2007.<br />
(b) Reserves<br />
The Capital Reserves and Profit Reserves are made up as follows:<br />
Holding company<br />
2007 2006<br />
Capital Reserves –<br />
Remuneration on Fixed assets in<br />
progress – own capital ....................... 1,313,220 1,313,220<br />
Donations and subventions<br />
for investments ................................... 2,650,898 2,650,898<br />
Premium on issuance of shares ............... 69,230 69,230<br />
Monetary updating of the capital ........... 6 6<br />
Shares held in Treasury ........................... (1,132) (1,132)<br />
4,032,222 4,032,222<br />
Profi t Reserves –<br />
Reserve under the bylaws ....................... 1,001,865 432,749<br />
Retained earnings .................................. 623,776 1,222,709<br />
Reserve required by law ......................... 272,884 186,112<br />
1,898,525 1,841,570<br />
57<br />
The Reserve for Remuneration of Works in Progress – Own Capital<br />
refers to the interest on the Company’s own capital used in the<br />
construction of assets and facilities, and is registered in Fixed Assets<br />
with a counterpart in Stockholders’ equity, <strong>Cemig</strong> decided to cease<br />
constituting this reserve, starting with the 1999 business year.<br />
The Reserve for Donations and Subventions for Investments basically<br />
refers to the compensation by the federal government for the difference<br />
between the profitability obtained by <strong>Cemig</strong> up to March 1993 and the<br />
minimum return guaranteed by the legislation in effect at the time,<br />
The funds were used in amortization of various obligations payable to<br />
the federal government, and the remaining balance originated the CRC<br />
contract.<br />
The Reserve under the Bylaws is for future payment of extraordinary<br />
dividends, in accordance with Article 28 of the bylaws.<br />
The Profit Retention Reserves are profits not distributed to stockholders,<br />
basically due to the need for funds to apply in investments.<br />
The shares held in Treasury refer to the passthrough by Finor of shares<br />
arising from funds applied in <strong>Cemig</strong> projects in the area covered by<br />
Sudene (the development agency for the Northeast) under tax incentive<br />
schemes.<br />
(c) Dividends<br />
Of the net profit for the year, 50,00% must be used for distribution of<br />
the obligatory dividend to the Company’s stockholders.<br />
The preferred shares have preference in the event of reimbursement of<br />
capital and participate in profits on the same conditions as the common<br />
shares, They have the right to a minimum annual dividend equal to the<br />
greater of: (a) 10% of their nominal value and (b) 3% of the portion of<br />
stockholders’ equity that they represent.<br />
Under the bylaws, <strong>Cemig</strong>’s shares held by private individuals have the<br />
right to a minimum dividend of 6% per year on their nominal value in<br />
all years when <strong>Cemig</strong> does not obtain sufficient profits to pay dividends<br />
to its stockholders, This guarantee is given by the State of Minas Gerais<br />
by Article 9 of State Law 828 of December 14, 1951 and Article 1 of<br />
State Law 8796 of April 29, 1985.<br />
The obligatory or extraordinary dividends declared shall be paid in 2<br />
(two) equal installments, the first by 30 June and the second by 30<br />
December of the year following the generation of the profit to which<br />
they refer, and the Executive Board shall decide the location and<br />
processes of payment, subject to these periods.<br />
Extraordinary dividends<br />
The Company may distribute extraordinary dividends up to the limit of<br />
available cash, as determined by the discretion by the Board of Directors,<br />
subject to the guidelines of the Company’s Long-term Strategic Plan,<br />
without damage of the obligatory dividends, in every two years, starting<br />
in 2005, or in less period if available cash.<br />
The calculation of the dividends proposed for distribution to<br />
stockholders for 2007 and 2006 is as follows:
Holding company<br />
Calculation of the minimum dividends for the preferred shares under the bylaws 2007 2006<br />
Nominal value of preferred shares ......................................................................................................... 1,369,195 912,797<br />
Percentage on nominal value of preferred shares .............................................................................. 10.00% 10,00%<br />
Dividends in accordance with the 1st payment criterion ................................................................... 136,920 91,280<br />
Stockholders’ equity ............................................................................................................................. 8,390,177 7,522,453<br />
Proportion of stockholders’ equity represented by the preferred shares (net of shares in Treasury) ..... 56.27% 56,27%<br />
Value of preferred shares in terms of stockholders’ equity ................................................................. 4,721,153 4,232,884<br />
Percentage applied to stockholders’ equity value of preferred shares ................................................. 3.00% 3,00%<br />
Dividends by the 2nd criteria ........................................................................................................... 141,635 126,987<br />
Minimum obligatory dividend for the preferred shares .........................................................................<br />
Obligatory dividends<br />
141,635 126,987<br />
Net profi t for the year ........................................................................................................................... 1,735,449 1,718,841<br />
Obligatory dividend: 50,00% of net profi t ............................................................................................<br />
Net dividends proposed –<br />
867,725 859,421<br />
Interest on Equity ............................................................................................................................ – 169,067<br />
Complementary dividends ............................................................................................................... 867,725 715,714<br />
Extraordinary dividends ................................................................................................................... – 497,000<br />
867,725 1,381,781<br />
( – ) Income tax withheld at source on Interest on Equity ..................................................................... – (16,923)<br />
Total ................................................................................................................................................. 867,725 1,364,858<br />
Total dividend for the preferred shares .................................................................................................. 488,269 777,528<br />
Total dividend for the common shares ...................................................................................................<br />
Dividend per thousand shares on December 31, 2006, and per unit share value on December 31, 2007, R$<br />
379,456 604,253<br />
Minimum dividends for the preferred shares under the bylaws .............................................................. 0.52 1.39<br />
Obligatory dividend ............................................................................................................................. 1.78 5.30<br />
Dividends proposed (net of income tax withheld at source) ................................................................... 1.78 8.42<br />
The Company has used 5.00% of the net income for 2007 to Legal Reserve in the amount of R$86,772.<br />
The following proposal for allocation of the remaining balance of Adjusted Net Profit will be made to the General Meeting of Stockholders to be held in April,<br />
2008: R$ 569,116 to the Reserve under the Bylaws and R$ 211,836 to the Retained Profit Reserve.<br />
The tax benefits arising from payment of Interest on Equity are R$ 169,067 and were R$ 57,483 in 2006, The Company did not pay Interest on Equity in 2007.<br />
26) – GROSS RETAIL SUPPLY OF ELECTRICITY<br />
The position in retail supply of electricity, by type of consumer, is as follows:<br />
Consolidated<br />
(Not reviewed by independent auditors)<br />
Number of consumers MWh ( * ) R$<br />
2007 ( * ) 2006 2007 2006 2007 2006<br />
Residential ................................................................................... 8,764,157 8,560,153 8,648,603 7,429,818 4,373,896 3,622,178<br />
Industrial ..................................................................................... 86,394 84,175 24,686,241 23,972,596 3,380,277 3,069,373<br />
Commercial, services and others ................................................... 830,818 820,946 5,549,409 4,439,154 2,494,502 1,935,339<br />
Rural ......................................................................................... 565,169 505,707 2,212,485 1,942,306 598,812 515,233<br />
Public authorities ......................................................................... 61,234 58,225 968,177 724,720 386,545 290,415<br />
Public illumination ...................................................................... 2,661 2,696 1,212,251 1,127,685 309,487 285,806<br />
Public service ............................................................................... 9,050 8,841 1,325,462 1,117,660 368,974 296,162<br />
Sub–total ...................................................................................... 10,319,483 10,040,743 44,602,628 40,753,939 11,912,493 10,014,506<br />
Own consumption ........................................................................ 1,256 1,124 52,941 37,160 – –<br />
Subvention for low–income consumers ......................................... – – – – 126,112 134,763<br />
Retail supply not invoiced, net ..................................................... – – – – 11,332 76,799<br />
10,320,739 10,041,867 44,655,569 40,791,099 12,049,937 10,226,068<br />
Wholesale supply to other concession holders ............................... 93 44 13,235,965 11,472,158 1,209,731 708,867<br />
Transactions in energy on the CCEE ............................................. – – 25,664 200,065<br />
Total ......................................................................................... 10,320,832 10,041,911 57,891,534 52,263,257 13,285,332 11,135,000<br />
(*) The table of consumers includes 100% of the consumers of Light, subsidiary of RME.<br />
The table of MWh includes 25.00% of the total MWh sold by Light.<br />
(**) Includes Contracts for Sale of Energy in the Regulated Environment (CCEAR) and “bilateral contracts” with other agents.<br />
58
Tariff adjustment<br />
The tariffs of <strong>Cemig</strong> Distribution were increased by an average of 5.16%<br />
as from April 8, 2007. The adjustment is different for different consumer<br />
categories. As an example, residential consumers had an increase of 6.50%<br />
on their energy bills, while high-voltage consumers had an increase of<br />
2.89%.<br />
For the free consumers of <strong>Cemig</strong> Geração e Transmissão and other<br />
subsidiaries, individual contracts are signed indexed, principally, to the<br />
variation of the IGP-M inflation index and the US dollar exchange rate.<br />
Low-income consumers<br />
The federal government, through Eletrobrás (Centrais Elétricas Brasileiras)<br />
reimburses the distributors for the losses in revenue arising as a result of<br />
the criteria adopted as from 2002 for classification of consumers in the<br />
low-rental residential sub-category, in view of the lower tariff applied to<br />
their electricity bills.<br />
The regulator, Aneel is reviewing the procedures for calculation by the<br />
Company of revenue for the subsidy for low-income consumers. As a result<br />
of this review, the amounts posted in 2007 were calculated on the basis of<br />
estimate, and their receipt for the period from February through December<br />
2007 is pending.<br />
27) – REVENUE FOR USE OF THE NETWORK – FREE CONSUMERS<br />
The TUSD revenue refers basically to the sale of electricity to free consumers<br />
with charging of a tariff for the use of the distribution network.<br />
Consolidated<br />
2007 2006<br />
Tariff for Use of the Distribution<br />
Systems (TUSD) ............................................... 1,313,499 1,201,854<br />
Revenue from use of the basic network ................ 537,415 485,598<br />
Revenue from connection to the system ............... 95,016 102,019<br />
1,945,930 1,789,471<br />
Under the concession contracts between Aneel and the transmission<br />
companies Transleste, Transudeste, ERTE, EATE, ENTE, ETEP and<br />
ECTE, the revenues to be earned in the final 15 years of the said contracts<br />
are 50.00% lower than those in the first 15 years of the concession. The<br />
company recognizes the revenues from these concessions in accordance with<br />
the said contracts.<br />
59<br />
28) – OTHER OPERATIONAL REVENUES<br />
Consolidated Holding company<br />
2007 2006 2007 2006<br />
Retail supply of gas ............ 297,353 298,039 – –<br />
Charged service...................<br />
Telecommunications and<br />
15,482 10,461 – –<br />
cable TV service ............. 75,593 121,010 – –<br />
Services provided ................ 68,015 34,488 343 481<br />
Rental and leasing .............. 50,081 32,016 493 976<br />
Others ............................... 51,745 10,886 39,902 –<br />
............................... 558,269 506,900 40,738 1,457<br />
29) – DEDUCTIONS FROM OPERATIONAL REVENUE<br />
Consolidated<br />
2006<br />
Holding company<br />
2007 Reclassified 2007 2006<br />
ICMS ............................... 3,017,522 2,515,830 4,182 –<br />
COF<strong>IN</strong>S ............................. 1,228,455 1,096,577<br />
RGR – Global Reversion<br />
– –<br />
Reserve .......................... 144,922 29,938 – –<br />
PIS and Pasep ....................<br />
Energy Effi ciency<br />
253,106 245,857 – 58<br />
Program – PEE ..............<br />
Energy Development<br />
28,972 104,530 – –<br />
Account – CDE ..............<br />
Fuel Consumption<br />
390,803 333,983 – –<br />
Account (CCC) ...............<br />
Research and<br />
406,864 554,448 – –<br />
development – R&D ......<br />
National Scientifi c and<br />
Technological<br />
27,646 38,521 – –<br />
Development Fund .....<br />
Energy system expansion<br />
26,258 29,615 – –<br />
research .......................... 17,505 15,031 – –<br />
Others ............................... 1,564 399 13 23<br />
5,543,617 4,964,729 4,195 81<br />
<strong>Cemig</strong> pays ICMS applicable to the RTE and the Deferred Tariff Adjustment in conformity with the invoicing of amounts on the customer’s electricity bill.<br />
The reduction in the values provisioned for RGR in 2006 is due to the adjustment in the provision for the business year of 2004, in the amount of R$ 65,760,<br />
as a result of the homologation of this expense by Aneel in a lower amount than was estimated by the company.<br />
30) – OPERATIONAL COSTS AND EXPENSES<br />
Consolidated Holding company<br />
2007 2006 2007 2006<br />
Personnel expenses ..................................................................... 967,688 1,082,691 22,948 45,751<br />
Personnel – managers and board members ................................ 519 5,503 – 3,929<br />
Post–employment obligations ................................................... 123,007 169,910 5,144 7,871<br />
Materials ................................................................................... 93,596 81,972 421 474<br />
Raw materials and inputs for production ................................... 58,908 36,812 – –<br />
Outsourced services ................................................................... 619,665 503,993 10,730 18,032<br />
Electricity purchased for resale .................................................................. 2,793,722 2,112,673 – –<br />
Depreciation and amortization ................................................... 778,144 672,257 701 694<br />
Financial compensation for use of water resources ...................... 137,349 138,955 – –<br />
Operational provisions (reversals) ............................................... 290,598 52,062 30,085 (98,840)<br />
Charges for the use of the basic transmission grid ...................... 649,737 663,851 – –<br />
Gas purchased for resale ............................................................. 154,241 157,732 – –<br />
Other operational expenses, net ................................................. 284,160 238,544 4,042 4,617<br />
6,951,334 5,916,955 74,071 (17,472)
Consolidated Holding company<br />
PERSONNEL EXPENSES 2007 2006 2007 2006<br />
Remuneration and salary-related charges and expenses ...............<br />
Supplementary pension contributions – defi ned<br />
995,456 914,283 18,911 31,188<br />
contribution plan .................................................................... 34,274 32,288 1,487 2,039<br />
Assistance benefi ts ..................................................................... 116,640 120,516 2,550 3,757<br />
1,146,370 1,067,087 22,948 36,984<br />
( – ) Personnel costs transferred to worksin progress ................... (178,682) (162,081) – –<br />
967,688 905,006 22,948 36,984<br />
Indemnity of the “Anuênio” ...................................................... – 177,685 – 8,767<br />
967,688 1,082,691 22,948 45,751<br />
<strong>IN</strong>DEMNITY OF THE “ANUÊNIO”<br />
As mentioned in Note 24, in 2006 the company and its subsidiaries <strong>Cemig</strong><br />
Geração e Transmissão and <strong>Cemig</strong> Distribuição presented a proposal to<br />
the employees for indemnity in exchange for their future right relating to<br />
incorporated annually into their salaries (referred to as the “anuênio”). The<br />
amount of the indemnity corresponds to the estimate of the future anuênios<br />
of the employees up to their completing 35 years’ contribution to the <strong>IN</strong>SS,<br />
60<br />
discounted to present value at a rate of 12.00% p,a,, with subsequent<br />
application of a variable percentage reduction factor set by the company<br />
and its subsidiaries. The period for employees to opt for acceptance was<br />
completed on June 30, 2006, and the payment of the indemnity, in the<br />
amount of R$ 177,685, was carried out in the period June through August<br />
2006.<br />
Consolidated Holding company<br />
OUTSOURCED SERVICES 2007 2006 2007 2006<br />
Collection/meter reading/bill delivery agents ............................. 111,738 93,547 – –<br />
Communication .........................................................................<br />
Maintenance and conservation of electricity facilities and<br />
80,930 50,197 1,368 1,356<br />
equipment ................................................................................. 108,464 83,999 30 38<br />
Building conservation and cleaning ........................................... 36,073 29,241 27 70<br />
Contracted labor ........................................................................ 19,029 27,476 165 6<br />
Freight and airfares .................................................................... 8,609 8,510 1,302 1,709<br />
Accommodation and meals ........................................................ 16,850 15,971 210 369<br />
Security services ......................................................................... 15,128 14,354 1 31<br />
Consultancy ............................................................................... 17,283 26,432 2,673 9,688<br />
Maintenance and conservation of furniture and utensils ............. 27,522 21,220 25 34<br />
Maintenance and conservation of vehicles .................................. 19,113 16,307 191 50<br />
Disconnection and reconnectioan ............................................... 31,309 20,682 – –<br />
Others ....................................................................................... 127,617 96,057 4,738 4,681<br />
619,665 503,993 10,730 18,032<br />
Consolidated<br />
ELECTRICITY PURCHASED FOR RESALE 2007 2006<br />
From Itaipu Binacional ........................................................................................................................................ 1,197,803 888,185<br />
Short-term energy................................................................................................................................................ 119,981 76,317<br />
Proinfa ................................................................................................................................................................ 65,015 40,643<br />
Bilateral contracts ................................................................................................................................................ 36,412 127,598<br />
‘Initial Contracts’ ................................................................................................................................................. 350,067 42,063<br />
Auction energy .................................................................................................................................................... 996,809 869,997<br />
Others ................................................................................................................................................................. 27,635 67,870<br />
2,793,722 2,112,673
Consolidated Holding company<br />
OPERATIONAL<br />
PROVISIONS 2007 2006 2007 2006<br />
Pension plan premiums ......<br />
Provision (reversal) for<br />
2,756 6,287 2,283 384<br />
credit of doubtful debts ..<br />
Provision (reversal) for<br />
143,190 128,618 (6,994) (12,233)<br />
labor-law contingencies ..<br />
Reversal of Aneel<br />
administrative<br />
54,131 (79,218) 40,862 (77,238)<br />
proceedings ................<br />
Provision (reversal)<br />
for legal contingencies –<br />
42,948 487 6,609 487<br />
civil actions ................<br />
Provision (reversal) for<br />
civil actions on<br />
(5,974) (19,304) (6,475) (19,304)<br />
tariff increases ............. 30,583 (17,920) (7,371) (17,920)<br />
Others ............................... 22,964 33,112 1,171 26,984<br />
290,598 52,062 30,085 (98,840)<br />
31) – NET F<strong>IN</strong>A<strong>NCIAL</strong> REVENUE (EXPENSES)<br />
Consolidated Holding company<br />
F<strong>IN</strong>A<strong>NCIAL</strong> REVENUES 2007 2006 2007 2006<br />
Revenue from cash investments ......................................................................... 200,464 183,839 16,023 9,211<br />
Arrears penalty payments on electricity bills ......................................................<br />
Interest and monetary variation on accounts receivable from<br />
122,659 133,757 – –<br />
the Minas Gerais state government................................................................<br />
Provision (reversal) for loss on accounts receivable from the<br />
158,991 187,195 – 41,267<br />
government of the State of Minas Gerais ....................................................... – 99,186 – 99,187<br />
Monetary variation of CVA ................................................................................ 45,108 87,211 – –<br />
Monetary updating – General Agreement for the Electricity Sector ................... 404,900 321,936 26,594 29,216<br />
Monetary updating and interest – Deferred Tariff Adjustment ........................... 130,676 198,731 – –<br />
FX variations ..................................................................................................... 119,828 89,861 – 109<br />
Pasep and Cofi ns taxes on fi nancial revenues ...................................................... (64,880) (71,728) (36,945) (40,958)<br />
Gains on fi nancial instruments ........................................................................... 8,279 25,221 – 2,234<br />
Gains on FIDC .................................................................................................. – – 35,656 10,988<br />
Others .............................................................................................................. 159,986 137,065 35,807 46,354<br />
F<strong>IN</strong>A<strong>NCIAL</strong> EXPENSES –<br />
1,286,011 1,392,274 77,135 197,608<br />
Charges on loans and fi nancings ......................................................................... (851,855) (867,923) (10,185) (12,664)<br />
Monetary variation – General Agreement for the Electricity Sector .................... (139,048) (75,168) – –<br />
Monetary variation of CVA ................................................................................ (36,661) (57,727) – –<br />
FX variations ..................................................................................................... (9,841) (3,408) (1,708) (40)<br />
Monetary variation – loans and fi nancings ......................................................... (26,343) (27,810) (237) (9)<br />
CPMF TAX .......................................................................................................<br />
Provision for losses on recovery of Extraordinary Tariff Recomposition<br />
(66,780) (83,987) (5,536) (12,840)<br />
and free energy amounts – updating .............................................................. (174,832) (86,154) (26,594) (29,217)<br />
Losses on fi nancial instruments .......................................................................... (187,248) (116,833) – –<br />
Others .............................................................................................................. (149,508) (122,938) (31,532) (34,179)<br />
(1,642,116) (1,441,948) (75,792) (88,949)<br />
NET F<strong>IN</strong>A<strong>NCIAL</strong> REVENUE (EXPENSES) ................................................. (356,105) (49,674) 1,343 108,659<br />
The Pasep and Cofins expenses apply to financial revenues on regulatory assets and Interest on Equity.<br />
The financial charges arising on loans and financings linked to works in the year of 2007, in the amount of R$ 8,822, were transferred to Fixed assets, No<br />
monetary updating or FX variation was capitalized in the period (in 2006 R$ 20,880 in financial charges, and R$ 3,870 in monetary and FX variations, was<br />
capitalized).<br />
61<br />
Consolidated Holding company<br />
OTHER NET<br />
OPERATIONAL<br />
EXPENSES 2007 2006 2007 2006<br />
Leasings and rentals ............ 34,102 33,565 604 951<br />
Advertising ........................<br />
Own consumption of<br />
26,235 21,273 395 890<br />
electricity ....................... 16,729 15,607 – –<br />
Subventions and donations . 40,648 35,475 870 687<br />
Aneel inspection charge ...... 37,441 33,711 – –<br />
Payments for concessions ....<br />
Taxes and charges (IPTU,<br />
14,434 13,229 – –<br />
IPVA and others)............ 38,996 29,230 160 49<br />
Insurance ............................ 5,403 5,052 95 138<br />
Contribution to the MAE ... 3,485 2,670 3 3<br />
Others ............................... 66,687 48,732 1,915 1,899<br />
284,160 238,544 4,042 4,617
32) – NON-OPERATIONAL REVENUE (EXPENSES)<br />
Consolidated Holding company<br />
2007 2006 2007 2006<br />
Net loss on decommissioning<br />
and sale of assets .............<br />
FORLUZ – current<br />
(19,968) (15,052) (69) (513)<br />
administration expense ...<br />
Gain on sale of the<br />
(20,663) (13,504) (895) (798)<br />
holding in Way TV ........ 54,079 – – –<br />
Other net expenses ............. (23,804) (8,239) (10,079) (8,912)<br />
(10,356) (36,795) (11,043) (10,223)<br />
The gain on sale of the holding in Way TV is described in more detail in<br />
Explanatory Note 16.<br />
34) – RELATED PARTY TRANSACTIONS<br />
The principal balances and transactions with related parties of <strong>Cemig</strong> and its subsidiaries are:<br />
62<br />
33) – EMPLOYEES’ PROFIT SHARES<br />
In the years 2007 and 2006 the Company and its subsidiary <strong>Cemig</strong><br />
Distribuição and <strong>Cemig</strong> Geração e Transmissão used a percentage of 3%<br />
of operational profit, adjusted for certain items specified by Aneel in the<br />
Annual Reporting Procedure (PAC) as the general criterion for payment<br />
of profit shares to employees, Additionally, in the collective agreements<br />
in November 2007 and 2006, extraordinary amounts of R$ 358,573 and<br />
R$ 139,198, respectively, were agreed with the employees’ unions, These<br />
additional amounts were paid within the same business year.<br />
Under these agreements, the share in the profits of 2007 and 2006,<br />
including the contribution to the pension plan payable on these amounts,<br />
were R$ 486,483 and R$ 209,991, respectively.<br />
Consolidated<br />
ASSETS LIABILITIES REVENUES EXPENSES<br />
COMPANIES 2007 2006 2007 2006 2007 2006 2007 2006<br />
<strong>Cemig</strong> Distribuição S,A,<br />
Interest on Equity and dividends ............................ 674,408 670,712 – – 149,809 181,963 – –<br />
Retail supply of electricity ...................................... – 14,744 13,491 – – 77,585 (79,731) –<br />
Others ....................................................................<br />
<strong>Cemig</strong> Geração e Transmissão S,A,<br />
127 1,378 2,463 1,125 – – – –<br />
Interest on Equity and dividends ............................ 564,780 379,054 – – 188,118 229,880 – –<br />
Retail supply of electricity ...................................... 22,277 – – 14,744 79,731 – – 77,585<br />
Others ....................................................................<br />
Light S,A<br />
351 5,099 2,694 3,903 – – – –<br />
Retail supply of electricity ...................................... 366 – – – 55,757 – – –<br />
Electricity purchased for resale ................................<br />
Minas Gerais state government<br />
– – 163 – – – (20,528) (22,459)<br />
Consumers and traders ............................................ 2,021 2,923 – – 65,870 56,773 – –<br />
Taxes offsettable – ICMS – current ......................... 167,308 15,088 268,302 262,084 (2,535,715) (2,515,830) – –<br />
Accounts receivable from Minas Gerais state gov, ... 1,763,277 1,726,293 – – 123,335 140,454 – –<br />
Taxes offsettable – ICMS – non–current .................. 57,901 312,434 – – – – – –<br />
Consumers and traders ............................................ 36,795 36,546 – – – – – –<br />
Interest on Equity and dividends ............................ – – 125,677 307,894 – – – (37,672)<br />
Debentures ............................................................. – – 146,705 106,479 – – (40,226) (3,736)<br />
Credit Receivables Fund ......................................... – – 990,386 981,791 – – – –<br />
Financings – Minas Gerais Development Bank .......<br />
Forluz<br />
– – 18,392 31,986 – – – –<br />
Post–employment obligations – current ................. – – 88,665 139,113 – – (101,696) (169,910)<br />
Post–employment obligations – non current ........... – – 1,131,967 1,421,315 – – – –<br />
Others .................................................................... – – 89,410 65,310 – – – –<br />
Personnel expenses .................................................. – – – – – – (34,274) (32,288)<br />
Current administration expense .............................. – – – – – – (20,663) (13,504)<br />
Others .................................................................... 4,785 635 75,045 – – – – –<br />
Interest on Equity ................................................... 141,391 103,006 – – – – – –<br />
See further information relating to the principal transactions in Explanatory Notes 6, 11, 14, 19, 20, 22, 24, 25, 29, 31, 32 and 38.<br />
The balance under Consumers and traders relating to the Minas Gerais state government, in the amount of R$ 36,795 on December 31, 2007 in the short and<br />
long term, includes amounts receivable from Copasa, which were renegotiated for payment in 96 months (R$36,545 on December 31, 2006).
35) – EXPOSURE AND MANAGEMENT OF RISKS<br />
As a concession holder in the Brazilian electricity sector, <strong>Cemig</strong> and its<br />
subsidiaries operate in environments where factors such as stockholding<br />
restructurings, government regulations, evolution of technology,<br />
globalization and variations in the consumer market are risk factors.<br />
<strong>Cemig</strong> has a Corporate Risk Management program, which seeks to provide<br />
understanding of any events that could cause a loss of value to stockholders,<br />
and structure the Company to operate proactively in relation to its risk<br />
environment.<br />
The principal market risks that affect <strong>Cemig</strong>’s business are as follows:<br />
63<br />
a) Exchange rate risk<br />
<strong>Cemig</strong> and its subsidiaries are exposed to the risk of increase in exchange<br />
rates, especially of the US dollar against the real, with significant impact<br />
on indebtedness, profit and cash flow, To reduce <strong>Cemig</strong>’s exposure to<br />
increases in the exchange rate, the Company had hedge transactions<br />
contracted, on December 31, 2007 in the amount of R$ 122,099,<br />
equivalent to US$68,932, and R$ 61,409 equivalent to ¥3,878,825<br />
(Japanese Yen), in which variation in the US dollar and the Yen, plus<br />
a rate, were replaced by the variation in the CDI rate (see Explanatory<br />
Note 36).<br />
The net exposure to exchange rates is as follows:<br />
Consolidated<br />
CEMIG’S FX EXPOSURE<br />
US dollars (Note 20)<br />
2007 2006<br />
Loans and fi nancings ......................................................................................................................................... 361,652 906,634<br />
(–) Contracted hedge and swap operations ..................................................................................................... (122,099) (233,187)<br />
Yen (Note 20)<br />
239,553 673,447<br />
Loans and fi nancings ......................................................................................................................................... 61,483 69,678<br />
(–) Contracted hedge transactions ................................................................................................................. (61,409) (69,624)<br />
Other foreign currencies (Note 20)<br />
Loans and fi nancings<br />
74 54<br />
Euro............................................................................................................................................................... 28,874 36,293<br />
Others ........................................................................................................................................................... 4,533 2,147<br />
33,407 38,440<br />
Net exposure ..................................................................................................................................................... 273,034 711,941<br />
Must be emphasis that the exposure showed above to exchange rates is reduced<br />
by the Company through contracts of sale of electric to free consumers, through<br />
<strong>Cemig</strong> Geração e Transmissão, index to the dollar variation.<br />
b) Interest rate risk<br />
<strong>Cemig</strong> and its subsidiaries are exposed to the risk of increase in<br />
international interest rates, affecting loans and financings in foreign<br />
currency with floating interest rates (principally Libor), in the amount<br />
of R$ 144,305 at December 31, 2007 (R$ 433,086 on December 31,<br />
2006).<br />
The risk of increase of Brazilian interest rates is partially reduced by<br />
assets that are also indexed to interest rates, as follows:<br />
Consolidated Holding company<br />
CEMIG’S EXPOSURE TO BRAZILIAN <strong>IN</strong>TEREST RATES<br />
Assets<br />
2007 2006 2007 2006<br />
Cash investments (Note 5) ............................................................................. 1,622,729 1,267,723 16,214 21,987<br />
Regulatory assets (Note 7) ............................................................................. 1,914,959 2,111,936 – –<br />
Liabilities<br />
3,537,688 3,379,659 16,214 21,987<br />
Loans, fi nancings and debentures (Note 20).................................................... (5,426,247) (5,456,230) (79,322) (110,388)<br />
Regulatory liabilities (Note 7) ....................................................................... (1,139,243) (879,078) – –<br />
Contracted hedge and swap transactions (Note 35) ......................................... (183,508) (302,811) – –<br />
(6,748,998) (6,638,119) (79,322) (110,388)<br />
Liabilities in excess of assets .............................................................................. (3,211,310) (3,258,460) (63,108) (88,401)<br />
c) Credit risk<br />
This risk arises from the possibility of <strong>Cemig</strong> or its subsidiaries incurring<br />
losses as a result of difficulty in receiving amounts billed to their clients,<br />
A substantial part of sales of energy is widely spread out among a large<br />
number of clients, which reduces the Company’s risk, The procedures<br />
for reduction of defaulting consist of issuance of warnings of maturity<br />
of receivables, telephone contact, and negotiations to result in receipt<br />
of receivables, After the possibilities for regularization of accounts in<br />
arrears have been exhausted, supply is suspended.<br />
d) Risk of early maturity of debt<br />
The Company and its subsidiaries have contracts for loans,<br />
financings and debentures, with the restrictive covenant clauses<br />
normally applicable to these types of operation, related to the<br />
meeting of economic and financial indices, cash flow and other<br />
indicators, Non-compliance with these clauses could result in early<br />
maturity of debt, The restrictive clauses were complied with in<br />
full on December 31, 2007, and throughout the whole of the 2007<br />
business year.
e) Risk of non-renewal of concessions<br />
The Company has concessions for commercial operation of generation,<br />
transmission and distribution services, and management expects that<br />
they will be renewed by Aneel and/or the Mining and Energy Ministry,<br />
If the Mining and Energy Ministry does not grant the applications<br />
for renewals of these concessions, or if it decides to renew them upon<br />
imposition of additional costs for the company (“concessions for<br />
consideration”), the present levels of activity and profitability could<br />
be altered.<br />
36) – F<strong>IN</strong>A<strong>NCIAL</strong> <strong>IN</strong>STRUMENTS<br />
<strong>Cemig</strong> uses financial instruments, restricted to cash and cash equivalents,<br />
consumers and traders, amounts receivable from the Minas Gerais state<br />
government, loans and financings, and debentures, and the gains and losses<br />
obtained on the transactions are registered in full by the accrual method.<br />
<strong>Cemig</strong> has operational policies and strategies aiming for liquidity,<br />
profitability and security, and also procedures for monitoring balances, and<br />
64<br />
has operated with banks that meet the requirements for financial solidity<br />
and reliability, according to defined management criteria, The control<br />
policy consists of permanent monitoring of the rates contracted vis-à-vis<br />
those currently applied in the market.<br />
a) Market value<br />
The market values of cash assets and liabilities are determined based<br />
on available market information and appropriate valuation methods,<br />
The use of different market assumptions and/or methodologies from the<br />
estimates could cause figures to be different from the market estimate<br />
values.<br />
The accounting balances of cash investments and accounts receivable<br />
from the Minas Gerais state government on December 31, 2007 and<br />
2006 are equivalent to the market values, because they are recorded at<br />
realization value, The market values of loans and financings and swap<br />
transactions have been calculated by the present value of these financial<br />
instruments, using the interest rates practiced in the transactions with<br />
similar nature, tenor and risk, as shown below.<br />
The market value of financial instruments is as follows:<br />
2007 2006<br />
Book value Market value Book value Market value<br />
Assaets<br />
Cash Investments (Note 5) .......................................................................<br />
Accounts Receivable From Minas Gerais<br />
1,622,729 1,622,729 1,267,723 1,267,723<br />
State Government (Note 14) ....................................................... 1,763,277 1,763,277 1,726,293 1,726,293<br />
Liabilities<br />
Loans, Financings and Debentures<br />
3,386,006 3,386,006 2,994,016 2,994,016<br />
(Note 20) ................................................................................................ 7,639,034 7,452,849 7,648,937 7,480,461<br />
Contracted Hedge Transactions (Note 36) .................................... 166,448 184,389 176,575 187,160<br />
7,805,482 7,637,238 7,825,512 7,667,621<br />
b) Derivative instruments<br />
The derivative instruments contracted by <strong>Cemig</strong> and its subsidiaries have<br />
the purpose of protecting their operations against the risks arising from<br />
foreign exchange variation and are not used for speculative purposes.<br />
On December 31, 2007, <strong>Cemig</strong> maintained instruments to swap financial<br />
results with financial institutions, to protect against possible oscillations<br />
in the exchange rate between the Brazilian Real and the US dollar in an<br />
amount equivalent to US$68,932 (R$ 122,099) and yen in the amount<br />
equivalent to ¥3,878,825 (US$34,669 – R$ 61,409).<br />
The principal amounts of the transactions and derivatives are not posted in<br />
the balance sheet, since they refer to transactions which do not require cash<br />
payments, but only the gains or losses that actually occur, The net results<br />
realized on these transactions amounted to consolidated losses on 2007<br />
Receivable by<br />
<strong>Cemig</strong><br />
Payable by<br />
<strong>Cemig</strong><br />
Maturity<br />
period<br />
and 2006, of R$178,969 and R$91,612, respectively, posted in Financial<br />
revenue (expenses).<br />
The recognition of the net result not realized in operations with derivative<br />
instruments is carried out by the accrual method, which can generate<br />
differences when compared with the estimated market value of such<br />
instruments, This difference arises from the fact that market value includes<br />
recognition at present value of future gains or losses to be incurred on<br />
the transactions, in accordance with the expectation of the market at the<br />
moment at which the market value is ascertained.<br />
The table below shows the derivative instruments contracted by the<br />
subsidiaries <strong>Cemig</strong> Geração e Transmissão and <strong>Cemig</strong> Distribuição <strong>Cemig</strong>,<br />
the gains (losses) not realized, registered, and the respective estimate of<br />
market value of these instruments December 31, 2007:<br />
Principal amount<br />
contracted, ‘000-<br />
Book<br />
value<br />
December 31, 2007<br />
Unrealized loss<br />
Estimated<br />
market value<br />
In Yen R$<br />
+ rate indexed to CDI 12 / 2009 ¥3,878,825 (39,828) (48,648)<br />
(3.90% p.a.) (111.00% of CDI rate)<br />
In US$ R$ From<br />
+ rate 100% of CDI + rate 04 / 2008<br />
(5.58% to 7.48% p.a.) (1.50% to 3.01% p.a.) to 06 / 2013 US$68,932 (126,620) (135,741)<br />
(166,448) (184,389)<br />
Additionally, the jointly controlled subsidiary Light uses swap transactions to reduce risks arising from FX variations, The non-realized net value of these<br />
transactions on December 31, 2007, is R$2,532 negative (R$7,797 on December 31, 2006),
37) – <strong>IN</strong>SURANCE<br />
<strong>Cemig</strong> maintains insurance policies to cover damages to certain items of<br />
its assets, in accordance with orientation by specialists, as listed below,<br />
taking into account the nature and the degree of risk, for amounts<br />
Assets Cover Dates of validity<br />
CEMIG, <strong>Cemig</strong> Distribuição, <strong>Cemig</strong> Geração e Transmissão<br />
Air insurance – aircraft .................................................................................... Hull 28/04/2007 a 28/04/2008 12,096 177<br />
Stores, building facilities and Telecoms equipment ........................................ Fire 10/08/2007 to 10/08/2008 591,950 123<br />
Operational risk – generators, rotors and power equipment ............................<br />
Light<br />
Total 05/05/2007 to 05/05/2008 1,619,778 2,929<br />
Operational risk ............................................................................................... Total 31/10/2007 to 31/10/2008 1,802,298 1,109<br />
General third party ......................................................................................... Total 25/09/2007 to 25/09/2008 17,713 218<br />
Directors and board members .......................................................................... Total 10/08/2007 to 10/08/2008 53,139 530<br />
<strong>Cemig</strong> does not have insurance policies to cover accidents to third parties,<br />
and is not seeking proposals for this type of insurance. Additionally,<br />
<strong>Cemig</strong> has not sought proposals for and does not have current policies for,<br />
insurance against events that could affect its facilities, such as earthquakes,<br />
floods, systemic failures or the risk of interruption of business, and there<br />
have been no significant losses as a function of these risks.<br />
65<br />
Amount<br />
Insured<br />
Annual<br />
Premium<br />
2008 2009 2010 2011 2012 2013<br />
2014<br />
and after Total<br />
LOANS, F<strong>IN</strong>ANC<strong>IN</strong>GS AND<br />
DEBENTURES ...................................... 1,020,241 927,953 738,759 837,326 1,036,761 1,167,187 1,910,807 7,639,034<br />
Purchase of electricity from Itaipu (1) ........ 1,207,152 924,161 995,821 1,030,571 1,054,379 448,960 – 5,661,044<br />
Transport of electricity from Itaipu (1) ....... 80,448 70,613 73,237 75,837 78,143 33,552 – 411,830<br />
Baguari hydro plant ................................... 24,757 – – – – – – 24,757<br />
Aimorés hydro plant .................................. 20,052 – – – – – – 20,052<br />
Guanhães SPC ........................................... 16,481 – – – – – – 16,481<br />
Commercial Management System ............. 58,695 – – – – – – 58,695<br />
LT Charrúa ................................................ 8,516 – – – – – – 8,516<br />
Furnas – Pimenta transmission line .......... 15,729 – – – – – – 15,729<br />
Debt to Forluz pension plan ..................... 88,665 81,914 83,017 72,436 68,978 48,047 619,941 1,062,998<br />
Purchase of electricity at auction ................ 1,347,204 1,623,791 2,355,071 2,728,957 3,067,874 3,547,985 16,778,927 31,449,809<br />
Payments for concessions ........................... 1,480 1,494 1,494 1,494 6,078 12,494 304,968 329,502<br />
Total .......................................................... 3,889,420 3,629,926 4,247,399 4,746,621 5,312,213 5,258,225 19,614,643 46,698,447<br />
(1) Contract with Furnas, in US dollars, for purchase of electricity from Itaipu up to May 2013.<br />
39) – PERIODIC TARIFF REVIEW OF CEMIG DISTRIBUIÇÃO<br />
Aneel Resolution 234 of October 31, 2006, set new concepts and<br />
guidelines related to the second cycle of Periodic Review of the electricity<br />
distributors.<br />
The main changes are:<br />
• "Special Obligations" will be amortized as from the next Tariff Review,<br />
with posting of credit in the income statement of the distributors for the<br />
year, using the average rate of the assets giving rise to them.<br />
• The asset base to be used in the second Periodic Tariff Review will be the<br />
previous base, updated by the IGP-M inflation index, plus or minus new<br />
additions or write offs taking place in the period.<br />
considered sufficient to cover any significant losses related to its assets and<br />
responsibilities, The risk assumptions adopted, due to their nature, are not<br />
part of the scope of an audit of the financial statements, and consequently<br />
were not examined by the external auditors,<br />
38) – CONTRACTUAL OBLIGATIONS<br />
<strong>Cemig</strong> has contractual obligations and commitments that include<br />
amortization of loans and financings, contracts with contractors for the<br />
construction of new projects, purchase of electricity from Itaipu and other<br />
sources, as shown:<br />
• Aneel will continue to use the Reference Company as comparison base<br />
when defining operational costs to be covered by tariffs.<br />
Aneel is in the process of review of the tariffs for retail supply and the TUSD of<br />
<strong>Cemig</strong> Distribution, the 2nd cycle, corresponding to the period from 2008 to<br />
2013, the public hearing being scheduled for March 5, 2008 and the new tariffs<br />
to come into effect from April 8, 2008, The average percent of adjustment<br />
provisionally disclosed by Aneel is for a reduction of the tariff by 9,72%, In<br />
deciding this amount, parameters of the 1st cycle which are also being adjusted<br />
were taken into account, such as indicators of productivity, value of the assets<br />
base to be remunerated and also the average cost of capital defined, This<br />
provisional percentage may yet be altered as a result of contributions made at<br />
the public hearing, and decision by Aneel on the effective value of the asset base<br />
to be used for remuneration of the 2nd cycle of tariff review.
40) F<strong>IN</strong>A<strong>NCIAL</strong> ST<strong>ATEM</strong>ENTS SEPARATED BY COMPANY<br />
For the Year Ended on December 31, 2007<br />
CEMIG - CEMIG - RME ETEP, ENTE,<br />
SÁ CAR-<br />
DESCRIPTION HOLD<strong>IN</strong>G GT D Light ERTE, EATE GASMIG <strong>IN</strong>FOVIAS VALHO ROSAL Others Elimination TOTAL<br />
ASSETS .................................................................. 9,920,404 7,807,144 10,005,365 2,222,708 270,472 382,013 366,640 155,397 119,614 489,939 (7,473,193) 24,266,503<br />
Cash and cash equivalents .................................. 21,953 916,288 636,286 122,553 35,371 111,387 30,065 48,885 37,398 106,033 – 2,066,219<br />
Accounts receivable ............................................ 2,156,784 345,927 1,836,512 407,057 8,375 148,373 7,841 4,741 3,139 27,683 (557,595) 4,388,837<br />
Regulatory assets ................................................. – 45,898 2,423,558 109,209 – – – – – – – 2,578,665<br />
Other assets .......................................................... 670,662 572,697 1,077,898 571,992 3,267 32,345 135,124 29,496 4,692 26,797 (121,448) 3,003,522<br />
Investments/PP&E/Deferred .............................. 7,071,005 5,926,334 4,031,111 1,011,897 223,459 89,908 193,610 72,275 74,385 329,426 (6,794,150) 12,229,260<br />
LIABILITIES ........................................................ 9,920,404 7,807,144 10,005,365 2,222,708 270,472 382,013 366,640 155,397 119,614 489,939 (7,473,193) 24,266,503<br />
Suppliers .............................................................. 11,781 262,116 883,381 122,110 633 31,068 6,535 5,223 3,920 20,138 (70,208) 1,276,697<br />
Loans, fi nancings and debentures ...................... 79,322 3,111,647 2,752,083 487,984 144,303 – 5,615 – – 67,694 990,386 7,639,034<br />
Dividends and Interest on Equity ...................... 881,457 541,518 674,408 26,576 16,130 8,135 7,608 21,954 18,008 69,556 (1,383,893) 881,457<br />
Post–employment obligations ............................ 55,538 276,170 888,924 250,262 – – – – – – – 1,470,894<br />
Other liabilities .................................................... 502,129 627,430 2,366,027 665,434 9,336 150,712 17,177 34,142 7,394 39,006 (215,328) 4,203,459<br />
Future earnings ...................................................... – – – 86,236 – – – – – – – 86,236<br />
Minority interests .................................................. – – – 318,549 – – – – – – – 318,549<br />
Stockholders’ equity ........................................... 8,390,177 2,988,263 2,440,542 265,557 100,070 192,098 329,705 94,078 90,292 293,545 (6,794,150) 8,390,177<br />
<strong>IN</strong>COME ST<strong>ATEM</strong>ENT<br />
Net operational revenue ..................................... 36,543 2,665,603 5,976,411 1,252,732 67,924 231,747 68,263 38,638 29,522 130,833 (252,302) 10,245,914<br />
OPERATIONAL COSTS AND EXPENSES .. – – – – – – – – – – – –<br />
Personnel ............................................................. (22,948) (228,090) (618,904) (71,691) (1,661) (11,334) (8,081) (973) (1,207) (3,318) – (968,207)<br />
Post–employment obligations ............................ – – – – – = – – = – –<br />
Materials .............................................................. (5,144) (22,982) (73,570) (21,311) – – – – – – – (123,007)<br />
Raw materials ...................................................... (421) (18,085) (69,361) (3,902) (264) (1,003) – (213) (156) (191) – (93,596)<br />
Outsourced services ............................................ – (58,409) – – – – (499) – – – – (58,908)<br />
Royalties for use of water resources .................. (10,730) (95,512) (395,541) (68,325) (3,699) (4,407) (15,836) (4,249) (2,570) (18,796) – (619,665)<br />
Electricity bought for resale ............................... – (129,828) (3,247) – – – – (1,298) (1,028) (1,948) – (137,349)<br />
Charges for use of the grid.................................. – (75,448) (2,164,173) (646,445) – – – (248) (740) (10,911) 104,243 (2,793,722)<br />
Depreciation and amortization ........................... – (257,204) (446,838) (85,393) – – – – (3,303) (5,058) 148,059 (649,737)<br />
Operational provisions ........................................ (701) (223,486) (416,891) (82,219) (7,409) (4,344) (25,640) (2,508) (2,173) (12,773) – (778,144)<br />
Gas bought for resale .......................................... (30,085) (6,011) (175,959) (74,698) – (672) (21) – – (3,152) – (290,598)<br />
Other expenses, net ............................................. – – – – – (154,241) – – – – – (154,241)<br />
Outras Despesas Líquidas .................................. (4,042) (77,954) (161,625) (26,842) (1,196) (4,449) (5,445) (499) (311) (1,797) – (284,160)<br />
(74,071) (1,193,009) (4,526,109) (1,080,826) (14,229) (180,450) (55,522) (9,988) (11,488) (57,944) 252,302 (6,951,334)<br />
Operational profi t before equity income and<br />
Financial revenue (expenses) ............................. (37,528) 1,472,594 1,450,302 171,906 53,695 51,297 12,741 28,650 18,034 72,889 – 3,294,580<br />
Financial revenue (expenses) ............................... 1,343 (332,801) 7,853 (52,252) (11,409) 11,181 5,576 4,593 3,286 6,525 – (356,105)<br />
Operational profi t (loss) ........................................ (36,185) 1,139,793 1,458,155 119,654 42,286 62,478 18,317 33,243 21,320 79,414 – 2,938,475<br />
Non–operational profi t (loss) ................................<br />
Profi t (loss) before income tax, Social<br />
(11,043) (2,522) (43,027) (7,616) (10) (4) 54,155 – – (289) – (10,356)<br />
Contribution and employee profi t shares ........... (47,228) 1,137,271 1,415,128 112,038 42,276 62,474 72,472 33,243 21,320 79,125 – 2,928,119<br />
Deferred income tax and Social Contribution ..... (116,565) (280,271) (311,719) 151,221 (13,340) (16,337) (15,630) (9,199) (2,364) (8,101) – (622,305)<br />
Minority interests .................................................. – – – (115,480) – – – – – – – (115,480)<br />
Employee profi t shares ......................................... (12,288) (109,976) (332,201) – – – (420) – – – – (454,885)<br />
Net profi t for the year ......................................... (176,081) 747,024 771,208 147,779 28,936 46,137 56,422 24,044 18,956 71,024 – 1,735,449<br />
66
For the Year Ended on December 31, 2006<br />
DESCRIPTION HOLD<strong>IN</strong>G<br />
ASSETS................................................................. 9,462,907 7,379,646 9,447,368 2,138,166 281,046 295,354 370,878 143,152 136,197 406,458 (6,852,456) 23,208,716<br />
Cash and cash equivalents .................................. 23,389 687,814 214,103 177,577 47,956 62,507 17,327 43,373 31,158 70,297 – 1,375,501<br />
Accounts receivable ............................................ 1,897,274 410,326 2,943,674 560,857 7,645 114,638 28,504 4,653 2,698 19,062 (271,453) 5,717,878<br />
Regulatory assets ................................................. – 34,637 1,808,483 53,390 – – – – – – – 1,896,510<br />
Other assets .......................................................... 700,909 418,910 742,271 340,972 3,453 29,972 53,842 20,767 3,415 16,546 (23,508) 2,307,549<br />
Investments/PP&E/Deferred .............................. 6,841,335 5,827,959 3,738,837 1,005,370 221,992 88,237 271,205 74,359 98,926 300,553 (6,557,495) 11,911,278<br />
LIABILITIES ........................................................ 9,462,907 7,379,646 9,447,368 2,138,166 281,046 295,354 370,878 143,152 136,197 406,458 (6,852,456) 23,208,716<br />
Suppliers .............................................................. 6,346 137,637 873,542 123,685 2,754 26,747 23,050 3,034 2,632 7,714 (21,440) 1,185,701<br />
Loans, fi nancings and debentures ...................... 110,388 3,104,031 2,417,911 808,694 158,867 – 24,024 – – 43,231 981,791 7,648,937<br />
Dividends and Interest on Equity ...................... 1,373,828 379,054 670,712 8,537 6,272 22,272 17,327 48,598 (1,152,772) 1,373,828<br />
Post-employment obligations .............................<br />
Other liabilities<br />
387,210 503,328 2,157,396 581,182 6,319 110,018 56,410 24,970 11,133 14,667 (152,497) 3,700,136<br />
Future earnings .................................................... – – – 90,080 – – – – – – – 90,080<br />
Minority interests ................................................ – – – 77,738 – – 19,880 – – – – 97,618<br />
Stockholders’ equity .......................................... 7,522,453 2,950,912 2,349,982 212,015 104,569 152,317 247,514 92,876 105,105 292,248 (6,507,538) 7,522,453<br />
Djalma Bastos de Morais<br />
CEO<br />
Vice-Chairman<br />
Bernardo Afonso Salomão de Alvarenga<br />
Chief Trading Offi cer<br />
José Carlos de Matos<br />
Chief New Business Development Offi cer<br />
CEMIG -<br />
GT<br />
CEMIG -<br />
D<br />
RME<br />
Light<br />
ETEP, ENTE,<br />
SÁ CAR-<br />
ERTE, EATE GASMIG <strong>IN</strong>FOVIAS VALHO ROSAL Others Elimination TOTAL<br />
<strong>IN</strong>COME ST<strong>ATEM</strong>ENT<br />
Net operational revenue ......................................<br />
OPERATIONAL COSTS AND EXPENSES<br />
1,376 2,242,933 5,419,054 524,562 30,657 232,305 104,694 37,038 29,408 87,087 (242,472) 8,466,642<br />
Personnel ............................................................. (49,680) (249,293) (733,944) (26,646) (456) (10,984) (12,839) (757) (1,530) (2,065) – (1,088,194)<br />
Post-employment obligations ............................. (7,871) (36,331) (115,793) (9,915) – – – – – – (169,910)<br />
Materials .............................................................. (474) (17,555) (58,520) (2,070) (38) (555) (2,366) (187) (80) (127) – (81,972)<br />
Raw materials ...................................................... – (36,812) – – – – – – – – – (36,812)<br />
Outsourced services ............................................ (18,032) (88,674) (329,204) (26,292) (1,417) (5,366) (21,064) (3,058) (3,154) (7,732) – (503,993)<br />
Royalties for use of water resources .................. – (123,756) (11,581) – – – (1,548) (1,230) (840) – (138,955)<br />
Electricity bought for resale ............................... – (1,981,437) (227,981) – – – (320) (454) (6,452) 103,971 (2,112,673)<br />
Charges for use of the grid.................................. – (232,164) (515,224) (46,727) – – – – (2,986) (5,251) 138,501 (663,851)<br />
Depreciation and amortization ........................... (694) (207,924) (367,294) (33,418) (2,792) (3,507) (39,175) (2,508) (2,751) (12,194) – (672,257)<br />
Operational provisions ........................................ 98,840 (1,523) (108,834) (40,522) – – (23) – – – – (52,062)<br />
Gas bought for resale .......................................... – – – – – (157,732) – – – – – (157,732)<br />
Other expenses, net ............................................. (4,617) (70,226) (140,796) (11,450) (329) (3,242) (21,311) (520) (336) (931) 15,214 (238,544)<br />
17,472 (1,064,258) (4,362,627) (425,021) (5,032) (181,386) (96,778) (8,898) (12,521) (35,592) 257,686 (5,916,955)<br />
Operational profi t before equity income and<br />
Financial revenue(expenses) .............................. 18,848 1,178,675 1,056,427 99,541 25,625 50,919 7,916 28,140 16,887 51,495 15,214 2,549,687<br />
Financial revenue(expenses) .............................. 108,659 (319,103) 188,955 (23,169) (5,944) 6,407 (2,279) 5,321 3,212 3,481 (15,214) (49,674)<br />
Operational profi t(loss) ....................................... 127,507 859,572 1,245,382 76,372 19,681 57,326 5,637 33,461 20,099 54,976 – 2,500,013<br />
Non-operational profi t(loss) ...............................<br />
Profi t(loss) before income tax, Social<br />
(10,223) (2,292) (25,500) 806 – (398) 812 – – – – (36,795)<br />
Contribution and employee profi t shares ......... 117,284 857,280 1,219,882 77,178 19,681 56,928 6,449 33,461 20,099 54,976 – 2,463,218<br />
Deferred income tax and Social Contribution ....... 16,283 (193,430) (299,883) (35,974) (3,832) (12,984) 17,226 (8,756) (1,860) (4,386) – (527,596)<br />
Minority interests .................................................... – – – (6,520) – – (270) – – – – (6,790)<br />
Employee profi t shares ........................................... (9,321) (49,742) (150,432) – – – – (122) – (374) – (209,991)<br />
Net profi t for the year ........................................... 124,246 614,108 769,567 34,684 15,849 43,944 23,405 24,583 18,239 50,216 – 1,718,841<br />
***************************<br />
(The original is signed by the following signatories)<br />
Luiz Fernando Rolla<br />
Chief Offi cer for Finance, Investor Relations and<br />
Control of Holdings<br />
Fernando Henrique Schüffner Neto<br />
Chief Generation and Transmission Offi cer<br />
Pedro Carlos Hosken Vieira<br />
Controller<br />
67<br />
Marco Antonio Rodrigues da Cunha<br />
Chief Corporate Management Offi cer<br />
José Maria de Macedo<br />
Chief Distribution and Sales Offi cer<br />
Leonardo George de Magalhães<br />
Accounting General Manager Accountant<br />
– CRC-MG-53.140
APPENDIX I – ST<strong>ATEM</strong>ENT OF CASH FLOWS<br />
YEARS ENDED DECEMBER 31, 2007 AND 2006 (R$ ’000)<br />
Statement in accordance with the criteria for disclosure set by FAS 95 – Statement of Cash Flows, since <strong>Cemig</strong> is registered with the SEC and also prepares<br />
financial statements in accordance with US GAAP,<br />
Consolidated Holding company<br />
2007 2006 2007 2006<br />
FROM OPERATIONS<br />
Net profi t for the year .....................................................................................................................<br />
Expenses (revenue) not affecting cash<br />
1,735,449 1,718,841 1,735,449 1,718,841<br />
Depreciation and amortization ................................................................................................... 778,144 672,257 701 694<br />
Net write-offs of PP&E .............................................................................................................. 30,084 21,596 – 4,182<br />
Equity income ......................................................................................................................... – – (1,911,530) (1,594,595)<br />
Interest and monetary updating – non-current ........................................................................... (388,869) (392,919) (62,013) (179,340)<br />
Provision (reversal) for losses on recovery of Extraordinary Tariff Recomposition ........................ 174,832 86,154 26,594 29,217<br />
Provision (reversal) for operational losses .................................................................................... 296,824 191,988 12,070 (142,566)<br />
Post-employment obligations ..................................................................................................... 123,007 169,910 5,144 7,871<br />
Provision for losses on accounts receivable from the Minas Gerais state government .................. – 19,978 – 19,978<br />
Deferred federal taxes ................................................................................................................. (403,546) (71,704) (10,107) (9,934)<br />
Provision for losses on fi nancial instruments ............................................................................... 178,969 91,612 – –<br />
Minority interests ...................................................................................................................... 115,480 6,790 – –<br />
Others ........................................................................................................................................ (1,194) (120,461) 20,130 82<br />
(Increase) reduction in assets<br />
2,639,180 2,394,042 (183,562) (145,570)<br />
Consumers and traders ............................................................................................................... (91,107) (630,646) – –<br />
Traders – transactions on the CCEE ............................................................................................ 120,894 194,856 – –<br />
Extraordinary Tariff Recomposition............................................................................................ 301,779 257,171 – –<br />
Taxes offsettable ......................................................................................................................... (296,146) (165,291) 8,845 (85,513)<br />
Deferred tariff adjustment .......................................................................................................... 509,286 294,353 – –<br />
Other current assets ................................................................................................................... 155,172 97,903 (2,893) 21,422<br />
Anticipated expenses – CVA ...................................................................................................... 77,342 126,119 – –<br />
Tax credits ................................................................................................................................. (25,902) (27,354) 36,972 (31,786)<br />
Transport of electricity .............................................................................................................. (104,466) (55,048) – –<br />
Payments into court ................................................................................................................... (17,068) (124,987) (9,920) 4,299<br />
Dividends received from subsidiaries .......................................................................................... – – 1,444,658 1,644,463<br />
Amortization of accounts receivable from the Minas Gerais state government ............................ 122,007 78,760 – –<br />
Other non-current assets ............................................................................................................ (5,847) 30,317 (3,202) 29,856<br />
Increase (reduction) of liabilities<br />
745,944 76,153 1,474,460 1,582,741<br />
Suppliers .................................................................................................................................... (34,268) (124,738) 5,435 (13,856)<br />
Taxes and Social Contribution .................................................................................................... 18,952 (74,435) 20,055 (3,664)<br />
Salaries and obligatory payments on payroll ............................................................................... 51,265 (634) 1,496 (1,458)<br />
Regulatory charges ..................................................................................................................... (29,655) 74,393 – –<br />
Loans and fi nancings .................................................................................................................. (54,243) 8,553 (1,057) (1,921)<br />
Post-employment obligations ..................................................................................................... (245,219) (268,107) (12,288) (13,126)<br />
Anticipated expenses – CVA ..................................................................................................... 174,416 46,360 – –<br />
Losses on fi nancial instruments ................................................................................................... (189,096) 30,893 – –<br />
Other ......................................................................................................................................... 135,252 22,605 84,412 4,807<br />
68<br />
(172,596) (285,110) 98,053 (29,218)
CASH FROM OPERATIONS ........................................................................................................ 3,212,528 2,185,085 1,388,951 1,407,953<br />
F<strong>IN</strong>ANC<strong>IN</strong>G ACTIVITIES<br />
Financings obtained ........................................................................................................................ 1,055,910 2,265,902 – 30,000<br />
Sale of participation in the FIDC .................................................................................................... – – – 900,000<br />
Receipt of units in the FIDC .......................................................................................................... – – 7,267 26,611<br />
Payments of loans and fi nancings ................................................................................................... (1,855,095) (1,926,540) (30,246) –<br />
Short-term loans ............................................................................................................................. 800,000 1,200,000 – –<br />
Interest on dividends and Interest on Equity ................................................................................... (1,360,096) (2,071,666) (1,360,096) (2,071,666)<br />
(1,359,281) (532,304) (1,383,075) (1,115,055)<br />
TOTAL <strong>IN</strong>FLOW OF FUNDS ....................................................................................................... 1,853,247 1,652,781 5,876 292,898<br />
<strong>IN</strong>VESTMENTS<br />
In fi xed assets ................................................................................................................................. (108,933) (552,681) (7,055) (569,574)<br />
In PP&E ......................................................................................................................................... (1,392,868) (1,469,762) (702) –<br />
Special obligations – contributions by consumers ....................................................................... 267,897 304,642 – –<br />
Sale of stockholding ................................................................................................................... 49,234 – – –<br />
In deferred ..................................................................................................................................... (4,405) (1,998) – –<br />
69<br />
Consolidated Holding company<br />
2007 2006 2007 2006<br />
(1,189,075) (1,719,799) (7,757) (569,574)<br />
NET CHANGE <strong>IN</strong> CASH POSITION ........................................................................................<br />
CHANGES <strong>IN</strong> CASH POSITION<br />
664,172 (67,018) (1,881) (276,676)<br />
Start of period ................................................................................................................................. 1,402,047 1,344,135 23,834 300,510<br />
Initial balance – Acquisition of subsidiaries .................................................................................... – 124,930 – –<br />
End of period ................................................................................................................................. 2,066,219 1,402,047 21,953 23,834<br />
PAYMENTS MADE <strong>IN</strong> THE YEAR<br />
664,172 (67,018) (1,881) (276,676)<br />
Interest on loans and fi nancings ...................................................................................................... 814,184 781,052 11,243 14,585<br />
Income tax and Social Contribution ............................................................................................. 1,091,271 696,224 50,126 8,917<br />
TRANSACTIONS NOT <strong>IN</strong>VOLV<strong>IN</strong>G OUTFLOW OF CASH<br />
Financial charges transferred to PP&E ............................................................................................ 8,822 24,750 – –<br />
Dividends offset with CRC credits .................................................................................................. 122,007 78,760 – –
APPENDIX II ST<strong>ATEM</strong>ENTS OF ADDED VALUE<br />
YEARS ENDED DECEMBER 31, 2007 AND 2006 (R$ ’000)<br />
Consolidated Holding company<br />
2007 2006 2007 2006<br />
REVENUES<br />
Operational revenues .......................................... 15,789,531 13,431,731 40,738 1,457<br />
Provision for doubtful receivables ...................... (143,190) (128,618) 6,994 12,233<br />
Non-operational profi t (loss) ............................... (10,356) (36,795) (11,043) (10,223)<br />
<strong>IN</strong>PUTS ACQUIRED FROM THIRD PARTIES<br />
15,635,985 13,266,318 36,689 3,467<br />
Electricity bought for resale ................................ (2,793,722) (2,112,673) – –<br />
Charges for use of the Basic Grid ........................ (649,737) (663,851) – –<br />
Outsourced services ........................................... (619,665) (503,993) (10,730) (18,032)<br />
Gas bought for resale .......................................... (154,241) (157,732) – –<br />
Materials ............................................................ (93,596) (81,972) (421) (474)<br />
Raw materials ..................................................... (58,908) (36,812) – –<br />
Other operational costs ....................................... (368,664) (99,553) (40,448) 98,204<br />
(4,738,533) (3,656,586) (51,599) 79,698<br />
GROSS VALUE ADDED ................................... 10,897,452 9,609,732 (14,910) 83,165<br />
RETENTIONS<br />
Depreciation and amortization ............................ (778,144) (672,257) (701) (694)<br />
NET VALUE ADDED ....................................... 10,119,308 8,937,475 (15,611) 82,471<br />
ADDED VALUE RECEIVED BY TRANSFER .. 1,911,530 1,594,595<br />
Equity income from subsidiaries ......................... 1,350,891 1,464,002 114,080 223,352<br />
Financial revenues .............................................. 1,350,891 1,464,002 2,025,610 1,817,947<br />
ADDED VALUE TO BE DISTRIBUTED ..... 11,470,199 10,401,477 2,009,999 1,900,418<br />
DISTRIBUTION OF ADDED VALUE ............. % % % %<br />
Personnel and obligatory payments on payroll .... 1,754,910 15 1,625,353 16 49,375 2 77,839 4<br />
Taxes and contributions ...................................... 6,254,922 54 5,658,967 54 154,315 8 26,678 1<br />
Financial expenses and rentals ............................. 1,609,438 14 1,391,526 14 70,860 4 77,060 4<br />
Dividends, and Interest on Equity ...................... 867,725 8 1,381,781 13 867,725 43 1,381,781 73<br />
Minority interests ............................................... 115,480 1 6,790 – – – – –<br />
Retained earnings ............................................... 867,724 8 337,060 3 867,724 43 337,060 18<br />
11,470,199 100 10,401,477 100 2,009,999 100 1,900,418 100<br />
70
APPENDIX III - <strong>IN</strong>COME ST<strong>ATEM</strong>ENTS SEPARATED BY ATIVITY<br />
YEAR END<strong>IN</strong>G DECEMBER 31, 2007 (R$ ’000)<br />
DESCRIPTION Holding Generation<br />
OPERATIONAL REVENUE<br />
Gross revenue from supply of electricity ..................... – 3,086,293 – 10,312,757 12 (113,730) 13,285,332<br />
Revenue from use of the network ................................. – 106,593 525,838 1,461,558 – (148,059) 1,945,930<br />
Other operational revenues ........................................... 40,738 42,864 9,789 87,721 383,910 (6,753) 558,269<br />
Gross revenue from sales and/or services ..................... 40,738 3,235,750 535,627 11,862,036 383,922 (268,542) 15,789,531<br />
DEDUCTIONS FROM OPERATIONAL REVENUE . (4,195) (649,391) (126,300) (4,685,586) (78,145) – (5,543,617)<br />
NET OPERATIONAL REVENUE ........................... 36,543 2,586,359 409,327 7,176,450 305,777 (268,542) 10,245,914<br />
COST OF ELECTRICITY SERVICE<br />
COST OF ELECTRICITY AND GAS<br />
Electricity purchased for resale .................................. – (102,597) – (2,811,398) (38) 120,311 (2,793,722)<br />
Charges for the use of the basic transmission grid ..... – (265,462) – (532,334) – 148,059 (649,737)<br />
Gas purchased for resale ............................................ – – – (154,241) – (154,241)<br />
– (368,059) – (3,343,732) (154,279) 268,370 (3,597,700)<br />
COST OF OPERATION<br />
Personnel and managers ............................................. – (131,674) (81,651) (653,052) – – (866,377)<br />
Private pension plan entity ......................................... – (14,406) (8,070) (87,878) – – (110,354)<br />
Materials ..................................................................... – (11,480) (6,817) (71,189) (444) – (89,930)<br />
Raw materials and inputs for production of electricity .. – (58,409) – – – – (58,409)<br />
Outsourced services ................................................... – (88,025) (26,415) (378,064) (8,427) 103 (500,828)<br />
Depreciation and amortization ................................... – (206,680) (46,916) (464,842) (29,758) – (748,196)<br />
Operational provisions ............................................... – (7,716) 277 (42,475) – – (49,914)<br />
Royalties for use of water resources .......................... – (134,102) – – – – (134,102)<br />
Others ......................................................................... – (41,765) (16,366) (97,651) (12,572) 69 (168,285)<br />
– (694,257) (185,958) (1,795,151) (51,201) 172 (2,726,395)<br />
TOTAL COST .............................................................. – (1,062,316) (185,958) (5,138,883) (205,480) 268,542 (6,324,095)<br />
GROSS PROFIT ......................................................... 36,543 1,524,043 223,369 2,037,567 100,297 – 3,921,819<br />
OPERATIONAL EXPENSES ................................... – – – – – – –<br />
Selling expenses ......................................................... – (8,017) – (227,148) (672) – (235,837)<br />
General and administrative expenses ......................... (74,071) (41,199) (16,615) (186,132) (1,869) – (319,886)<br />
Other operational revenue (expenses) ........................ – (10,219) (4,254) (24,552) (32,491) – (71,516)<br />
(74,071) (59,436) (20,869) (437,831) (35,032) – (627,239)<br />
Operational profi t before equity income and<br />
fi nancial revenues (expenses) ..................................... (37,528) 1,464,607 202,500 1,599,736 65,265 – 3,294,580<br />
– – – – – –<br />
Financial revenue (expenses) ..................................... 1,343 (341,303) (14,416) (18,724) 16,995 – (356,105)<br />
OPERATIONAL PROFIT (LOSS) ........................... (36,185) 1,123,304 188,084 1,581,012 82,260 – 2,938,475<br />
NON–OPERATIONAL PROFIT (LOSS) ................ (11,043)<br />
Profi t (loss) before income tax, Social Contribution<br />
676 (3,617) (50,523) 54,151 – (10,356)<br />
and electricity profi t shares ..................................... (47,228) 1,123,980 184,467 1,530,489 136,411 – 2,928,119<br />
Income tax and Social Contribution ............................. (116,565) (267,723) (45,274) (160,498) (32,245) – (622,305)<br />
Employee profi t shares ................................................. (12,288) (72,586) (37,390) (332,201) (420) – (454,885)<br />
Minority interest ............................................................ – – – (115,480) – – (115,480)<br />
Net profi t for the year ................................................. (176,081) 783,671 101,803 922,310 103,746 – 1,735,449<br />
71<br />
Transmission<br />
Distribution<br />
and sales Others<br />
Elimination<br />
Total
APPENDIX III - <strong>IN</strong>COME ST<strong>ATEM</strong>ENTS SEPARATED BY ATIVITY<br />
YEAR END<strong>IN</strong>G DECEMBER 31, 2007 (R$ ’000)<br />
DESCRIPTION Holding Generation<br />
OPERATIONAL REVENUE<br />
Gross revenue from supply of electricity .................. – 2,526,855 – 8,712,116 – (103,971) 11,135,000<br />
Revenue from use of the network .............................. – 56,195 611,056 1,260,721 – (138,501) 1,789,471<br />
Other operational revenues ........................................ 1,457 8,869 5,253 63,515 427,806 – 506,900<br />
Gross revenue from sales and/or services ..................<br />
DEDUCTIONS FROM OPERATIONAL<br />
1,457 2,591,919 616,309 10,036,352 427,806 (242,472) 13,431,371<br />
REVENUE ................................................................ (81) (551,614) (156,953) (4,169,167) (86,914) – (4,964,729)<br />
NET OPERATIONAL REVENUE ........................... 1,376 2,040,304 459,356 5,867,186 340,892 (242,472) 8,466,642<br />
COST OF ELECTRICITY SERVICE<br />
COST OF ELECTRICITY AND GAS<br />
Electricity purchased for resale .................................. – (10,546) – (2,206,098) – 103,971 (2,112,673)<br />
Charges for the use of the basic transmission grid ..... – (240,401) – (561,951) – 138,501 (663,851)<br />
Gas purchased for resale ......................................... – – – – (157,732) – (157,732)<br />
– (250,947) – (2,768,049) (157,732) 242,472 (2,934,256)<br />
COST OF OPERATION<br />
Personnel and managers ............................................. – (147,018) (87,585) (758,162) – – (992,765)<br />
Private pension plan entity ......................................... – (24,746) (12,882) (122,019) – – (159,647)<br />
Materials ..................................................................... – (12,090) (6,461) (59,968) – – (78,519)<br />
Raw materials and inputs for production of electricity .. – (36,812) – – – – (36,812)<br />
Outsourced services ................................................... – (73,854) (20,877) (316,584) (3) – (411,318)<br />
Depreciation and amortization ................................... – (190,033) (40,573) (396,319) (1) – (626,926)<br />
Operational provisions ............................................... – (185) (16) (23,775) – – (23,976)<br />
Royalties for use of water resources .......................... – (127,374) – (11,581) – – (138,955)<br />
Others ......................................................................... – (37,572) (10,487) (95,057) (1) 15,214 (127,903)<br />
– (649,685) (178,881) (1,783,464) (5) 15,214 (2,596,821)<br />
TOTAL COST .............................................................. – (900,632) (178,881) (4,551,513) (157,737) 257,686 (5,531,077)<br />
GROSS PROFIT .........................................................<br />
OPERATIONAL EXPENSES<br />
1,376 1,139,672 280,475 1,315,673 183,155 15,214 2,935,565<br />
Selling expenses ......................................................... – (22,290) – (130,429) – – (152,719)<br />
General and administrative expenses ......................... 17,472 (31,722) (14,949) (46,199) (2,741) – (78,139)<br />
Other operational revenue (expenses) ........................ – (9,195) (2,204) (22,759) (120,862) – (155,020)<br />
17,472 (63,207) (17,153) (199,387) (123,603) – (385,878)<br />
Operational profi t before equity income<br />
and fi nancial revenues (expenses) .............................. 18,848 1,076,465 263,322 1,116,286 59,552 15,214 2,549,687<br />
F<strong>IN</strong>A<strong>NCIAL</strong> REVENUE (EXPENSES) ...................... 108,659 (317,597) 1,803 168,345 4,330 (15,214) (49,674)<br />
OPERATIONAL PROFIT (LOSS) ........................... 127,507 758,869 265,125 1,284,630 63,882 – 2,500,013<br />
NON–OPERATIONAL PROFIT (LOSS) ................ (10,223)<br />
Profi t (loss) before income tax, Social<br />
(769) (1,502) (24,715) 414 – (36,795)<br />
Contribution and electricity profi t shares ............. 117,284 758,100 263,623 1,259,915 64,296 – 2,463,218<br />
Income tax and Social Contribution ............................. 16,283 (188,428) (25,325) (334,330) 4,204 – (527,596)<br />
Employee profi t shares ................................................. (9,321) (30,984) (18,880) (150,432) (374) (209,991)<br />
Minority interest ............................................................ – (6,520) – – (270) – (6,790)<br />
Net profi t for the year ................................................. 124,246 532,168 219,419 775,153 67,856 – 1,718,841<br />
72<br />
Transmission<br />
Distribution<br />
and sales Others<br />
Elimination<br />
Total
To<br />
The Board of Directors and Shareholders<br />
Companhia Energética de Minas Gerais – CEMIG<br />
Belo Horizonte - MG<br />
1. We have examined the accompanying balance sheet of Companhia<br />
Energética de Minas Gerais – CEMIG and the consolidated balance<br />
sheet of the Company and its subsidiaries as of December 31, 2007,<br />
and the related statements of income, changes in shareholders’ equity<br />
and changes in financial position for the year then ended, which are<br />
the responsibility of its management. Our responsibility is to express<br />
an opinion on these financial statements. The financial statements<br />
of the jointly-controlled company and indirect controlled company,<br />
Rio Minas Energia Participações S.A. and Light S.A., respectively,<br />
as of and for the year ended December 31, 2007 were examined by<br />
other independent auditors. In the financial statements of Companhia<br />
Energética de Minas Gerais – CEMIG the participation on these<br />
companies are recognized by the equity method of accounting and<br />
represent investments in the amount of R$ 265.5 million, and<br />
its equity in the earnings of these investments, in the statement of<br />
income, amount to an income of R$ 147.7 million. The financial<br />
statements of these companies, with total assets of R$2,236.6 million<br />
as of December 31, 2007, are included in the consolidated financial<br />
statements. Our report, insofar as it relates to the amounts generated<br />
by these companies during the year, is based solely on the examination<br />
conducted by the independent auditors of Rio Minas Energia<br />
Participações S.A. and Light S.A.<br />
2. Our examination was conducted in accordance with auditing standards<br />
generally accepted in Brazil and included: (a) planning of the audit<br />
work, considering the materiality of the balances, the volume of<br />
transactions and the accounting systems and internal accounting<br />
controls of the Company and its subsidiaries; (b) verification, on a<br />
test basis, of the evidence and records which support the amounts<br />
and accounting information disclosed; and (c) evaluation of the most<br />
significant accounting policies and estimates adopted by Company<br />
management and its subsidiaries, as well as the presentation of the<br />
financial statements taken as a whole.<br />
3. In our opinion, based on our audit and on the audit reports of other<br />
independent auditors, the aforementioned financial statements present<br />
fairly, in all material respects, the financial position of Companhia<br />
Energética de Minas Gerais – CEMIG and the consolidated financial<br />
position of the Company and its subsidiaries as of December 31, 2007,<br />
and the results of its operations, changes in its shareholders’ equity and<br />
changes in its financial position for the year then ended, in conformity<br />
with accounting practices adopted in Brazil.<br />
4. Our examination was performed with the objective of expressing an<br />
opinion on the financial statements taken as a whole. The statements<br />
<strong>IN</strong>DEPENDENT AUDITORS’ REPORT<br />
73<br />
of cash flows, added value, and income statements separated by<br />
activity, presented in the appendix I, II and III, related to the year<br />
ended December 31, 2007 are supplementary to the aforementioned<br />
financial statements and have been included to facilitate additional<br />
analysis. This supplementary information was subject to the same<br />
audit procedures as applied to the aforementioned financial statements<br />
and, in our opinion, are presented fairly, in all material respects, in<br />
relation to the financial statements taken as a whole.<br />
5. As described in Notes 7, 8, 9 and 18 to the financial statements,<br />
Companhia Energética de Minas Gerais – CEMIG and its subsidiaries<br />
have assets and liabilities recorded in relation to transactions for the<br />
sale and purchase of energy and other transactions on the Electricity<br />
Trading Chamber (CCEE) (previously called “MAE”). These amounts<br />
were recorded on the basis of calculations prepared and published by<br />
the CCEE for transactions carried out to December 31, 2007, and<br />
may be changed as a result of decisions in current Court Proceedings<br />
brought by companies in the sector, in relation to the interpretation of<br />
the rules of the wholesale energy market.<br />
6. The financial statements of Companhia Energética de Minas Gerais<br />
– CEMIG and the supplementary information of cash flows, added<br />
value, and income statements separated by activity for the year<br />
ended December 31, 2006, presented for comparative purpose,<br />
were examined by other independent auditors, which expressed an<br />
unqualified opinion, dated February 28, 2007, and including an<br />
emphasis paragraph relating to the matter mentioned in paragraph 5,<br />
and relating to the change in the percentage of the tariff repositioning<br />
due to the final tariff review for <strong>Cemig</strong> Distribuição S.A. and related<br />
to the expiration of the electricity generation concessions held by the<br />
subsidiary <strong>Cemig</strong> Geração e Transmissão S.A. for the Emborcação, Nova<br />
Ponte, Pandeiros, Rio das Pedras, Poço Fundo, São Bernardo, Xicão,<br />
Luiz Dias and Santa Luzia hydroelectric plants. On June 14, 2007, the<br />
Mining and Energy Ministry (MME) renewed these concessions for a<br />
period of 20 years beginning on the date of maturity of each concession<br />
contract. The signing of the renewed concession contracts is expected<br />
during the first half of 2008.<br />
March 6, 2008<br />
KPMG Auditores Independentes<br />
CRC SP014428/O-6-F-MG<br />
Marco Túlio Fernandes Ferreira Rosane Palharim<br />
Accountant CRCMG058176/O-0 Accountant CRC 1SP220280/O-9-S-MG
GOVERNO DE M<strong>IN</strong>AS GERAIS