port and ocean engineering under arctic conditions - Poac.com
port and ocean engineering under arctic conditions - Poac.com
port and ocean engineering under arctic conditions - Poac.com

Create successful ePaper yourself
Turn your PDF publications into a flip-book with our unique Google optimized e-Paper software.
PORT AND OCEAN<br />
ENGINEERING<br />
UNDER ARCTIC CONDITIONS<br />
VOLUME 11<br />
SYMPOSIUM ON NOISE AND MARINE MAMMALS<br />
Edited by<br />
Symposium Organizers<br />
<strong>and</strong> Editors<br />
W.M. SACKINGER. Ph. D.. P.E. J.L. IMM<br />
M.O. JEFFRIES. Ph. D. S.D. TREACY<br />
The Geophysical Institute<br />
Minerals Management Service<br />
University of Alaska Fairbanks<br />
U.S. Department of the Interior<br />
Anchorage, Alaska<br />
The Geophysical Institute<br />
University of Alaska Fairbanks<br />
Fairbanks, Alaska
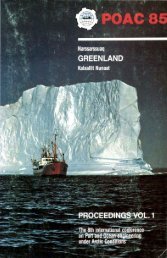
Beluga whale (Delphinapterus leucas) in new ice.<br />
Photo Credit: Naval Ocean Systems Center
Copyright @ 1988 by the Geophysical Institute, University of Alaska Fairbanks. All rights<br />
reserved. No part of this publication may be reproduced, stored in a retrieval system, or<br />
transmitted in any form or by any means, electronic, mechanical, photocopying, recording,<br />
or otherwise, without the prior written permission of the publisher, the Geophysical<br />
Institute, University of Alaska Fairbanks, Fairbanks, Alaska 99775-0800, U.S.A.<br />
ISBN 0 - 915360 - 06 - 3
PREFACE<br />
The series of conferences on Port <strong>and</strong> Ocean Engineering <strong>under</strong> Arctic<br />
Conditions (POAC) is organized biennially by national POAC <strong>com</strong>mittees <strong>under</strong> the<br />
long-term policy direction of the POAC International Committee. Previous POAC<br />
conferences have been held in Norway (21, Canada (21, Icel<strong>and</strong>, Finl<strong>and</strong>, Greenl<strong>and</strong><br />
<strong>and</strong> Alaska. The Ninth Conference (POAC-87) in the POAC series was held at the<br />
University of Alaska Fairbanks, Alaska, USA from August 17-2 1, 1987. This multi-<br />
volume book, entitled "Port <strong>and</strong> Ocean Engineering Under Arctic Conditions", is a<br />
<strong>com</strong>pilation of the papers written for <strong>and</strong> presented at POAC-87.<br />
A total of 224 people registered for POAC-87 <strong>and</strong> 122 papers were presented<br />
during 14 sessions. The sessions were: Arctic Database; Ice Properties;<br />
Icebreaking Vessels; Ice Modelling; Arctic Port Design; Geotechnical; Ice-structure<br />
Interaction; Ice Morphology; Ice Dynamics; Ice, Climate <strong>and</strong> Forecasting; Spray Ice;<br />
Remote Sensing; <strong>and</strong> two special symposia on Noise <strong>and</strong> Marine Mammals, <strong>and</strong><br />
SteelIConcrete Composite Structural Systems.<br />
Papers submitted to POAC-87 were reviewed <strong>and</strong> edited prior to publication. All<br />
the papers in this book have been refereed by two, three, or more reviewers, <strong>and</strong> then<br />
edited, to try to ensure a consistent <strong>and</strong> high st<strong>and</strong>ard for technical content, style<br />
<strong>and</strong> format for publication. Once accepted for publication, authors submitted a<br />
camera-ready copy of their papers. The majority of papers in this book were<br />
verbally presented at POAC-87; a few authors were unable to attend the conference,<br />
but their papers have been published since they met the necessary review <strong>and</strong> editorial<br />
st<strong>and</strong>ards.
ACKNOWLEDGEMENTS<br />
Many individuals <strong>and</strong> organizations contributed to the success of POAC-87 <strong>and</strong> to<br />
the publication of this book.<br />
The conference SPONSORS were:<br />
University of Alaska Fairbanks<br />
Geophysical Institute, University of Alaska Fairbanks<br />
Minerals Management Service, Technology Assessment <strong>and</strong> Research Program<br />
National Science Foundation<br />
Minerals Management Service, Environmental Studies Branch, Alaska OCS Region<br />
Alaska Oil <strong>and</strong> Gas Association, Lease Planning <strong>and</strong> Research<br />
Committee, Member Companies:<br />
Amoco Production Company<br />
ARC0 Alaska, Inc.<br />
BP Alaska Exploration Inc.<br />
Chevron USA, Inc.<br />
Conoco, Inc.<br />
Elf Aquitaine Petroleum<br />
Exxon Company, USA<br />
Marathon Oil Company<br />
Mobil Oil Corporation<br />
Shell Western E & P, Inc.<br />
St<strong>and</strong>ard Alaska Petroleum Company<br />
Unocal Corporations<br />
<strong>and</strong> the CO-SPONSORS were:<br />
American Society of Civil Engineers<br />
Alaska Academy of Engineering <strong>and</strong> Science<br />
Centre for Frontier Engineering Research (C-FER)<br />
Le Comite Arctique International<br />
The long-term policy of the conferences on Port <strong>and</strong> Ocean Engineering <strong>under</strong><br />
Arctic Conditions is directed by the POAC INTERNATIONAL COMMITTEE (1987):<br />
Prof. Per Tryde<br />
Technical University of Denmark (President)
Mr. Alf Engelbrektson<br />
VBB-SWECO Engineers, Stockholm, Sweden (Vice President)<br />
Prof. Per Bruun<br />
The Norwegian Institute of Technology. Trondheim, Norway<br />
(Secretary General)<br />
Prof. William M. Sackinger<br />
University of Alaska Fairbanks, Fairbanks, Alaska, USA<br />
(Past President)<br />
Dr. Pauli Jumppanen<br />
Oy Wartsila Ab. Helsinki, Finl<strong>and</strong> (Past President)<br />
Prof. Bernard Michel<br />
Lava1 University, Quebec, Canada (Past President)<br />
Mr. K.R. Croasdale<br />
Esso Resources Canada, Calgary, Alberta, Canada<br />
Prof. G.R. Peters<br />
Memorial University of Newfoundl<strong>and</strong>, St. John's,<br />
Newfoundl<strong>and</strong>, Canada<br />
Dr. K. Takekuma<br />
Nagasaki Technical Institute/Mitsubishi Heavy<br />
Industries, Nagasaki, Japan<br />
Dr. -1ng. Joachim Schwarz<br />
Hamburgische Schiffbau-Versuchsanstalt, Hamburg, Germany<br />
Mr. G. Viggoson<br />
Vita og Hafnamala Stjarinn, Reykjavik, Icel<strong>and</strong><br />
Dr. E. Enkvist<br />
Wartsila Arctic Research Centre, Helsinki, Finl<strong>and</strong><br />
Dr. T. Carstens<br />
Norwegian Hydrodynamics Labs, Trondheim, Norway<br />
Prof. Xu Ji-zu<br />
Tianjin University, Tianjin, China<br />
Dr. W.F. Weeks<br />
University of Alaska Fairbanks, Fairbanks, Alaska, USA
POAC-87 was organized by the U.S. NATIONAL ORGANIZING COMMITTEE:<br />
Prof. W.M. Sackinger, Chairman; University of Alaska Fairbanks, Fairbanks,<br />
Alaska<br />
Mr. Muhammed A. Ali<br />
Chevron Corporation, San Francisco, California<br />
Prof. F. Lawrence Bennett<br />
University of Alaska Fairbanks, Fairbanks, Alaska<br />
Mr. Chris Birch<br />
State of Alaska Department of Trans<strong>port</strong>ation, Fairbanks, Alaska<br />
Mr. Irving Boaz<br />
Shell Oil Company, Houston, Texas<br />
Comdr. Lawson W. Brigharn<br />
U.S. Coast Guard, Boston, Massachusetts<br />
Mr. David Chiang<br />
Science Applications International Corp., McLean, Virginia<br />
Prof. Jin S. Chung<br />
Colorado School of Mines, Golden, Colorado<br />
Mr. Roger Colony<br />
University of Washington, Seattle, Washington<br />
Dr. M.J. Feifarek<br />
Marathon Oil Company, Houston, Texas<br />
Mr. Joseph Galate<br />
Enertech Engineering & Research Company, Houston, Texas<br />
Prof. Ben. C. Gerwick, Jr.<br />
University of California-Berkeley, Berkeley, California<br />
Mr. H. Glenzer, Jr.<br />
State of Alaska Department of Trans<strong>port</strong>ation, Fairbanks, Alaska<br />
Mr. Roger Herrera<br />
St<strong>and</strong>ard Alaska Production Company, Anchorage, Alaska<br />
Mr. Malcolm W. Howard<br />
BP Petroleum Development Ltd., London, United Kingdom<br />
Mr. Jerry Imm<br />
Minerals Management Service, Anchorage, Alaska<br />
vii
Dr. Martin 0. Jeffries<br />
University of Alaska Fairbanks, Fairbanks, Alaska<br />
Dr. Jerome B. Johnson<br />
USA CRREL, Ft. Wainwright, Alaska<br />
Mr. Austin Kovacs<br />
USA CRREL, Hanover, New Hampshire<br />
Dr. Thomas Kozo<br />
US Naval Academy, Annapolis, Maryl<strong>and</strong><br />
Prof. Charles Ladd<br />
Massachusetts Institute of Technology, Cambridge, Massachusetts<br />
Dr. Malcolm Mellor<br />
USA CRREL, Hanover, New Hampshire<br />
Dr. Thomas Osterkamp<br />
University of Alaska Fairbanks, Fairbanks, Alaska<br />
Mr. Dennis Padron<br />
Han-Padron Associates, New York. New York<br />
Dr. Robert S. Pritchard<br />
Ice Casting, Inc., Seattle, Washington<br />
Prof. Louis Rey<br />
Le Comite Arctique International, Monte Carlo, Monaco<br />
Ms. Patricia Sackinger<br />
Fairbanks, Alaska<br />
Mr. Terry Setchfield<br />
Exxon Production Research Company, Houston, Texas<br />
Prof. Lewis Shapiro<br />
University of Alaska Fairbanks, Fairbanks, Alaska<br />
Dr. Harold Shoemaker<br />
US Department of Energy, Morgantown, West Virginia<br />
Dr. Charles E. Smith<br />
Minerals Management Service, Reston, Virginia<br />
Mr. Rodney Smith<br />
Minerals Management Service, Anchorage, Alaska<br />
Dr. Walter Spring<br />
Mobil Research <strong>and</strong> Development Corporation, Dallas, Texas
Prof. William Stringer<br />
University of Alaska Fairbanks, Fairbanks, Alaska<br />
Mr. Larry Sweet<br />
University of Alaska Fairbanks, Fairbanks, Alaska<br />
Prof. Shyam S<strong>under</strong><br />
Massachusetts Institute of Technology, Cambridge,<br />
Massachusetts<br />
Mr. Stephen D. Treacy<br />
Minerals Management Service, Anchorage, Alaska<br />
Mr. Michael Utt<br />
Unocal Corporation, Brea, California<br />
Dr. Ken Vaudrey<br />
Vaudrey & Associates, San Luis Obispo, California<br />
Mr. Robert Visser<br />
Belrnar Engineering <strong>and</strong> Management Service Co., Redondo Beach, California<br />
Dr. Vitoon Vivatrat<br />
Engineering Science Inc., Houston, Texas<br />
Dr. W.F. Weeks<br />
University of Alaska Fairbanks, Fairbanks, Alaska<br />
Prof. Gunter Weller<br />
University of Alaska Fairbanks, Fairbanks, Alaska<br />
Dr. J. Patrick Welsh<br />
Naval Ocean Research <strong>and</strong> Development Activity, Hanover, New Hampshire<br />
Mr. Jonathan Widdis<br />
State of Alaska Department of Trans<strong>port</strong>ation, Fairbanks, Alaska<br />
Dr. Jay Wiedler<br />
Brown <strong>and</strong> Root USA, Houston, Texas<br />
An im<strong>port</strong>ant <strong>and</strong> vital task in the organization of POAC-87 <strong>and</strong> preparation of<br />
papers for publication was the review <strong>and</strong> evaluation of abstracts <strong>and</strong> papers. In<br />
addition to all members of the International Committee <strong>and</strong> the U.S. National Organiz-<br />
ing Committee, the reviewers included:<br />
Dr. H. Burcharth, University of Aalborg, Denmark<br />
Dr. A. Chen, Exxon Production Research Company, Houston, Texas
Mr. Li Fu-cheng , University of Alaska Fairbanks, Fairbanks, Alaska<br />
Dr. James U. Kordenbrock. David Taylor Research Center, U.S. Navy<br />
Mr. Donald Kover, David Taylor Research Center, U.S. Navy<br />
Dr. C.-H. Luk, Exxon Production Research Company, Houston, Texas<br />
Dr. Lasse Makkonen, Technical Research Centre of Finl<strong>and</strong><br />
Dr. A. L. Mindich, Mirza Engineering Inc., Chicago, Illinois<br />
Mr. J. Poplin, Exxon Production Research Company, Houston, Texas<br />
Dr. T. D. Ralston, Exxon Production Research Company, Houston, Texas<br />
Dr. Philip A. Sackinger, Massachusetts Institute of Technology, Cambridge,<br />
Massachusetts<br />
Dr. A. Wang. Exxon Production Research Comp,any, Houston, Texas<br />
Also helping with conference organization <strong>and</strong> the preparation of this book were<br />
Kathryn Coffer, Nancy Smoyer, Jan Dalrymple <strong>and</strong> Kim Morris. Day-to-day conference<br />
administration <strong>and</strong> co-ordination was by the Conferences <strong>and</strong> Institutes Office,<br />
University of Alaska-Fairbanks (Nancy Bachner <strong>and</strong> staff). Special thanks are due<br />
to Dr. S.-I. Akasofu, Director, Geophysical Institute, <strong>and</strong> to Dr. P.J. O'Rourke,<br />
Chancellor, University of Alaska-Fairbanks, for their encouragement <strong>and</strong> financial<br />
sup<strong>port</strong>; the encouragement of Dr. Harold D. Shoemaker of the U.S. Department of<br />
Energy was also appreciated.<br />
To our sponsors <strong>and</strong> co-sponsors, the International <strong>and</strong> National Organizing<br />
Committees, <strong>and</strong> all those individuals who helped make POAC-87 <strong>and</strong> the<br />
publication of this book possible, our grateful thanks.<br />
William M. Sackinger<br />
Martin 0. Jeffries<br />
Fairbanks<br />
January 1988
FOREWORD<br />
Many marine mammal species found in <strong>arctic</strong> waters have im<strong>port</strong>ant<br />
relationships with ice. Many are pagophilic, using ice as a platform to<br />
haul out (ringed, spotted, bearded, ribbon, <strong>and</strong> harp seals; <strong>and</strong> walrus)<br />
or to hunt <strong>and</strong> scavenge (polar bear <strong>and</strong> <strong>arctic</strong> fox). Some marine<br />
mammals relate to ice as a floating barrier around, through, <strong>and</strong> <strong>under</strong><br />
which their seasonal migrations proceed (bowhead whales, beluga, <strong>and</strong><br />
narwhal) or as an encroaching northern border that may ultimately prompt<br />
an annual migration to warmer waters (gray whale).<br />
Marine mammals in ice-covered waters are subject to continual<br />
auditory input from a highly active acoustic environment. Some input<br />
is airborne, such as that which occurs at or above the water's surface (e.g.,<br />
on l<strong>and</strong> or ice as experienced by pinnipeds <strong>and</strong> polar bears). However,<br />
marine mammals mostly hear sounds that are generated, transmitted,<br />
<strong>and</strong>/or received <strong>under</strong>water. Acoustic input may derive from natural<br />
sources including wave active, seismic activity, ice movement <strong>and</strong><br />
breakage, as well as sounds produced by the above species <strong>and</strong> other<br />
biota. In addition, noise produced by various human activities<br />
contYibutes to overall loading of the acoustic environment. These<br />
anthropogenic noises are essentially a by-product of shipping, oil <strong>and</strong> gas<br />
exploration <strong>and</strong> development, fishing vessels, various activities of coastal<br />
<strong>com</strong>munities, <strong>and</strong> activities of other marine industries.<br />
Ice movement <strong>and</strong> breakage produce pervasive,<strong>and</strong> at times<br />
explosive,noise in <strong>arctic</strong> waters. The presence of sea ice also partially<br />
controls the <strong>under</strong>water acoustic environment by providing a rough<br />
reverberative ceiling for local sound waves. Even when ice recedes, it<br />
continues to affect the <strong>under</strong>water acoustic environment as surface layers<br />
warm up differentially in the water column, causing sound waves to refract<br />
downward. This refraction results in higher propagation loss in shallow<br />
water through increased contact of sound waves with bottom topography.<br />
Depending on the pattern, sound frequency, <strong>and</strong> intensity of the sound<br />
source in <strong>com</strong>bination with ambient <strong>ocean</strong>ographic features (e.g., water<br />
depth, salinity, presence of ice, <strong>under</strong>water substrate), various sounds may<br />
be discernible to these species above ambient-noise <strong>conditions</strong>, thereby<br />
potentially influencing individual animals to some degree. Such
influences on marine mammals may include changes in behavior such<br />
as curious attraction or avoidance reactions, changes in physiological rates,<br />
<strong>and</strong> interference with <strong>com</strong>municative or echolocative efforts.<br />
These topics were the focus of the "Symposium on Noise <strong>and</strong> Marine<br />
Mammals in Ice-Covered Waters." The symposium, held August 18,<br />
1987 at the University of Alaska Fairbanks, was coordinated by the<br />
Minerals Management Service <strong>and</strong> was part of the 9th International<br />
Conference on Port <strong>and</strong> Ocean Engineering Under Arctic Conditions. The<br />
concept of this Symposium was originally suggested by Dr. Louis Rey,<br />
<strong>and</strong> the Symposium was co-sponsored by Le Comite Arctique International.<br />
The titles <strong>and</strong> authors of scientific papers presented at the symposium<br />
are as listed in the Table of Contents which follows, with the exception<br />
of the paper "Possible effects of ambient noise on the ability of the Bowhead<br />
Whale, Balaena mysticetus, to discern <strong>under</strong>-ice reverberations from their<br />
calls" (William T. Ellison <strong>and</strong> Christopher Clark). This paper was<br />
presented by Mr. Charles I. Malme at the request of the authors, but is not<br />
included in this volume.<br />
A panel discussion on the subject of potential directions for research<br />
was held immediately following presentation of the submitted papers. Two addi-<br />
tional papers, entitled "Evidence of Glacial Seismic<br />
Events in the Acoustic Environment of Humpback Whales" (Paul R. Miles <strong>and</strong> Charles<br />
I. Malme) <strong>and</strong> "Review of Studies on the Effects of<br />
Man-Induced Noise on Marine Mammals of the Bering, Chukchi, <strong>and</strong><br />
Beaufort Seas <strong>and</strong> How the Results Have Been Applied to Federal Oil <strong>and</strong><br />
Gas Management Decisions" (Clevel<strong>and</strong> J. Cowles <strong>and</strong> Jerry L. Imm),<br />
although not presented at the symposium, are included in this volume<br />
as useful background information.<br />
The authors of these papers are to be <strong>com</strong>mended for their contributions to the<br />
Symposium <strong>and</strong> to this volume.<br />
Jerry Imm<br />
Stephen D. Treacy<br />
Minerals <strong>and</strong> Management Service<br />
Anchorage<br />
March 1988<br />
xu
TABLE OF CONTENTS<br />
VOLUME I1<br />
..............................................................<br />
Preface iii<br />
Acknowledgements ........................................ .............. v<br />
..............................................................<br />
Foreword xi<br />
REVIEW OF STUDIES ON THE EFFECTS OF MAN-INDUCED NOISE ON MARINE MAMMALS OF<br />
THE BERING, CHUKCHI, AND BEAUFORT SEAS AND HOW THE RESULTS HAVE BEEN APPLIED<br />
TO FEDERAL OFFSHORE OIL AND GAS MANAGEMENT DECISIONS<br />
Clevel<strong>and</strong> J. Cowles <strong>and</strong> Jerry L. Imm. ........................................ 1<br />
UNRESOLVED ASPECTS CONCERNING THE INFLUENCE OF NOISE ON MARINE MAMMALS<br />
J.M.Terhune ............................................................ 9<br />
EFFECTS OF INDUSTRIAL ACTIVITIES ON RINGED SEALS IN ALASKA. AS INDICATED BY<br />
AERIAL SURVEYS<br />
Kathryn J. Frost <strong>and</strong> Lloyd E. Lowry. ..................................... 15<br />
RESPONSES OF RINGED SEALS (Phoca hispida) TO NOISE DISTURBANCE<br />
Brendan P. Kelley, John J. Burns <strong>and</strong> Lori T. Quakenbush ................ . . 27<br />
RESPONSES OF MIGRATING NARWHAL AND BELUGA TO ICEBREAKER TRAFFIC AT THE<br />
ADMIRALTY INLET ICE-EDGE, N.W.T. IN 1986<br />
Susan E. Cosens <strong>and</strong> Larry P. Dueck ........................................ 39<br />
OBSERVATIONS OF FEEDING GRAY WHALE RESPONSES TO CONTROLLED INDUSTRIAL<br />
NOISE EXPOSURE<br />
Charles I. Malme, Bernd Wursig, James E. Bird <strong>and</strong> Peter Tyack ........................ 55<br />
INDUSTRY OBSERVATIONS OF BOWHEAD WHALES IN THE CANADIAN BEAUFORT SEA,<br />
1976-1985<br />
JohnG.Ward<strong>and</strong>E.Pessah ........................................... . 75<br />
MASKEDDETECTIONTHRESHOLDSFORTHEBELUGAANDBOTTLENOSEDOLPHIN<br />
Charles W. Turl, Ralph H. Penner <strong>and</strong> W.W.L. Au ............ . . . . . . . . 89<br />
EVIDENCE OF GLACIAL SEISMIC EVENTS IN THE ACOUSTIC ENVIRONMENT OF HUMPBACK<br />
WHALES<br />
Paul R. Miles <strong>and</strong> Charles I. Malme .......................................... 95<br />
PANEL DISCUSSION<br />
Stephen D. Treacy .<br />
Author List ..................................... . . . . . . . . . . . . . . . Ill
REVIEW OF STUDIES ON THE EFFECTS OF MAN-INDUCED NOISE ON MARINE<br />
MAMMALS OF THE BERING, CHUKCHI, AND BEAUFORT SEAS AND HOW THE<br />
RESULTS HAVE BEEN APPLIED TO FEDERAL OFFSHORE OIL AND GAS<br />
MANAGEMENT DECISIONS<br />
Abstract<br />
Since 1980, the U. S. Minerals<br />
Management Service has managed <strong>and</strong><br />
funded a variety of studies of the<br />
potential effects of man-induced noise<br />
on marine mammals of the Bering,<br />
Chukchi, <strong>and</strong> Beaufort Seas. The<br />
purpose of such studies is to provide<br />
information needed for informed<br />
decisionmaking pertaining to environ-<br />
mentally sound leasing <strong>and</strong> management<br />
of offshore oil <strong>and</strong> gas development on<br />
the Alaska Outer Continental Shelf<br />
(OCS). Many of the noise/ marine<br />
mammal-interaction studies have been<br />
used in establishing lease specifica-<br />
tions or regulations for offshore<br />
operations in Federal lease areas.<br />
Results also have been im<strong>port</strong>ant in the<br />
resolution of litigation pertaining to<br />
OCS oil <strong>and</strong> gas leasing <strong>and</strong> explora-<br />
tion. Specific examples of how results<br />
have been applied are presented <strong>and</strong><br />
future Alaska information needs in this<br />
discipline are discussed.<br />
Introduction<br />
Since 1980 the Minerals Management<br />
This is a reviewed <strong>and</strong> edited version of apaper submit-<br />
ted to the Ninth International Conference on Port <strong>and</strong><br />
Ocean Engineering Under Arctic Conditions, Fairbanks,<br />
Alaska, USA. August 17-22, 1987.<br />
Clevel<strong>and</strong> J. Cowles<br />
Jerry L. Imm<br />
Minerals Management Service, Anchorage, Alaska, USA<br />
Service (MMS) has funded a variety of<br />
studies of man-induced noise effects on<br />
marine mammals of the Alaska Outer<br />
Continental Shelf (OCS). Within the<br />
context of pertinent legislation, MMS<br />
identified the various sources of noise<br />
associated with offshore oil <strong>and</strong> gas<br />
activities <strong>and</strong> designed studies to<br />
examine potential effects. One <strong>under</strong>-<br />
lying basis for selection of research<br />
topics to date has been application of<br />
a key- species approach (described in<br />
Cowles <strong>and</strong> Im, 1980). In many cases,<br />
the results of these studies have been<br />
used in management decisions such as<br />
formation of regulations or mitigating<br />
measures. This has affected the way<br />
industry has been permitted to operate<br />
in the Bering, Chukchi, <strong>and</strong> Beaufort<br />
Seas. We briefly review study efforts<br />
<strong>and</strong> link significant findings with<br />
management decisions.<br />
General Review of Past MMS Noise-<br />
Effects Studies<br />
Of the several noise sources from<br />
offshore oil <strong>and</strong> gas activities, some<br />
of the most <strong>com</strong>mon ones are ships<br />
(icebreakers, drillships, geophysical<br />
ships, conventional <strong>and</strong> icebreaking<br />
ships), work boats, aircraft (fixed<br />
wing <strong>and</strong> rotary wing), dredges, drill-<br />
ing rigs, production rigs, <strong>and</strong><br />
pipelines--used either directly in<br />
drilling <strong>and</strong> production activities or
indirectly in sup<strong>port</strong> of such opera-<br />
tions. For clarity of discussion, the<br />
studies <strong>and</strong> respective marine mammal<br />
species are discussed below by noise-<br />
source categories.<br />
Aircraft: Starting in 1980, bowhead<br />
whales (Balaena mysticetus) were<br />
studied in the presence <strong>and</strong> absence of<br />
industrial stimuli; as a part of this<br />
research, bowhead whale behavior in<br />
response to fixed-wing <strong>and</strong> helicopter<br />
noise was studied <strong>under</strong> different<br />
operating <strong>conditions</strong>. Overt reactions<br />
to the fixed- wing observation aircraft<br />
were sometimes conspicuous when the<br />
aircraft was below 457 m a.s.1..<br />
un<strong>com</strong>mon at 457 m, <strong>and</strong> generally<br />
undetectable at 610 m (Richardson,<br />
1983, 1985).<br />
With helicopters, no overt<br />
responses at approximately 153 m a.s.1.<br />
were noted during two field experiments<br />
<strong>and</strong> three op<strong>port</strong>unistic observations<br />
from 1981 through 1984. No significant<br />
changes in blow intervals were found;<br />
thus, there is no conclusive evidence<br />
that single helicopter passes (at<br />
greater than 153 m a.s.1.) disturb<br />
bowhead whales that are below the<br />
surf ace.<br />
Malme et al. (1983, 1984) per-<br />
formed systematic studies of whale<br />
responses to aircraft <strong>and</strong> re<strong>port</strong>ed that<br />
gray whales (Eschrichtius robustus)<br />
tended to avoid a location where<br />
recorded helicopter noise was played<br />
back into the water. However, the<br />
playback rate of one simulated pass<br />
every 10 s to 2 min greatly exceeded<br />
typical helicopter-traffic rates along<br />
routes to offshore industrial sites<br />
(Richardson, 1985).<br />
Boats: Vessel traffic is a major<br />
source of potential disturbance to<br />
bowhead whales near areas being<br />
explored or developed by the petroleum<br />
industry. In general, of all the<br />
stimuli presented to bowheads in our<br />
studies, "small"-boat traffic elicited<br />
the greatest variety of responses<br />
(Richardson, 1985). The studies showed<br />
that bowheads demonstrated a strong or<br />
frequent reaction to boats at a dis-<br />
tance of 1 to 2 km. Other baleen<br />
whales have shown considerable toler-<br />
ance of boats but often have avoided<br />
rapidly or erratically moving vessels.<br />
Baker et al. (1982) found changes in<br />
the respiration rates <strong>and</strong> diving<br />
behavior of humpback whales (Megaptera<br />
novaeangliae) when boats were within<br />
about 900 m; vessels that approached<br />
closely <strong>and</strong> moved erratically had the<br />
greatest effects. Sorenson et al.<br />
(1984) found evidence that "squid-<br />
eating" toothed <strong>and</strong> beaked whales were<br />
less <strong>com</strong>mon near boats than elsewhere;<br />
no such effect was found for "fish-<br />
eating" cetaceans, including some<br />
baleen whales (Richardson, 1985).<br />
The long-term effects of boat<br />
disturbance on whales are especially<br />
difficult to assess. The MMS hopes to<br />
develop some behavioral information<br />
regarding bowhead whalelicebreaker<br />
interaction as part of future<br />
research that is mentioned below.<br />
Dredging: Pertinent research has<br />
included both actual noise from dredge<br />
operations <strong>and</strong> playback of dredging<br />
noise. For actual dredging, the noise<br />
was detectable for at least several<br />
kilometers; <strong>and</strong> bowheads seemed to<br />
behave normally within the ensonified<br />
zone. For playbacks, bowheads<br />
responded to strong dredge noise even<br />
when the noise level was increased<br />
gradually over time.<br />
Drilling: Bowheads have been studied<br />
near operating drillships, well within<br />
the zone where drillship noise is<br />
clearly detectable. General activities<br />
of these animals seemed normal; <strong>and</strong><br />
there was no conclusive evidence that<br />
the noise affected surfacing, respira-<br />
tion, or dive cycles.<br />
The sightings near drillships<br />
showed tolerance of drilling but did<br />
not prove that bowheads are unaffected<br />
by drillships. Playback experiments<br />
showed that some bowheads reacted,<br />
although not strongly, to drillship<br />
noise at intensities equivalent to<br />
several kilometers from a real<br />
drillship (Richardson, 1985). The<br />
results for summering bowheads were<br />
generally consistent with reactions of<br />
migrating gray whales to the same<br />
drillship noise (Malme et al., 1983,<br />
1984). Migratory gray whales<br />
approaching the sound source tended to<br />
change speed <strong>and</strong> course only slightly.
Migratory gray whales were exposed to<br />
drillship-noise levels in the 50- to<br />
315-Hz b<strong>and</strong> at levels of 110, 117 <strong>and</strong><br />
122 dB re 1 uPa, respectively. Play-<br />
back exposure of feeding gray whales<br />
did not produce clear evidence of<br />
disturbance or avoidance behavior at<br />
received levels below 110 dB. Thus, at<br />
a conservative 120-dB threshold, a<br />
typical drillship would affect feeding<br />
gray whales at a range of about 300 m.<br />
Other observations indicate that<br />
reaction thresholds of bowhead <strong>and</strong> gray<br />
whales to playbacks of drilling noise<br />
are similar (Richardson, 1985).<br />
Observations of beluga whale<br />
(Delphinapterus leucas) responses to<br />
playbacks of oil-drilling sounds<br />
indicate that the direction of whale<br />
movement <strong>and</strong> general activity (feeding,<br />
traveling) are not greatly affected by<br />
these sounds, especially if the sound<br />
source is constant. Whales continued<br />
to move in the direction they were<br />
travelling before playbacks began. On<br />
several occasions, beluga whales within<br />
2 km of the sound source appeared to<br />
feed during playback experiments.<br />
Whales also approached <strong>and</strong> quickly<br />
passed closely by the <strong>under</strong>water<br />
speaker while sounds were being pro-<br />
jected (Stewart, Aubrey, <strong>and</strong> Evans,<br />
1983).<br />
Now that data are available, the<br />
MMS' approach has evolved from the<br />
field-experiment phase to the site-<br />
specific, predictive modeling of whale<br />
response to drilling operations. These<br />
studies (discussed later) for post-sale<br />
analyses have addressed a diversity of<br />
technology actually used in drilling<br />
operations in <strong>arctic</strong> waters.<br />
Production <strong>and</strong> Pipelines: The MMS has<br />
not directly studied these two noise<br />
producers but hopes to in the near<br />
future by using controlled-playback<br />
experiments in the spring lead system<br />
near Point Barrow. Research work would<br />
be conducted "downstream" of the whale<br />
hunting <strong>and</strong> censusing locations to<br />
avoid any disturbance to the whales <strong>and</strong><br />
subsistence whaling activities. The<br />
MMS anticipates that coordination with<br />
local organizations will be as impor-<br />
tant a <strong>com</strong>ponent of this study as is<br />
the technical work.<br />
Seismic Boats: Studies of endangered<br />
whale <strong>and</strong> seismic boat interactions<br />
have been a particularly crucial aspect<br />
of the MMS studies program. Actual <strong>and</strong><br />
potential litigation, seismic-<br />
exploration prohibition (e.g., eastern<br />
Alaskan Beaufort Sea in 1981), <strong>and</strong><br />
indirect human effects (e.g., conflicts<br />
with aboriginal whaling) have led to<br />
<strong>com</strong>plex studies spanning three species<br />
(bowhead, gray, <strong>and</strong> humpback whales)<br />
<strong>and</strong> as many <strong>ocean</strong>ic provinces (Pacific,<br />
Bering, <strong>and</strong> Arctic).<br />
In general, considering the<br />
source-level intensity (245-250 dB re 1<br />
uPa) of most airgun impulses, the<br />
avoidance responses of the latter<br />
species are relatively near-field<br />
phenomena. As a result of cooperative<br />
studies by MMS-sponsored researchers<br />
<strong>and</strong> geophysical operators, we have<br />
found that bowheads in Alaskan waters<br />
will not avoid operating seismic boats<br />
at ranges farther than 3.5 to 5.0 tan<br />
<strong>and</strong> at received levels less than 160 to<br />
170 dB re 1 uPa (Ljungblad et al.,<br />
1985; Richardson, 1985). Migratory<br />
gray whale avoidance of operating<br />
seismic boats will occur at a received<br />
peak pressure level of 164 dB re 1 uPa<br />
<strong>and</strong> at a range of about 2.5 km (Malme<br />
et al., 1984). Because this latter<br />
gray whale study may have affected sea<br />
otters in the study area (USDOI, FWS,<br />
1982), sea otters also were studied.<br />
It was found that sea otters displayed<br />
little, if any, reaction to a wide<br />
array of sound sources, including<br />
seismic boats at ranges of 900 m to<br />
1.6 tan. Other studies with smaller<br />
airgun experiments showed no clear<br />
evidence of avoidance by feeding<br />
humpbacks exposed at effective pulse-<br />
pressure levels of 172 dB re 1 'uPa<br />
(Malme et al., 1985). Feeding gray<br />
whales near St. Lawrence Isl<strong>and</strong>,<br />
Alaska, avoided a single-airgun<br />
exposure when average pulse levels<br />
reached 173 dB re 1 uPa. In specific<br />
''typical" locations that were analyzed,<br />
gray whale avoidance would occur at a<br />
range of about 3 km (Malme et al.,<br />
1986).<br />
The work summarized above repre-<br />
sents the primary information base of<br />
past <strong>and</strong> future decision processes<br />
pertaining to offshore seismic
exploration/endangered whale issues.<br />
On-Ice Seismic Exploration: In the<br />
late 1970's <strong>and</strong> early 1980's. analyses<br />
of biological data suggested that<br />
spring distribution <strong>and</strong> reproduction of<br />
ringed seals may have been affected by<br />
on-ice seismic exploration that was<br />
conducted primarily by "Vibroseis"<br />
methodology. Beginning in 1981, MMS<br />
sponsored a series of field experiments<br />
<strong>and</strong> other studies that examined change<br />
in ringed seal behavior, ice-lair use,<br />
distribution, <strong>and</strong> the affected acoustic<br />
environment. The overall results of<br />
these efforts (see Burns <strong>and</strong> Kelly,<br />
1983; Frost, Burns, <strong>and</strong> Lowry, 1985)<br />
showed that ab<strong>and</strong>onment or altered use<br />
of seal lairs occurred mainly within<br />
150 m of seismic lines. Comparison of<br />
seal densities, based on aerial or<br />
ground surveys, in "seismic" <strong>and</strong><br />
"control" areas produced mixed results.<br />
Detailed radio-telemetry studies of<br />
seal behavior (Kelly, Quackenbush, <strong>and</strong><br />
Rose, 1986) in Kotzebue Sound, Alaska,<br />
<strong>and</strong> further acoustical analyses there<br />
(Cummings, Holiday, <strong>and</strong> Lee, 1984)<br />
enhanced our <strong>under</strong>st<strong>and</strong>ing of potential<br />
effects on ringed seals. Monitoring<br />
studies that addressed regional abun-<br />
dance <strong>and</strong> distribution offshore Alaska<br />
were ongoing through spring 1987.<br />
Pre-Lease Decisions Utilizing Noise-<br />
Effects Studies<br />
Endangered Species Act Section 7<br />
Consultation: One of the most impor-<br />
tant applications of the noise-ef f ects<br />
studies has been their relevance to<br />
Endangered Species Act (ESA) section 7<br />
<strong>com</strong>pliance, particularly to the evolu-<br />
tion of Biological Opinions on proposed<br />
lease sales provided to MMS by the<br />
National Marine Fisheries Service<br />
(NMFS). Early NMFS opinions on pro-<br />
posed lease sales in the Beaufort Sea<br />
concluded that, "There is too little<br />
information to determine whether the<br />
lease sale <strong>and</strong> all resulting activities<br />
are likely to jeopardize the continued<br />
existence of the bowhead" (USDOC, NOAA,<br />
NMFS, 1980). Thus, NMFS asserted that<br />
in the face of insufficient information<br />
on oil-spill <strong>and</strong> noise effects, MMS<br />
could not clearly avoid jeopardy of the<br />
bowhead population. Recently, however,<br />
a Biological Opinion on activities in<br />
the same region concluded, "The leasing<br />
<strong>and</strong> exploration phases of Lease Sale 97<br />
are not likely to jeopardize the<br />
continued existence of any endangered<br />
or threatened marine species" (USDOC,<br />
NOAA, NMFS, 1987). In sup<strong>port</strong>ing<br />
<strong>com</strong>ments pertaining to their assessment<br />
of noise effects in the Sale 97 area,<br />
NMFS stated, "This opinion is based on<br />
the best available information includ-<br />
ing noise effects studies on bowhead<br />
whales summering in the Canadian<br />
Beaufort Sea" (USDOC, NOAA, NMFS,<br />
1987).<br />
In addition to enhancing these<br />
generalized analyses, other ESA-related<br />
operational consultations have bene-<br />
fited. Study re<strong>com</strong>mendations, conser-<br />
vation measures, <strong>and</strong> reasonable <strong>and</strong><br />
prudent alternatives expressed in<br />
Biological Opinions also must take new<br />
information into account.<br />
Seismic-Vessel Exploration-Permit<br />
Requirements: As mentioned previously,<br />
after concern for seismic-vessel<br />
effects on the fall migration of<br />
bowhead whales reached unprecedented<br />
levels in the early 19801s, entire<br />
offshore areas of the Beaufort Sea were<br />
closed to seismic exploration if whales<br />
were known to be present. This<br />
approach to seismic-vessel management<br />
lowered profit expectations consider-<br />
ably, <strong>and</strong> vessel owners sought relief.<br />
Essentially they questioned closures on<br />
the basis of presence when<br />
effects on whales had not been demon-<br />
strated. Subsequently, <strong>and</strong> with<br />
improved information in h<strong>and</strong> on bowhead<br />
responses to seismic boats--especially<br />
data determined by acoustically<br />
oriented field experiments (Ljungblad<br />
et al., 1985; Richardson, 1985)~<br />
permits for Beaufort Sea seismic<br />
operations were revised <strong>under</strong> terms<br />
that allow exploration beyond known<br />
whale-response distances. For example,<br />
a seismic permit for Beaufort Sea<br />
exploration now typically requires<br />
special precautions of the vessel<br />
operator during bowhead migrations:<br />
"After the beginning of the whale<br />
migration, seismic vessels can operate<br />
their high energy sources only when<br />
visibility exceeds 3 miles. During<br />
periods of fog, darkness, or weather<br />
<strong>conditions</strong> which limit visibility to
less than 3 miles, the seismic sound<br />
sources must be shut down. Operations<br />
cannot be initiated or resumed until an<br />
area with a radius of 5 miles from the<br />
vessel is clear of whales. This may<br />
require the use of aircraft."<br />
The specific distances referred to<br />
are derived primarily from the result<br />
of MMS studies that established thres-<br />
hold distances related to bowhead whale<br />
disturbance.<br />
Probably one of the most publi-<br />
cized applications of noise-effects<br />
studies in resolving seismic vessel1<br />
endangered whale conflicts was their<br />
use in litigation decisions on proposed<br />
St. George Basin Lease Sale 70. This<br />
area, just north of Unimak Pass in the<br />
southern Bering Sea, is suspected<br />
habitat of right whales (Balaena<br />
glacialis) <strong>and</strong> is adjacent to the<br />
spring <strong>and</strong> fall primary migration route<br />
of gray whales. Following a suit filed<br />
to block the sale (Village of False<br />
Pass v. Watt, D. Alaska, Cir. No.<br />
A83-176) the U. S. District Court,<br />
Alaska, ruled (aspects of this ruling<br />
were later overturned) that the Secre-<br />
tary of the Interior could not execute<br />
leases until:<br />
(1) A "Worst-case" analysis of<br />
seismic effects on gray <strong>and</strong> right<br />
whales or a supplementary Environmental<br />
Impact Statement (EIS) evaluating<br />
effects of preliminary seismic<br />
exploration was prepared.<br />
(2) The Final Notice of Sale or<br />
other order must include restrictions<br />
implementing reasonable <strong>and</strong> prudent<br />
alternatives contained in the relevant<br />
Biological Opinion or justification<br />
that such restrictions are not<br />
necessary.<br />
Subsequently, MMS issued a supple-<br />
mental EIS that focused heavily on<br />
recent studies results <strong>and</strong> revised<br />
restrictions on seismic operations. In<br />
obtaining NOAA concurrence on the<br />
adequacy of a draft "Notice to Lessees"<br />
(NTL) for protecting whales from<br />
potential seismic effects, Good (1983)<br />
wrote :<br />
"The Minerals Management Service<br />
believes these restrictions are more<br />
than adequate to protect gray <strong>and</strong> right<br />
whales. Deep seismic surveys have been<br />
conducted in the Bering Sea since the<br />
early 1970's. The National Marine<br />
Fisheries Service routinely allows deep<br />
seismic surveys to <strong>com</strong>e within 20 miles<br />
of Unimak Pass during the gray whale<br />
-<br />
d a deep-seismic system, far more<br />
powerful than a high resolution system.<br />
The whales came as close as three miles<br />
to the airguns before 'some possible<br />
changes in the swimming patterns of<br />
cow-calf pairs were observed. . .<br />
' (Emphasis added .)<br />
As is evident above, im<strong>port</strong>ant<br />
information obtained from a noise-<br />
effects study was assimilated directly<br />
into the OCS management-decision<br />
process. The preliminary results<br />
referred to were later re<strong>port</strong>ed in<br />
Malme et al. (1984). Following the<br />
issuance of the NTL <strong>and</strong> the supple-<br />
mental EIS, the case was closed.<br />
On-Ice Seismic Exploration:<br />
Similarly, studies results have<br />
affected the decision process regarding<br />
permits <strong>and</strong> regulations of on-ice<br />
seismic explorations. At first, in the<br />
face of substantial uncertainty about<br />
the extent of potential effects on<br />
ringed seals, conservative management<br />
approaches (such as seasonal termina-<br />
tion of all seismic activities) were<br />
implemented by regulatory agencies.<br />
Industry groups were, of course,<br />
concerned <strong>and</strong> sought changes through<br />
legislative processes. In 1982,<br />
regulations governing the small take of<br />
marine mammals incidental to specified<br />
activities <strong>under</strong> section 101(a)(5) of<br />
the Marine Mammals Protection Act were<br />
proposed to deal specifically with the<br />
ringed seal issue. Among information<br />
considered (Federal Register, 1982a),<br />
NMFS cited the findings of "Burns et<br />
al., (1981)" <strong>and</strong> other results of<br />
MMS-sponsored, June 1981 studies.<br />
These studies were instrumental in<br />
showing that although on-ice seismic<br />
activities may affect a small number<br />
(less than 1,000) of seals in the area<br />
covered by seismic activities, the<br />
"taking" would have a negligible impact<br />
on the 2.5 million-animal population.
Subsequently, a final rule on the<br />
matter (Federal Register, 1982b) was<br />
issued to allow "small takes" of ringed<br />
seals. This action provided a new<br />
framework by which MMS could structure<br />
permits for on-ice seismic exploration,<br />
<strong>and</strong> which ultimately enhanced seismic-<br />
exploration op<strong>port</strong>unities while<br />
providing appropriate protection for<br />
this valued species. We believe that<br />
environmental-studies results pertain-<br />
ing to the acoustic environment <strong>and</strong><br />
this issue were particularly instru-<br />
mental in resolving this issue.<br />
Mitigating Measures: Much of the<br />
various types of information obtained<br />
from noise-effects studies has an<br />
im<strong>port</strong>ant but difficult-to-quantify<br />
influence on environmental assessment<br />
<strong>and</strong>, ultimately, the lease <strong>conditions</strong><br />
related to offshore oil <strong>and</strong> gas<br />
development. Many noise-effects issues<br />
are now better <strong>under</strong>stood; therefore,<br />
environmental analyses (in ESA section<br />
7 consultation, EIS's, <strong>and</strong> exploration<br />
plan reviews) are better sup<strong>port</strong>ed with<br />
scientific results. Almost all Alaska<br />
lease sales are now ac<strong>com</strong>panied by<br />
NTL's formulated on the basis of<br />
noise-effects-studies results.<br />
Post-Lease Decisions Utilizing<br />
Noise-Effects Studies<br />
ESA Section 7 Consultation:<br />
Biological Opinions on pre- <strong>and</strong> post-<br />
lease operations--issued by NMFS after<br />
consultation with MMS--are phased <strong>and</strong>,<br />
as such, have been recognized by the<br />
Federal courts. Prior to any approval<br />
of post-lease development plans,<br />
consultation between MMS <strong>and</strong> NMFS will<br />
have occurred <strong>and</strong> the resulting Biolog-<br />
ical Opinion, which takes into account<br />
noise studies available up to that<br />
time, will have been prepared.<br />
Monitoring: For several years<br />
industry has been required to have in<br />
place a whale-observation program while<br />
conducting exploration-drilling activi-<br />
ties during the bowhead migration.<br />
Seasonal drilling restrictions have<br />
been waived if appropriate studies are<br />
ongoing <strong>and</strong> if industry has met other<br />
requirements. The determination of<br />
Zones of Influence (21) around opera-<br />
tions within which bowhead whales are<br />
considered likely to react to acoustic<br />
stimuli has provided a frame of refer-<br />
ence for these observation programs.<br />
These are challenging studies to design<br />
<strong>and</strong> carry out, since there are many<br />
uncontrolled variables, i.e., the<br />
changing acoustic environment, the<br />
changing chemical <strong>and</strong> physical environ-<br />
ments, <strong>and</strong> the changes in whale<br />
behavior due to factors that cannot be<br />
differentiated from man-induced<br />
changes. McLaren et al. (1986) is an<br />
example of an industry-sponsored<br />
monitoring study; other studies are in<br />
progress. The MMS continues to provide<br />
regionwide aerial monitoring that<br />
shares data with site-specific studies.<br />
Mitigating Measures: There have<br />
been several mitigating measures<br />
utilized on the Alaska OCS that are<br />
directly related to the potential for<br />
acoustic disturbance of whales, other<br />
marine mammals, <strong>and</strong> birds. These<br />
studies usually involve reconmending<br />
horizontal <strong>and</strong> vertical separation of<br />
operations from individual animals or<br />
aggregations, as well as cessation of<br />
activities until the animals have<br />
departed a 21.<br />
Post-Sale Environmental Assess-<br />
- ment: One study designed for post-sale<br />
application is "Prediction of Drilling<br />
Site-Specific Interaction of ~ndustriai<br />
Acoustic Stimuli <strong>and</strong> Endangered Whales<br />
in the Alaskan Beaufort Sea." In order<br />
to enhance environmental assessment<br />
predictive techniques <strong>and</strong> accuracy,<br />
this study measured sound characteristics<br />
at drilling sites <strong>and</strong> used<br />
models derived from previous studies to<br />
predict response zones. Results will<br />
be useful in future exploration-plan<br />
reviews <strong>and</strong> other post-sale<br />
applications.<br />
The MMS recently contracted to<br />
study the Davis Strait bowhead stock,<br />
which is relatively pristine <strong>and</strong> free<br />
from man-induced noise disturbance,<br />
with the goal to <strong>com</strong>pare the "normal"<br />
behavior of those whales to the<br />
"normal" behavior of the Western Arctic<br />
stock. The latter stock has been<br />
exposed to human activities in both the<br />
Canadian <strong>and</strong> U.S. Beaufort Seas for<br />
over 10 years. We may be able to<br />
determine if cumulative human <strong>and</strong><br />
disturbance effects are evident in the
Western Arctic bowhead stock.<br />
Future Needs <strong>and</strong> Applications<br />
The MMS is presently preparing to<br />
perform a study on the "Effects of<br />
Production Activities on Bowhead<br />
Whales" in the Chukchi <strong>and</strong> Beaufort<br />
Seas to determine if bowhead whales<br />
will be affected by noise in their<br />
spring migration along the Chukchi<br />
coast (near Point Barrow) <strong>and</strong> into the<br />
Beaufort Sea. This study will help us<br />
to find another answer to the long list<br />
of acoustic-stimuli questions associ-<br />
ated with the spectrum of oil <strong>and</strong> gas<br />
operations. These studies usually<br />
require more than 1 year to arrive at<br />
satisfactory findings.<br />
Even with the <strong>com</strong>pletion of this<br />
study, there are other noise-effects<br />
studies that may be required in the<br />
future. One of the <strong>com</strong>pelling reasons<br />
for this lack of specificity is that<br />
many results are not derived from<br />
easily controlled experiments. The MMS<br />
generally is working on wild, protected<br />
species in a harsh environment--not<br />
capturing <strong>and</strong> lab testing large marine<br />
mammals or other protected species.<br />
Instead, reliance on field observations<br />
by trained experts who also can measure<br />
acoustic parameters is required. Team<br />
approaches will continue to be used to<br />
establish the degree of relationship<br />
between offshore operations <strong>and</strong><br />
wildlife .<br />
Conclusion<br />
Over the past several years, MMS<br />
has <strong>com</strong>missioned an array of stuuies<br />
dealing with noise disturbance.<br />
Results from many of these studies have<br />
influenced im<strong>port</strong>ant decision processes<br />
to protect marine mammal <strong>and</strong> bird<br />
populations while simultaneously<br />
fostering orderly oil <strong>and</strong> gas resource<br />
development.<br />
Literature Cited<br />
Baker, C.S., L.M. Herman, B.G. Bays,<br />
<strong>and</strong> W.F. Stifel. 1982. The Impact of<br />
Vessel Traffic on the Behavior of<br />
Humpback Whales in Southeast Alaska.<br />
Unpublished re<strong>port</strong> prepared by Kewalo<br />
Basin Marine Mammals Lab. , Honolulu,<br />
HI, for USDOC, NOAA, National Marine<br />
Mammals Laboratory, Seattle, WA. 39<br />
PP .<br />
Burns, J.J. <strong>and</strong> B.P. Kelly. 1983.<br />
Studies of Ringed Seals in the Alaskan<br />
Beaufort Sea During Winter: Impacts of<br />
Seismic Exploration. Annual Re<strong>port</strong>,<br />
Outer Contimental Shelf Environmental<br />
Assessment Region (OCSEAP) Research<br />
Unit (RU) 232.<br />
Cowles, C. J. <strong>and</strong> J.L. Imm. 1980.<br />
Endangered Species Research: A<br />
Rationale for the Selection of a<br />
Research Strategy. In: Proceedings of<br />
the Interagency ~eetin~ to Review,<br />
Coordinate, <strong>and</strong> Plan Bowhead Whale<br />
Research, other Cetacean Research, <strong>and</strong><br />
Related Research Bearing Upon the Conservation<br />
<strong>and</strong> Protection of Endangered<br />
Marine Species in Alaska <strong>and</strong> Elsewhere.<br />
USDOI, Bureau of L<strong>and</strong> Management. pp.<br />
69-79.<br />
Cummings, W.C., D.V. Holliday, <strong>and</strong> B.J.<br />
Lee. 1984. Potential Impacts of<br />
Man-Made Noise on Ringed Seals:<br />
Vocalizations <strong>and</strong> Reactions. Environ-<br />
mental Assessment of the Alaskan<br />
Continental Shelf. Final Re<strong>port</strong> of<br />
Principal Investigators, RU 636.<br />
Tracer Doc. No. T-84-06-008-U.<br />
124 pp.<br />
Federal Register. 1982a. Regulations<br />
Governing Small Takes of Marine<br />
Mammals Incidental to Specified Activi-<br />
ties, 47(42):9027-9030 (March 3, 1982).<br />
Federal Register. 1982b. Regulations<br />
Governing Small Takes of Marine<br />
Mammals Incidental to Specified Activi-<br />
ties, 47(96):21248-21259 (May 18,<br />
1982).<br />
Frost, K.J., J.J. Burns, <strong>and</strong> L.F.<br />
Lowry. 1985. Distribution, Relative<br />
Abundance, <strong>and</strong> Potential Displacement<br />
of Ringed Seals in Alaska. Abstract<br />
from the Proceedings of the Sixth<br />
Biennial Conference on the Biology of<br />
Marine Mammals.<br />
Good, A.H. 1983. Letter from A.H.<br />
Good, Associate Solicitor, Energy <strong>and</strong><br />
Resources, USDOI, to Dr. Anthony J.<br />
Calio, Deputy Administrator, USDOC,<br />
NOAA; dated May 13, 1983.
Kelly, B.P., L.T. Quakenbush, <strong>and</strong> J.R.<br />
Rose. 1986. Ringed Seal Winter<br />
Ecology <strong>and</strong> Effects of Noise Disturb-<br />
ance. Environmental Assessment of the<br />
Alaskan Continental Shelf. Final<br />
Re<strong>port</strong> of Principal Investigators, Part<br />
2, RU 232. 83 pp.<br />
Ljungblad, D.K., B. Wursig, S.L.<br />
Swartz, <strong>and</strong> J.M. Keene. 1985. Obser-<br />
vations of the Behavior of Bowhead<br />
Whales (Balaena mysticetus) in the<br />
Presence of Operating Seismic Explora-<br />
tion Vessels in the Alaskan Beaufort<br />
Sea. OCS Study MMS 85-0076. Re<strong>port</strong><br />
prepared by SEACO, Inc. Anchorage, AK:<br />
USDOI, MMS, Alaska OCS Region. 51 pp.<br />
Malrne, C.I., P.R. Miles, C.W. Clark, P.<br />
Tyack, <strong>and</strong> J.E. Bird. 1983. Investi-<br />
gations of the Potential Effects of<br />
Underwater Noise from Petroleum Indus-<br />
try Activities on Migrating Gray Whale<br />
Behavior. Re<strong>port</strong> No. 5366 prepared by<br />
Bolt, Beranek, <strong>and</strong> Newman, Inc.,<br />
Cambridge, MA, for USDOI, MMS, Alaska<br />
OCS Region, Anchorage, AK. 134 pp.<br />
Malme, C.I., P.R. Miles, C.W. Clark, P.<br />
Tyack, <strong>and</strong> J.E. Bird. 1984. Investi-<br />
gation of the Potential Effects of<br />
Underwater Noise from Petroleum Indus-<br />
try Activities on Migrating Gray Whale<br />
Behavior, Phase 11. January 1984<br />
Migration. Re<strong>port</strong> No. 5586 prepared by<br />
Bolt, Beranek, <strong>and</strong> Newman, Inc., for<br />
USDOI, MMS, Alaska OCS Region,<br />
Anchorage, AK. 185 pp.<br />
Malme, C.I., P.R. Miles, P. Tyack, C.W.<br />
Clark, <strong>and</strong> J.E. Bird. 1985. Investi-<br />
gation of the Potential Effects of<br />
Underwater Noise from Petroleum Indus-<br />
try Activities on Feeding Humpback<br />
Whale Behavior. Re<strong>port</strong> No. 5851<br />
prepared by Bolt, Beranek, <strong>and</strong> Newman,<br />
Inc., for USDOI, MMS, Alaska OCS<br />
Region, Anchorage, AK. 100 pp.<br />
Malme, C.I., B. Wursig, J.E. Bird, <strong>and</strong><br />
P. Tyack. 1986. Behavioral Responses<br />
of Gray Whales to Industrial Noise:<br />
Feeding Observations <strong>and</strong> Predictive<br />
Modeling. Environmental Assessment of<br />
the Alaskan Continental Shelf. Final<br />
Re<strong>port</strong> of Principal Investigators, RU<br />
675. BBN Re<strong>port</strong> No. 6265. 164 pp.<br />
McLaren, P.L., C.R. Greene, W.J.<br />
Richardson, <strong>and</strong> R.A. Davis. 1986.<br />
Bowhead Whales <strong>and</strong> Under-Water Noise<br />
Near a Drillship Operation in the<br />
Alaskan Beaufort Sea, 1985. Re<strong>port</strong><br />
prepared by LGL Limited <strong>and</strong> Greenridge<br />
Sciences for UNOCAL Corp. 137 pp.<br />
Richardson, W.J., ed. 1983. Behavior,<br />
Disturbance Responses, <strong>and</strong> Distribution<br />
of Bowhead Whales, Balaena mysticetus,<br />
in the Eastern Beaufort Sea. 1982.<br />
Unpublished re<strong>port</strong> prepared by LGL<br />
Ecological Research Associates, Inc.,<br />
Bryan, TX, for USDOI, MMS, Reston, VA.<br />
357 pp.<br />
Richardson, W.J., ed. 1985. Behavior,<br />
Disturbance Responses, <strong>and</strong> Distribution<br />
of Bowhead Whales, Balaena mysticetus,<br />
in the Eastern Beaufort Sea. 1980-84.<br />
OCS Study MMS 85-0034. Prepared by LGL<br />
Ecological Research Associates, Inc.,<br />
for USDOI, MMS. 306 pp.<br />
Sorensen, P.W., R.J. Medved, M.A.M.<br />
Hyman, <strong>and</strong> H.E. Winn. 1984. Distribu-<br />
tion <strong>and</strong> Abundance of Cetaceans in the<br />
Vicinity of Human Activities Along the<br />
Continental Shelf of the Northwestern<br />
Atlantic. Marine Environmental<br />
Research 12:69-81.<br />
Stewart, B.S., F.T. Awbrey, <strong>and</strong> W.E.<br />
Evans. 1983. Beluga Whale,<br />
Delphinapterus leucas, Responses to<br />
Industrial Noise in Nushagak<br />
Bay, Alaska: 1983. Environmental<br />
Assessment of the Alaskan Continental<br />
Shelf. Final Re<strong>port</strong> of Principal<br />
Investigators, RU 629. Hubbs-Sea World<br />
Research Institute, Technical Re<strong>port</strong><br />
No. 83-161. 9 pp.<br />
USDOI, FWS, 1982. Section 7 Consulta-<br />
tion (1-1-83-F-1). Studies on Southern<br />
Sea Otter Response to Acoustic Stimuli.<br />
December 14, 1982. 6 pp.<br />
USDOC , NOAA, NMFS. 1980. Endangered<br />
Species Act Section 7 Consultation -<br />
Biological Opinion for Proposed Outer<br />
Continental Shelf Oil <strong>and</strong> Gas Lease<br />
Sale in the Nearshore Beaufort Sea <strong>and</strong><br />
All Resulting Activities (Sale BF).<br />
June 24. 1980. 19 pp.<br />
USDOC, NOAA, NMFS. 1987. Endangered<br />
Species Act Section 7 Consultation <strong>and</strong><br />
Biological Opinion for Oil <strong>and</strong> Gas<br />
Leasing <strong>and</strong> Exploration - Beaufort Sea<br />
Sale 97. May 20, 1987. 22 pp.
Abstract<br />
UNRESOLVED ASPECTS CONCERNING THE INFLUENCE<br />
OF NOISE ON MARINE MAMMALS<br />
J. M. Terhune<br />
University of New Brunswick, Saint John, New Brunswick, CANADA<br />
The im<strong>port</strong>ance <strong>and</strong> utilization of<br />
<strong>under</strong>water sounds in the lives of marine<br />
manuals varies greatly. Some species<br />
are virtually silent <strong>and</strong> inhabit areas<br />
where sound transmission is possible<br />
over only short distances. Other<br />
species vocalize year round <strong>and</strong><br />
inhabit areas where sounds can be<br />
detected at great distances. The<br />
detection of purposefully produced<br />
vocalizations <strong>and</strong> natural "noises" can,<br />
in theory, be measured or predicted<br />
using current knowledge <strong>and</strong> technology.<br />
The influence of man-made sounds on the<br />
detection of "natural" sounds can be<br />
determined. While noise exposure models<br />
can be constructed, these models will be<br />
restricted to the detection of sounds.<br />
The myriad of possible consequences of<br />
industrial noises masking natural sounds<br />
anchor introducing frightening acoustic<br />
stimuli is largely unknown. Until the<br />
role of sound in a natural setting is<br />
known for a species, it will be<br />
difficult to predict (or measure) the<br />
in luence of a perturbed situation.<br />
Efforts must be made to link short <strong>and</strong><br />
This is a reviewed <strong>and</strong> edited version of apaperpresented<br />
at the Ninth International Conference on Port <strong>and</strong> Ocean<br />
Engineering Under Arctic Conditions, Fairbanks, Alaska,<br />
USA, August 17-22, 1987. Q The Geophysical Institute,<br />
University of Alaska, 1987.<br />
long- term life history factors with<br />
noise exposure models. This will<br />
require the development of new<br />
approaches <strong>and</strong> technologies as well as<br />
utilization of available techniques.<br />
Introduction<br />
There is great variability in the<br />
prevalence <strong>and</strong> nature of <strong>under</strong>water<br />
vocalizations of marine mammals. The<br />
very long range calls of some cetaceans<br />
(Payne <strong>and</strong> Webb, 1971) contrast markedly<br />
with the echo-location pulses of others.<br />
Presumed <strong>com</strong>municative vocalizations of<br />
seals exhibit much variability. Weddell<br />
seals (Leptonychotes weddelli) call<br />
throughout the year, over long distances<br />
<strong>and</strong> have a wide variety of call types<br />
(Thomas <strong>and</strong> Kuechle, 1982) . The harbor<br />
seal (Phoca vitulina), however, is<br />
almost silent. Fig. 1 illustrates the<br />
variable nature of the vocal behavior of<br />
a few phocids. Using the nature of the<br />
vocal activities as an index, it would<br />
follow that the im<strong>port</strong>ance of <strong>under</strong>water<br />
<strong>com</strong>nunication to the species also varies<br />
greatly. To seme extent, this diversity<br />
may reflect the acoustical properties of<br />
the areas which the various species<br />
inhabit. For example, harbor seals<br />
frequent coastal areas which are<br />
characterized by very shallow water,<br />
irregular bottom features, isl<strong>and</strong>s,<br />
turbidity, upright vegetation in the
water etc. These features will severely<br />
limit the transmission distance of<br />
<strong>under</strong>water sound. During <strong>under</strong>water<br />
recording sessions in an estuary, I<br />
often heard the airborne noises of small<br />
fishing boats well before I could detect<br />
them with a hydrophone. Polar seals in<br />
ice-covered waters are not so limited<br />
<strong>and</strong> long range inter-animal<br />
<strong>com</strong>munication is possible. Weddell<br />
seals have been heard (through<br />
hydrophones) at distances of almost 30<br />
km (Thomas <strong>and</strong> Kuechle, 1982). Ambient<br />
noises generated by ice, wind <strong>and</strong> rain<br />
will interfere with the cmunication<br />
channels. In addition, species with<br />
high population concentrations or very<br />
distant calling ranges, may well mask<br />
each other (Terhune <strong>and</strong> Ronald, 1986).<br />
The evolutionary pressures of these<br />
noises may well have shaped the vocal<br />
<strong>com</strong>munication channels utilized by the<br />
various marine mammals.<br />
Ñ<br />
Weddell<br />
Short bharbor w<br />
Seasonal<br />
CALL TYTnP "ria<br />
Few Many<br />
Fig. 1. Variability of seal vocalization<br />
patterns.<br />
Detection of Sounds<br />
Cmunication is limited by the<br />
sensitivity <strong>and</strong> decoding abilities of<br />
the receiver. To date, only a few<br />
aspects of marine mama1 hearing have<br />
been examined. These include the<br />
sensitivity to pure tones, critical<br />
ratios (e.g. Moore <strong>and</strong> Schusterman,<br />
1987), directional hearing (e.g.<br />
Terhune, 1974) <strong>and</strong> upper frequency<br />
limits (e-g. Terhune <strong>and</strong> Ronald, 1976).<br />
These, <strong>and</strong> other studies, have examined<br />
only a few individuals of a few species<br />
<strong>and</strong> the results must be interpreted in<br />
the "broad brush" sense only. A recent<br />
study (Terhune, unpublished results)<br />
suggests that seals <strong>and</strong> bottlenosed<br />
dolphins (Tursiops truncatus) process<br />
short duration sounds somewhat<br />
differently (porpoise data from Johnson,<br />
1968). A directional hearing study<br />
suggests that lew frequencies <strong>and</strong> pure<br />
tones cannot be located accurately<br />
(Terhune, 1974). This implies that many<br />
sounds could not be cross correlated<br />
(cocktail party effect). This will have<br />
direct bearing on the masking influence<br />
of noises. To date, masking studies<br />
have had the test signal <strong>and</strong> masking<br />
sound originate from the same sound<br />
source. This effectively reduces the<br />
possibility of separating the signal<br />
from the noise by cross-correlation<br />
techniques. Thus, the sets of values<br />
re<strong>port</strong>ed in Moore <strong>and</strong> Schustennan (1987)<br />
may be higher than would be the case if<br />
a high frequency <strong>and</strong> somewhat irregular<br />
signal (i.e. not a continuous pure tone)<br />
from one source were masked by a noise<br />
from another direction.<br />
Because some vocal marine mama1<br />
species have essentially evolved <strong>under</strong><br />
various types of noisy <strong>conditions</strong>, some<br />
vocalizations may be somewhat pre-<br />
disposed to over<strong>com</strong>ing noise. The very<br />
long (45-60 sec), frequency modulated<br />
call of the bearded seal (Ray et al.,<br />
1969) <strong>and</strong> the repetitive, harp seal<br />
calls which increase in loudness <strong>and</strong>(or)<br />
frequency toward their finish (Watkins<br />
<strong>and</strong> Schevill, 1979) will be more<br />
detectable <strong>under</strong> noisy <strong>conditions</strong> than<br />
short duration calls. The evolution of<br />
very different types of calls also<br />
suggests that acoustical <strong>com</strong>munication<br />
will be utilized for different purposes<br />
in various species. While harp seals<br />
may depend upon their myriad of calls<br />
for locating the reproductive herd<br />
<strong>and</strong>/or courtship (Terhune <strong>and</strong> Ronald,
1986), ringed seals may utilize sounds<br />
in association with territorial defense<br />
(Stirling, 1973).<br />
There are many unanswered questions<br />
concerning the capabilities of marine<br />
manmals to detect <strong>and</strong> recognize various<br />
sounds. Until further information can<br />
be obtained, we can only utilize<br />
extrapolations from other species or<br />
assume that the various systems are<br />
noise limited <strong>and</strong> thus may be inferred<br />
from an examination of ambient noises.<br />
Sound detection thresholds of baleen<br />
whales clearly must be dealt with in<br />
this latter manner. Many technically<br />
difficult problems could be investigated<br />
<strong>and</strong> reasonable approximations on the<br />
limits of detectability or recognition<br />
generated. For example, equal loudness<br />
curves would permit the establishment of<br />
"weighting curves" similar to the "A, B,<br />
<strong>and</strong> C" curves established for humans.<br />
This would be in<strong>port</strong>ant in assessing<br />
perceived levels of sounds. Because<br />
high frequencies are absorbed to a<br />
greater extent than low frequencies, the<br />
spectrum of vocalizations will change<br />
with distance. Thus, Weddell seal<br />
vocalizations of 30 km distance will<br />
sound appreciably different than the<br />
same calls at close range. This is<br />
analogous to the human situation of<br />
hearing someone speaking on the<br />
telephone. In the Weddell seal case,<br />
the researchers could identify the calls<br />
of seals 30 krn away. We do not know at<br />
what distance the sounds would be<br />
detectable, <strong>and</strong> still recognizable, to<br />
the seals however. The question of<br />
which statistical level to use when<br />
considering the influence of ambient<br />
noises must also be addressed. If the<br />
sound levels can be accurately<br />
described, it should be possible to<br />
consider the various pro<strong>port</strong>ions of<br />
noise <strong>and</strong> quiet periods. In some<br />
instances, the term "ambient signal" may<br />
better describe the ambient "noise" as<br />
the marine mammal may be obtaining some<br />
information relating to navigation,<br />
location of open water etc. by listening<br />
to specific sounds. Although many<br />
experiments examining these <strong>and</strong> similar<br />
questions would be costly <strong>and</strong> time<br />
consuming to perform, they are<br />
technically possible <strong>and</strong> will likely be<br />
<strong>com</strong>pleted in due time.<br />
Situation of the Listener<br />
The problem of assessing possible<br />
consequences of industrial noises is<br />
made particularly difficult because it<br />
not only requires information on the<br />
noise but also on the situation of the<br />
listener. In the human case, public<br />
protests concerning air<strong>port</strong> noises are<br />
ccinmon <strong>and</strong> have resulted in the<br />
initiation of a number of mitigative<br />
measures specifically aimed at reducing<br />
the absolute noise levels <strong>and</strong> timing of<br />
the noises. Many humans, however, are<br />
kncwn to actively seek out or<br />
voluntarily tolerate dangerously loud<br />
sounds. Persons attending "rock<br />
concerts" or patronizing a bar that has<br />
entertainment, tolerate noise levels<br />
that are known to cause permanent<br />
hearing loss. The disturbing noises<br />
generated by a late night party may<br />
depend upon whether or not you were<br />
invited!<br />
High frequency acoustic scaring<br />
devices have been employed to protect<br />
fish or crops from mammalian <strong>and</strong> avian<br />
pests. These devices have generally<br />
been found to be ineffectual against<br />
rodents <strong>and</strong> rabbits (Wilson <strong>and</strong><br />
McKillop, 1986) <strong>and</strong> harbor seals<br />
(Geiger, 1985) . Although these devices<br />
shew some initial success, the mammals<br />
in question may habituate to the sound,<br />
have different initial tolerance levels<br />
<strong>and</strong>/or the intensity involved does not<br />
cause unconditioned aural pain (Geiger ,<br />
1985). In the case of using a sound<br />
deterrent device to protect salmon<br />
caught in gill nets, the sound may<br />
frighten the seals <strong>and</strong> sea lions away<br />
initially but, without further negative<br />
reinforcement, may <strong>com</strong>e to serve as a<br />
dinner bell. Harbor seals that haul out<br />
onto offshore rocks in the Bay of Fundy,<br />
Canada, have habituated to traffic<br />
noises from a road a half kilometer<br />
away. The seals remained on the<br />
haul-out site when large trans<strong>port</strong><br />
trucks went by but raced to the water<br />
when a researcher inadvertently slmd<br />
a car door. These seals have a regular
haul-out cycle <strong>and</strong> will tend to return<br />
to the rocks if a disturbance occurs<br />
early in the cycle, but will remain in<br />
the water if they are disturbed late in<br />
the cycle. Thus sounds which will<br />
frighten marine mamnals in the short<br />
term are variable <strong>and</strong> the context in<br />
which the sound is detected is<br />
im<strong>port</strong>ant.<br />
Frightening Sounds<br />
Some sounds (<strong>and</strong><br />
can generate extreme<br />
Very loud noises may<br />
related activities)<br />
fear in a manmal.<br />
terrorize an animal<br />
<strong>and</strong> result in long-lasting behavioral<br />
changes. For example, many dogs <strong>and</strong><br />
other domestic animals are known to be<br />
frightened of th<strong>under</strong>storms or to be<strong>com</strong>e<br />
"gun-shy". I have observed instances in<br />
which harbor seals have been shot at <strong>and</strong><br />
subsequently vacated a haul-out ledge<br />
for a month or so. Overall, however,<br />
seals in the Bay of F'undy have cone to<br />
tolerate much human-related disturbance.<br />
During daylight, they are constantly<br />
vigilant when hauled-out , while<br />
(protected) harbor seals in California<br />
are thought to sleep (Terhune, 1985).<br />
Harbor seals return to the Bay of F'undy<br />
each spring following an annual<br />
migration to the United States (where<br />
they are legally protected). In spite<br />
of being purposefully harassed, these<br />
seals remain in the area <strong>and</strong> don't swim<br />
back to the U.S.A. (which they could do<br />
in a day or two). Over time, through<br />
genetic selection, a marine mammal<br />
population may be<strong>com</strong>e more tolerant of<br />
disturbance than their ancestors.<br />
Through more active selection, a similar<br />
situation has occurred with domestic<br />
animals.<br />
Life History Linkage with Noise Exposure<br />
The role of acoustical <strong>com</strong>munication<br />
(both active <strong>and</strong> passive) in the lives<br />
of marine manmals must be known to<br />
properly utilize a noise exposure model.<br />
The variability of marine mama1<br />
vocalizations suggest that it would be<br />
necessary to construct species specific<br />
noise exposure models. Once the normal<br />
situation is properly determined <strong>and</strong> the<br />
noise model constructed, the final step<br />
(<strong>and</strong> probably most difficult) will be to<br />
assess the situation with regard to<br />
various life history parameters. That<br />
is, the receiver end of the noise<br />
exposure model must be calibrated.<br />
Various studies have noted short-term<br />
behavioral responses. Will the noise<br />
exposure be reflected in long term<br />
recruitment, mortality, longevity <strong>and</strong>/or<br />
distribution of the species? Life<br />
history studies will, more likely,<br />
reflect the influence of a number of<br />
perturbatinq factors simultaneously. It<br />
may not be possible to detect an<br />
influence resulting frcm a single mode<br />
of disturbance. Another unknown is the<br />
cumulative effect of stresses (Geraci<br />
<strong>and</strong> St. Aubin, 1980 ) . A multi-faceted<br />
increase in human activity in an area<br />
could possibly result in a greater<br />
overall impact than would be predicted<br />
by the sum of all the impacts of<br />
individual factors. The myriad of<br />
caplex interactions may mask all but<br />
the most extreme problems.<br />
Life history studies of all marine<br />
manual species are far from <strong>com</strong>plete.<br />
There is still controversy over the<br />
population estimates of harp seals<br />
(Holt, 1987) even though this is<br />
probably one of the best known of all<br />
marine mama1 populations. Technical<br />
problems of locating the animals <strong>and</strong> the<br />
wide range of variation associated with<br />
food, ice <strong>conditions</strong>, weather, age<br />
structures, etc. result in population<br />
assessment with large st<strong>and</strong>ard errors.<br />
Marine manmal studies are occasionally<br />
confounded by the secrecy associated<br />
with naval operations <strong>and</strong> studies. The<br />
routes <strong>and</strong> noises produced by many<br />
vessels (e.g. nuclear submarines) are<br />
known but not available to the public.<br />
Assessment of a noise disturbance model<br />
would begin with an unknown amount of<br />
disturbance already occurring.<br />
In spite of all of the problems<br />
noted above, it should be possible to<br />
relate sane life history factors to a<br />
noise exposure model. This would<br />
require a long term set of species by<br />
species studies conducted by a stable,<br />
experienced workforce. Until such<br />
studies link biological consequences to
noise exposures, the value of noise<br />
exposure models will be marginal at<br />
best.<br />
References<br />
Geiger, A.C. 1985. Evaluation of seal<br />
harassment devices to protect<br />
salmon in gillnet fisheries.<br />
Abstract. - "Sixth Biennial<br />
Conference on the Biology of<br />
Marine ~ammals,"Vancouver, B.C.<br />
Geraci, J.R., <strong>and</strong> D.J. St. Aubin. 1980.<br />
Offshore petroleum resource<br />
development <strong>and</strong> marine mammals: a<br />
review <strong>and</strong> research re<strong>com</strong>mendations.<br />
Mar. Fish. Rev. 42: 1-12.<br />
Holt, S.J. 1987. Letter to the editor.<br />
Bulletin, Can. Soc. Zool. 18: 9.<br />
Johnson, C.S. 1968. Relation between<br />
absolute threshold <strong>and</strong> duration-of<br />
tone pulses in the bottlenosed<br />
porpoise. J. Acoust. Soc. Amer.<br />
43: 757-763.<br />
Sterlinq, I. 1973. Vocalization in the<br />
ringed seal (Phcca hispida). J.<br />
Fish. Res. Bd. Can. 30: 1592-1594.<br />
Ray, C., W.A. Watkins <strong>and</strong> J. J. Burns.<br />
1969. The <strong>under</strong>water sonq of<br />
Erignathus (bearded seal ).<br />
Zoologia 54: 79-83.<br />
Terhune, J.M. 1974. Directional hearinq<br />
of a harbor seal in air <strong>and</strong> water.<br />
J. Acoust. Scc. Amer. 56:<br />
1862-1865.<br />
Terhune, J.M. 1985. Scanning behavior<br />
of harbor seals on haul-out sites.<br />
J. Mammal. 66: 392-395.<br />
Terhune, J.M. <strong>and</strong> K. Ronald. 1976. The<br />
upper frequency limit of ringed<br />
seal hearing. can. J. Zool. 54:<br />
1226-1229.<br />
Terhune, J.M. <strong>and</strong> K. Ronald. 1976.<br />
Distant <strong>and</strong> near range functions<br />
of harp seal <strong>under</strong>water calls.<br />
Can. J. Zool. 64: 1065-1070.<br />
Thomas, J.A. <strong>and</strong> V.B. Kuechle. 1982.<br />
Guantitative analvsis of Weddell<br />
seal (Leptonych;tes weddelli)<br />
<strong>under</strong>water vocalizations at<br />
McMurdo Sound, Ant<strong>arctic</strong>a. J.<br />
Acoust. Soc. Amer. 72: 1730-1738.<br />
Watkins, W.A. <strong>and</strong> W.E. Schevill. 1979.<br />
Distinctive characteristics of<br />
<strong>under</strong>water calls of the harp seal,<br />
Phoca groenl<strong>and</strong>ica, during the<br />
breeding season. J. Acoust. Soc.<br />
Amer. 66: 983-988.<br />
Wilson, C.J. <strong>and</strong> I.G. McKillop. 1986.<br />
An acoustinq scaring device tested<br />
against European rabbits. Wildl.<br />
Soc. Bull. 14: 409-411.<br />
Discussion<br />
B. MORRIS: Would you speculate on the<br />
purpose of bearded seal vocalizations?<br />
You stated that bearded seals have only<br />
one type of call that they use year-<br />
round.<br />
J. TERHUNE: Watkins <strong>and</strong> Burns (Zoologica<br />
54:79-83, 1969) believe that the males<br />
call curing the breeding season to<br />
proclaim territory <strong>and</strong> (or) breeding<br />
condition. At other times of the year<br />
the seals are apparently solitary. Calls<br />
may then act as a means by which the<br />
seals can space themselves <strong>and</strong> not<br />
inadvertently cluster in an area. The<br />
calls might also permit the animals to<br />
stay in contact (an acoustic herd) even<br />
though dispersed.<br />
S. TREACY: Do harbor seals echo-locate?<br />
J. TERHUNE: I don't think so. The seals<br />
do not emit trains of clicks which would<br />
enhance the amount of information they<br />
could gather. I don't believe that<br />
emitting a single click would work,<br />
especially on a moving target.
Abstract<br />
EFFECTS OF INDUSTRIAL ACTIVITIES ON RINGED SEALS<br />
IN ALASKA, AS INDICATED BY AERIAL SURVEYS<br />
Kathryn J. Frost<br />
Lloyd F. Lowry<br />
Alaska Department of Fish <strong>and</strong> Game, Fairbanks, Alaska, USA<br />
The preferred pupping habitat of<br />
ringed seals (Phoca hispida) is the<br />
stable shorefast ice which also provides<br />
a convenient platform for some types of<br />
industrial activity. Concern for the<br />
possible effects of on-ice industrial<br />
activities on ringed seals has resulted<br />
in restrictions on industry <strong>and</strong> in<br />
research to evaluate the problem.<br />
Aerial surveys were conducted in 1970,<br />
1975-77, <strong>and</strong> 1981-82, <strong>and</strong> the data were<br />
used to <strong>com</strong>pare ringed seal abundance in<br />
"industrial" <strong>and</strong> "control" areas.<br />
Results were equivocal <strong>and</strong> sometimes<br />
contradictory.<br />
In 1985-87 a major program of<br />
aerial surveys was conducted to monitor<br />
the ringed seal population off Alaska<br />
<strong>and</strong> to continue investigating possible<br />
effects of industrial activities.<br />
Studies around artificial isl<strong>and</strong>s in the<br />
central Beaufort Sea suggest some<br />
displacement of seals within 2 nm<br />
(nautical miles) of the isl<strong>and</strong>s.<br />
Comparisons of industrial <strong>and</strong> control<br />
blocks indicated that seals were more<br />
This is a reviewed <strong>and</strong> edited version of apaper presen ted<br />
at the Ninth International Conference on Port <strong>and</strong> Ocean<br />
Engineering Under Arctic Conditions, Fairbanks, Alaska,<br />
USA, August 17-22, 1987.<br />
abundant in the industrial block whether<br />
or not industrial activity had occurred.<br />
Historical data indicate that seal<br />
density in the Beaufort Sea was high in<br />
1975, decreased greatly by 1977, <strong>and</strong> has<br />
subsequently increased. Although these<br />
trends correlate with levels of<br />
industrial activity (high in the late<br />
1970's <strong>and</strong> early 1980ts, then decreasing<br />
greatly in 1985-87), the changes<br />
occurred in areas both with <strong>and</strong> without<br />
activity <strong>and</strong> are, therefore, probably<br />
due to some other cause. Other studies<br />
in addition to aerial surveys are needed<br />
in order to <strong>under</strong>st<strong>and</strong> ringed seals <strong>and</strong><br />
how they may be affected by human<br />
activities.<br />
Introduction <strong>and</strong> Background<br />
Ringed seals (Phoca hispida) are<br />
the most abundant marine mammals found<br />
in seasonally ice-covered waters of<br />
northern Alaska. These seals are an<br />
im<strong>port</strong>ant subsistence species for<br />
coastal residents of northern Alaska <strong>and</strong><br />
are a major ecological <strong>com</strong>ponent of the<br />
<strong>arctic</strong> <strong>and</strong> sub<strong>arctic</strong> marine fauna. They<br />
prey on small fishes <strong>and</strong> crustaceans<br />
(Lowry et al. 1980) <strong>and</strong> are the major<br />
prey of polar bears (Ursus maritimus)<br />
(Smith 1980). Ringed seals <strong>com</strong>pete for<br />
food with other pinnipeds, as well as<br />
seabirds, <strong>arctic</strong> cod (Boreogadus saida),
<strong>and</strong> bowhead whales (Balaena mysticetus)<br />
(Lowry et al. 1978-t <strong>and</strong> Lowry<br />
1984).<br />
Ringed seals normally spend winter<br />
<strong>and</strong> spring on <strong>and</strong> <strong>under</strong> extensive<br />
unbroken shorefast ice. They maintain<br />
breathing holes through the shorefast<br />
ice, <strong>and</strong> in spring bear their young in<br />
subnivean lairs on top of the ice (Smith<br />
<strong>and</strong> Stirling 1975). The shorefast ice<br />
also provides a convenient platform on<br />
which various aspects of petroleum<br />
development can be conducted, including<br />
construction <strong>and</strong> maintenance of winter<br />
ice roads <strong>and</strong> airstrips, <strong>and</strong> seismic<br />
exploration. Areas most suitable for<br />
industrial activity may also sup<strong>port</strong><br />
relatively high densities of ringed<br />
seals.<br />
In June 1970, Burns <strong>and</strong> Harbo<br />
(1972) conducted the first extensive<br />
aerial surveys of ringed seals in<br />
shorefast ice areas of the Chukchi <strong>and</strong><br />
Beaufort seas. The principal objectives<br />
of the research were to develop survey<br />
techniques <strong>and</strong> to gather baseline<br />
information on ringed seal distribution<br />
<strong>and</strong> density. However, since seismic<br />
exploratory activities were ongoing in<br />
the study area, an attempt was made to<br />
determine whether the surveys could<br />
detect any effect of seismic activities<br />
on seal distribution. (Profiling was<br />
conducted using dynamite charges -<br />
maximum charge of 50 pounds - buried a<br />
minimum of 1 foot per pound, with a<br />
minimum burial of 20 feet to generate<br />
seismic waves which were used to<br />
determine subsurface geological<br />
profiles. In waters deeper than 3<br />
fathoms, activities were terminated on<br />
15 March.) Locations of seismic lines<br />
were plotted <strong>and</strong> "undisturbed" <strong>and</strong><br />
"disturbed" areas in the central<br />
Beaufort Sea were chosen for analysis.<br />
Comparisons based on surveys flown on<br />
9 June showed a slightly higher density<br />
in the disturbed area while the reverse<br />
was true on 13 June. Based on their<br />
data, the authors concluded that seismic<br />
operations such as were being conducted<br />
<strong>under</strong> state regulations had not<br />
appreciably displaced ringed seals.<br />
From 1971 to 1974, ringed seal<br />
surveys were not conducted. During that<br />
time development of alternative seismic<br />
energy sources other than explosives was<br />
encouraged. Surveys conducted using<br />
air-guns <strong>and</strong> vibroseis equipment were<br />
allowed to operate in water deeper than<br />
3 fathoms after the 15 March cutoff<br />
date.<br />
Extensive aerial surveys were again<br />
conducted in June of 1975, 1976, <strong>and</strong><br />
1977, principally to investigate the<br />
possible magnitude of annual<br />
fluctuations in ringed seal abundance<br />
along the Beaufort Sea coast (Burns <strong>and</strong><br />
Eley 1978). Specific tests of the<br />
effects of on-ice human activities were<br />
not included in the survey design since<br />
the objective was an extensive,<br />
broad-scale assessment of abundance.<br />
However, a substantial increase in<br />
on-ice seismic activity was evident both<br />
to permitting agencies <strong>and</strong> to ringed<br />
seal survey personnel, <strong>and</strong> a request was<br />
therefore made to use these data to<br />
<strong>com</strong>pare seal densities in areas with <strong>and</strong><br />
without extensive seismic survey<br />
activity. The <strong>com</strong>parisons consistently<br />
showed a lower density of seals in<br />
"seismic areas" than in adjacent<br />
"controls." The magnitude of this<br />
difference ranged from 227 to 88% with<br />
an average difference of 51% for the 3<br />
years (Burns <strong>and</strong> Kelly 1982).<br />
Therefore, the best available data<br />
indicated that displacement was<br />
occurring, <strong>and</strong> beginning in 1979 a<br />
cutoff date of 20 March was imposed on<br />
operations in water deeper than 3<br />
fathoms. The cutoff date was intended<br />
to avoid disturbance of ringed seals<br />
during the primary pupping period.<br />
However, it had a severe impact on<br />
industry by restricting the potential<br />
duration of their operations <strong>and</strong><br />
eliminating the optimum working period<br />
in terms of daylight, weather, <strong>and</strong> ice<br />
<strong>conditions</strong>. Therefore, in 1981 a<br />
program began as part of the Outer<br />
Continental Shelf Environmental<br />
Assessment Program to clarify <strong>and</strong><br />
quantify the possible impacts of on-ice<br />
seismic exploration on ringed seals.<br />
Intensive aerial surveys were one<br />
<strong>com</strong>ponent of that program.<br />
From 2 to 9 June 1981, 12 aerial<br />
survey flights were conducted in the<br />
Beaufort Sea with emphasis on areas of<br />
intense seismic activity (Burns et al.<br />
1981). On 3 days, surveys were flown
directly along seismic shot lines <strong>and</strong> on<br />
"control" lines which were parallel to<br />
<strong>and</strong> midway between the seismic lines.<br />
On 2 days, seal density was higher on<br />
the control lines, while on the third,<br />
density was higher on the seismic lines.<br />
Comparisons similar to those previously<br />
done for 1975-77 data were also made<br />
between 2 sets of seismic <strong>and</strong> adjacent<br />
control blocks. In both cases, seal<br />
densities were virtually identical in<br />
the seismic <strong>and</strong> control blocks.<br />
From 26 May to 4 June 1982, aerial<br />
surveys were again flown along seismic<br />
lines <strong>and</strong> on control lines midway<br />
between the seismic lines (Burns <strong>and</strong><br />
Kelly 1982). Statistical <strong>com</strong>parisons<br />
were made of the density of seals on<br />
seismic <strong>and</strong> control lines for 8 flights<br />
made on 7 days. A significant<br />
difference was found in only 1<br />
<strong>com</strong>parison, <strong>and</strong> in that case seal<br />
density was higher on the seismic<br />
transects than on the controls. There<br />
were no significant differences when<br />
data for all flights were <strong>com</strong>bined.<br />
While the results were sometimes<br />
equivocal or even contradictory, these<br />
studies, in aggregate, indicated that<br />
on-ice seismic activity of the type <strong>and</strong><br />
intensity conducted at that time did not<br />
result in large-scale displacement of<br />
ringed seals in the central Beaufort<br />
Sea. However, the fact remained that<br />
ringed seals are abundant <strong>and</strong><br />
ecologically im<strong>port</strong>ant along the Chukchi<br />
<strong>and</strong> Beaufort sea coasts, <strong>and</strong> that their<br />
preferred pupping habitat, the shorefast<br />
ice, also provides a convenient platform<br />
for industrial activities. There was a<br />
clear need to develop accurate <strong>and</strong><br />
repeatable techniques for assessing<br />
ringed seal abundance, as well as to<br />
determine what factors influence ringed<br />
seal distribution. Therefore, beginning<br />
in 1985, the Minerals Management Service<br />
through the National Oceanic <strong>and</strong><br />
Atmospheric Administration Outer<br />
Continental Shelf Environmental<br />
Assessment Program funded a 3-year study<br />
to monitor the ringed seal population<br />
off Alaska <strong>and</strong> to continue investigating<br />
the possible effects of industrial<br />
activities on ringed seals. The results<br />
of that study are presented in this<br />
paper.<br />
Methods<br />
Aerial survey design<br />
In order to gather the type of<br />
baseline data needed for a monitoring<br />
program, we chose to conduct an<br />
extensive survey covering all of the<br />
shorefast ice between Kotzebue Sound <strong>and</strong><br />
Barter Isl<strong>and</strong>. The study area was<br />
divided into 11 sample units that<br />
corresponded to sectors used in previous<br />
surveys (Burns <strong>and</strong> Harbo 1972; ADF&G<br />
unpubl.). Sector boundaries were marked<br />
by identifiable l<strong>and</strong>marks such as capes,<br />
points, villages, or radar installations<br />
(Figure 1). Surveys were conducted over<br />
the shorefast ice between 20 May <strong>and</strong><br />
16 June, beginning in Kotzebue Sound <strong>and</strong><br />
proceeding north <strong>and</strong> east to Barter<br />
Isl<strong>and</strong>. The Chukchi Sea was surveyed<br />
from 20 to 31 May, <strong>and</strong> the Beaufort Sea<br />
from 27 May to 16 June, to coincide with<br />
ice <strong>conditions</strong> which were optimal for<br />
sighting seals <strong>and</strong> with the peak period<br />
of seal haul-out.<br />
The surveys were flown between 1000<br />
<strong>and</strong> 1600 hours true local time, the time<br />
of day when maximum numbers of seals are<br />
known to haul out (Burns <strong>and</strong> Harbo 1972;<br />
Smith <strong>and</strong> Hammill 1981). The obser-<br />
vation platform was a Twin Otter<br />
aircraft equipped with oversize bubble<br />
windows, radar altimeter, <strong>and</strong> Omega-GNS<br />
500 Global Navigation System, flown at a<br />
true ground speed of 110-130 knots.<br />
Survey altitude was usually 500 ft in<br />
the Chukchi Sea <strong>and</strong> 300 ft in the<br />
Beaufort Sea.<br />
Strip width varied according to<br />
altitude <strong>and</strong> was determined by<br />
pre-calculated inclinometer angles which<br />
were marked on the windows. At 500 ft,<br />
the transects began 0.125 nm out from<br />
the centerline <strong>and</strong> extended out to<br />
0.5 nm for a net width of 0.375 nm<br />
(2,250 ft). At 300 ft, the inclinometer<br />
angles remained the same <strong>and</strong> the<br />
effective strip width was reduced to<br />
0.225 nm (1,350 ft). Two observers sat<br />
on either side of the aircraft just<br />
forward of the wings. A third person<br />
recorded beginning <strong>and</strong> ending points of<br />
transects, ice <strong>conditions</strong>, <strong>and</strong> weather.<br />
Each observer counted the seals in the<br />
strip on his or her side of the aircraft<br />
<strong>and</strong> also made note of industrial
CHUKCHI SEA<br />
ALASKA<br />
BEAUFORT SEA t<br />
Kolfbuf Sound FAST ICE / PACK ICE<br />
EDGE<br />
activity such as artificial isl<strong>and</strong>s, ice<br />
roads, seismic lines, <strong>and</strong> airstrips.<br />
All data were recorded by 1-minute<br />
intervals.<br />
The survey was flown according to a<br />
stratified r<strong>and</strong>om strip transact design,<br />
with transects spaced 2 nm between<br />
centerlines. Transects were flown along<br />
lines of latitude in the Chukchi Sea <strong>and</strong><br />
lines of longitude in the Beaufort Sea,<br />
from shore to the approximate seaward<br />
edge of the shorefast ice. Within each<br />
sector, 60% of the possible transects<br />
were r<strong>and</strong>omly selected <strong>and</strong> flown; in<br />
some sectors all or some of the selected<br />
lines were replicated for <strong>com</strong>parative<br />
purposes.<br />
Data analysis<br />
Counts of seals at cracks <strong>and</strong> at<br />
holes were added separately for each<br />
1-minute interval. The lengths of<br />
transects were calculated from beginning<br />
<strong>and</strong> ending GNS positions <strong>and</strong> divided by<br />
total elapsed time to obtain ground<br />
speed. The area surveyed per minute<br />
interval was calculated by multiplying<br />
speed by strip width. Each minute<br />
interval, therefore, was assigned data<br />
on latitude <strong>and</strong> longitude (of the<br />
beginning point), area (nm 2 ), local<br />
Figure 1. Map of northern<br />
Alaska showing sectors<br />
used for design <strong>and</strong><br />
analysis of ringed seal<br />
aerial surveys, <strong>and</strong> an<br />
example of lines flown<br />
during a survey.<br />
time, counts of seals at holes <strong>and</strong> at<br />
cracks, <strong>and</strong> ice <strong>and</strong> weather <strong>conditions</strong>.<br />
Densities were calculated by<br />
dividing the number of seals counted by<br />
the area surveyed (Cochran 1977).<br />
Variance of the density was calculated<br />
by using the model unbiased o-stimator<br />
(Cochran 1977, formula 6.27), modified<br />
to account for total sampling area<br />
(Estes <strong>and</strong> Gilbert 1978).<br />
The possible effects of industrial<br />
activity were examined by <strong>com</strong>paring<br />
densities of seals in areas with <strong>and</strong><br />
without activity such as ice roads,<br />
seismic trails, or artificial isl<strong>and</strong>s.<br />
The shortest straight-line distances<br />
from artificial isl<strong>and</strong>s to each minute<br />
sighting block were determined by<br />
<strong>com</strong>paring positions for each interval to<br />
position for the isl<strong>and</strong>s. Densities<br />
were then calculated for 2-nm concentric<br />
circles centered at the artificial<br />
isl<strong>and</strong>s, out to a distance of 10 nm.<br />
Since the isl<strong>and</strong>s were less than 10 nm<br />
apart <strong>and</strong> interactive effects were<br />
possible, a density in relation to all<br />
isl<strong>and</strong>s was also calculated using the<br />
minimum distance from any of the 3<br />
isl<strong>and</strong>s for each 1-minute sighting<br />
block.
Densities were calculated for an Table 1. The density of ringed seals at<br />
industrial <strong>and</strong> 2 adjacent control holes in relation to distance from 3<br />
blocks. All sightings within 10 nm of artificial isl<strong>and</strong>s in the Beaufort Sea,<br />
l<strong>and</strong> were used in this <strong>com</strong>parison. June 1985-1987.<br />
"Industrial" blocks were areas which<br />
included artificial isl<strong>and</strong>s, ice roads,<br />
<strong>and</strong> seismic trails. "Control" blocks of<br />
1985<br />
similar size were delineated to the east Distance (am)<br />
<strong>and</strong> west of the industrial area. Isl<strong>and</strong> Survey 0-2 2-4 4-6 6-8 8-10<br />
Results <strong>and</strong> Discussion<br />
Data were obtained for 3 artificial<br />
isl<strong>and</strong>s : Seal, Northstar, <strong>and</strong><br />
S<strong>and</strong>piper, for all 3 years of the survey<br />
(Table 1). In 1985, all 3 of the<br />
isl<strong>and</strong>s were active: Seal was engaged<br />
in drilling operations <strong>and</strong> Northstar <strong>and</strong><br />
S<strong>and</strong>piper were <strong>under</strong> construction.<br />
During the 1985 surveys, the central<br />
Beaufort Sea adjacent to the artificial<br />
isl<strong>and</strong>s was surveyed twice, on 7 <strong>and</strong><br />
11 June. Analysis of density with<br />
distance from the isl<strong>and</strong>s indicated that<br />
for all <strong>com</strong>parisons the density of seals<br />
at holes was 20%-80% lower within 2 nm<br />
of the isl<strong>and</strong>s than it was 2-4 nm away.<br />
During the 1986 surveys Seal Isl<strong>and</strong><br />
was inactive <strong>and</strong> had been so all winter:<br />
Northstar was inactive at the time of<br />
survey but had been in operation through<br />
late spring; <strong>and</strong> S<strong>and</strong>piper was currently<br />
active. The area was surveyed before<br />
break-up on 6 June, <strong>and</strong> after break-up<br />
had <strong>com</strong>menced on 13-16 June. Unlike<br />
1985, there was no clear trend in<br />
density with distance from the isl<strong>and</strong>s<br />
for either survey; results for<br />
individual isl<strong>and</strong>s were contradictory.<br />
Near Northstar (active until April) the<br />
density for both surveys was slightly<br />
lower (3%-15%) within 2 nm of the isl<strong>and</strong><br />
than between 2-4 nm. Near S<strong>and</strong>piper the<br />
density was higher within 2 nm of the<br />
isl<strong>and</strong> on one survey, <strong>and</strong> lower on the<br />
other.<br />
During winter <strong>and</strong> spring of<br />
1986-87, all 3 artificial isl<strong>and</strong>s were<br />
inactive. As in previous years, the<br />
isl<strong>and</strong>s were surveyed twice in 1987, on<br />
6 <strong>and</strong> 11 June. There was no consistent<br />
trend in seal density with distance from<br />
the 3 non-operational isl<strong>and</strong>s. Seals<br />
were more numerous near Seal Isl<strong>and</strong>,<br />
less numerous near Northstar, <strong>and</strong><br />
differed between the 2 surveys at<br />
S<strong>and</strong>piper.<br />
Seal 85-1 0.7 1.2 1.1 1.7 1.3<br />
85-2 - 1.9 1.0 3.3 2.2<br />
Northstar 85-1 0.8 1.6 2.2 1.4 0.9<br />
85-2 0.8 1.0 5.8 1.5 1.5<br />
S<strong>and</strong>piper 85-1 0.6 3.1 1.0 1.0 1.1<br />
85-2 2.6 4.4 1.8 1.9 1.6<br />
1986<br />
Distance (nm)<br />
Isl<strong>and</strong> Survey 0-2 2-4 4-6 6-8 8-10<br />
Seal 86-1 6.1 5.8 4.6 2.3 5.1<br />
86-2 - 4.6 6.5 5.0 5.6<br />
Northstar 86-1 5.0 5.2 6.8 4.2 2.1<br />
86-2 5.0 5.9 5.7 8.8 5.3<br />
S<strong>and</strong>piper 86-1 8.3 3.3 6.5 3.2 3.6<br />
86-2 5.2 6.2 6.8 9.1 9.1<br />
1987<br />
Distance (nm)<br />
Isl<strong>and</strong> Survey 0-2 2-4 4-6 6-8 8-10<br />
Seal 87-1 - 1.1 2.9 2.7 5.5<br />
87-2 14.4 9.5 10.4 5.9 4.8<br />
Northstar 87-1 1.1 3.3 5.6 4.1 5.2<br />
87-2 3.8 8.4 14.2 6.3 6.1<br />
S<strong>and</strong>piper 87-1 7.1 7.6 2.2 4.2 3.9<br />
87-2 6.8 5.5 6.6 5.2 11.9<br />
Interpretation of the data<br />
regarding trends in density around<br />
individual isl<strong>and</strong>s was <strong>com</strong>plicated <strong>and</strong><br />
the utility of such data limited by<br />
several factors: sample sizes were<br />
small (17-80 nm 2 total per survey),<br />
particularly within 2 nm of the isl<strong>and</strong>s<br />
where the sample for a survey usually<br />
consisted of 1-3 minutes (1-6 nm 2 ) of<br />
data; the isl<strong>and</strong>s were close enough<br />
together (particularly Seal <strong>and</strong>
Northstar isl<strong>and</strong>s which were only 4 nm<br />
apart) for interactive effects to occur;<br />
<strong>and</strong> not all isl<strong>and</strong>s were in similar<br />
operational status either within or<br />
between years. Consequently, the data<br />
set shown in Table 1 could not be<br />
treated as 18 replicate tests of the<br />
effect of an artificial isl<strong>and</strong> on seal<br />
density.<br />
To address the first two of these<br />
problems we determined the minimum<br />
distance from any isl<strong>and</strong> in the data set<br />
from each survey (Table 2). In 5 of the<br />
6 <strong>com</strong>parisons, the density of seals at<br />
holes was 12%-72% lower within 2 nm of<br />
any isl<strong>and</strong> than it was 2-4 nm away.<br />
Inspection of the raw data indicated<br />
that for the single exception (survey<br />
86-1) the higher density at 0-2 nm was<br />
probably an artifact of the way position<br />
was assigned to the minute survey<br />
interval. Although the density of seals<br />
was lower near the isl<strong>and</strong>s in both 1985<br />
when all isl<strong>and</strong>s were active <strong>and</strong> 1987<br />
when none were active, the magnitude of<br />
the difference was much greater during<br />
activity (50%-70%) than in its absence<br />
(12%-30%).<br />
Table 2. The density of ringed seals at<br />
holes in relation to distance from any<br />
of 3 artificial isl<strong>and</strong>s in the Beaufort<br />
Sea, June 1985-1987.<br />
Distance from any isl<strong>and</strong> (nm)<br />
Survey nm 2 0-2 2-4 4-6 6-8 8-10<br />
A block <strong>com</strong>parison of industrial<br />
<strong>and</strong> adjacent control areas was also done<br />
for all 3 years. In 1985, industrial<br />
activity, including seismic lines, ice<br />
roads, <strong>and</strong> isl<strong>and</strong>s, was widespread,<br />
resulting in an industrial block<br />
approximately 60 nm across. In 1986,<br />
the only obvious activities were the<br />
artificial isl<strong>and</strong>s <strong>and</strong> associated ice<br />
roads, resulting in an industrial block<br />
which was only 16 nm across (Figure 2).<br />
During 1987 surveys there was no<br />
offshore industrial activity; however,<br />
data were analyzed according to the 1986<br />
industrial <strong>and</strong> control blocks for<br />
<strong>com</strong>parative purposes.<br />
70 45 "<br />
70 15 .,<br />
150 148<br />
WEST CONTROL<br />
r----- -- .--.<br />
BEAUFORT SEA<br />
EAST CONTROL<br />
Figure 2. Map showing locations of<br />
artificial isl<strong>and</strong>s in sector B3 of the<br />
Beaufort Sea <strong>and</strong> the 1986 industrial <strong>and</strong><br />
control blocks.<br />
In both 1985 <strong>and</strong> 1986 the density<br />
of total seals was significantly higher<br />
in the industrial block than in the<br />
control blocks (Figure 3). In 1987, in<br />
the absence of any offshore industrial<br />
activity, density in the "industrial"<br />
block was also higher than either<br />
control, suggesting that some<br />
characteristics other than the presence<br />
or absence of activity were responsible<br />
for the difference.<br />
Aerial surveys of ringed seals in<br />
1985-1987 were the most extensive <strong>and</strong><br />
systematic ever conducted in Alaska, <strong>and</strong><br />
the first for which between-year<br />
statistical <strong>com</strong>parisons were possible.<br />
Data from those years demonstrated<br />
substantial year-to-year variability in<br />
ringed seal densities (Table 3).
0 WEST CONTROL<br />
0 EASTCONTROL<br />
Figure 3. Density of ringed seals<br />
(total seals/nm 2 ) in industrial <strong>and</strong><br />
control blocks in the central<br />
Beaufort Sea, June 1985-1987.<br />
Table 3. Comparison of ringed seal<br />
densities (total seals/nm 2 ) on the<br />
shorefast ice of the Chukchi <strong>and</strong><br />
Beaufort seas based on surveys conducted<br />
in 1985-1987. Data from the Chukchi Sea<br />
in 1987 are not yet analyzed.<br />
Density<br />
Sector 1985 1986 1987*<br />
* Preliminary data.<br />
Between 1985 <strong>and</strong> 1986, observed density<br />
of total seals hauled out on the Chukchi<br />
Sea shorefast ice increased 607 from 2.9<br />
to 4.7 seals/nm 2 . Increases in<br />
individual sectors ranged from 307-907..<br />
In the Beaufort Sea, the overall<br />
increase was 12%, from 3.0 to 3.3<br />
seals/nm 2 , with the westernmost sector<br />
near Barrow decreasing 77 <strong>and</strong> the<br />
central sectors increasing 20%-30%. The<br />
causes for such inter-annual variation<br />
are unknown. While relationships<br />
between seal abundance <strong>and</strong> physical<br />
parameters such as ice deformation <strong>and</strong><br />
extent of shorefast ice do exist <strong>and</strong> may<br />
explain small-scale differences in the<br />
distribution <strong>and</strong> abundance of seals<br />
(Frost et al. 1985, 1987), they cannot<br />
account for the large observed inter-<br />
annual differences . We have no measure<br />
of biological parameters such as prey<br />
availability, which may be a major<br />
factor in determining overall ringed<br />
seal distribution <strong>and</strong> abundance in a<br />
given year.<br />
Historical data also indicate<br />
substantial year-to-year variability in<br />
the occupancy of nearshore areas by<br />
ringed seals. Data are available for<br />
the Alaskan Beaufort Sea since 1970<br />
(Burns <strong>and</strong> Harbo 1972; Burns <strong>and</strong> Eley<br />
1978; Burns et al. 1981; Burns <strong>and</strong> Kelly<br />
1982; Frost et al. 1985). During that<br />
period, the density of ringed seals on<br />
the shorefast ice of the Beaufort Sea,<br />
as a whole, dropped from a high of 3.3<br />
seals/nm 2 in 1975, to a low of 1.1<br />
seals/nm 2 in 1977, <strong>and</strong> subsequently<br />
increased steadily to 3.3 seals/nm2 by<br />
1986. The density in any particular<br />
year ranged from 507 below to 40% above<br />
the mean density for 8 years of surveys.<br />
In the Canadian Beaufort Sea near<br />
Tuktoyaktuk, ringed seal densities have<br />
fluctuated from 557 above to 70% below<br />
the long-term mean in a far less regular<br />
manner than the Alaskan Beauf ort Sea<br />
(Stirling et al. 1981; Kingsley 1986).<br />
Such annual <strong>and</strong> long-term<br />
variability demonstrate the need for<br />
regular <strong>and</strong> relatively extensive<br />
coverage of areas in which smaller-scale<br />
<strong>com</strong>parisons are being made. For<br />
example, the density of ringed seals in<br />
the central Beaufort Sea (sectors B2 <strong>and</strong><br />
B3) decreased in the mid- to late 1970's<br />
<strong>and</strong> subsequently increased in the<br />
mid-1980's (Figure 4). This could be<br />
attributed to changes in industrial<br />
activity, which intensified in the late<br />
1970's <strong>and</strong> early 19801s, then gradually<br />
decreased. However, the western<br />
Beaufort Sea (sector Bl), which<br />
experienced little or no seismic or<br />
other industry activity, showed the same<br />
fluctuations in density during this time<br />
period. Furthermore, the major decline
in density which occurred in the study<br />
area between 1975 <strong>and</strong> 1977 also occurred<br />
in the Canadian Beaufort Sea (Stirling<br />
et al. 1981).<br />
00 J<br />
70 72 74 76 78 80 82 34 86<br />
YEAR<br />
Figure 4. Density of ringed seals in 3<br />
sectors of the Beaufort Sea based on<br />
aerial surveys conducted in 1970-1986.<br />
(Data from Burns <strong>and</strong> Harbo 1972; Burns<br />
<strong>and</strong> Eley 1978; Burns et al. 1981; Burns<br />
<strong>and</strong> Kelly 1982; Frost et al. 1986.)<br />
While aerial surveys are useful in<br />
monitoring long-term trends in abundance<br />
over large areas, they are not well-<br />
suited to detecting small-scale<br />
differences in geographically restricted<br />
areas. In this study, aerial survey<br />
data indicated a possible local effect<br />
of artificial isl<strong>and</strong>s on the density of<br />
ringed seals. However, interpretation<br />
was <strong>com</strong>plicated by the fact that the<br />
minimum sighting unit was 1 minute or<br />
2 nm; l<strong>and</strong> <strong>and</strong> the edge of shorefast<br />
ice, which may both affect seal<br />
densities, were variable distances from<br />
the 3 isl<strong>and</strong>s; <strong>and</strong> the precision of<br />
navigational equipment sometimes varied<br />
by  1 nm. In analyses of industrial<br />
<strong>and</strong> control blocks, the greatest<br />
difficulties were in obtaining an<br />
accurate measure of industrial activity<br />
<strong>and</strong> in designating <strong>com</strong>parable control<br />
blocks. There is considerable east-west<br />
variability in the Beaufort Sea in ice<br />
topography, extent of shorefast ice, <strong>and</strong><br />
bathymetry. Control <strong>and</strong> industrial<br />
blocks were not necessarily <strong>com</strong>parable<br />
simply because they were adjacent, as is<br />
indicated by higher densities in the<br />
"industrial" blocks with or without<br />
industrial activity.<br />
In aggregate, analyses of histori-<br />
cal <strong>and</strong> recent aerial survey data<br />
emphasize the im<strong>port</strong>ance of matching<br />
research technique to the question at<br />
h<strong>and</strong>. Our data indicate that in 1985-86<br />
there were no apparent broad-scale<br />
effects of industrial activity on the<br />
density of ringed seals as measured by<br />
aerial surveys. The data do not<br />
discount local effects which would be<br />
more appropriately detected by other<br />
techniques, nor do they discount the<br />
possibility that regional effects could<br />
occur at different levels of industrial<br />
activity. Most aerial surveys conducted<br />
during peak years of industrial activity<br />
in the central Beaufort Sea did not have<br />
sampling effort or design suitable for<br />
statistical analyses of differences<br />
between relatively small areas. By<br />
conducting on-ice studies, Burns <strong>and</strong><br />
Kelly (1982) found that although aerial<br />
surveys showed no significant difference<br />
in densities along seismic <strong>and</strong> control<br />
lines, the rate of alteration or<br />
refreezing of lairs <strong>and</strong> breathing holes<br />
within 150 m of seismic lines was<br />
approximately double the rate at<br />
distances greater than 150 m. Kelly et<br />
al. (1986) also re<strong>port</strong>ed results of<br />
on-ice studies which indicated that<br />
ringed seals do respond to disturbance.<br />
Conclusions<br />
1. Based on aerial surveys conducted<br />
in 1985-87, the density of ringed seals<br />
was lower within 2 nm of artificial<br />
isl<strong>and</strong>s in the central Beaufort Sea than<br />
it was 2-4 nm away. Although this was<br />
true in years with <strong>and</strong> without activity<br />
on the isl<strong>and</strong>s, the difference was<br />
greatest when they were all active.<br />
Interpretation of data was <strong>com</strong>plicated<br />
by possible interactive effects of<br />
distance from the isl<strong>and</strong>s, from l<strong>and</strong>,<br />
<strong>and</strong> from the shorefast ice edge; the<br />
accuracy of navigational equipment; <strong>and</strong><br />
other biological or physical parameters<br />
that could affect densities but which<br />
were unknown to us.<br />
2. Comparisons of industrial <strong>and</strong><br />
adjacent control blocks in 1985 <strong>and</strong> 1986<br />
indicated that the density of ringed<br />
seals was significantly higher in the<br />
industrial blocks in both years. A<br />
similar <strong>com</strong>parison of the same blocks in<br />
1987 when there was no industrial
activity also showed that seals were<br />
more numerous in the industrial block,<br />
which indicates that factors other than<br />
the presence or absence of industrial.<br />
activity caused the difference.<br />
3. There was a steady increase in the<br />
density of ringed seals in the central<br />
Beaufort Sea from 1985-87 which occurred<br />
concurrently with a decrease in<br />
industrial activity. In our opinion,<br />
the two are probably not related, since<br />
a similar increase in density occurred<br />
in the western Beaufort Sea where no<br />
industrial activity took place.<br />
4. While our studies do not show any<br />
broad-scale effect of industrial<br />
activities on ringed seal abundance <strong>and</strong><br />
distribution in the Beaufort Sea, that<br />
does not imply that such effects cannot<br />
occur. Our data relate only to the<br />
types <strong>and</strong> levels of activities that<br />
occurred during the study period.<br />
Continued monitoring of ringed seal<br />
populations is warranted. Studies of<br />
ringed seal ecology are needed in order<br />
to explain the causes of the "natural"<br />
fluctuations in density that have been<br />
documented.<br />
5. Aerial surveys are a useful means<br />
of detecting long-term trends in ringed<br />
seal abundance <strong>and</strong> <strong>com</strong>paring regional<br />
trends in abundance over large areas.<br />
However, aerial surveys alone are not<br />
adequate for determining the effects of<br />
industrial activity. Such studies<br />
should <strong>com</strong>bine aerial surveys with<br />
on-ice studies that monitor the use <strong>and</strong><br />
fate of breathing holes <strong>and</strong> lairs on a<br />
finer scale.<br />
Acknowledgements<br />
This study was funded by the<br />
Minerals Management Service, Department<br />
of the Interior, through an Interagency<br />
Agreement with the National Oceanic <strong>and</strong><br />
Atmospheric Administration, Department<br />
of Commerce, as part of the Alaska Outer<br />
Continental Shelf Environmental<br />
Assessment Program, contract numbers<br />
02-5-022-53, 03-5-022-69 (RU #232),<br />
NA-81-RAC-00045, <strong>and</strong> 84-ABC-00210.<br />
The authors especially want to<br />
acknowledge the logistic sup<strong>port</strong><br />
provided by the NOAA Office of Aircraft<br />
Operations in the form of the NOAA Twin<br />
Otter <strong>and</strong> its excellent flight crews,<br />
particularly Comm<strong>and</strong>er Dan Eilers who<br />
served not only as Chief Pilot all 3<br />
years, but as a valuable member of the<br />
scientific team. Thanks go to Jim<br />
Gilbert, Howard Golden, Sue Hills, Dawn<br />
Hughes, <strong>and</strong> Val Uhler for their many<br />
hours as observers, recorders, <strong>and</strong> idea<br />
generators; to George Lapiene for taking<br />
care of sometimes <strong>com</strong>plicated logistics<br />
planning; <strong>and</strong> to Jesse Venable for<br />
helping to translate hours of survey<br />
data into analyzed results. Special<br />
thanks to John Burns who, for better or<br />
worse, got us started surveying ringed<br />
seals <strong>and</strong> laid the ground work for this<br />
project over 15 years ago.<br />
References<br />
Burns, J. J. <strong>and</strong> T. J. Eley. 1978. The<br />
natural history <strong>and</strong> ecology of the<br />
bearded seal (Erignathus barbatus)<br />
<strong>and</strong> the ringed seal (Phoca hispida).<br />
Paces 99-162 in Environmental Assessment<br />
ofthe ~laskan~ontinental Shelf, Annual<br />
Re<strong>port</strong>s, Vol. 1, Outer Continental<br />
Shelf Environmental Assessment Program,<br />
Boulder, CO.<br />
Burns, J. J. <strong>and</strong> S. J. Harbo, Jr. 1972.<br />
An aerial census of ringed seals,<br />
northern coast of Alaska. Arctic<br />
25:279-290.<br />
Burns, J. J. <strong>and</strong> B. P. Kelly. 1982.<br />
Studies of ringed seals in the Alaskan<br />
Beaufort Sea during winter: impacts of<br />
seismic exploration. Annual re<strong>port</strong><br />
RU #232 to Outer Continental Shelf<br />
Environmental Assessment Program,<br />
Juneau, AK. 57 pp.<br />
Burns, J. J., L. F. Lowry, <strong>and</strong> K. J.<br />
Frost. 1981. Trophic relationships,<br />
habitat use, <strong>and</strong> winter ecology of<br />
ice-inhabiting phocid seals <strong>and</strong><br />
functionally related marine mammals<br />
in the Arctic. Annual re<strong>port</strong> RU #232 to<br />
Outer Continental Shelf Environmental<br />
Assessment Program, Juneau, AK. 81 pp.<br />
Cochran, W. G. 1977. Sampling<br />
techniques, John Wiley & Sons, Inc.,<br />
NY. 428pp.<br />
Estes, J. A. <strong>and</strong> J. R. Gilbert. 1978.<br />
Evaluation of an aerial survey of
Pacific walruses (Odobenus rosmarus<br />
divergens). J. Fish. Res. Bd. Can.<br />
35:1130-1140.<br />
Frost, K. J. <strong>and</strong> L. F. Lowry. 1984.<br />
Trophic relationships of vertebrate<br />
consumers in the Alaskan Beaufort<br />
Sea. Pages 381-401 & P. W. Barnes,<br />
D. M. Schell, <strong>and</strong> E. Reimnitz, eds.<br />
The Alaskan Beaufort Sea - Ecosystems<br />
<strong>and</strong> Environments. Academic Press,<br />
NY.<br />
Frost, K. J., L. F. Lowry, <strong>and</strong> J. J.<br />
Burns. 1985. Ringed seal monitoring:<br />
relationships o f distribution,<br />
abundance, <strong>and</strong> reproductive success to<br />
habitat attributes <strong>and</strong> industrial<br />
activities. Interim re<strong>port</strong> 1985 -<br />
RU #667 to Outer Continental Shelf<br />
Environmental Assessment Program,<br />
Juneau, AK. 85 pp.<br />
Frost, K. J., L. F. Lowry, <strong>and</strong> J. R.<br />
Gilbert. 1987. Ringed seal monitoring:<br />
relationships o f distribution,<br />
abundance, <strong>and</strong> reproductive success to<br />
habitat attributes <strong>and</strong> industrial<br />
activities. Interim re<strong>port</strong> 1986 -<br />
RU #667 to Outer Continental Shelf<br />
Environmental Assessment Program,<br />
Juneau, AK. 53 pp.<br />
Kelly, B. P., L. T. Quakenbush, <strong>and</strong> J.<br />
R. Rose. 1986. Ringed seal winter<br />
ecology <strong>and</strong> effects of noise<br />
disturbance. Final re<strong>port</strong> (Part 2)<br />
RU #232 to Outer Continental Shelf<br />
Environmental Assessment Program,<br />
Juneau, AK. 83 pp.<br />
Kingsley, M. C. S. 1986. Distribution<br />
<strong>and</strong> abundance of seals in the Beaufort<br />
Sea, Amundsen Gulf, <strong>and</strong> Prince Albert<br />
Sound, 1984. Environmental Studies<br />
Revolving Funds Re<strong>port</strong> No. 025. 16 pp.<br />
Lowry, L. F., K. J. Frost, <strong>and</strong> J. J.<br />
Burns. 1978. Food of ringed seals <strong>and</strong><br />
bowhead whales near Point Barrow,<br />
Alaska. Can. Field-Nat. 92:67-70.<br />
Lowry, L. F., K. J. Frost, <strong>and</strong> J. J.<br />
Burns. 1980. Variability in the diet<br />
of ringed seals, Phoca hispida, in<br />
Alaska. Can. J. Fish. Aquat. Sci.<br />
37:2254-2261.<br />
Smith, T. G. 1980. Polar bear<br />
predation of ringed <strong>and</strong> bearded seals in<br />
the l<strong>and</strong>-fast sea ice habitat. Can. J.<br />
2001. 58:2201-2209.<br />
Smith T. G. <strong>and</strong> M. 0. Hammill. 1981.<br />
Ecology of the ringed seal, Phoca<br />
hispida, in its fast ice breeding<br />
habitat. Can. J. 2001. 59:966-981.<br />
Smith, T. G. <strong>and</strong> I. Stirling. 1975.<br />
The breeding habitat of the ringed seal<br />
(Phoca hispida). The birth lair <strong>and</strong><br />
associated structures. Can. J. Zool.<br />
53:1297-1305.<br />
Stirling, I., M. C. S. Kingsley, <strong>and</strong> W.<br />
Calvert. 1981. Seals in the Beaufort<br />
Sea 1974-1979. Re<strong>port</strong> prepared for Dome<br />
Petroleum Limited, Esso Resources Canada<br />
Limited, <strong>and</strong> the Department of Indian<br />
<strong>and</strong> Northern Affairs. Can. Wildl.<br />
Serv., Edmonton, Alberta. 70 pp.<br />
Discussion<br />
B. KELLEY: Given the great annual<br />
variability in ice <strong>and</strong> snow <strong>conditions</strong><br />
that appear to affect the pro<strong>port</strong>ion<br />
of basking seals, how useful do you<br />
feel aerial survey data are for<br />
examining year-to-year changes in seal<br />
density?<br />
K. FROST: Although annual variability<br />
in ice <strong>and</strong> snow <strong>conditions</strong> can be<br />
considerable, that variability is<br />
generally apparent to survey<br />
observers. As long as surveys are<br />
conducted not only during the same<br />
general time period, but also <strong>under</strong><br />
similar ice <strong>conditions</strong> (e.g., before<br />
extensive snow melt <strong>and</strong> cracking of<br />
the fast ice occur), year-to-year<br />
<strong>com</strong>parisons should be useful.<br />
However, relatively large geographic<br />
areas should be included in<br />
<strong>com</strong>parisons in order to avoid apparent<br />
differences caused by small-scale<br />
local variability. Data should be<br />
screened to ensure that surveys have<br />
not been conducted <strong>under</strong> post-breakup<br />
<strong>conditions</strong>, which result in extremely<br />
high densities. The best indicators<br />
of these <strong>conditions</strong> are a large<br />
percentage (greater than 30%) of seals<br />
at cracks <strong>and</strong> a high incidence of<br />
groups of more than 2 seals at holes.<br />
Within a year, surveys of some part of
the study area should be replicated<br />
several times at 3 to 5 day intervals<br />
to ensure that surveys are conducted<br />
<strong>under</strong> suitable <strong>conditions</strong> <strong>and</strong> before<br />
haul-out patterns have begun to change<br />
with the onset of breakup.<br />
T. NEWBURY: You described data on the<br />
number of seals around drill sites,<br />
<strong>and</strong> you implied that there might be a<br />
direct effect on these seals due to<br />
activity. Won't there also be an<br />
indirect effect due to the influence<br />
of activity on seal predators,<br />
primarily polar bears?<br />
K. FROST: Indirect effects on predators<br />
are possible, but it is difficult to<br />
predict what they might be. Any effects<br />
would depend on the characteristics of<br />
the activities <strong>and</strong> the specifics of<br />
predator <strong>and</strong> prey populations in the area<br />
(including density, age, <strong>and</strong> sex<br />
<strong>com</strong>position, or other factors). In 300<br />
hours of surveys over the fast <strong>and</strong> pack<br />
ice of northern Alaska, no polar bear<br />
kill sites were seen in the very<br />
nearshore region where drill sites were<br />
located.<br />
V. R. NERALLA: Did you conduct any<br />
studies on the appearance of ringed seals<br />
<strong>and</strong> environmental <strong>conditions</strong> (e.g., air<br />
temperature, wind speed <strong>and</strong> wind<br />
direction, etc.)?<br />
K. FROST: Most investigators who have<br />
surveyed ringed seals have considered the<br />
effects of environmental <strong>conditions</strong>. The<br />
survey protocol which specified that<br />
surveys be conducted between 10 a.m. <strong>and</strong><br />
4 p.m. (sun time) <strong>and</strong> when wind speed was<br />
less than 20 knots incorporated what this<br />
<strong>and</strong> other studies have found about ringed<br />
seal behavior relative to weather. In<br />
order for a study to specifically test<br />
the effects of weather, surveys would<br />
have to be conducted <strong>under</strong> poor as well<br />
as good weather <strong>conditions</strong>.<br />
Data obtained in our study are presented<br />
in Frost et al. 1985 <strong>and</strong> 1987. It should<br />
be noted that it is difficult to make<br />
specific correlations between<br />
environmental <strong>conditions</strong> <strong>and</strong> seal haul-<br />
out patterns for two major reasons: ( 1)<br />
environmental variables are interactive<br />
<strong>and</strong> do not always produce the same<br />
results (for example, strong winds on<br />
bright, sunny days may not inhibit haul-<br />
out, whereas more moderate winds on cold<br />
days may greatly reduce the number of<br />
seals hauling out); <strong>and</strong>, (2) it is<br />
extremely difficult to obtain on-ice<br />
measurements of temperature <strong>and</strong> wind<br />
speed or direction during surveys.<br />
Conditions at shore-based weather<br />
stations or those at survey altitude may<br />
be considerably different than <strong>conditions</strong><br />
over the ice at ground level.
RESPONSES OF RINGED SEALS (Phoca hispida) TO NOISE DISTURBANCE<br />
Abstract<br />
Brendan P. Kelly<br />
Institute of Marine Science, University of Alaska Fairbanks, Alaska, USA<br />
John J. Burns<br />
Living Resources Inc., Fairbanks, Alaska, USA<br />
Lori T. Quakenbush<br />
Institute of Marine Science, University of Alaska Fairbanks, Alaska, USA<br />
The effects of on-ice industrial noises<br />
on ringed seals (Phoca hispida) were<br />
investigated to determine the extent to<br />
which such disturbance increases the rates<br />
at which seals ab<strong>and</strong>on breathing holes <strong>and</strong><br />
lairs. In the spring of 1982, breathing holes<br />
<strong>and</strong> lairs were ab<strong>and</strong>oned three times as<br />
often within 150 m of recent seismic survey<br />
lines as were structures at greater distances<br />
from the same lines. Subnivean structures<br />
were ab<strong>and</strong>oned at equal rates within <strong>and</strong><br />
beyond 150 m of control lines. Aerial<br />
surveys of ringed seals conducted in the<br />
Beaufort Sea in 1981 <strong>and</strong> 1982, however,<br />
showed no consistent differences in the<br />
density of basking seals in transects<br />
centered over seismic survey lines <strong>and</strong> in<br />
intervening transects.<br />
The rate of ab<strong>and</strong>onment of subnivean<br />
seal structures was <strong>com</strong>pared over six years.<br />
In undisturbed areas, the ab<strong>and</strong>onment rate<br />
was 4.0% in shore-fast ice <strong>and</strong> 12.9% in<br />
drifting ice. Among seal structures<br />
subjected to industrial noise in the shore-fast<br />
ice, the rate was 13.5%, <strong>and</strong> with the<br />
addition of repeated examinations of<br />
structures by investigators the rate was<br />
32.5%.<br />
This is a reviewed <strong>and</strong> edited version of a paper presented<br />
at the Ninth International Conference on Port <strong>and</strong> Ocean<br />
Engineering Under Arctic Conditions, Fairbanks, Alaska,<br />
USA, August 17-22, 1987. @ The Geophysical Institute,<br />
University of Alaska, 1987.<br />
Radio-tagged seals departed their lairs<br />
in response to snow machines within 2.8 km,<br />
human footfalls as far away as 600 m, a skier<br />
as far away as 400 m, <strong>and</strong> in response to a<br />
helicopter flying 5 km from the lair at an<br />
altitude of 152 m, <strong>and</strong> during helicopter<br />
l<strong>and</strong>ings or takeoffs as far away as 3 km.<br />
Ringed seals ab<strong>and</strong>on breathing holes<br />
<strong>and</strong> lairs in response to naturally occurring<br />
<strong>conditions</strong> such as minimal snow cover,<br />
shifting ice, <strong>and</strong> the activities of predators.<br />
They ab<strong>and</strong>on those sites at higher rates in<br />
response to anthropogenic noises. Seals<br />
would be most adversely affected by noise<br />
disturbance in late March through June<br />
when the amount of time they spend out of<br />
the water is increasing <strong>and</strong> movements,<br />
especially of females <strong>and</strong> their dependent<br />
young, are limited to small areas.<br />
Introduction<br />
Potential effects on marine mammals<br />
of anthropogenic noises include physical<br />
harm from extremely loud noises,<br />
interference with vocal <strong>com</strong>munication,<br />
increased levels of stress, <strong>and</strong> displacement<br />
from local areas (Rausch 1973; Geraci <strong>and</strong><br />
St. Aubin 1980; Schusterman <strong>and</strong> Moore<br />
1980; Norris 1981; Stewart 1981; Ronald <strong>and</strong><br />
Dougan 1982; Mansfield 1983; Kelly et al.<br />
1986). Displacement has the most potential<br />
for widespread <strong>and</strong> long-term effects <strong>and</strong> has<br />
been a focus of our investigations. Ringed
seals (Phoca hispida) are the most adapted of<br />
northern pinnipeds to inhabiting thick,<br />
relatively stable sea ice, <strong>and</strong> their ability to<br />
maintain holes through the ice permits them<br />
to occupy areas of <strong>com</strong>plete ice cover year-<br />
round. That adaptation allows ringed seals<br />
to exploit resources from which other<br />
pinnipeds are largely excluded during<br />
winter, but it also makes them more<br />
vulnerable to predation by polar bears<br />
(Ursus maritimus) <strong>and</strong> <strong>arctic</strong> foxes (Alopex<br />
lagopus). Mortality of ringed seal pups can<br />
be substantial due to that predation (Smith<br />
1976; Smith 1987; Kelly et al. 1987).<br />
Occupation of areas of extensive ice cover,<br />
especially shore-fast ice, also makes ringed<br />
seals more vulnerable to human activities;<br />
for thous<strong>and</strong>s of years the species was a<br />
major resource for coastal Eskimos <strong>and</strong> it<br />
remains im<strong>port</strong>ant in modern Eskimo<br />
culture <strong>and</strong> economy (Hall 1866; Boas 1888;<br />
Stefansson 1913; Manning 1944; McLaren<br />
1958a; Cox <strong>and</strong> Spiess 1980; Wenzel 1984;<br />
Smith 1987). In recent times, petroleum<br />
exploration <strong>and</strong> development activities have<br />
taken place in ringed seal habitat. Gravel<br />
isl<strong>and</strong> construction <strong>and</strong> exploration for oil<br />
using seismic profiling have overlapped<br />
spatially <strong>and</strong> temporally with ringed seal<br />
whelping <strong>and</strong> breeding areas. Both gravel<br />
isl<strong>and</strong> construction <strong>and</strong> seismic profiling<br />
involve operating heavy trucks <strong>and</strong><br />
bulldozers on the shore-fast ice. Seismic<br />
profiling further entails imparting<br />
substantial amounts of low frequency sound<br />
energy into the <strong>ocean</strong>ic crust (<strong>and</strong><br />
incidentally the water column <strong>and</strong> overlying<br />
ice) <strong>and</strong> recording the reflected signals.<br />
Concern about the effects of<br />
disturbance in Alaskan waters was first<br />
expressed by subsistence hunters on the<br />
Seward Peninsula. They re<strong>port</strong>ed decreased<br />
harvests of ringed seals in an area subjected<br />
to offshore gold exploration in the 1960's<br />
(Burns <strong>and</strong> Kelly 1982). More recently,<br />
seismic profiling during oil exploration has<br />
presented a greater potential for disturbance<br />
since it involves considerable noise energy<br />
<strong>and</strong> affects extensive areas. Explosives were<br />
the main signal sources until their offshore<br />
use was banned in 1977 b an<br />
Administrative Order of the A aska<br />
Department of Natural Resources.<br />
Subsequently, "air guns," "water guns," <strong>and</strong><br />
Vibroseis machines have been used to<br />
generate source signals.<br />
When we began this study in 1981, the<br />
only data available with which to examine<br />
the hunters' suggestion that ringed seals<br />
r<br />
were displaced by noise disturbances were<br />
the results of aerial surveys conducted<br />
between 1970 <strong>and</strong> 1977 (Burns <strong>and</strong> Harbo<br />
1972; Burns <strong>and</strong> Eley 1978). In those<br />
surveys, lower densities of seals were<br />
observed in the vicinity of coastal<br />
settlements than in adjacent near-shore<br />
areas. They believed that those differences<br />
were greater than could be accounted for by<br />
removal of seals, since hunting of ringed<br />
seals was greatly reduced <strong>com</strong>pared to<br />
earlier times. They speculated that human<br />
activity, especially snow machine travel,<br />
was displacing seals from those areas.<br />
Examination of the aerial data from the<br />
Beaufort Sea for indications of differences in<br />
seal densities inside <strong>and</strong> outside of areas<br />
affected by seismic exploration has yielded<br />
conflicting results. Burns <strong>and</strong> Harbo (1972)<br />
re<strong>port</strong>ed similar densities of seals in both<br />
areas during the 1970 survey, but Burns et<br />
al. (1981) re-examined the data from 1975-<br />
1977 <strong>and</strong> concluded that densities of seals in<br />
"seismic" areas were consistently lower than<br />
in undisturbed areas. None of those surveys<br />
were designed to test for indications of<br />
displacement, however, <strong>and</strong> the<br />
retrospective partitioning of the data into<br />
disturbed <strong>and</strong> undisturbed areas was<br />
unsatisfactory.<br />
For the present study, we <strong>com</strong>bined onice<br />
surveys of subnivean seal structures<br />
(breathing holes <strong>and</strong> lairs) using trained<br />
Labrador retrievers, aerial surveys of<br />
basking seals, <strong>and</strong> radio telemetr to<br />
quantify the reactions of ringed sea s to<br />
seismic profiling that employed the<br />
Vibroseis method <strong>and</strong> to other<br />
anthropogenic noises. Our objectives were to<br />
(1) determine the effect of seismic profiling<br />
activities on ringed seal distribution, (2)<br />
determine the behavioral responses of<br />
ringed seals occupying lairs to<br />
anthropogenic noise, (3) <strong>com</strong>pare the rates of<br />
ab<strong>and</strong>onment of subnivean structures in<br />
disturbed <strong>and</strong> undisturbed areas, <strong>and</strong> (4)<br />
assess the significance of ab<strong>and</strong>onment of<br />
subnivean structures in terms of the<br />
numbers <strong>and</strong> distribution of alternative<br />
structures available to individual seals. Our<br />
primary measures of disturbance were the<br />
relative densities of basking seals along <strong>and</strong><br />
immediately adjacent to seismic "shot lines,"<br />
the rate of ab<strong>and</strong>onment of subnivean<br />
structures as a function of distance from<br />
seismic lines, <strong>and</strong> changes in haulout<br />
frequency <strong>and</strong> duration in areas subjected to<br />
seismic profiling. Rates of short-term <strong>and</strong><br />
long-term displacement resulting from noise<br />
disturbance were assessed relative to<br />
f
natural rates established using surveys <strong>and</strong><br />
telemetric studies conducted between 1981<br />
<strong>and</strong> 1987.<br />
Methods<br />
Aerial surveys<br />
Aerial surveys were conducted along<br />
the Beaufort Sea coast of Alaska (Figure 1)<br />
between 2 <strong>and</strong> 9 June 1981 <strong>and</strong> between 25<br />
May <strong>and</strong> 4 June 1982. The 1981 surveys<br />
were conducted from a twin engine fixed-<br />
wing aircraft (Grumman Goose) equipped<br />
with a Global Navigation System (GNS). A<br />
Bell 204 helicopter, also with GNS, was used<br />
for the 1982 surveys. Two observers counted<br />
all seals visible within 0.5 nm of each side of<br />
the aircraft while flying at an altitude of<br />
500 ft.<br />
Figure 1. Map of Alaska showing locations mentioned in text.<br />
2 9<br />
Between 2 <strong>and</strong> 9 June 1981, we<br />
surveyed 2,880 nm of transect lines divided<br />
into three groups; those parallel to the coast<br />
between Smith Bay (70°55'N 154O20W) <strong>and</strong><br />
Barter Isl<strong>and</strong> (70°08'N 143'40'W), those<br />
centered over seismic lines that had been<br />
surveyed during the previous few months,<br />
<strong>and</strong> control lines centered between those<br />
seismic line transects. In 1982, we<br />
conducted aerial surveys between 25 May<br />
<strong>and</strong> 4 June. The total length of those<br />
transects was 1,083 nm, again divided into<br />
those along seismic trails, those along<br />
control transects, <strong>and</strong> a series duplicating<br />
some of the transects surveyed in June 1981.<br />
Subnivean seal structure surveys<br />
Trained Labrador retrievers were used<br />
to find seal-made structures (subnivean lairs<br />
<strong>and</strong> breathing holes) in 10 surveys between<br />
so"<br />
50Â
1982 <strong>and</strong> 1987. The method was similar to<br />
the way Eskimo hunters used sled dogs to<br />
locate seal holes (Hall 1866). Canadian<br />
workers adapted the method for biological<br />
sampling (Smith <strong>and</strong> Stirling 1975) <strong>and</strong> one<br />
of us (BPK) learned the method from them<br />
in 1981. The dogs ran in front of a snow<br />
machine at the direction of the dog h<strong>and</strong>ler.<br />
When they detected seal odor, they followed<br />
the scent to its source <strong>and</strong> indicated the<br />
location of the seal structure by digging in<br />
the snow above it. Generally, the dogs were<br />
directed to run perpendicular to the wind<br />
direction to maximize the area of detection.<br />
The search pattern varied de ending<br />
on the objectives of work during the different<br />
field efforts. The dogs generally searched<br />
either along lines established by heavy<br />
equipment <strong>and</strong> snow machines or at r<strong>and</strong>om<br />
within pre-selected areas, usually near field<br />
camps or stations established to monitor<br />
radio-tagged seals. An exception was in a<br />
drift ice survey in 1987 when the dogs<br />
searched along tracks of polar bears.<br />
Seal structure surveys in 1982 were<br />
limited to the shore-fast ice of the Beaufort<br />
Sea, primarily in the vicinity of Reindeer<br />
Isl<strong>and</strong> <strong>and</strong> Seal Isl<strong>and</strong>, a man-made gravel<br />
isl<strong>and</strong> (Figure 2). In that effort, searches<br />
were primarily along seismic lines or control<br />
lines delineated by snow machine tracks.<br />
Surveys in 1983 were conducted again in the<br />
Reindeer Isl<strong>and</strong> area <strong>and</strong> at numerous<br />
shore-fast ice locations from Norton Sound<br />
in the Bering Sea north to Point Barrow in<br />
the Chukchi Sea (Figure 1). In 1984, shore-<br />
fast ice was surveyed in Kotzebue Sound <strong>and</strong><br />
drifting ice was surveyed elsewhere in the<br />
Chukchi Sea. Shore-fast ice was surveyed in<br />
the vicinity of Point Barrow in 1985, 1986,<br />
<strong>and</strong> 1987. The 1987 surveys also included<br />
efforts in the Beaufort Sea east of Point<br />
Barrow; on shore-fast ice between the man-<br />
made gravel isl<strong>and</strong>, Tern Isl<strong>and</strong> (70°17'N<br />
147O28'W) <strong>and</strong> Narwhal Isl<strong>and</strong> (70°24'N<br />
147'30'W) <strong>and</strong> at several locations in<br />
drifting ice.<br />
At a minimum, each structure was<br />
probed with an aluminum rod, 1 cm in<br />
diameter. Most structures were partially<br />
uncovered to permit examination <strong>and</strong><br />
measurements after which they were<br />
carefully re-covered. When examined,<br />
structures were classified as breathing<br />
holes, simple resting lairs, multi-chambered<br />
lairs, or birth lairs, <strong>and</strong> notations were made<br />
of the dimensions, physical setting, <strong>and</strong><br />
indications of predator activity. The status<br />
of each structure was recorded as open, if<br />
the hole through the ice was maintained by<br />
the seal to its maximal diameter; frozen, if<br />
the entire hole was refrozen; or, in the case of<br />
lairs as altered, if access to the lair was<br />
obstructed by partial freezing of the access<br />
hole or by a collapsing ceiling. Structures<br />
that were classified as frozen were<br />
considered to have been ab<strong>and</strong>oned by the<br />
seals.<br />
In most instances, structures were<br />
examined when first located. In 1982,<br />
however, many structures were probed when<br />
first located, but they were not examined<br />
further until a subsequent revisit. In that<br />
year, approximately 72% of the structures<br />
were visited two or more times.<br />
The examination of a structure was<br />
considered to constitute a disturbance, thus<br />
all examinations subsequent to the initial<br />
one were of structures previously exposed to<br />
anthropogenic disturbance <strong>and</strong> were<br />
categorized as such.<br />
Monitoring of haulout activity<br />
Fourteen ringed seals were live-<br />
captured at breathing holes in the shore-fast<br />
ice; three in the Beaufort Sea in 1982, six in<br />
the Beaufort Sea in 1983, <strong>and</strong> five in<br />
Kotzebue Sound in 1984 (Kelly et al. 1986).<br />
The weight, sex, <strong>and</strong> minimal age, as<br />
determined by claw annuli (McLaren<br />
1958b), of each seal was recorded. VHF<br />
radio transmitters were glued to the pelage<br />
of the dorsum, midway between the base of<br />
the tail <strong>and</strong> the region of maximal girth,<br />
before each seal was released at its capture<br />
site.<br />
The unique frequency of each deployed<br />
transmitter was monitored from a nearby<br />
camp every half-hour in 1982 <strong>and</strong> every hour<br />
in 1983 <strong>and</strong> 1984 for up to 2.5 months<br />
between March <strong>and</strong> early June. Signals<br />
could be received only when the transmitters<br />
were above the ice surface, thus indicating<br />
that the seals were out of the water.<br />
Haulout bouts of 13 of the radio-tagged seals<br />
were monitored after their release; no<br />
signals were received from one of the seals<br />
tagged in 1983. Whenever feasible, the<br />
exact location of the signal sources,<br />
indicating the location of lairs or other<br />
haulout sites, was determined. Those<br />
determinations were ac<strong>com</strong>plished by skiing<br />
or walking around the signal source while<br />
monitoring the signal with a h<strong>and</strong>-held,<br />
directional antenna.
SEISMIC SURVEY LINES, /<br />
0 1000 2000 3000 4000 METERS - Seismic survey lines<br />
p Subnivean seal structures<br />
Figure 2. Subnivean structures used by radio-tagged ringed seals <strong>and</strong> seismic survey lines in<br />
1982 (north of Reindeer Isl<strong>and</strong>) <strong>and</strong> 1983 (south of Reindeer Isl<strong>and</strong>). (After Kelly et al. 1986.)<br />
When radio-tagged seals were in their<br />
lairs <strong>and</strong> subjected to anthropogenic sounds,<br />
notations were made of their behavioral<br />
responses (departed or remained in lair). In<br />
April 1983, a simulated seismic survey was<br />
conducted near Reindeer Isl<strong>and</strong> in an area<br />
occupied by radio-tagged seals. The survey<br />
consisted of four seismic lines; A, B, C, <strong>and</strong> D<br />
depicted in Figure 2. Four machines<br />
travelled over each seismic line. A drill<br />
truck used a power auger to bore holes<br />
through the ice, generally every 67 m along<br />
the survey lines. A bulldozer (D6<br />
Caterpillar) then leveled the ice along the<br />
survey lines. Every 67 m, the ice surface<br />
was vibrated ten times in 16 second sweeps<br />
from 10 to 70 Hz by a Vibroseis machine. A<br />
fuel truck followed at the end of the convoy.<br />
Lines A <strong>and</strong> B were vibrated on 21 April,<br />
lines C <strong>and</strong> D were vibrated on 22 April, <strong>and</strong><br />
line A was vibrated a second time on 27<br />
April. Additionally, the behavioral<br />
responses of seals in lairs to the sounds of<br />
I<br />
helicopters, snow machines <strong>and</strong> other<br />
equipment operating on the ice, <strong>and</strong> people<br />
walking or skiing on the ice were<br />
documented op<strong>port</strong>unistically.<br />
Results<br />
Aerial surveys<br />
^<br />
Results of our aerial surve s were<br />
conflicting with regard to the e fects of<br />
seismic survey activities on seal<br />
distribution. In 1981, we observed an<br />
average of 1.3-1.4 ringed seals per nm2 on<br />
the shore-fast ice between Point Barrow<br />
(71°23.2'N 156'27.2W) <strong>and</strong> Oliktok Point<br />
(70°30.0'N 14g052.6W) <strong>and</strong> an average of<br />
1.1 ringed seals per nm2 between Oliktok<br />
Point <strong>and</strong> Barter Isl<strong>and</strong> (70°08.1'N<br />
142O24.7'W), similar to the densities<br />
observed in four surveys conducted between<br />
1970 <strong>and</strong> 1978 (Burns et al. 1981).
The observed densities of basking seals<br />
along seismic lines <strong>and</strong> intermediate control<br />
lines on three days are shown in Table 1.<br />
Densities along the two sets of lines differed<br />
significantly only on 3 June when densities<br />
along the seismic lines were 58% of those<br />
along control lines.<br />
Concentrations of seals basking along<br />
newly opened cracks (as opposed to at<br />
breathing holes) appeared unexpectedly<br />
early in June 1981 <strong>and</strong> increased from 13.9%<br />
of all seals sighted on 4 June to 16.5% on<br />
7 June <strong>and</strong> 22.8% on 8 June. The indication<br />
was that seals were leaving breathing holes<br />
<strong>and</strong> lairs maintained through the winter in<br />
favor of haulout sites along newly opened<br />
cracks. Therefore, we suspected that the 5<br />
<strong>and</strong> 9 June surveys were less representative<br />
of the early spring distribution of seals than<br />
was the 3 June survey. Thus, in 1982, we<br />
scheduled aerial surveys to begin in late<br />
May in the hope of obtaining relative<br />
densities that were more representative of<br />
early spring distribution.<br />
A replicated survey track from Cape<br />
Halkett (70°48'N 152Oll'W) to a point<br />
offshore of Prudhoe Bay yielded 1.28 seals<br />
per nm2 in 1981 <strong>and</strong> 1.84 seals per nm2 in<br />
1982, not a significant difference (t = 1.03,<br />
df = 32, p > 0.10). The 1982 effort also<br />
included eight flights in which a series of<br />
seismic <strong>and</strong> control lines were surveyed<br />
(Table 2). Observed densities along seismic<br />
<strong>and</strong> control lines did not differ si<br />
except on 26 May when more sea lifi~tly, s (1 00 per<br />
nm2) were observed along seismic lines than<br />
along control lines (0.48 seals per nm2) (t =<br />
2.24, df = 13, p < 0.05).<br />
Responses of seals to anthropogenic noises<br />
Haulout bouts of the radio-tagged<br />
ringed seals were monitored for 3 to 10<br />
weeks (Table 31, <strong>and</strong> we documented the<br />
behavioral responses of seals that were<br />
hauled out in lairs when exposed to a variety<br />
of anthropogenic noises. Single observations<br />
were obtained during the approach of a<br />
seismic convoy, a hovercraft, <strong>and</strong> a dog. A<br />
seal (GI83) departed his lair when a seismic<br />
convoy was 0.64 km away. On another<br />
occasion, the same seal departed his lair<br />
when a dog approached within 5 m of the<br />
lair. Another seal (SA82) remained in her<br />
lair when a hovercraft passed at a distance of<br />
2.5 km.<br />
Responses of seals to helicopter noise<br />
was variable. Responses to helicopters<br />
l<strong>and</strong>ing <strong>and</strong> taking off (i.e., when the<br />
helicopters were applying maximal power<br />
<strong>and</strong> lift close to the surface) were noted six<br />
times. On two occasions, at distances of 1.0<br />
<strong>and</strong> 3.0 km, the seal departed. On four<br />
occasions, all at distances greater than<br />
2.5 km, the seals remained in their lairs.<br />
Seals departed lairs in five of 14 cases in<br />
response to airborne helicopters. In one<br />
case, the helicopter was directly over the lair<br />
at an altitude of 152 m, <strong>and</strong> in another case<br />
it was 5 km away at that same altitude when<br />
the seal departed. The closest approaches of<br />
airborne helicopters that were tolerated by<br />
seals in lairs were 0.6 km at an altitude of<br />
122 m <strong>and</strong> directly overhead at an altitude of<br />
762 m.<br />
Nine observations of the seals'<br />
responses to operating snow machines were<br />
obtained. One seal remained in its lair on<br />
two occasions when snow machines were<br />
operatin 0.5 km distant. Three other seals<br />
departe
Table 2. Ringed seal densities observed along adjacent seismic <strong>and</strong> control transects during<br />
aerial surveys in 1982.<br />
Date<br />
26 May<br />
29 May<br />
30 May<br />
31 May<br />
31 May<br />
1 June<br />
3 June<br />
4 June<br />
Seismic Transects Control Transects<br />
Density Length Density Length<br />
(sealslnm2) (nm) (sealslnm2) (nm) T Test<br />
lairs were noted. In nine cases, the seals<br />
remained in the lairs, including four cases in<br />
which the people approached to within<br />
0.2 km. In 12 cases where the seals<br />
responded by departing, people were<br />
walking 0.1 to 0.6 km from the lairs. In each<br />
of four cases in which a person walked<br />
within 0.1 km, the seal departed from its<br />
lair.<br />
People on skis approached lairs 26<br />
times. Seals remained in lairs during five of<br />
six approaches by skiers to within 0.2 km.<br />
Four departures were observed, one at<br />
0.2 km, two at 0.3 km, <strong>and</strong> one at 0.4 km.<br />
In all instances in which seals departed<br />
lairs in response to noise disturbance, they<br />
subsequently reoccupied the lair. The<br />
breathing holes <strong>and</strong> lairs known to have<br />
been used by the three female seals radio-<br />
tagged in 1982 (SA82, BA82, BE821 were<br />
within an extensive grid of seismic lines that<br />
had been vibrated a few weeks before the<br />
Table 3. Ringed seals radio-tagged in the Beaufort Sea <strong>and</strong> Kotzebue Sound . (After Kelly et al.<br />
1986.)<br />
- -<br />
Age (yrs) First Last Known<br />
Seal indicated Weight Date signal signal minimal<br />
no. Sex by claws (kg) tagged received received no. of lairs
seals were tagged (Figure 2). Each seal<br />
maintained at least one lair <strong>and</strong> one<br />
breathing hole within the grid of seismic<br />
lines. The breathing holes <strong>and</strong> lair access<br />
holes passed through 2 m of ice <strong>and</strong><br />
presumably had been maintained since<br />
freeze up, or shortly thereafter. The<br />
breathing holes ranged from 19 to 129 m<br />
from the nearest seismic line; the lairs<br />
ranged from 250 to 700 m from the nearest<br />
seismic line. All of those structures<br />
remained in active use until at least early<br />
June, approximately two months after the<br />
seismic convoy had left the area.<br />
Of the seals radio-tagged in 1983, three<br />
(two males <strong>and</strong> one female) occupied lairs<br />
within the grid of simulated seismic survey<br />
lines (Figure 2). One of the males (TI83)<br />
tended to haul out late at night in April <strong>and</strong><br />
was never in his lair during the daytime<br />
hours that the seismic convoy operated<br />
(Kelly et al. 1986). The frequency <strong>and</strong><br />
duration of his haulout bouts <strong>and</strong> their<br />
locations showed no significant changes in<br />
relation to the seismic operation.<br />
The second male (GI83) was in his lair<br />
when the seismic equipment approached on<br />
21 April <strong>and</strong> his departure, when the convoy<br />
was 0.64 km distant, was mentioned earlier.<br />
The next signal from him was heard on<br />
23 April when he briefly hauled out at a<br />
different site than the one he departed two<br />
days earlier. Thereafter, five additional<br />
haulout bouts by that seal were recorded, at<br />
least two of them from the lair he departed<br />
in response to the convoy. No signals were<br />
received from his transmitter after 26 April<br />
when he hauled out briefly (less than one<br />
hour). On 17 May, examination of the lair<br />
he had occupied during the seismic survey<br />
indicated its continuing use as a haulout<br />
site, but we were unable to ascertain<br />
whether he or some other seal was using the<br />
lair at that time.<br />
The female (LR83) using the 1983<br />
seismic area was ta ged after the survey<br />
was <strong>com</strong>pleted. Her F our haulout sites were<br />
within the seismic line grid, <strong>and</strong> her birth<br />
lair probably was in use prior to the seismic<br />
survey (Figure 2). She continued to use that<br />
lair as late as 4 June, more than one month<br />
after the survey.<br />
Fate of seal structures in areas of industrial<br />
activity<br />
While lair use by the radio-tagged<br />
seals appeared to be interrupted only briefly<br />
by anthropogenic disturbance, we did<br />
observe cases of ab<strong>and</strong>onment in our<br />
examination of other structures. We found<br />
evidence that the examination by<br />
investigators <strong>and</strong> the activities associated<br />
with seismic profiling <strong>and</strong> gravel isl<strong>and</strong><br />
construction increased the rates of<br />
ab<strong>and</strong>onment. Data on these points were<br />
obtained in 1982 on the shore-fast ice of the<br />
Beaufort Sea.<br />
Of 37 structures that were opened <strong>and</strong><br />
examined when first found, 46% were frozen<br />
or altered when revisited. Another 59<br />
structures were only probed when first<br />
found, <strong>and</strong> 22% of those structures were<br />
frozen or altered when revisited. The<br />
difference in the pro<strong>port</strong>ion of structures<br />
frozen or altered was significant (G = 6.35,<br />
df = 2, p < 0.05).<br />
The fate of 110 structures was<br />
investigated as a function of their distance<br />
from seismic lines <strong>and</strong> a gravel isl<strong>and</strong> <strong>under</strong><br />
construction. Within 150 m of the seismic<br />
lines, 14/48 (29.2%) structures were<br />
ab<strong>and</strong>oned, <strong>com</strong>pared to 4/37 (10.0%) of the<br />
structures beyond 150 m of the same lines.<br />
The difference was statistically significant<br />
(G = 5.53, df = 1,O.Ol < p < 0.025).<br />
Within 8 km of the Seal Isl<strong>and</strong><br />
construction site, the incidence of<br />
ab<strong>and</strong>onment was 8/25 (32.0%), similar to<br />
the rates close to seismic lines. Near the<br />
isl<strong>and</strong> construction site, no differences were<br />
detected in ab<strong>and</strong>onment rates within <strong>and</strong><br />
beyond 150 m of the search lines.<br />
We observed varying rates of<br />
ab<strong>and</strong>onment in over 700 seal structures<br />
examined between 1982 <strong>and</strong> 1987. Our<br />
samples were grouped according to ice type,<br />
the amount of anthropogenic disturbance,<br />
<strong>and</strong> the number of examinations by the<br />
investigators. That breakdown resulted in<br />
the four samples shown in Table 4. They<br />
are; (1) 93 structures from the drifting ice,<br />
not subjected to unnatural noise<br />
disturbance; (2) 471 structures from shore-<br />
fast ice <strong>and</strong> not subject to human<br />
disturbance; (3) 148 structures from shore-<br />
fast ice <strong>and</strong> subjected to "on-ice" industrial<br />
activity; <strong>and</strong> (4) 107 of the above 148<br />
structures after being subjected to two or<br />
more investigator examinations as well as<br />
industrial activities.<br />
On the shore-fast ice with no<br />
significant anthropogenic disturbances<br />
(sample 2), only 4.0% of the structures were
Table 4. Rates of ab<strong>and</strong>onment (freezing of breathing or access holes) of ringed seal structures<br />
in four samples collected between 1982 <strong>and</strong> 1987.<br />
Anthropogenic Number Percent<br />
Sample disturbance N frozen frozen<br />
1. Drifting ice<br />
Chukchi &<br />
Beaufort seas<br />
1984 & 1987<br />
2. Shore-fast ice<br />
Bering, Chukchi,<br />
& Beaufort seas<br />
1983-1987<br />
3. Shore-fast ice<br />
Beaufort Sea<br />
1982<br />
4. Shore-fast ice<br />
Beaufort Sea<br />
1982<br />
None 93 12 12.9%<br />
None<br />
frozen. This represents what we consider to<br />
be the natural rate of ab<strong>and</strong>onment on<br />
shore-fast ice during our study.<br />
Of the structures in the shore-fast ice<br />
that were subjected to industrial noise<br />
(sample 31, 13.5% were ab<strong>and</strong>oned when<br />
first examined. The difference in<br />
ab<strong>and</strong>onment rates between the industrially<br />
disturbed sample (3) <strong>and</strong> the undisturbed<br />
sample (2) was highly significant (X2 =<br />
17.14, df = 1, p < 0.001). In sample 4,<br />
which includes 107 of the structures from<br />
sample 3 that were subjected to multiple<br />
examinations as well as to industrial<br />
activities, the ab<strong>and</strong>onment rate was 32.7%,<br />
indicating a significant increase due to the<br />
investigator's activities (X2 = 12.42, df = 1,<br />
p < 0.001).<br />
Sample 1 includes 93 structures from<br />
the drifting ice <strong>and</strong> is included for<br />
<strong>com</strong>parison with the shore-fast ice samples.<br />
Compared to the latter habitat, the drifting<br />
ice is less stable. Furthermore, a high<br />
pro ortion of ringed seal structures in the<br />
?<br />
dri ting ice are opened by polar bears, a<br />
source of natural disturbance similar to that<br />
of our opening a lair. In the 1987 driftiice<br />
sample, 22/39 (56.4%) of the structures had<br />
been visited by bears, but that pro<strong>port</strong>ion<br />
was biased since the sample was collected<br />
Seismic surveys, 148 20 13.5%<br />
isl<strong>and</strong> building<br />
Seismic surveys, 107 35 32.7%<br />
isl<strong>and</strong> building,<br />
& investigator<br />
examinations<br />
while following bear tracks (Kelly et al.<br />
1987). The 1984 drifting ice sample was<br />
r<strong>and</strong>om, however, <strong>and</strong> of 54 structures in<br />
that sample, nine (16.6%) were visited by<br />
bears. The rate of ab<strong>and</strong>onment of<br />
structures in the drift ice (sample 1) was<br />
12.9%, similar to that found on the shore-<br />
fast ice in 1982 (sample 3). Only one other<br />
sample not subjected to industrial<br />
disturbance showed rates of ab<strong>and</strong>onment<br />
similar to those in the drifting ice. One of<br />
seven undisturbed, shore-fast ice samples<br />
exceeded 5% ab<strong>and</strong>onment. That sample,<br />
collected near Barrow in 1986, had a 12.8%<br />
ab<strong>and</strong>onment rate <strong>and</strong> was associated with a<br />
very high incidence of <strong>arctic</strong> fox activity.<br />
Discussion<br />
The responses of ringed seals to noise<br />
disturbance were quite variable as indicated<br />
by the behavior of radio-tagged seals <strong>and</strong> by<br />
the rates of ab<strong>and</strong>onment of seal structures<br />
near <strong>and</strong> at various distances from human<br />
activities. Some structures remained in<br />
active use despite close proximity to seismic<br />
survey lines, snow machine trails, gravel<br />
isl<strong>and</strong> construction, <strong>and</strong> helicopter flight<br />
paths. Other structures were ab<strong>and</strong>oned<br />
quickly when exposed to noises at greater<br />
distances. That variation probably is due in
part to differences in the noise environment<br />
that are difficult to measure. For example,<br />
helicopter noise is muffled on warm, cloudy,<br />
snowy, or windy days <strong>and</strong> is loudest in clear,<br />
calm, cold <strong>conditions</strong>. A snow machine, or<br />
person on foot or skis, produces different<br />
kinds <strong>and</strong> levels of noise when the snow is<br />
very cold <strong>and</strong> hard or windblown <strong>com</strong>pared<br />
to newly fallen, relatively warm or soft<br />
snow. Snow machines travelling over<br />
smooth ice sound different than those over<br />
rough ice. Also, the seals' sensitivity to<br />
anthropogenic noise may lessen when<br />
background noise, such as from wind-driven<br />
snow or ice movement is high.<br />
In spite of an array of variables not<br />
accounted for, it is apparent that ringed<br />
seals in lairs are aware of sound intrusions,<br />
<strong>and</strong> they generally react to mechanical<br />
conveyances at greater distances than they<br />
do to eople on foot or on skis. The<br />
indivi I ual variation in their reactions,<br />
however, makes it difficult to define<br />
"critical" distances for noise disturbances.<br />
Although we found fewer active seal<br />
structures within 150 m of seismic lines<br />
than beyond that distance, we cannot say<br />
how the rate of ab<strong>and</strong>onment changed<br />
within that range, which was chosen on the<br />
basis of sample size, rather than distance<br />
se. -<br />
Gravel isl<strong>and</strong> construction appeared to<br />
result in displacement of ringed seals at<br />
rates similar to those observed close to<br />
seismic survey lines. Our data suggested<br />
that the radius of disturbance was greater<br />
around Seal Isl<strong>and</strong> when it was <strong>under</strong><br />
construction than was the radius around<br />
seismic exploration, but the data are<br />
insufficient for determining the distance<br />
from the isl<strong>and</strong> at which the incidence of<br />
ab<strong>and</strong>onment began to decrease.<br />
The displacement of some seals within<br />
two hundred meters of seismic lines<br />
probably results in little, if any, increased<br />
mortality since, as we re<strong>port</strong>ed elsewhere<br />
(Kelly 1985; Kelly et al. 1986), individual<br />
seals use more than a single lair <strong>and</strong> as<br />
many as four or five lairs each. Our<br />
telemetric studies indicated that the<br />
distances between lairs used by individual<br />
seals averaged 572 m for females <strong>and</strong> 2,018<br />
m for males (Kelly et al. 1986). We do not<br />
know if mortality would be likely to occur if<br />
individual seals were displaced <strong>com</strong>pletely<br />
from the areas containing all of their lairs.<br />
At the very least, such an event would be<br />
likely to increase intra-specific strife by<br />
forcing displaced seals to use structures<br />
maintained by other seals.<br />
That ringed seals respond to noise<br />
disturbances by fleeing into the water<br />
probably is the result of their subjection to<br />
predation by polar bears <strong>and</strong> <strong>arctic</strong> foxes.<br />
Weddell seals (Levtonychotes weddelli),<br />
which breed on the shore-fast ice of<br />
Ant<strong>arctic</strong>a, have evolved in the absence of<br />
surface predators <strong>and</strong> are much less readily<br />
disturbed (Stirling 1977; Kooyman 1981).<br />
The rates of ringed seal structure<br />
ab<strong>and</strong>onment that we observed in areas of<br />
noise disturbance were more than three<br />
times greater than the overall rates in<br />
undisturbed areas but similar to the rates in<br />
areas of frequent predator activity.<br />
Increasing the frequency with which<br />
ringed seals flee lairs may increase stress<br />
levels <strong>and</strong> energy dem<strong>and</strong>s at times when<br />
rest is im<strong>port</strong>ant to their well-being. Lair<br />
occupation be<strong>com</strong>es increasingly frequent<br />
<strong>and</strong> longer in duration throu hout the<br />
spring months (Kelly et a . 1986),<br />
apparently due to the seals' need to maintain<br />
high epidermal temperatures while<br />
replacing their pelage (Feltz <strong>and</strong> Fay 1966).<br />
Of potentially greater im<strong>port</strong>ance are<br />
the effects of disturbances that cause<br />
structures to be <strong>com</strong>pletely ab<strong>and</strong>oned. That<br />
occurrence would be deleterious especially<br />
for nursing pups. Furthermore, females<br />
with nursing young are more susceptible to<br />
disturbance in lairs by virtue of their more<br />
frequent <strong>and</strong> extended haulout bouts (Kelly<br />
et al. 1986). Short of ab<strong>and</strong>oning a pup,<br />
female seals can take them through the<br />
water to alternate lairs (Smith <strong>and</strong> Stirling<br />
1975; Taugbd 1982). If a newborn pup is<br />
forced into the water, however, it may not<br />
survive the resultant heat loss. At birth,<br />
ringed seal pups do not have the insulating<br />
blubber layer that protects older seals from<br />
excessive heat loss when submerged. Pups<br />
that do survive swimming through the water<br />
to an alternate lair would have to expend<br />
significant amounts of their energy reserves<br />
in order to maintain core temperature while<br />
drying (Taugbd 1982). Those pups would be<br />
easier prey for polar bears <strong>and</strong> <strong>arctic</strong> foxes<br />
<strong>and</strong> would be less able to withst<strong>and</strong> other<br />
stresses.<br />
Our investigation focused on the effects<br />
of noise disturbance on the seals' use of lairs<br />
<strong>and</strong> breathing holes. From our telemetric<br />
studies, we know that seals spend the<br />
majority of the time in the water <strong>under</strong> the<br />
f?
ice (Kelly et al. 1986). Little is known about<br />
their activities <strong>under</strong> the ice, although much<br />
of it must involve feeding <strong>and</strong>, perhaps,<br />
territorial defense. Sound is readily<br />
conducted throu h the ice into the water,<br />
f<br />
<strong>and</strong> the effects o noise disturbance on seals<br />
<strong>under</strong> the ice remains unknown. Recent<br />
experiments with captive ringed seals<br />
suggest that ambient noise provides a<br />
critical navigational cue to seals swimming<br />
<strong>under</strong> ice in total darkness (Wartzok et al.<br />
1987).<br />
Acknowledgements<br />
Much of this work was funded by the<br />
Minerals Management Service, Department<br />
of the Interior through an Interagency<br />
Agreement with the National Oceanic <strong>and</strong><br />
Atmospheric Administration, Department<br />
of Commerce, as art of the Alaskan Outer<br />
Continental Shelf Environmental<br />
Assessment Program. Additional sup<strong>port</strong><br />
was provided by the Department of Wildlife<br />
Management, North Slope Borough,<br />
Barrow, Alaska, <strong>and</strong> the U. S. Fish <strong>and</strong><br />
Wildlife Service. We are grateful to those<br />
organizations <strong>and</strong> to a great many people<br />
who assisted in the field work <strong>and</strong> provided<br />
logistic sup<strong>port</strong>. We learned a great deal<br />
about ringed seals <strong>and</strong> the use of trained<br />
dogs for locating their subnivean structures<br />
from T. Smith <strong>and</strong> M. Hammill of the Arctic<br />
Biological Station, Ste. Anne de Bellevue,<br />
Quebec <strong>and</strong> J. Memorana, Holman, N. W. T.<br />
Personnel of Shell Western E & P, Inc.,<br />
Geophysical Services, Inc., Western<br />
Geophysical Co., Sefel Geophysical Co.,<br />
NANA Regional Corporation, U. S. Coast<br />
Guard - Port Clarence LORAN Station,<br />
711th Aircraft <strong>and</strong> Warning Squadron Radar<br />
Site - Cape Lisburne, Telonics, Inc., <strong>and</strong> the<br />
NOAA Helicopter Corps were extremely<br />
helpful to our efforts.<br />
References<br />
Boas, F. 1888. The central Eskimo. Bur.<br />
Amer. Ethnology, 399-699.<br />
Burns, J. J. <strong>and</strong> Eley, T. J. 1978. The<br />
natural history <strong>and</strong> ecolow of the bearded<br />
seal (~rignathus barbatus) <strong>and</strong> the ringed<br />
seal (Phoca hispidm. Dep. Commer.,<br />
NOMXSEAP Environ. Assess. Alaskan<br />
Continental Shelf, Ann. Rep. Year Ending<br />
March 1978,l: 99-162.<br />
Burns, J. J. <strong>and</strong> Harbo, S. J. 1972. An aerial<br />
census of ringed seals, northern coast of<br />
Alaska. Arctic 25: 279-290.<br />
Burns, J. J. <strong>and</strong> Kelly, B. P. 1982. Studies of<br />
ringed seals in the Alaskan Beaufort Sea<br />
during winter: impacts of seismic<br />
exploration. Unpubl. ann. rep., OCSEAP<br />
Res. Unit 232, to U.S. Dep. Commer.,<br />
NOAA, Off. Mar. Pollut. Assess., Juneau,<br />
Alaska, 57 pp.<br />
Burns, J. J., Kelly, B. P. <strong>and</strong> Frost, K. J.<br />
1981. Studies of ringed seals in the Beaufort<br />
Sea during winter. Executive Summay, 31<br />
October 1981. OCSEAP Res. Unit 232, to<br />
U.S. Dep. Commer., NOAA, Off. Mar. Pollut.<br />
Assess., Juneau, Alaska. 81 pp.<br />
Cox, S. L. <strong>and</strong> Spiess, A. 1980. Dorset<br />
settlement <strong>and</strong> subsistence in northern<br />
Labrador. Arctic 33: 659-669.<br />
Feltz, E. T. <strong>and</strong> Fay, F. H. 1966. Thermal<br />
requirements in of epidermal cells from<br />
seals. CryobioT3: 261-264.<br />
Geraci, J. R. <strong>and</strong> St. Aubin, D. J. 1980.<br />
Offshore petroleum resource development<br />
<strong>and</strong> marine mammals: a review <strong>and</strong><br />
research re<strong>com</strong>mendations. Mar. Fish. Rev.<br />
42: 1-12.<br />
Hall, C. F. 1866. Arctic researches <strong>and</strong> life<br />
among the Esquimaux: being the narrative<br />
of an expedition in search of Sir John<br />
Franklin, in the years 1860,1861, <strong>and</strong> 1862.<br />
Harper <strong>and</strong> Bros. Publ., N. Y., 595 pp.<br />
Kelly, B. P. 1985. Dependence by ringed<br />
seals on subnivean lairs. Sixth Biennial<br />
Conference on the Biology of Marine<br />
Mammals. (Abstract).<br />
Kelly, B. P., Quakenbush, L. <strong>and</strong>. Rose, J. R.<br />
1986. Ringed seal winter ecology <strong>and</strong> effects<br />
of noise disturbance. Final rep., OCSEAP<br />
Res. Unit 232, Part 2, to U.S. Dep. Commer.,<br />
NOAA, Natl. Ocean Serv., Ocean Assess.<br />
Div., Alaska Office, Anchorage, Alaska,<br />
91 PP.<br />
Kelly, B. P., Amstrup, S. C., Gardner, C. <strong>and</strong><br />
Quakenbush, L. T. 1987. Predation on<br />
ringed seals in the western Beaufort Sea.<br />
Seventh Biennial Conference on the Biology<br />
of Marine Mammals, 5-9 December 1987,<br />
Miami, Florida. (Abstract).<br />
Kooyman, G. L. 1981. Weddell seal<br />
(Leptonychotes weddelli Lesson, 1826). 12
"H<strong>and</strong>book of marine mammals" (S. H.<br />
Ridgway <strong>and</strong> R. J. Harrison F.R.S., eds.).<br />
Vol. 2: Seals. Academic Press, London, 275-<br />
296.<br />
Manning, T. H. 1944. Hunting implements<br />
<strong>and</strong> methods of the present-day Eskimos of<br />
north-west Hudson Bay, Melville Peninsula,<br />
<strong>and</strong> south-west Baffin Isl<strong>and</strong>. Geom. J. 103:<br />
10-152.<br />
Mansfield, A. W. 1983. The effects of vessel<br />
traffic in the <strong>arctic</strong> on marine mammals <strong>and</strong><br />
re<strong>com</strong>mendations for future research. Can.<br />
Tech. Rep. Fish. <strong>and</strong> Aquatic Sci. No. 1186.<br />
Ste-Anne-de-Bellevue, Quebec, 97 pp.<br />
McLaren, I. A. 1958a. The economics of<br />
seals in the eastern Canadian <strong>arctic</strong>. Fish.<br />
Res. Board Can. Circ. 1,93 pp.<br />
McLaren, I. A. 1958b. The biology of the<br />
ringed seal (Phoca hispida Schreber) in the<br />
eastern Canadian <strong>arctic</strong>. Fish. Res. Board<br />
Can. Bull. 118: 97 pp.<br />
Norris, K. S. 1981. Marine mammals of the<br />
<strong>arctic</strong>, their sounds <strong>and</strong> their relation to<br />
alterations in the acoustic environment by<br />
man-made noise. In "The question of sound<br />
from icebreaker operations: the proceedings<br />
of a workshop February 23-24, 1981",<br />
Toronto, Ontario (N. M. Peterson, ed.).<br />
Arctic Pilot Proj., Petro-Canada, Calgary,<br />
Alberta, 304-309.<br />
Rausch, R. L. 1973. Post mortem findings<br />
in some marine mammals following the<br />
Cannikin test on Amchitka Isl<strong>and</strong>. Ms.<br />
Atomic Energy Comm., Las Vegas, Nev.<br />
86 PP.<br />
Ronald, K. <strong>and</strong> Dougan, J. L. 1982. The ice<br />
lover: biology of the harp seal (Phoca<br />
groenl<strong>and</strong>ica). Science 215: 928-933.<br />
Schusterman, R. J. <strong>and</strong> Moore, P. W. B.<br />
1980. Noise disturbance <strong>and</strong> audibility in<br />
innipeds. J. Acoust. Soc. Am. 70, Suppl. 1,<br />
583.<br />
Smith, T. G. 1976. Predation of ringed seal<br />
pups (Phoca his ida) by the <strong>arctic</strong> fox<br />
(Alopex lagopu*n. J. Zool. 54: 1610-<br />
1616.<br />
Smith,<br />
+<br />
T. G. 1987. The ringed seal, Phoca<br />
his ida, of the Canadian western Arctic.<br />
an. Bull. Fish. <strong>and</strong> Aquat. Sci. 216.<br />
Ottawa, 81 pp.<br />
Smith, T. G. <strong>and</strong> Stirling, I. 1975. The<br />
breeding habitat of the ringed seal (Phoca<br />
hispida). The birth lair <strong>and</strong> associated<br />
structures. Can. J. Zool. 53: 1297-1305.<br />
Stefansson, V. 1913. My life with the<br />
Eskimos. MacMillan Co., New York, 538 pp.<br />
Stewart, B. S. 1981. Behavioral response of<br />
northern elephant seals <strong>and</strong> California sea<br />
lions on San Nicolas Isl<strong>and</strong>. California. to<br />
loud impulse noise. J. ~cbust. Soc. Am.<br />
Suppl. 1, Vol. 70, S84.<br />
Stirling, I. 1977. Adaptations of Weddell<br />
<strong>and</strong> ringed seals to exploit the polar fast ice<br />
habitat in the absence or presence of surface<br />
predators. In "Adaptations within ant<strong>arctic</strong><br />
ecos stems" (G. A. Llano, ed.). Proceedings<br />
of the Third Symposium on Ant<strong>arctic</strong><br />
Biology. Gulf Publishing Co., Houston,<br />
Texas, 741-748. 1252 pp.<br />
Taugb01, G. 1982. Ringed seal<br />
thermoregulation, energy balance <strong>and</strong><br />
development in early life, a study on P s<br />
hispida in Kongsfj., Svalbard. Unpubl.<br />
thesis, 102 pp. (Transl. from Norwegian by<br />
Can. Fish. Aquat. Sci., No. 5090, 1984,<br />
109 pp.)<br />
Wartzok, D., Elsner, R., Kelly, B. P.,<br />
Mimken, G. <strong>and</strong> Quakenbush, L. T.. 1987.<br />
Visual, acoustic, <strong>and</strong> vibrissal contributions<br />
to <strong>under</strong>-ice navigation by ringed seals,<br />
Phoca his ida. Seventh Biennial Conference<br />
of Marine Mammals, 5-9<br />
December 1987, Miami, Florida. (Abstract).<br />
Wenzel, G. 1984. Archaeological evidence<br />
for prehistoric Inuit use of the sea-ice<br />
environment. In "Sikumiut: the people who<br />
use sea ice" (A. Cooke <strong>and</strong> E. V. Alstine,<br />
eds.). Canadian Arctic Resources<br />
Committee, Ottawa, 41-59. 153 pp.
Abstract<br />
RESPONSES OF MIGRATING NARWHAL AND BELUGA<br />
TO ICEBREAKER TRAFFIC AT THE ADMIRALTY INLET ICE-EDGE,<br />
N.W.T. IN 1986<br />
A mobile ice-based camp was<br />
maintained at the mouth of Admiralty<br />
Inlet from 22 May to 10 July 1986.<br />
Aerial surveys of migrating whales<br />
were flown, using a Bell 206 Jet<br />
Ranger helicopter, both when ships<br />
were absent from the ice-edge <strong>and</strong><br />
whales were presumed to be undisturbed<br />
<strong>and</strong> when ships were in the vicinity of<br />
the ice-edge. Numbers, distribution<br />
<strong>and</strong> behaviour of both narwhal <strong>and</strong><br />
beluga were recorded. Data indicated<br />
that day-to-day variation in numbers<br />
<strong>and</strong> distribution of both species was<br />
substantial, making assessment of the<br />
effects of ship traffic <strong>and</strong> assocl-.zed<br />
noise on numbers difficult. Observa-<br />
tion of undisturbed whales indicated<br />
that migratory patterns, group size<br />
<strong>and</strong> general activity of narwhal dif-<br />
fered significantly from those of bel-<br />
uga. In the presence of ship traffic<br />
beluga showed an increase in non-<br />
directed movement, a decline in<br />
directed movement <strong>and</strong> a decline in<br />
inactivity. Narwhal showed no change<br />
in non-directed movement, an increase<br />
in slow directed movement <strong>and</strong> a slight<br />
This is a reviewed <strong>and</strong> edited version of a paper<br />
presented at the Ninth International Conference on Port<br />
<strong>and</strong> Ocean Engineering Under Arctic Conditions, Fair-<br />
banks, Alaska, USA, August 17-22, 1987.<br />
Susan E. Cosens<br />
Larry P. Dueck<br />
Fisheries <strong>and</strong> Oceans, Winnipeg, Manitoba, CANADA<br />
decline in inactivity. Changes in<br />
group structure <strong>and</strong> orientation in re-<br />
sponse to ship traffic also differed<br />
between the two species. Overall, re-<br />
actions of both species appeared to be<br />
less pronounced than was described in<br />
a previous study. This difference may<br />
be attributable to differences in ice<br />
<strong>conditions</strong>.<br />
Introduction<br />
As a result of recent interest<br />
in developing resources in the Arctic,<br />
there is concern that disturbance by<br />
shipping traffic <strong>and</strong> other industrial<br />
activity may have detrimental effects<br />
on marine mammal populations (see<br />
Mansfield 1983). Both industry <strong>and</strong><br />
government have directed effort to ad-<br />
dress these concerns. Most of the re-<br />
search has taken place in the Beaufort<br />
Sea area where exploration for hydro-<br />
carbons, including seismic <strong>and</strong> drill-<br />
ing operations, has been most inten-<br />
sive. Research has focussed on large<br />
cetaceans, such as the bowhead whale<br />
(Balaena mysticetus) (eg. Ljungblad et<br />
al. 1985; Richardson 1985; Richardson<br />
et al. 1985). The beluga whale<br />
(Delphinapterus leucas) has also been<br />
the subject of similar studies in the<br />
western Arctic (see Ford 1977; Fraker<br />
1983).
Exploration for hydrocarbons in<br />
the eastern Arctic has been limited<br />
but other industrial activities, in-<br />
cluding mining, have required the use<br />
of icebreakers <strong>and</strong> tankers in the<br />
Northwest Passage. The Arvik <strong>and</strong> Nan-<br />
asivik mines, for example, send ship-<br />
ments of ore to Europe each summer.<br />
Government <strong>and</strong> industry have cooperat-<br />
ed in efforts to extend the shipping<br />
season in the eastern Arctic by bring-<br />
ing the icebreaking tanker MV Arctic<br />
to Nanasivik at the north end of<br />
Baffin Isl<strong>and</strong>, Northwest Territories,<br />
during the fast ice season. More<br />
effort has been directed toward bring-<br />
ing the ship in before break-up rather<br />
than during the winter freeze-up per-<br />
iod.<br />
Early shipping raises potential<br />
problems of interference with cetacean<br />
migrations through Lancaster Sound.<br />
In 1982, a study of responses of nar-<br />
whal (Monodon monoceros) <strong>and</strong> beluga to<br />
icebreaker traffic was begun by LGL at<br />
the Admiralty Inlet ice edge. At that<br />
time, the MV- Arctic, accoipanied by a<br />
Canadian Coastguard icebreaker, was<br />
making one round trip through the fast<br />
ice of Admiralty Inlet at the end of<br />
June, about the time that the odonto-<br />
cete migration begins to peak. Re-<br />
sults from this study indicated that<br />
(1) odontocetes moved away from loca-<br />
tions where icebreakers were generat-<br />
ing noise, (2) initial avoidance re-<br />
sponses occurred when ships were over<br />
40 km from the ice edge <strong>and</strong> (3) beluga<br />
<strong>and</strong> narwhal were behaviourally differ-<br />
ent in their responses to icebreaker<br />
disturbance.<br />
Intending to exp<strong>and</strong> the work<br />
that LGL conducted, we began our study<br />
in 1986. We intended to monitor odon-<br />
tocete migration patterns over a long-<br />
er period of time than had been done<br />
previously, <strong>and</strong> to <strong>com</strong>pare non-<br />
disturbance with disturbance pat-<br />
terns. We wanted to quantify be-<br />
haviour patterns of both beluga <strong>and</strong><br />
narwhal such that statistical <strong>com</strong>pari-<br />
sons of behaviour between species <strong>and</strong><br />
between disturbance <strong>conditions</strong> could<br />
be made. We conducted 27 helicopter<br />
surveys between 22 May <strong>and</strong> 6 July <strong>and</strong><br />
collected data on the behaviour of<br />
beluga <strong>and</strong> narwhal during two passages<br />
of a single ship <strong>and</strong> one passage of<br />
two ships through the fast ice. This<br />
paper summarizes the data on numbers,<br />
distribution, activity <strong>and</strong> orientation<br />
collected during these surveys.<br />
Materials <strong>and</strong> Methods<br />
We established a mobile ice-<br />
based camp at the mouth of Admiralty<br />
Inlet (73O45'N 84'05'W) on 22 May <strong>and</strong><br />
conducted aerial surveys from 24 May<br />
to 6 July. Our surveys included three<br />
observers in a Bell 206 Jet Ranger<br />
helicopter that flew at an altitude of<br />
about 230 m <strong>and</strong> a speed of about 160<br />
km/hour. We planned to proceed east<br />
from our camp along the floe edge to<br />
Navy Board Inlet, north until we were<br />
several kilometres from the floe edge,<br />
west to Cape Crauford, then return to<br />
camp. This flight path would have<br />
covered the mouth of Admiralty Inlet<br />
both close to <strong>and</strong> several kilometers<br />
from the shear line. Actual flight<br />
paths were variable (Fig. 1). Pack<br />
ice was heavy, <strong>and</strong> our survey route<br />
usually followed open leads which were<br />
irregular in distribution. We fre-<br />
quently made return flights halfway or<br />
more across Lancaster Sound, following<br />
the edge of the pack ice. Occasional-<br />
ly, Lancaster Sound was <strong>com</strong>pletely<br />
covered in pack ice so large areas of<br />
open water were infrequently encount-<br />
ered. There was no l<strong>and</strong>-fast ice edge<br />
across Lancaster Sound in 1986, thus<br />
our westerly flights were limited only<br />
by fuel requirements.<br />
Whales observed within a 250 m<br />
strip on either side of the helicopter<br />
were identified to species, counted<br />
<strong>and</strong>, when possible, classed to sex <strong>and</strong><br />
gross age (adult, sub-adult, new-<br />
born). Their ongoing behaviour,<br />
orientation <strong>and</strong> general movement speed<br />
was noted. We also recorded ice con-<br />
ditions by estimating % ice cover<br />
within the 500 m survey strip. Chang-<br />
es in ice <strong>conditions</strong>, helicopter alti-<br />
tude, flight speed <strong>and</strong> bearing were<br />
recorded on cassette recorders.<br />
Ongoing behaviour was classified<br />
into four categories: (1) directed<br />
movement - whales maintained constant
Lancaster<br />
Sound<br />
Figure 1. a) A survey made on 10 June<br />
that followed our preferred flight<br />
path. b) A survey made on 25 May that<br />
deviated from our preferred flight<br />
path. Hatched areas represent l<strong>and</strong><br />
fast ice.<br />
direction during swimming movements,<br />
(2) circling - whales changed the di-<br />
rection in which they were swimming,<br />
(3) deep dive - whales disappeared<br />
from view after a dive, 4) resting -<br />
whales remained stationary showing no<br />
lo<strong>com</strong>otory behaviour. The latter cat-<br />
egory was further classified by noting<br />
location of whales relative to the<br />
water surface: (1) back exposed -<br />
backs breaking the water surface, (2)<br />
hanging - body totally submersed below<br />
the water surface.<br />
We estimated the bearing of<br />
sighted whales relative to true<br />
north. Orientation relative to ships<br />
present in the survey area during dis-<br />
turbance surveys were calculated later<br />
in the laboratory. Movement speed of<br />
whales was classified either as slow<br />
or moderate to fast. Fast-moving<br />
whales exhibited more vigorous fluke<br />
strokes <strong>and</strong> raised more of their backs<br />
above the water than did slow-moving<br />
whales. Fast movement was always di-<br />
rected <strong>and</strong> often synchronous within<br />
the group.<br />
We conducted surveys during non-<br />
disturbance periods at various times<br />
of day to determine whether there was<br />
any evidence of diurnal variation in<br />
behaviour <strong>and</strong> to control for differen-<br />
ces in time of day between disturbance<br />
<strong>and</strong> non-disturbance surveys (Table<br />
1). We could not predict when ships<br />
would arrive at the ice edge, but were<br />
able to increase the chances that con-<br />
trol <strong>and</strong> disturbance surveys would be<br />
done at <strong>com</strong>parable times of day.<br />
We used the Canadian Tide <strong>and</strong><br />
Current Tables, with Dundas Harbour on<br />
Devon Isl<strong>and</strong> (Fig. 1) as our point of<br />
Table 1. Distribution of control <strong>and</strong><br />
disturbance surveys relative to time<br />
of day.<br />
Time Number of Surveys<br />
Control Disturbance<br />
(no ship) (ship)
eference, to determine the tide state<br />
for each survey (Table 2).<br />
Weather <strong>conditions</strong> were recorded<br />
at least twice daily. We used a h<strong>and</strong><br />
held anemometer to record wind speed<br />
<strong>and</strong> a sling psychrometer to record dry<br />
bulb temperature. During surveys we<br />
noted obstructions to visibility of<br />
whales including fog, light snow <strong>and</strong><br />
sea state <strong>conditions</strong>.<br />
We used a rather broad defini-<br />
tion of disturbance by including ships<br />
within 130 km of the floe edge. Given<br />
that whales were expected to occur<br />
throughout Lancaster Sound during a<br />
ship passage, we did not want to ex-<br />
clude the possibility that disturbed<br />
whales might move ahead of the ship as<br />
it travelled eastward toward Admiralty<br />
Inlet. We conducted 16 control sur-<br />
veys where ships were not active in<br />
the vicinity of the Admiralty Inlet<br />
ice edge <strong>and</strong> 11 disturbance surveys<br />
Table 2. Number of surveys conducted<br />
during different types of tidal activ-<br />
ity. Note that more control than dis-<br />
turbance surveys were conducted during<br />
ebb tides.<br />
Rising High Ebb Low<br />
Nondist. 2 3 7 4<br />
Dist. 3 4 2 2<br />
when ships were either moving through<br />
Lancaster Sound or the fast ice of<br />
Admiralty Inlet (Table 3). We main-<br />
tained radio contact with both the =<br />
-<br />
des Grosseliers <strong>and</strong> the MV Arctic <strong>and</strong><br />
were able to obtain updates of ship<br />
positions at the time of our surveys.<br />
Table 3. Approximate ship positions during disturbance surveys conducted at Admiralty<br />
Inlet during 1986.<br />
Survey Date Identification Ship Location Activity<br />
--<br />
11<br />
12<br />
3 June<br />
4 June<br />
MV Arctic<br />
--<br />
CCG des Grosseliers<br />
MV Arctic<br />
moving west<br />
moving<br />
icebreaking through<br />
floe edge<br />
13<br />
14<br />
17<br />
18*<br />
2 3<br />
6 June<br />
8 June<br />
11 June<br />
12 June<br />
25 June<br />
--<br />
MV Arctic<br />
--<br />
CCG des Grosseliers<br />
--<br />
MV Arctic<br />
CCG -- des Grosseliers<br />
--<br />
CCG des Grosseliers<br />
icebreaking<br />
moving south<br />
stationary<br />
returning - moving north<br />
along ship track<br />
moving west<br />
icebreaking through<br />
floe edge<br />
24<br />
Lady Franklin<br />
27 June --<br />
CCG des Grosseliers<br />
Lady Franklin<br />
73'19'N 85'24'W<br />
as above<br />
following<br />
icebreaking moving south<br />
following<br />
2 5<br />
26<br />
27<br />
2 July<br />
3 July<br />
6 July<br />
--<br />
CCG des Grosseliers 74O26'N 82O38'W moving east<br />
--<br />
MV Arctic<br />
73'42'N 84'43'W icebreaking through<br />
floe edge<br />
-- MV Arctic<br />
returning - moving north<br />
through floe edge<br />
- - - - - --<br />
*MV Arctic at mouth of Lancaster Sound.
Results<br />
Aerial survey <strong>conditions</strong><br />
Weather <strong>conditions</strong> were similar<br />
for both control <strong>and</strong> disturbance sur-<br />
veys. No significant differences<br />
occurred in dry bulb air temperature,<br />
wind speed, wind direction or minimum<br />
visibility (Table 4). Sea state,<br />
estimated on the Beaufort Scale,<br />
ranged from5 to 4 during control sur-<br />
veys <strong>and</strong> 0-3 during disturbance sur-<br />
veys. One possible source of differ-<br />
Table 4. Summary of weather <strong>conditions</strong><br />
during 16 control <strong>and</strong> 11 nondisturbance<br />
surveys. -<br />
Survey Type<br />
(0<br />
*<br />
i2 I,<br />
Control Disturbance<br />
Temperature<br />
( OC) -1.6 3.8 +0.8 2.1<br />
Wind dir O<br />
220 89.4 243 124.0<br />
Wind speed<br />
(kn) 7.5 5.5 4.1 3.3<br />
Minimum<br />
visibility<br />
(km) 20.7 8.2 16.2 5.8<br />
ence between control <strong>and</strong> disturbance<br />
surveys was the relatively larger num-<br />
ber of non-disturbance surveys (Table<br />
2) done during ebb tides. Control <strong>and</strong><br />
disturbance surveys also differed sig-<br />
nif icantly (x =904.6, df=4, p
veys <strong>com</strong>pared to 1182 during disturb-<br />
ance surveys. This was equivalent to<br />
averages of 32 (SD=32.1) <strong>and</strong> 107<br />
(SD=211.1) narwhal/survey seen during<br />
control <strong>and</strong> disturbance periods re-<br />
spectively.<br />
May June July<br />
Survey Date<br />
Figure 3. Abundance of migrating nar-<br />
whal seen during control surveys (c)<br />
<strong>and</strong> disturbance surveys (d).<br />
Beluga were seen less regularly<br />
<strong>and</strong> occurred in fewer numbers than did<br />
narwhal (Fig. 4). The largest number<br />
of beluga found during any given sur-<br />
vey was 109, seen on 9 June, when the<br />
peak in numbers was recorded. We saw<br />
259 beluga in total during non-<br />
disturbance <strong>and</strong> 198 during disturbance<br />
surveys, or averages of 16 (SD=27.5)<br />
<strong>and</strong> 18 (SD=30.2) beluga/survey respec-<br />
tively.<br />
Narwhal were absent from only<br />
two surveys, neither of which were<br />
disturbance surveys. Beluga were absent<br />
during 5 of 16 non-disturbance<br />
surveys <strong>and</strong> during 7 of 11 disturbance<br />
surveys. T is difference was not sig-<br />
9<br />
nificant (x = 2.74, df=l, p>.05). On<br />
five of the seven disturbance surveys<br />
when beluga were absent, the ship was<br />
Narwhal were seen in more open water<br />
during disturbance than during non-<br />
disturbance surveys.<br />
Beluga distribu on also dif-<br />
^-<br />
fered significantly (x = 46.4, de4,<br />
p
Table 6. Percentages of migrating narwhal <strong>and</strong> beluga involved in different activities<br />
during control <strong>and</strong> disturbance surveys.<br />
Activity*<br />
% Narwhal % Beluga<br />
Control Disturbance Control Disturbance<br />
Directed movement 34 30 3 6 2 1<br />
Slow directed movement 16 2 6 38 39<br />
Back exposed 2 4 25 2
fairly evenly among other directions.<br />
Orientation differed significantly<br />
from r<strong>and</strong>om (x = 278.6, df=6,<br />
p
of ships. We would predict signifi-<br />
cant correlations between independent<br />
variables <strong>and</strong> survey date, if this al-<br />
ternate hypothesis is a likely expla-<br />
nation. Related to survey date for<br />
narwhal is numbers of whales observed,<br />
where the last three disturbance sur-<br />
veys produced the most whales. The<br />
last survey found 714 narwhal, an<br />
order of magnitude more than any num-<br />
ber seen in a non-disturbance survey.<br />
It is possible that some of the obser-<br />
ved behavioural changes could be att-<br />
ributable to the sheer number of nar-<br />
whal in the area as a consequence of<br />
interactions among groups or individ-<br />
uals. We would predict correlations<br />
between behaviour <strong>and</strong> total numbers<br />
seen, if this factor is im<strong>port</strong>ant.<br />
A third potentially confounding<br />
variable wa.s ice cover. By the time<br />
the last disturbance surveys were<br />
done, the pack ice was much reduced<br />
<strong>and</strong> open water predominated. Non-dis-<br />
turbance surveys were generally con-<br />
ducted wher. ice cover was heavy. Sig-<br />
nificant associations between depend-<br />
ent variables <strong>and</strong> ice cover would sug-<br />
gest that variation in ice cover could<br />
explain observed results.<br />
The fourth alternate hypothesis<br />
is that differences in time of day be-<br />
tween non-disturbance <strong>and</strong> disturbance<br />
surveys can explain observed results.<br />
This possibility results from the un-<br />
even distribution of surveys across<br />
time of day. The problem arises from<br />
the time period 10:OO-14:OO where 6<br />
control surveys but only 1 disturbance<br />
survey were conducted. Other time<br />
periods were more evenly sampled. To<br />
test for the effect of sampling bias,<br />
correlational analyses were again<br />
used.<br />
We did not consider tides to be<br />
a confounding variable for narwhal.<br />
Although control surveys sampled more<br />
ebb tides than did disturbance sur-<br />
veys, two of these control surveys did<br />
not locate any narwhal. Surveys from<br />
which we had behavioural data were re-<br />
latively evenly distributed across<br />
tides. Sampling for beluga was less<br />
easy to control. Non-disturbance sur-<br />
veys where beluga were actually seen<br />
were mainly done during ebb <strong>and</strong> low<br />
tides. This was not the case during<br />
disturbance surveys where only one<br />
survey was done during an ebb tide.<br />
The lower number of disturbance sur-<br />
veys <strong>and</strong> the absence of beluga from<br />
many of these surveys resulted in sam-<br />
pling bias. Behavioural differences<br />
in beluga across treatments might be<br />
attributable to tides. A difference<br />
in means across tidal categories in<br />
non-disturbance surveys would suggest<br />
that this variable cannot be ruled out<br />
as a factor contributing to differenc-<br />
es between control <strong>and</strong> disturbance<br />
surveys. Our samples, however, were<br />
too few to do such a <strong>com</strong>parison in a<br />
meaningful way.<br />
Group size of narwhal<br />
The correlation between mean<br />
group size <strong>and</strong> survey date was not<br />
significant during control surveys<br />
(r,, = .09, N = 14, p>.05), but was<br />
significant <strong>and</strong> positive during dis-<br />
turbance surveys (r = .69, N = 11,<br />
p
off at 4 whales (Fig. 5). We do not<br />
know whether this trend also occurs<br />
during non-disturbance <strong>conditions</strong>.<br />
Total numbers cannot, therefore, be<br />
ruled out as a factor contributing to<br />
differences in mean group size between<br />
control <strong>and</strong> disturbance surveys.<br />
Total Narwhal<br />
Figure 5. Relationship between mean<br />
group size <strong>and</strong> total numbers of nar-<br />
whal during control (c) <strong>and</strong> distur-<br />
bance (d) surveys.<br />
Mean group size did not vary<br />
with time of day, thus time of day ef-<br />
fects did not contribute to observed<br />
differences in mean group size between<br />
treatment groups. We also <strong>com</strong>pared<br />
group size in different categories of<br />
ice cover <strong>and</strong> found no significant as-<br />
sociation between group size <strong>and</strong> % ice<br />
cover. Variation in ice cover was<br />
therefore not a contributing factor to<br />
variation in mean group size across<br />
treatments.<br />
Distribution relative to ice cover<br />
Significant differences in dis-<br />
tribution of both narwhal <strong>and</strong> beluga<br />
relative to ice cover were found be-<br />
tween control <strong>and</strong> disturbance sur-<br />
veys. These changes in distribution<br />
resulted in narwhal being found in<br />
more open water <strong>and</strong> beluga in less<br />
open water during disturbance than<br />
during control surveys. Seasonal<br />
changes in ice alone do not explain<br />
observed variation in whale distribu-<br />
tion because the distribution of<br />
whales was not r<strong>and</strong>om relative to ice<br />
cover. Whales may change their habi-<br />
tat preferences during the course of<br />
the migratory period, but this hypo-<br />
thesis cannot be tested with the pre-<br />
sent data.<br />
General activity<br />
Both narwhal <strong>and</strong> beluga showed<br />
behavioural differences between con-<br />
trol <strong>and</strong> disturbance surveys. Narwhal<br />
activity did not vary significantly<br />
with survey date nor time of day in<br />
either treatment category. There is<br />
no indication that behaviour varied<br />
with ice type during non-disturbance<br />
surveys, but during disturbance sur-<br />
veys, the pro<strong>port</strong>ion of narwhal engag-<br />
ed in directed movement is somewhat<br />
lower than predicted <strong>and</strong> back exposed<br />
is somewhat higher than predicted in<br />
40 to 80% ice than in other ice types<br />
(Table 8). The percentage of narwhal<br />
for which behaviour was unknown was<br />
also higher for these categories.<br />
Data are really too limited to indi-<br />
cate anything stronger than a trend at<br />
this time.<br />
Table 8. Percent of narwhal showing<br />
directed movement (all DM) <strong>and</strong> back<br />
exposed (BE) behaviour relative to ice<br />
type.<br />
Ice Class Control Disturbance<br />
All DM BE Unkn. All DM BE Unkn.<br />
* During disturbance surveys, no nar-<br />
whal were seen in 20-40% ice cover.
Behavioural activity of narwhal<br />
was <strong>com</strong>pared with total numbers of in-<br />
dividuals seen. For slow directed<br />
movement, there was a significant pos-<br />
itive correlation (r=.65, N=14, p
Although our data were not suf-<br />
ficient to be conclusive, they do sug-<br />
gest that beluga abundance on the<br />
study area depended on ship traffic.<br />
Their absence during most of the dis-<br />
turbance surveys would indicate the<br />
beluga are more likely than are nar-<br />
ance. Finley <strong>and</strong> Davis (1984) state<br />
that beluga moved further away <strong>and</strong> re-<br />
mained away from the disturbance area<br />
longer than did narwhal. Our results<br />
are consistent with these observa-<br />
tions.<br />
Beluga showed no significant<br />
variation in mean group size between<br />
control <strong>and</strong> disturbance surveys. Of<br />
course, the low numbers seen during<br />
disturbance surveys makes <strong>com</strong>parison<br />
difficult but we cannot, at the pre-<br />
sent time, suggest that group size was<br />
affected by disturbance from vessel<br />
activity. Barber <strong>and</strong> Hochheim (1986)<br />
conducted a photographic survey from a<br />
Twin Otter aircraft along the<br />
Admiralty Inlet floe edge during a<br />
disturbance period. They located 5<br />
groups of beluga containing 3-6 ani-<br />
mals. Only 8% of beluga were seen as<br />
solitary individuals. Although this<br />
percentage was much smaller than ours,<br />
the upper limit of 38 beluga in one<br />
group was similar to our value of 32.<br />
They also found, consistent with our<br />
observations, that narwhal gr ups ty-<br />
pically did not contain largelnumbers<br />
of individuals. They recorde a maxi-<br />
m of 7 narwhal in one group?<br />
From photographs, ~arber <strong>and</strong><br />
Hochheim (1986) were able to measure<br />
group densities (number of whaleslm )<br />
<strong>and</strong> found that narwhal tend d to form<br />
more <strong>com</strong>pact (.09 whaleslm , SD=.06,<br />
N=6 groups) than did beluga (-05<br />
whaleslm , SD=.09, N=9 groups). More<br />
data are needed to verify that differ-<br />
ences between species are statistical-<br />
ly significant <strong>and</strong> to determine whe-<br />
ther group cohesiveness varies with<br />
disturbance level.<br />
Changes in mean group size of<br />
narwhal were clearly correlated with<br />
changes in total numbers of narwhal<br />
seen. Although we do not claim to<br />
have seen every narwhal in the study<br />
area, we expect that our data are in-<br />
dicative of relative numbers. The<br />
?<br />
correlation between group size <strong>and</strong><br />
numbers suggests that narwhal may be<br />
aggregating when they can locate other<br />
narwhal. It would be valuable to <strong>com</strong>-<br />
plete the data set on undisturbed nar-<br />
whal to see if the curve reaches the<br />
same plateau at 4 individuals. If<br />
shipping noise reduces the ability of<br />
narwhal to locate one another, then we<br />
would expect the control group to pro-<br />
duce a larger mean group size when<br />
large numbers of narwhal are present,<br />
than does the treatment group. In e-<br />
ffect, we would expect the maximum<br />
mean group size to be greater than<br />
four. Alternatively, in the face of a<br />
reduced signallnoise ratio, narwhal<br />
might tend to clump more closely, to<br />
counteract the effect of a reduced<br />
signal range. We cannot presently re-<br />
ject the null hypothesis, that ship-<br />
ping traffic has no effect on mean<br />
group size.<br />
Our data on activity patterns<br />
during non-disturbance periods gener-<br />
ally agree with observations made by<br />
Finley et al. (1984). They found that<br />
90% of beluga in pre-disturbance sur-<br />
veys were engaged in directed move-<br />
ment, <strong>and</strong> that narwhal tended to be<br />
more often engaged (19%) in other<br />
types of activities. Our pro<strong>port</strong>ions<br />
were not as high, but we did find that<br />
more beluga (76%) were involved in<br />
directed movement than were narwhal<br />
(50%).<br />
Because of poor weather, Finley<br />
et al. (1984) were unable to collect<br />
equivalent aerial survey data on be-<br />
haviour during the approach of the<br />
ship. They did do observations from<br />
the ice but did not quantify behaviour<br />
during disturbance periods. Their ob-<br />
servations suggest that beluga re-<br />
sponded to ship activity by rapid<br />
directed movement whereas narwhal<br />
tended to sink beneath the water sur-<br />
face, lie quietly near the floe edge,<br />
moving out of the area only slowly.<br />
Our results from disturbance periods<br />
do not agree with those of Finley et<br />
al. However, the <strong>com</strong>parison is limit-<br />
ed by the different methods of data<br />
collection <strong>and</strong> our small sample of<br />
disturbed beluga. Our data suggest<br />
that directed movement by beluga de-<br />
clined, that circling increased; <strong>and</strong>
that slow directed movement by narwhal the habituation hypothesis. However,<br />
increased. the critical test, as described ear-<br />
Her, has yet to be made.<br />
Our results do, however, confirm<br />
that beluga <strong>and</strong> narwhal behave differ-<br />
ently <strong>under</strong> normal <strong>conditions</strong> <strong>and</strong> re-<br />
spond differently to disturbance by<br />
ship traffic. Our observations sug-<br />
gest that responses were less intense<br />
in 1986 than they were in 1982 to<br />
1984. Again, there are several possi-<br />
ble explanations: 1) both narwhal <strong>and</strong><br />
beluga have been exposed to shipping<br />
in Lancaster Sound, <strong>and</strong> are beginning<br />
to habituate, 2) the presence of heavy<br />
pack ice provided cover <strong>and</strong> the lack<br />
of l<strong>and</strong> fast ice across Lancaster<br />
Sound enabled easy escape by disturbed<br />
whales, thus responses to ship<br />
approach were less intense than when<br />
whales were trapped against ice in<br />
relatively open water. Ice <strong>conditions</strong><br />
might also explain apparent differenc-<br />
es in non-disturbance behaviour pat-<br />
terns between the two studies. These<br />
hypotheses could easily be tested by<br />
monitoring responses to ship passage<br />
<strong>under</strong> ice <strong>conditions</strong> more typical of<br />
1982-84 than 1986.<br />
The differences in distribution<br />
by ice type between control <strong>and</strong> dis-<br />
turbance surveys may or may not be re-<br />
lated to disturbance by ship traffic.<br />
It is possible that habitat preferenc-<br />
es change over the migratory period.<br />
Further observations of undisturbed<br />
whales are necessary to clarify this<br />
question.<br />
Our data on orientation are con-<br />
sistent with those of Finley et al.<br />
(1983, 1984) <strong>and</strong> Miller <strong>and</strong> Davis<br />
(1984) in that most whales avoided the<br />
ship. Our results also sup<strong>port</strong> their<br />
observation that responses to ships<br />
begin to occur when vessels are 45 to<br />
60 km away. Narwhal <strong>and</strong> possibly bel-<br />
uga showed large changes in orienta-<br />
tion relative to the ship when it was<br />
nearer than 50 km. This suggests that<br />
habituation may not be occurring. One<br />
would expect whales to react at a<br />
closer proximity if they were getting<br />
used to vessel activity. This does<br />
not appear to be the case, although<br />
reactions seem to be less intense than<br />
have been previously observed. The<br />
orientation data favour rejection of<br />
Barber <strong>and</strong> Hochheim (1986) re-<br />
corded orientations of photographed<br />
whales relative to a ship <strong>and</strong> found<br />
that beluga were less variable in<br />
their orientation, <strong>and</strong> appeared to be<br />
more directed in their movements away<br />
from the ship than were narwhal.<br />
These results are again consistent<br />
with Finley <strong>and</strong> Davis (1984). Thus,<br />
it appears that beluga are more in-<br />
clined than narwhal to vacate an area<br />
of disturbance. This does not sug-<br />
gest, however, that narwhal are less<br />
disturbed by vessel activity. The<br />
two species are behaviourally dif-<br />
ferent, even during the spring migra-<br />
tory period, <strong>and</strong> interspecific differ-<br />
ences include reactions to disturbance<br />
by vessel traffic.<br />
Acknowledgements<br />
Research funds were provided<br />
through the Northern Oil <strong>and</strong> Gas<br />
Action Program (NOGAP). Additional,<br />
much appreciated field sup<strong>port</strong> was<br />
provided by the Polar Continental<br />
Shelf Program in Resolute Bay, N.W.T.<br />
We also thank Glenn Williams, the<br />
G.N.W.T. Natural Resources Officer in<br />
Arctic Bay, N.W.T. ,for his advice <strong>and</strong><br />
generous donation of storage space<br />
during the field <strong>port</strong>ion of the stu-<br />
d ~ . Ipilee Koonoo <strong>and</strong> Timothy<br />
Sangoyak were our guides <strong>and</strong> field as-<br />
sistants during our stay on the ice.<br />
Val Churney <strong>and</strong> Dave Yablecki also as-<br />
sisted with data collection <strong>and</strong> camp<br />
maintenance. We thank the field crew<br />
for maintaining cheerful dispositions<br />
in spite of the often long working<br />
hours <strong>and</strong> frequent camp moves <strong>and</strong> we<br />
thank our helicopter pilots for their<br />
capable flying skills. We also appre-<br />
ciated the warm wel<strong>com</strong>e we received in<br />
Arctic Bay <strong>and</strong> the sup<strong>port</strong> provided by<br />
the <strong>com</strong>munity. Finally, we thank the<br />
Canadian Coastguard, in particular<br />
Captain Dave Johns, for their coopera-<br />
tion <strong>and</strong> sup<strong>port</strong> during the study, <strong>and</strong><br />
Allan Sneyd of Can<strong>arctic</strong> Shipping for<br />
his assistance <strong>and</strong> information provid-<br />
ed during the planning phase of the<br />
project.
References<br />
Barber. D. <strong>and</strong> Hochheim. K. 1986.<br />
Results of aerial photographic surveys<br />
for disturbance reactions of ceta-<br />
ceans: Admiralty Inlet, N.W.T. Re-<br />
<strong>port</strong> prepared by E.M.S.I. for Canada<br />
Department of Fisheries <strong>and</strong> Oceans,<br />
Central <strong>and</strong> Arctic Region, 30 p.<br />
Finlev. -. K.J. <strong>and</strong> Davis. R.A. 1984.<br />
Reactions of beluga whales <strong>and</strong> narwhals<br />
to shin traffic <strong>and</strong> ice-breaking<br />
alone ice-edges in the eastern Cana-<br />
-<br />
ed, King City, Ontario, for Cana-<br />
da Department of Indian Affairs <strong>and</strong><br />
Northern Development, 42 p.<br />
Finlev. K.J.. Greene. C.R. <strong>and</strong> Davis.<br />
-.<br />
R.A. 1983. A study of ambient noise,<br />
ship noise, <strong>and</strong> the reactions of nar-<br />
whals <strong>and</strong> belugas to the MV Arctic<br />
breaking ice in Admiralty Inlet,<br />
N.W.T. - 1982. Re<strong>port</strong> by L.G.L. Lim-<br />
i ted, Toronto, for Canada Department<br />
of Indian Affairs <strong>and</strong> Northern Devel-<br />
opment, 108 p.<br />
Finley, K.J.. Miller. G.W.. Davis.<br />
-.<br />
R.A. <strong>and</strong> Greene, C.R. 1984. Respon-<br />
ses of narwhals (Monodon monoceros)<br />
<strong>and</strong> belugas (Delphinapterus leucas) to<br />
ice-breaking ships in Lancaster Sound<br />
- 1983. Re<strong>port</strong> by L.G.L. Limited,<br />
King City, Ontario, for Canada Depart-<br />
ment of Indian ~ffairs <strong>and</strong> ~orthern<br />
Development, 117 p.<br />
Ford, J. 1977. White whale offshore<br />
exploration acoustic study. Re<strong>port</strong> by<br />
F.F. Slaney & Co. for Imperial Oil<br />
Ltd.<br />
Fraker, P.M. 1983. The white whale<br />
monitoring program, Mackenzie Estu-<br />
ary. Part I. Migration, distribution<br />
<strong>and</strong> abundance of whales <strong>and</strong> effects of<br />
industry activities on whales. Re<strong>port</strong><br />
by L.G.L., Sidney, B.C. for Esso<br />
Resources Canada Limited, Dome Petro-<br />
leum <strong>and</strong> Gulf Canada Resource, Inc.<br />
.,<br />
Ljungblad, D.K., Wursig, B., Swartz,<br />
S.L. <strong>and</strong> Keene, J.M. 1985. Observations<br />
on the behaviour of bowhead<br />
whales (Balaena mysticetus) in the<br />
presence of operating seismic exploration<br />
vessels in the Alaskan Beaufort<br />
Sea. - Re<strong>port</strong> by SEACO, Inc. for United<br />
States Minerals Management Service, 53<br />
Mansfield, A.W. 1983. The effects of<br />
vessel traffic in the Arctic on marine<br />
mammals <strong>and</strong> re<strong>com</strong>mendations for future<br />
research. Can. Tech. Rept. of Fish<br />
Aq. Sci. No. 1186, 97 p.<br />
Miller, G.W. <strong>and</strong> Davis, R.A. 1984.<br />
Distribution <strong>and</strong> movements of narwhals<br />
<strong>and</strong> beluga whales in response to ship<br />
traffic at the Lancaster Sound ice<br />
edge - 1984. Re<strong>port</strong> by L.G.L. Limit-<br />
ed,King City, Ontario, for Canada De-<br />
partment of Indian Affairs <strong>and</strong>Northern<br />
Development, 34 p.<br />
Richardson, W.J. 1985. Behaviour,<br />
disturbance responses <strong>and</strong> distribution<br />
of bowhead whales Balaena mysticetus<br />
in the Eastern Beaufort Sea, 1980-84.<br />
Re<strong>port</strong> by L.G.L. Ecological Research<br />
Associates, Inc. for U.S. Minerals<br />
Management Service, 306 p.<br />
Richardson, W.J., Fraker, M.A.,<br />
Wursig, B. <strong>and</strong> Wells, R.S. 1985. Be-<br />
haviour of bowhead whales Balaena mys-<br />
ticetus summering in the Beaufort Sea:<br />
Reactions to industrial Activities.<br />
Biological Conservation, 32: 195-230.<br />
Discussion<br />
T. ALBERT: How do you define "critical<br />
distance?" What distance does it occur<br />
in beluga <strong>and</strong> narwhal <strong>and</strong> <strong>under</strong> what<br />
<strong>conditions</strong>? For example, do beluga<br />
respond at say 30 km from an icebreaker?<br />
S. COSENS: Finley et al. (1984) indi-<br />
cated that narwhal <strong>and</strong> beluga in Lan-<br />
caster Sound began showing avoidance<br />
reactions to ships that were about 50 km
away from them. To assess whether there extreme responses in 1986 may be related<br />
was any evidence for habituation we to both the absence of an ice edge<br />
<strong>com</strong>pared the orientation of narwhal <strong>and</strong> blocking westward movement, <strong>and</strong> the<br />
beluga to ships greater than 50 km away presence of pack ice providing cover.<br />
to those less than 50 km away. Alterna-<br />
tive methods, such as correlation<br />
analysis of the relationship between<br />
orientation <strong>and</strong> ship distance, could also<br />
be used.<br />
To address your example, beluga do<br />
show avoidance responses at 30 km from an<br />
icebreaker. Ironically, one of our<br />
problems in assessing beluga behaviour<br />
was the general absence of beluga in our<br />
surveys when ships were active at the ice<br />
edge.<br />
K. FROST: Did you note any obvious<br />
response by belugas or narwhals to your<br />
survey aircraft? In Alaska, in 1987<br />
surveys, we noticed some apparent behav-<br />
ioural changes when our aircraft circled<br />
at 1000 ft.<br />
S. COSENS: We flew our surveys at 700<br />
ft, an altitude that Larry Dueck found,<br />
from previous work, to be non-disruptive.<br />
We did initially attempt to circle groups<br />
of whales to obtain more detailed behav-<br />
ioural observations than were possible<br />
with straight-line passes. We found,<br />
however, that whales reacted to the<br />
circling helicopter, so we discontinued<br />
our attempts to collect data in this way.<br />
C. MALME: Did you determine the noise<br />
levels at which whales began to show<br />
avoidance behaviour in response to ships?<br />
S. COSENS: We did record both <strong>under</strong>water<br />
ambient <strong>and</strong> ship noise. When we <strong>com</strong>plete<br />
analysis of these recordings we should be<br />
able to estimate noise levels to which<br />
narwhal <strong>and</strong> beluga react.<br />
J. WARD: In 1982 when Finley started his<br />
work <strong>and</strong> first saw the extreme escape<br />
responses, the ice edge was just to the<br />
west of Admiralty Inlet. Where was the<br />
ice edge during your study?<br />
S. COSENS: There was no l<strong>and</strong>fast ice<br />
across Lancaster Sound in our vicinity in<br />
1986. Whales were free to continue<br />
migrations westward at all times during<br />
our study. There was, however, extensive<br />
pack ice present during late May <strong>and</strong><br />
early June. I think that the absence of
Abstract<br />
OBSERVATIONS OF FEEDING GRAY WHALE<br />
RESPONSES TO CONTROLLED INDUSTRIAL NOISE EXPOSURE<br />
Charles I. Malme<br />
BEN Laboratories Inc., Cambridge, Massachusetts, USA<br />
Bernd Wursig<br />
Moss L<strong>and</strong>ing Marine Laboratories, Moss L<strong>and</strong>ing, California, USA<br />
James E. Bird<br />
University of Maryl<strong>and</strong>, College Park, Maryl<strong>and</strong>, USA<br />
Peter Tyack<br />
Woods Hole Oceanographic Institution, Woods Hole, Massachusetts, USA<br />
A field study was conducted on the<br />
potential effects of <strong>under</strong>water noise<br />
from petroleum industry activities on<br />
feeding <strong>and</strong> summering gray whales. This<br />
study was performed near Southeast Cape,<br />
St. Lawrence Isl<strong>and</strong>, Alaska, in August<br />
1985, using a 100 cu. in. air gun source<br />
<strong>and</strong> an <strong>under</strong>water projector for playback<br />
of drillship noise. Sound source levels<br />
<strong>and</strong> acoustic propagation losses were<br />
measured to permit estimation of the<br />
sound exposure levels at whale sighting<br />
positions. The surface-dive patterns<br />
<strong>and</strong> blow rates of whales were determined<br />
by observation of focal groups. A<br />
<strong>com</strong>puter-aided analysis of whale<br />
sighting data was performed to determine<br />
patterns <strong>under</strong> pre-exposure, exposure,<br />
<strong>and</strong> post-exposure <strong>conditions</strong>. For the<br />
air gun source there was an 0.5<br />
probability that the whales would stop<br />
feeding <strong>and</strong> move away from the area when<br />
the average pulse levels reached 173 dtf<br />
(re 1 microPasca1). The 0.1 probability<br />
of feeding interruption was estimated to<br />
This is a reviewed <strong>and</strong> edited version of a paper presented<br />
at the Ninth International Conference on Port <strong>and</strong> Ocean<br />
Engineering Under Arctic Conditions, Fairbanks, Alaska,<br />
USA, August 17-22, 1987. @ The Geophysical Institute,<br />
University of Alaska, 1987.<br />
occur at 163 dB, but whale responses<br />
were highly variable. Most whales<br />
returned <strong>and</strong> resumed feeding after the<br />
air gun vessel had moved on. Playback<br />
of drillship noise did not produce clear<br />
evidence of disturbance or avoidance<br />
behavior for levels below 110 dB. Pos-<br />
sible avoidance occurred for exposure<br />
levels approaching 119 dB.<br />
Background<br />
The exploration <strong>and</strong> development of<br />
energy resources in the outer contin-<br />
ental shelf (OCS) regions of the con-<br />
tinental U.S. <strong>and</strong> Alaska is introducing<br />
the factor of man-made noise into this<br />
environment. Since gray whales<br />
(Eschrichtius robustus) migrate <strong>and</strong> feed<br />
throughout the western OCS regions of<br />
the U.S. <strong>and</strong> Alaska, their activities<br />
may potentially be affected by increased<br />
levels of industrial noise. The objec-<br />
tive of this study was to determine the<br />
character <strong>and</strong> degree of response of<br />
feeding gray whales to playback of<br />
industrial noise (drillship sounds) <strong>and</strong><br />
to sound from an air gun seismic<br />
exploration source. A <strong>com</strong>plete descrip-<br />
tion of this study can be found in Malrne<br />
et al. (1986).
Previous studies<br />
There have been very few controlled<br />
experiments involving drillship play-<br />
backs to non-migrating baleen whales.<br />
Richardson et al. (1985a) <strong>and</strong> Richardson<br />
et al. (1985b) found some evidence for<br />
bowhead whale (Balaena mysticetus)<br />
avoidance at distances of 4 to 5 ton from<br />
the playback vessel, with the received<br />
sound level (RSL) at the closest whales<br />
ranging from approximately 100 dB to 113<br />
dB. They note, however, that because of<br />
the limited number <strong>and</strong> short duration of<br />
the playbacks, more experiments are<br />
needed <strong>and</strong> that their results "...must<br />
be considered preliminary." (Richardson<br />
et al. 1985a, p. 222.) Malme et al.<br />
(1985) conducted two drillship playback<br />
experiments on feeding humpback whales<br />
(Megaptera novaeangliae) in Frederick<br />
Sound, Alaska. There were no consistent<br />
responses of whales at ranges to the<br />
sound source of >0.5 km with RSL >116<br />
dB.<br />
Richardson et al. (1986) conducted<br />
air gun experiments on non-migrating<br />
bowhead whales using a single 0.66-1<br />
Bolt air gun. During three experiments<br />
in 1981 <strong>and</strong> 1983, involving a moving<br />
source, they found no evidence of<br />
avoidance at distances from 3 to 5 km<br />
with RSL near the whales > 118 to 133<br />
dB. In 1984, two experiments were<br />
conducted using a stationary source.<br />
Results showed that at 0.2 to 1.2 km <strong>and</strong><br />
2 to 4.5 km with RSL described as<br />
"intense" (not measured because of<br />
sonobuoy overload) <strong>and</strong> 124 to 131 dB,<br />
respectively, whales moved away from the<br />
source vessel. Malme et al. (1985)<br />
conducted single air gun (100 cu. in.)<br />
experiments on feeding humpback whales<br />
in Frederick Sound, Alaska. They found<br />
no overall pattern of avoidance, with<br />
RSL up to 172 dB. However, observers<br />
did note startle responses by whales at<br />
air gun onset on three occasions with<br />
RSL at 150 dB to 169 dB at ranges up to<br />
3.2 km.<br />
Migrating whale studies<br />
Malme et al. (1983) found that dur-<br />
ing playbacks of a variety of industrial<br />
noise stimuli to southbound migrants,<br />
each sound stimulus caused a statistic-<br />
ally significant response <strong>and</strong> that each<br />
of these responses was different when<br />
<strong>com</strong>pared to control <strong>conditions</strong>.<br />
Patterns of response appeared to vary<br />
predictably as a function of received<br />
sound level. Responses generally<br />
involved avoidance of the sound source,<br />
based on track deflection scores for<br />
whales exposed to playbacks of drilling<br />
platform, helicopter <strong>and</strong> production<br />
platform sounds <strong>and</strong> a drop in speed for<br />
whales exposed to drilling platform,<br />
drillship, semisubmersible <strong>and</strong> heli-<br />
copter sounds. During drilling platform<br />
<strong>and</strong> helicopter sound playbacks, apparent<br />
avoidance of the source area out to<br />
about 250 m was noted with sound levels<br />
at this range approximately 111 to<br />
118 dB.<br />
During January 1984, similar<br />
industrial noise playbacks were con-<br />
ducted on southbound migrating gray<br />
whales off the coast of California<br />
(Malme et al. 1984). An analysis pro-<br />
cedure was developed which permitted<br />
determination of the probability of<br />
avoidance of the region near the play-<br />
back source. This measure showed that<br />
avoidance behavior began at sound<br />
exposure levels of around 110 dB for the<br />
overall signal <strong>and</strong> was greater than 80%<br />
for regions with signal levels higher<br />
than 130 dB. Some variation among the<br />
various playback stimuli was observed,<br />
with the drillship producing the great-<br />
est avoidance <strong>and</strong> the production plat-<br />
form the lowest, for levels between 110<br />
<strong>and</strong> 125 dB. However, for levels between<br />
125 <strong>and</strong> 130 dB, the reactions to all<br />
playback stimuli were <strong>com</strong>parable.<br />
Malme et al. (1983) conducted<br />
experiments with seismic exploration<br />
sources on northward migrating mother/<br />
calf pairs during April <strong>and</strong> May 1983<br />
using a stationary <strong>and</strong> towed single air<br />
gun <strong>and</strong> a 40 gun towed array. Overall,<br />
results showed that the most predictable<br />
responses of the whales to air gun<br />
activity occurred at received levels<br />
>160 dB re 1 pPa when the air gun source<br />
was within 2 km of the animals.<br />
Small sample sizes prevented<br />
definite quantification of response for<br />
average pulse pressure levels between<br />
140 <strong>and</strong> 160 dB, but analysis showed that<br />
some behavioral changes did occur at<br />
these levels. In general, whales would<br />
slow down <strong>and</strong> turn away from the source.<br />
In several cases, groups were seen swim-
ming into the surf zone <strong>and</strong> also posi-<br />
tioning themselves in the sound shadow<br />
of a rock, isl<strong>and</strong>, or outcropping.<br />
There were significant differences,<br />
independent of range or level of<br />
exposure, in milling indices ,* speed<br />
indices for groups prior to exposure <strong>and</strong><br />
those same groups during exposure to the<br />
air gun noise. There were also signifi-<br />
cant differences in milling indices <strong>and</strong><br />
speed indices for groups during exposure<br />
<strong>and</strong> after exposure to air gun noise.<br />
During the southbound January 1984<br />
migration, seismic experiments were<br />
conducted using both a stationary single<br />
air gun <strong>and</strong> a towed single air gun.<br />
During stationary air gun experiments,<br />
whales avoided the sound source area by<br />
moving further offshore or inshore of<br />
the air gun vessel. This avoidance<br />
response was first detected 2 km north<br />
of the vessel <strong>and</strong> persisted until the<br />
whales were at least 2 km south of the<br />
vessel. No identifiable avoidance<br />
response was observed during moving air<br />
gun experiments. However, these<br />
experiments were of short duration <strong>and</strong><br />
sample sizes were low.<br />
The probability of avoidance<br />
analysis for the stationary air gun<br />
source showed that the threshold of<br />
avoidance behavior occurred for average<br />
pulse pressure levels of approximately<br />
164 dB. This was somewhat higher than<br />
the level of 160 dB which was observed<br />
to produce changes in the migration<br />
behavior of mother/calf pairs during the<br />
April <strong>and</strong> May 1983 field experiments.<br />
Introduction<br />
Based on a review of recent litera-<br />
ture <strong>and</strong> discussions with researchers<br />
working on feeding gray whales in the<br />
northern Bering Sea (Wursig, et al.<br />
1983, 1986; Thomson 1984), we decided to<br />
conduct our studies in the nearshore<br />
waters off Southeast Cape, St. Lawrence<br />
Isl<strong>and</strong>, Alaska. The project was con-<br />
*Milling index is a measure of the<br />
direct- ness or linearity of the route<br />
taken by the whale from point (xi, yl)<br />
to (xn, yn) <strong>and</strong> is calculated by<br />
dividing net speed by cumulative speed.<br />
ducted in the latter half of August,<br />
1985.<br />
The study concentrated on the area<br />
around St. Lawrence Isl<strong>and</strong>, especially<br />
near Southeast Cape (Fig. 1). Gray<br />
whales, apparently feeding, as evidenced<br />
by mud plumes, were located in the area<br />
of Kialegak Point, Southeas
generally below or near the bottom of<br />
the surface layer of warmer, less saline<br />
water.<br />
Playback procedure<br />
The acoustic playback system was<br />
designed to provide sound levels <strong>and</strong><br />
frequency response capable of realistic-<br />
ally simulating a broad range of<br />
petroleum industry activities. In order<br />
to boost the low frequency response of<br />
the projector system, two USN/USRD Type<br />
J-13 projectors were used to provide<br />
response down to 32 Hz. In addition to<br />
the two low frequency projectors, a<br />
USN/USRD Type F-40 projector was used to<br />
provide high frequency sound above 2<br />
kHz. Electrical equalization <strong>and</strong> cross-<br />
over networks were used to enable all of<br />
the projectors to be driven from a 300-<br />
watt power amplifier. As a result of<br />
the use of two low frequency projectors<br />
<strong>and</strong> the electronic equalization network,<br />
the useful response of the system<br />
extended from 32 Hz to 20 kHz. The<br />
playback system <strong>and</strong> its response curve<br />
are shown in Fig. 2.<br />
160 ,<br />
During a playback sequence, a pre-<br />
recorded, 15-min. duration, industrial<br />
noise stimulus on a cassette tape was<br />
used to generate a test signal. Two<br />
cassette recorders coupled to a fader<br />
control permitted uninterrupted<br />
continuous sound for as long as<br />
desired. Playback periods of 30 min to<br />
1 hr were generally used.<br />
Air gun source characteristics<br />
E COMBINED PROJECTOR RESPONSE WITH EQUALIZATION<br />
(CONSTANT RMS 113 OCTAVE BAND LEVEL INTO EQUALIZER.<br />
el<br />
REF. DRIVE LEVEL. 1A RMS IN 200 Hz 113 OCTAVE BAND)<br />
Deuda Power<br />
C~wtto Lmd Amplifier<br />
llydropho~<br />
The air gun used for the seismic<br />
signal tests was a 100 cu. in. Western<br />
Geophysical gun operated at 4500 psi.<br />
The peak source level was 226 dB re luPa<br />
at 1 m (125 Hz b<strong>and</strong>width). A typical<br />
pressure signature <strong>and</strong> spectrum are<br />
shown in Fig. 3. The firing rate used<br />
was 6 pulses per min. This gun was<br />
operated from the NANCY-H, an 80-ft (24<br />
m) oil-industry cargo/supply vessel.<br />
Since the peak pressure of the<br />
signal from the air gun is influenced<br />
strongly by multipath propagation<br />
<strong>conditions</strong>, we have found the average<br />
.... --9---<br />
FREQUENCY (Hz)<br />
Clou-Over<br />
Circuit<br />
PROJECTOR Hvdrophoni<br />
INSTRUMENTATION<br />
Figure 2. Playback instrumentation.
.<br />
ft.<br />
*<br />
a<br />
a<br />
: O<br />
ft.<br />
- 1.1<br />
9 320<br />
Time. m f c.<br />
Figure 3. Air gun signature <strong>and</strong><br />
spectrum, 100 cu. in., 4000 psi, range<br />
200 m, depth 10 m.<br />
pulse pressure level to be a useful<br />
measure of the received level of the<br />
transient signals from an air<br />
gun.This quantity is a measure of the<br />
effective energy of a noise pulse in<br />
terms of an average pressure level<br />
defined as (Urick 1983, Sec. 4.4)<br />
where<br />
pc = the specific acoustic<br />
impedance of water<br />
p(t) = the original pulse pressure<br />
waveform<br />
-<br />
p = the average pulse pressure<br />
T = the average pulse duration<br />
(the time required for<br />
p 2 (t) to decay to less than<br />
13.5% of the initial value).<br />
Generally, it is more convenient to<br />
express acoustic pressure in logarithmic<br />
terms. Consequently, the average pulse<br />
pressure level is defined as<br />
where<br />
Transmission loss analysis<br />
The transmission loss data obtained<br />
using the air gun were analyzed using a<br />
<strong>com</strong>puter-implemented least-squares<br />
technique which determines the best-fit<br />
values for two parameters in the<br />
received level model (Eq. 3, Table 1).<br />
The values of Ls' <strong>and</strong> Ar are determined<br />
by this technique using measured data.<br />
When the source level is calibrated, the<br />
effect of the local bottom <strong>and</strong> surface<br />
<strong>conditions</strong> on sound propagation can be<br />
determined as a local "anomaly" where:<br />
LSt = Ls + \l (dB) (4)<br />
Here, Ls is the pressure level measured<br />
at 1 m from the source <strong>and</strong> A is the<br />
local anomaly resulting from bottom <strong>and</strong><br />
surface reflection effects.<br />
Whale behavior observation<br />
Whale behavior data were obtained<br />
by close observation of focal whale<br />
groups, recording surf acing, dive <strong>and</strong><br />
blow information. In addition, tracking<br />
of the focal groups was performed using<br />
a two-vessel triangulation procedure or<br />
a l<strong>and</strong>-based theodolite when weather<br />
permitted. The experimental procedure<br />
involved location of feeding whales,<br />
observation of behavior during a control<br />
period with the sup<strong>port</strong> vessels present,<br />
observation of behavior during an<br />
experiment period with the sound<br />
stimulus on, <strong>and</strong> observation of behavior<br />
during a post-experiment control<br />
period. Generally, several of these<br />
sequences were performed each day.<br />
Whales were considered to be un-<br />
disturbed during non-experimental days
Table 1.<br />
for St.<br />
Sound transmission parameters<br />
Lawrence Isl<strong>and</strong> air gun<br />
1986) <strong>under</strong> control<br />
<strong>conditions</strong>: 1) Blow<br />
<strong>and</strong> experimental<br />
Interval - time<br />
experiments. between respirations while the whale is<br />
at the surface; 2) Length of Surfacing -<br />
*B<br />
*re **a v<br />
time that the whale is at the surface<br />
Dtte/Time I~B) M-.A. I ~ I discounting shallow submergences between<br />
respirations; 3) Length of Dive - time<br />
8/22/1443-1600 -4 17 20 that the whale is below the surface<br />
between surfacings; 4) Number of Blows<br />
a/22/1731-1745 2 144 20 per Surfacing; <strong>and</strong> 5) Blow Rate - the<br />
8/24/1722-1754 -3 20 10<br />
number of blows per minute calculated<br />
from length of surfacing, length of dive<br />
8/24/2015-2024 o 30 12 <strong>and</strong> number of blows per surfacing.<br />
8/25/1221-1254. 7 54 14 We also noted if whales were<br />
engaged in the following activities: 1)<br />
*Determined from data using the method of least-sauares. Feeding - the presence of mud, birds<br />
<strong>and</strong>/or regular surfacing <strong>and</strong> diving in<br />
SOUND TRANSHISSION EQUATION the same location; 2) Travelling -<br />
RSL - L^+A^-s log E^-1s log R-A~R-A~R/B^-~~ ( d ~<br />
re lu?a)<br />
concerted movement in a particular<br />
direction; 3) Milling - movement at or<br />
(31 near the surface ac<strong>com</strong>panied by many<br />
direction changes; 4) Socializin - two<br />
where -~ ~<br />
or more whales w i t h i n d l e n g t h<br />
RSL - (7-8 m) of each other <strong>and</strong> interacting;<br />
Received sound level at range R (dB re luPa)<br />
<strong>and</strong>, 5) Surface Active Behavior<br />
Ls - -<br />
Source level [dB re 1 "Pa at 1 m)<br />
breaching, pectoral slapping, etc.<br />
R - Range in km<br />
Because of small sample sizes, we were<br />
~ y . mlecular (volumetric) absorption ( d ~<br />
Ar - Reflection loss at surface <strong>and</strong> bottom (dB - meters per<br />
km)<br />
A, - Change in effective source level due to proximity of<br />
surface <strong>and</strong>/or bottom (dB) (local anomaly).<br />
-41 = Conversion constant (5 log 23-15 log m/km)<br />
E - ( H + H:)/2 where Hs - fieptf. at source (n) <strong>and</strong> H:<br />
depth at receive: la).<br />
-<br />
when large boats were not moving in the<br />
study area <strong>and</strong> during the first pre-<br />
disturbance control periods of each<br />
experimental day. We did not consider<br />
subsequent control periods of experi-<br />
mental days as undisturbed for the<br />
purposes of surfacing-dive behavior<br />
analysis, since the data indicate that<br />
such subsequent control periods may not<br />
have represented a true undisturbed<br />
situation, but instead whales were<br />
potentially affected by the previous<br />
experiment of that day.<br />
To assess the possible effects of<br />
air gun <strong>and</strong> drillship operations on the<br />
behavior of gray whales on the feeding<br />
grounds, we measured the following<br />
surfacing, respiration <strong>and</strong> dive cycle<br />
variables (after Wursig et al. 1984,<br />
per km) unable to <strong>com</strong>pare statistically the<br />
frequency of these behaviors during<br />
control <strong>and</strong> experimental <strong>conditions</strong>.<br />
Measurement of whale positions <strong>and</strong> whale<br />
movement patterns<br />
Limited visibility <strong>conditions</strong> for<br />
most of the field period did not permit<br />
l<strong>and</strong>-based observations. As a result,<br />
most whale positions were ascertained by<br />
triangulating with a shipboard theodo-<br />
lite <strong>and</strong> binocular <strong>com</strong>passes, a tech-<br />
nique developed by Malme et al. (1985)<br />
to study feeding humpback whales in<br />
Frederick Sound, Alaska. This procedure<br />
was developed from l<strong>and</strong>-based theodolite<br />
tracking procedure (see Wursig 1978 <strong>and</strong><br />
Tyack 1981). The ship-based technique<br />
requires obtaining two concurrent bear-<br />
ings to a whale using a theodolite on a<br />
primary observation vessel <strong>and</strong> a binoc-<br />
ular <strong>com</strong>pass on a secondary observation<br />
vessel (a Zodiac in this case). The<br />
range between the two observation<br />
vessels is obtained using radar. A<br />
Loran C system on the primary vessel<br />
provides a geographic position refer-<br />
ence. The primary observation vessel<br />
for the study was the BIG VALLEY, a 90-<br />
ft (27 m) fishing/ utility vessel. This<br />
procedure is shown in Fig. 4.
CHALE<br />
9<br />
OR VESSEL<br />
PRIMARY OBSERVATION VESSEL SECONDARY OBSERVATION VESSEL<br />
LORANC ff.1 BINOCULAR-COMPASS I#,.#, 1<br />
RADAR fro) RADIO<br />
THEODOLITE W, I<br />
RADIO<br />
CALCULATE rw È<br />
Figure 4. Whale tracking using observa-<br />
tions from two vessels.<br />
Results<br />
Acoustic data<br />
Ambient noise in the test area was<br />
generally low <strong>and</strong> controlled by wind-<br />
generated sea noise. Sound transmission<br />
was found to be more efficient than is<br />
usual for shallow water areas with a<br />
s<strong>and</strong>lsilt bottom because of the probable<br />
presence of a sub-bottom rock layer.<br />
Measurements of received level at<br />
several depths <strong>and</strong> ranges did not show<br />
the depth dependence expected to be<br />
produced by the observed strong downward<br />
refracting gradients. This was probably<br />
a result of the shallow water which<br />
ranged from 15 to 25 m in depth.<br />
Reflections <strong>and</strong> general scattering from<br />
the bottom <strong>and</strong> probable sub-bottom<br />
layers produced generally reverberant<br />
received signals. While no specific<br />
sub-bottom information has been obtained<br />
for the St. Lawrence test area,<br />
MacKensie (1973) re<strong>port</strong>ed <strong>under</strong>lying<br />
layers of granitic <strong>and</strong> basaltic rock at<br />
depths of 3 to 10 m for an area lying to<br />
the east of the isl<strong>and</strong>.<br />
Acoustic exposure estimation<br />
Since some variation in sound<br />
transmission was observed for the<br />
several test areas used, specific data<br />
from each test area were used in<br />
prediction of the sound exposure levels<br />
for whale sightings.<br />
The results of analysis of the<br />
transmission loss measurements are<br />
summarized in Table 1. The values of<br />
<strong>and</strong> Ar shown in the table were used<br />
together with Eq. (3) to estimate the<br />
exposure levels at the whale sighting<br />
positions for the air gun experiments.<br />
A <strong>com</strong>parison of measured data with the<br />
received average pulse pressure level<br />
versus range characteristic predicted by<br />
Eq. (3) is shown in Fig. 5A.<br />
Figure 5. Comparison of average pulse<br />
pressure data with predictions of<br />
empirical propagation propagation<br />
model. (Source - 100 cu. in. air gun at<br />
4500 psi).
Surfacing-dive behavior, observation<br />
results<br />
The frequency distributions of the<br />
five surfacing, dive <strong>and</strong> respiration<br />
characteristics used in the analysis are<br />
shown in Fig. 6. Blow interval <strong>and</strong> blow<br />
rate approximate a normal distribution,<br />
while the distributions of the other<br />
three characteristics are highly skewed.<br />
Consequently, blow interval <strong>and</strong> blow<br />
rate were analyzed with parametric<br />
testing procedures (by analysis of<br />
variance <strong>and</strong> Student-Newman-Keuls<br />
multiple <strong>com</strong>parisons tests), while<br />
length of surfacing, length of dive, <strong>and</strong><br />
number of blows per surfacing were<br />
analyzed with non-parametric methods (by<br />
Kruskal-Wallis , Mann-Whitney-U <strong>and</strong> non-<br />
parametric multiple <strong>com</strong>parisons; Zar<br />
1974, Sokal <strong>and</strong> Rohlf 1969).<br />
There were significant differences<br />
in surfacing-dive characteristics<br />
between the condition of no known<br />
disturbance <strong>and</strong> the potential disturb-<br />
ances of drillship playbacks <strong>and</strong> air gun<br />
experiments (Table 2 <strong>and</strong> Fig. 6).<br />
During drillship playbacks, blow<br />
interval decreased <strong>and</strong> length of surfac-<br />
ing, length of dive <strong>and</strong> number of blows<br />
per surfacing all increased. For air<br />
gun sounds, the response was opposite to<br />
that of drillship, with blow interval<br />
increasing <strong>and</strong> the other three primary<br />
characteristics decreasing.<br />
Interestingly, blow rate did not change<br />
from the undisturbed condition, because<br />
increases or decreases in blow interval<br />
time made up for shifts in lengths of<br />
surfacings <strong>and</strong> dives.<br />
Figures 7 <strong>and</strong> 8 show these summary<br />
data in more detail. For drillship<br />
playback experiments, the surfacing-dive<br />
characteristics stay at a "disturbed"<br />
level within a one-half hour period<br />
after exposure of whales to drillship<br />
sounds. Whales shift their surfacing-<br />
dive characteristics close to the pre-<br />
disturbance level in the 30 to 60 minute<br />
period after exposure. They even appear<br />
to overshoot the presumed undisturbed<br />
level, with blow interval higher <strong>and</strong> the<br />
other three primary characteristics<br />
lower, than during the presumed un-<br />
disturbed situation (Fig. 7). Responses<br />
of whales to air gun do not tend to go<br />
back to the presumably undisturbed<br />
condition within one hour of air gun<br />
sounds, especially for blow intervals<br />
<strong>and</strong> length of dives. These data<br />
indicate that air gun sounds have a<br />
longer-term effect on the behavior of<br />
primarily feeding gray whales than do<br />
drillship sounds (Fig. 8). A caution is<br />
necessary, however: drillship sounds<br />
were made by playbacks which may have<br />
some differences in sound character-<br />
istics from real drillships <strong>and</strong> air gun<br />
sounds were supplied by only one air gun<br />
instead of the many often used during<br />
seismic mapping activities.<br />
Although relatively few surfacing-<br />
dive data were collected during the<br />
short field season, some interesting<br />
trends have emerged. In general, blow<br />
intervals decreased during drillship<br />
sounds <strong>and</strong> length of surfacing, length<br />
of dive <strong>and</strong> number of blows per surfac-<br />
ing increased. This trend indicates<br />
that whales are cycling through their<br />
basic surfacing-dive patterns more<br />
slowly while subjected to drillship<br />
sounds. They returned to a pre-<br />
disturbance level relatively quickly,<br />
usually after about one-half hour post<br />
disturbance. Blow rate altered<br />
little. Kesponses to the air gun were<br />
different. Whales increased blow<br />
intervals <strong>and</strong> tended to decrease length<br />
of surfacing, length of dive <strong>and</strong> number<br />
of blows per surfacing. They were more<br />
likely to alternate feeding with travel,<br />
or travel away from the sound source.<br />
This trend was especially strong on<br />
several occasions when we noticed a<br />
definite cessation of feeding <strong>and</strong><br />
movement away from the sound source.<br />
Recovery to "normal" levels was less<br />
rapid than for drillship sounds, but<br />
tended to occur about one hour after<br />
disturbance.<br />
Summary of movement patterns<br />
Drillship playback<br />
Two playback tests for which whale<br />
movement data are available suggest that<br />
the whales did not alter their movement<br />
patterns with RSL at 103 to 110 dB <strong>and</strong><br />
the BIG VALLEY as close as 1.1 km. In<br />
one case, a whale continued to feed in<br />
the same general area during both con-<br />
trol <strong>and</strong> experimental periods. However,<br />
during one pre-control period, whales<br />
appeared to respond to the presence of<br />
the BIG VALLEY, thus <strong>com</strong>plicating
,.<br />
240<br />
192<br />
- IB<br />
-<br />
0 144 -<br />
0<br />
-1 tT -<br />
L -<br />
Â¥^ 96<br />
-<br />
48 -<br />
-<br />
15 30 45<br />
Blow Interval (a)<br />
1<br />
0<br />
0 1 2 3 4<br />
Length of Dive (min)<br />
l l l l l l ~ ~<br />
Length of Surfacing (mm) 72<br />
-<br />
-<br />
-<br />
Blow Rote (number/min)<br />
T-24<br />
se - ? 6 8<br />
N - 489<br />
I I 1 , l ~<br />
x - 0..<br />
'd - o w 2<br />
N - 486<br />
l I l<br />
7<br />
Ll ~ ~ ~ ~ ~<br />
L<br />
46 0 0<br />
2 4 6 8 10<br />
Number of Blows per Surfacing<br />
r<br />
12<br />
Figure 6. Frequency distribution of surfacing-dive data on undisturbed whales. See<br />
text for definition of undisturbed.
Table 2. Summary statistics for undisturbed whales <strong>and</strong> whales during drillship<br />
playbacks <strong>and</strong> air gun experiments.<br />
Experironfcal No. of Blows/ length of Surfacing length of Dive Blew Rate<br />
Situation Blew Interval (8) Surfacing (rain) (mini (No./Min. 1<br />
Undisturbed 14.2 6.44 811 2.4 1.68 409 0.44 0.442 406 1.80 1.158 494 1.17 0.530 480<br />
Airgun 16.5 6.01 147 2.0 1.40 135 0.38 0.430 135 1.54 1.081 134 1.20 0.570 131<br />
interpretation of results. During two<br />
other playback tests, whales in the<br />
vicinity of the BIG VALLEY did move out<br />
of the general area, but we were unable<br />
to obtain track data on individual<br />
whales <strong>and</strong>, therefore, KSL for specific<br />
focal animals are not available.<br />
However, for one of these latter two<br />
experiments, KSL at the whales moving<br />
out of the area was estimated at 108 to<br />
119 dfl at distances of approximately 1<br />
km to 0.3 km, respectively. Results of<br />
drillship playbacks during the present<br />
study appear consistent with our earlier<br />
findings .<br />
Air gun<br />
Alterations in whale movement pat-<br />
terns <strong>and</strong>/or feeding behavior were noted<br />
during each of the six air gun experi-<br />
ments. Table 3 summarizes the behavior<br />
of eight of the nine focal whales <strong>under</strong><br />
observation during the experiments.<br />
Responses were noted at RSL ranging from<br />
149 dB to 176 dB at distances up to<br />
approximately 4 km. However, in one<br />
case, RSL reached a peak of 165 db with<br />
the NANCY H 0.7 km distant with very<br />
little, if any, response observed. We<br />
did observe the cessation of feeding<br />
with apparent movement away from the<br />
experimental vessel during air gun sound<br />
exposure on five occasions. However, in<br />
three of these cases, the whales resumed<br />
feeding either during the experiment<br />
(one case) or during the post-control<br />
period (two cases). In the remaining<br />
two cases, one whale stopped feeding<br />
with apparent movement away from the<br />
experimental vessel (Whale A, AG 3) <strong>and</strong><br />
continued to move out of the area during<br />
the post-control period; the other whale<br />
(Whale L) stopped feeding during AG 5,<br />
but we do not have information on its<br />
pre-control movement pattern.<br />
Most of the responses involved<br />
either an abrupt change in direction or<br />
an increase in speed with apparent<br />
movement away from the experimental<br />
vessel. On one occasion a whale<br />
spyhopped* several times in apparent<br />
response to increasing RSL. We did note<br />
that in three <strong>and</strong> possibly four cases<br />
(marked with an asterisk in Table 3)<br />
whales showed a response to the<br />
operating air gun at a time coinciding<br />
with the NANCY H moving past the whale's<br />
position, at which point the whales were<br />
experiencing peak RSL.<br />
In order to derive a general guide-<br />
line for estimating the probable<br />
behavioral response of summering <strong>and</strong><br />
feeding gray whales to air gun noise, it<br />
is necessary to examine the summary of<br />
individual whale responses presented<br />
previously in Table 3. On the basis of<br />
the information presented in this table,<br />
the summary cumulative distribution<br />
function shown in Fig. 9 was developed.<br />
It includes only those whales for which<br />
a definite interruption of feeding<br />
activity was observed. If a whale<br />
*Raising the anterior <strong>port</strong>ion of the<br />
body so that the eyes are above the<br />
water.
** n s ***<br />
8 * , , I ,<br />
a,- w-<br />
UMXST ALL OS POST OS<br />
UNOIST ALL OS POST OS<br />
ns , ns , ns<br />
a,- w-<br />
ALL 0s POST 0s<br />
Figure 7. Summary statistics for undisturbed whales, <strong>and</strong> whales during <strong>and</strong> after<br />
drillship playbacks. Center bars denote means, boxes denote 95% confidence intervals,<br />
bars denote 1 st<strong>and</strong>ard deviation above <strong>and</strong> below the mean, <strong>and</strong> numbers denote sample<br />
size. Asterisks show significance levels of probability: * = 0.05, ** = 0.01, *** =<br />
0.001, ns = not significant.
0<br />
I *** ns<br />
I ns<br />
-30 nun -0 fnin<br />
UNDIST ALL AG POST AG<br />
UNOIST ALL AQ POST AG<br />
6 I I I I I<br />
UNOIST ALL AG POST AG<br />
UNDIST ALL AG POST AG<br />
Iff<br />
T<br />
1 ns , ns<br />
-30 -on<br />
n s<br />
I<br />
10.0 "."<br />
UNDIST ALL AG POST AG<br />
Figure 8. Summary statistics for undisturbed whales, <strong>and</strong> whales during <strong>and</strong> after air<br />
gun experiments.<br />
66
Table 3.<br />
1985.<br />
Summary of focal whale response to air gun experiments, 22, 24, 25 August<br />
Focal Pre-Control<br />
Mute Activity<br />
*Itesponse when N.H. broadside to whale.<br />
1H/V Nancy I.<br />
21^/V ~ig Valley<br />
Feeding Movement away, steeped novament<br />
as AS acproadied, m feeding<br />
Feeding Direction change, nave towards<br />
<strong>and</strong> then away E m N.H.<br />
feeding before <strong>and</strong> after move<br />
Feeding, Group split at KG onset, A move<br />
joined Mule E mrth 6 east offshore, feeding<br />
to 1731<br />
Feeding Feeding with inshore movement<br />
as N.H. noved past (possibly<br />
feeding related)<br />
Feeding Feeding, turn, speed increase,<br />
dive, fluke out, reeume feeding<br />
Feeding, m Joined by Mule N, BOIB feeding,<br />
track plot royhcpe, wtheast movement<br />
Unknown Joined Mula L, feeding<br />
feeding Feeding to 1605, novamerot<br />
parallel to N.H. then offshore<br />
resumed feeding after the air gun vessel<br />
had moved away or stopped firing, the<br />
corresponding original response exposure<br />
level is marked "F".<br />
The resulting cumulative distribution<br />
can be seen to be somewhat skewed, having<br />
z<br />
u<br />
I-<br />
3 " -<br />
.a -<br />
a: .,<br />
an interpolated median value of 173 dB <strong>and</strong><br />
a calculated mean value of 169.6 dB. If<br />
the data values shown are considered to be<br />
representative samples of the true<br />
acoustic response statistics which might<br />
"1<br />
3<br />
u<br />
2<br />
1-1<br />
-<br />
-6<br />
"<br />
.4 -<br />
.3 -<br />
be obtained with more extensive testing, .2-<br />
Return to Pre-<br />
Control area,<br />
feeding<br />
Feeding, Movement<br />
possibly affected<br />
by 6.V.<br />
Continued offshore<br />
m n t<br />
feeding sane general<br />
area<br />
Feeding u n general ~<br />
area<br />
Group aplit, L<br />
increase speed ming<br />
southeast out of area,<br />
no feeding<br />
Feeding, group split<br />
Offshore to 1715, then<br />
back to original loca-<br />
tion <strong>and</strong> feeding<br />
o . r s . , . v - - u * q , .<br />
it is useful to calculate the confidence<br />
limits of the acoustic response measures<br />
determined by the present data. We need<br />
to estimate how well the data represent<br />
. - 1 -<br />
3<br />
p<br />
170 160 IS0<br />
the range of expected feeding gray whale<br />
responses to air gun noise disturbance.<br />
RVERRGE PULSE LEVEL, dB re 1 uPa<br />
A distribution-free confidence<br />
interval test for the median was developed<br />
by Thompson (19361. This test provides a Figure 9. Cumulative distribution for<br />
means of calculating the confidence level<br />
of a median estimate based on a number of<br />
observed feeding disturbance. (Data from<br />
Table 3. F - whale returned <strong>and</strong> resumed<br />
samples from a parent population having an feeding .)
unknown distribution form. The results of<br />
applying this test to the data shown in<br />
Fig. 9 give a confidence estimate of 68%<br />
that the true median (0.5) response level<br />
lies between 170 <strong>and</strong> 175 dB <strong>and</strong> a 94%<br />
confidence estimate that it lies within<br />
the interval of 163 dB to 177 dB.<br />
Discussion<br />
Acoustic data<br />
The transmission loss measured in the<br />
St. Lawrence Isl<strong>and</strong> area was lower than<br />
that measured off the California coast<br />
during a previous study of migrating gray<br />
whales (Malme et al. 1983, 1984). A<br />
<strong>com</strong>parison of the characteristics of the<br />
two areas for average pulse pressure<br />
propagation can be made by examining Fig.<br />
5A <strong>and</strong> Fig. 5B. A shallow sub-bottom<br />
layer of rock probably causes the con-<br />
siderably better sound propagation<br />
<strong>conditions</strong> observed off St. Lawrence<br />
Isl<strong>and</strong> since the bottom <strong>com</strong>position<br />
according to chart information is<br />
s<strong>and</strong>/silt for both areas.<br />
Behavioral data<br />
For both types of experimental<br />
stimuli, subsequent experiments of a day<br />
appeared to be affected by the earlier<br />
experiments. This took both the form of<br />
surfacing-dive data not always going back<br />
to a pre-disturbance level after the first<br />
experiment of the day, <strong>and</strong> whales at times<br />
reacting less strongly to a subsequent<br />
experiment. This is not a firm con-<br />
clusion, however, because many other<br />
factors such as time of day, presence of<br />
one or two boats in the area, <strong>and</strong> general<br />
behavior of the whales may have served as<br />
confounding factors. Interestingly,<br />
number of blows per surfacing, length of<br />
surfacings, <strong>and</strong> length of dives were all<br />
lower during the present study than for<br />
presumed undisturbed gray whales studied<br />
in July <strong>and</strong> September 1982 in the same<br />
area (Wursig et al. 1986). We wonder<br />
whether our present results may have been<br />
affected by the presence of at least one<br />
large vessel near the whales at almost all<br />
times, unlike the situation in 1982, when<br />
observations were generally made from a<br />
small skiff > 1 km distant from the mother<br />
ship. This possibility of a level of<br />
disturbance even during presumed<br />
"undisturbed" situations does not negate<br />
our results, however, since industrial<br />
disturbance is likely to be ac<strong>com</strong>panied by<br />
the presence of larger vessels in real<br />
situations.<br />
Disturbance reactions during air gun<br />
playbacks were very similar to the reac-<br />
tions found for surfacing-dive character-<br />
istics of bowhead whales when subjected to<br />
air gun sounds (Richardson et al. 1985a,<br />
Ljungblad et al. 1985, Richardson et al.<br />
198b). In bowheads, blow intervals in-<br />
creased <strong>and</strong> length of surfacing, length of<br />
dive <strong>and</strong> number of blows per surfacing all<br />
decreased during air gun firing. The same<br />
basic behavioral shift from feeding or<br />
milling prior to air gun sounds to travel-<br />
ing away from the sound source was noted<br />
for bowheads during several experiments<br />
with full-scale seismic vessels (Ljungblad<br />
et al. 1985).<br />
A possible bias exists in our data.<br />
We used number of surfacing-dive variables<br />
encountered to calculate degrees of free-<br />
dom for statistical analyses, without<br />
regard for possible dependence of data in<br />
surfacing-dive sequences of individual<br />
animals. If such dependence is strong,<br />
our degrees of freedom used to calculate<br />
statistics are overestimates of actual<br />
allowable degrees of freedom. We have not<br />
been able to determine amount of depend-<br />
ence within parts of our serial data,<br />
however, <strong>and</strong> we therefore present degrees<br />
of freedom as directly related to sample<br />
sizes of surfacing <strong>and</strong> dive variables.<br />
Future work may help clarify potential<br />
dependence of our time-series data.<br />
Movement observations<br />
The number of wnales observed <strong>under</strong><br />
experimental <strong>conditions</strong> was low throughout<br />
the field season. This was due mainly to<br />
the late starting date of the project,<br />
which resulted in a low number of whales<br />
present in the study area coupled with<br />
adverse viewing <strong>conditions</strong>. Because many<br />
whale groups were far offshore during much<br />
of the field period, it was generally not<br />
possible to use l<strong>and</strong>-based theodolite<br />
tracking of individual whales in <strong>com</strong>bina-<br />
tion with small boat observations as was<br />
ac<strong>com</strong>plished by Wursig et al. (1983,<br />
1986). The use of this method would have<br />
increased the number of whale groups<br />
tracked, since l<strong>and</strong>-based observers could<br />
have concentrated on 3 to 4 groups<br />
simultaneously, whereas the two-boat<br />
method most often employed required BIG
VALLEY observers to focus only on the one<br />
to two groups <strong>under</strong> observation by Zodiac<br />
personnel in order to obtain whale move-<br />
ment data. Movement data were obtained<br />
during two drillship playback experiments<br />
but the whale numbers were low. During<br />
several air gun experiments, we have<br />
extended detailed observations, including<br />
both surfacing/respiration data <strong>and</strong> track<br />
plots. As examples we describe two air<br />
gun experiments (AG1 <strong>and</strong> AG4) for which<br />
overall behavioral patterns are fairly<br />
<strong>com</strong>plete in Appendix A.<br />
Conclusions<br />
It is difficult to <strong>com</strong>pare experi-<br />
mental results concerning migrating gray<br />
whales with those of feeding gray whales.<br />
Different behavioral responses were<br />
measured in feeding <strong>and</strong> migrating gray<br />
whales. The pattern of gray whale respon-<br />
ses may scale not only with KSL, but also<br />
rate of change of RSL or movement of the<br />
sound source. Both of these parameters<br />
varied with moving vs. stationary air gun<br />
sources. A priori one may expect the<br />
response of gray whales to noise stimuli<br />
to be a function of behavioral state as<br />
has been pointed out by Brodie (1981) <strong>and</strong><br />
Richardson et al. (1985). However, the<br />
results of our studies on the behavioral<br />
responses of migrating <strong>and</strong> feeding gray<br />
whales to drillship sound playback <strong>and</strong> air<br />
gun operations indicate measurable<br />
responses at similar exposure levels.<br />
Drillship playback<br />
Analysis of the sighting data for the<br />
<strong>com</strong>bined drillship playback experiments<br />
showed that a number of whales were<br />
exposed to levels that produced avuiaance<br />
behavior for migrating gray whales (110 to<br />
120 dB). No definite pattern of avoidance<br />
of the source area was observed. However,<br />
until more testing is performed at higher<br />
exposure levels, we believe that the<br />
application of the probability of avoid-<br />
ance results for migration activity would<br />
provide a conservative response estimate<br />
for feeding activity. For the purpose of<br />
estimating zones of influence, we will<br />
consider that exposure of feeding gray<br />
whales to noise levels of 110 dB or more<br />
(from a continuous stationary source, such<br />
as from a drillship) would result in pos-<br />
sible avoidance of the region near the<br />
source <strong>and</strong> exposure to levels of 120 dB or<br />
more would probably cause avoidance of the<br />
area by more than one-half of the gray<br />
whales.<br />
Air gun noise<br />
More data on focal whales <strong>under</strong><br />
control <strong>and</strong> experimental <strong>conditions</strong> are<br />
needed before firm conclusions regarding<br />
the effects of air gun operations on<br />
feeding gray whales can be made. The<br />
present data set shows that feeding gray<br />
whales can respond in a variety of ways to<br />
a moving, single air gun <strong>and</strong> that these<br />
responses can occur at RSL ranging from<br />
149 dB to 176 dB, with whale distance up<br />
to 4 km from the source.<br />
The cumulative distribution of whales<br />
observed to interrupt feeding activity as<br />
a function of average pulse pressure level<br />
shown previously in Fig. 9 was somewhat<br />
skewed. For skewed distributions, the<br />
median is a better estimator for the<br />
expected value than is the mean (Zar 1974,<br />
p. 24). Thus, an average peak pressure<br />
level of 173 dB will be considered as the<br />
level of air gun noise at which 50% of<br />
feeding gray whales will probably inter-<br />
rupt feeding activity. Based on the data<br />
shown in Fig. 9 <strong>and</strong> on the confidence<br />
limit calculation, 163 dA will be con-<br />
sidered as the air gun noise level which<br />
will probably cause 10% of feeding gray<br />
whales to interrupt feeding activity.<br />
Comparing these values with the prob-<br />
ability of avoidance values obtained for<br />
migrating gray whales, we find that a 0.1<br />
probability of avoidance occurred for an<br />
air gun noise level of 164 dB <strong>and</strong> a 0.5<br />
probability of avoidance occurred for a<br />
level of 170 dB. The acoustic sensitivity<br />
of gray whales to air gun noise when<br />
feeding is thus apparently not greatly<br />
different from their sensitivity while<br />
migrating.<br />
Acknowledgement<br />
This study was funded by the Minerals<br />
Management Service through an interagency<br />
agreement with the National Oceanic <strong>and</strong><br />
Atmospheric Administration, as part of the<br />
Outer Continental Shelf finvironmental<br />
Assessment Program.
References<br />
Baker, C.S., L.M. Herman, B.G. Bays, <strong>and</strong><br />
G.B. Bauer 1983. The impact of vessel<br />
traffic on the behavior of humpback whales<br />
in Southeast Alaska: 1982 season. Re<strong>port</strong><br />
from the Kewalo Basin Marine Mammal<br />
Laboratory, University of Hawaii, Honolulu<br />
for U.S. National Marine Fisheries<br />
Service, Seattle, WA. 30 p. <strong>and</strong> tables<br />
<strong>and</strong> figures.<br />
Brodie, P.F. 1981. Energetic <strong>and</strong><br />
behavioural considerations with respect to<br />
marine mammals <strong>and</strong> disturbances from<br />
<strong>under</strong>water noise. p. 287-290 In: N.M.<br />
Peterson (ed.), The question of sound from<br />
icebreaker operations: Proceedings of a<br />
workshop. February 22-23, 1981, Toronto.<br />
Arctic Pilot Project, Petro-Canada,<br />
Calgary, Alberta. 350 p.<br />
Dean, F.C., C.M. Jurasz, V.P. Palmer, C.H.<br />
Curby, <strong>and</strong> D.L. Thomas 1985. Analysis of<br />
humpback whale (Megaptera novaeangliae)<br />
blow interval data Glacier Bay, Alaska,<br />
1976-1979. Re<strong>port</strong> from the University of<br />
Alaska, Fairbanks, for U.S. National Park<br />
Service, Anchorage, AK. 224 p. <strong>and</strong> second<br />
volume of figures.<br />
Harvey, J.T. <strong>and</strong> B.R. Mate 1984. Dive<br />
characteristics <strong>and</strong> movements of radio-<br />
tagged gray whales in San Ignacio Lagoon,<br />
Baja California Sur, Mexico. p. 561-575<br />
In: M.L. Jones, S.L. Swartz, <strong>and</strong> S.<br />
Leatherwood (eds .) , The gray whale<br />
Eschrichtius robustus. Academic Press,<br />
Orl<strong>and</strong>o, FL. 600 p.<br />
Ljungblad, D.K. tf. wUrsig, S.L. Swartz,<br />
<strong>and</strong> J.M. Keene 1985. Observations on the<br />
behavior of bowhead whales (Balaena<br />
mysticetus) in the presence of operating<br />
seismic exploration vessels in the Alaskan<br />
Beaufort Sea. Re<strong>port</strong> from SEACO, Inc.,<br />
San Diego for the Minerals Management<br />
Service, Anchorage, AK. 53 p. <strong>and</strong><br />
appendices.<br />
Mackensie, K.V., 1973. Long-range<br />
propagation in the shallow Bering Sea, J.<br />
Acoust. Soc. Am. 54(4):1066-1080.<br />
Malme, C.I., P.R. Miles, C.W. Clark, P.<br />
Tyack, <strong>and</strong> J.E. Bird 1983. Investigations<br />
of the potential effects of <strong>under</strong>water<br />
noise from petroleum industry activities<br />
on migrating gray whale behavior. Re<strong>port</strong><br />
No. 5366, re<strong>port</strong> prepared by tfolt Beranek<br />
<strong>and</strong> Newman Inc., Cambridge, MA, for the<br />
Minerals Management Service, Anchorage,<br />
AK. Various paging.<br />
Malme, C.I., P.R. Miles, C.W. Clark, P.<br />
Tyack, <strong>and</strong> J.E. Bird 1984. Investigations<br />
of the potential effects of <strong>under</strong>water<br />
noise from petroleum industry activities<br />
on migrating gray whale behavior - Phase<br />
11: January 1984 migration. Re<strong>port</strong> No.<br />
5586, re<strong>port</strong> prepared by Bolt Beranehc <strong>and</strong><br />
Newman Inc., Cambridge, MA, for tne<br />
Minerals Management Service, Anchorage,<br />
AK. Various paging.<br />
Malme, C.I., P.R. Miles, P. Tyack, C.W.<br />
Clark, <strong>and</strong> J.E. Bird 1985. Investigation<br />
of the potential effects of <strong>under</strong>water<br />
noise from petroleum industry activities<br />
on feeding humpback whale behavior.<br />
Re<strong>port</strong> No. 5851, re<strong>port</strong> prepared by BBN<br />
Laboratories Inc., Cambridge, MA, for the<br />
Minerals Management Service, Anchorage,<br />
AK. Various paging.<br />
Malme, C.I., B. w;rsig, J.E. Bird, <strong>and</strong> P.<br />
Tyack 1986. Behavioral responses of gray<br />
whales to industrial noise: feeding<br />
observations <strong>and</strong> predictive modeling.<br />
Re<strong>port</strong> No. 6265, re<strong>port</strong> prepared by BBN<br />
Laboratories Inc., Cambridge, MA, for<br />
NUAA, Anchorage AK. Various paging.<br />
Richardson, W.J., B. w;rsig, <strong>and</strong> C.K.<br />
Greene, Jr. 1986. Reactions of bowhead<br />
whales, Balaena mysticetus, to seismic<br />
exploration in the Canadian Beaufort Sea.<br />
J. Acoust. Soc. Am. 79(4):1117-1128.<br />
Kichardson, W.J., M.A. Fraker, B. w;rsig,<br />
<strong>and</strong> R.S. Wells 1985. Behaviour of bowhead<br />
whales Balaena mysticetus summering in the<br />
Beaufort Sea: Reactions to industrial<br />
activities. Biol. Conserv. 32(3):195-230.<br />
Richardson, W.J., R.S. Wells, <strong>and</strong><br />
B. Wursig 1985. Disturbance responses of<br />
bowheads, 1980-84. p. 89-196 In: W.J.<br />
Richardson (ed.), Behavior, disturbance<br />
responses <strong>and</strong> distribution of bowhead<br />
whales Balaena mysticetus in the eastern<br />
Beaufort Sea, 1980-84. Re<strong>port</strong> from LGL<br />
Ecol. Res. Assoc., Inc., Bryan, TX, for<br />
the Minerals Management Service, Reston,<br />
VA. 306 p.<br />
Sokal, R.R. <strong>and</strong> F.J. Rohlf 1969. Biometry<br />
- The principles <strong>and</strong> practice of<br />
statistics in biological research. W.H.<br />
Freeman & Co., San Francisco, CA. 776 p.
Thompson, W.R. 1936. On confidence ranges<br />
for the median <strong>and</strong> other expectation<br />
distributions for populations of unknown<br />
distribution form. Ann. Math. Statist.<br />
7: 122.<br />
Thomson, D.H. (ed.) 1984. Feeding ecology<br />
of gray whales (Eschrichtius robustus) in<br />
the Chirikof Basin, summer 1982. Re<strong>port</strong><br />
from LGL Alaska Research Associates, Inc.,<br />
Anchorage, AK for NOAA, Juneau, AK. 222 p.<br />
Tyack, P. 1981. Interactions between<br />
singing humpback whales <strong>and</strong> conspecifics<br />
nearby.<br />
116.<br />
~~~~~<br />
Behav. Ecol. Sociobiol. 8(1):105-<br />
Urick, K.J. 1983. Principles of <strong>under</strong>-<br />
water sound for engineers, 3rd edition,<br />
McGraw-Hill, New York. 423 p.<br />
w;rsig, B. 1978. On the behavior <strong>and</strong><br />
ecology of bottlenose <strong>and</strong> dusky dolphins.<br />
Ph.0. Dissertation, State University of<br />
New York at Stony firook. 326 p.<br />
wursig, B., E.M. Dorsey, M.A. Fraker, K.S.<br />
Payne, W.J. Kichardson, <strong>and</strong> K.S. Wells<br />
1984. Behavior of bowhead whales, Balaena<br />
mysticetus, summering in the Beaufort Sea:<br />
surfacing, respiration, <strong>and</strong> dive char-<br />
acteristics. Can. J. Zool. 62(10):1910-<br />
1921.<br />
w
START TIME: 73000<br />
STOP TIME : U4000 LEGEND<br />
b =big<br />
=<br />
22 Aug 1985 Pre-AG 1 Control<br />
I 3.0 4 0 5.0 6 0<br />
Kilometers Eost<br />
Figure 10. Track plot of whale E during<br />
pre-AGI control on 22 August.<br />
incides with the first appearance of the<br />
sun all day, thereby making mud at the<br />
water's surface more easily visible to<br />
observers). At this time, the whale was<br />
approximately 0.5 km northeast of its pre-<br />
AG 1 control position. The whale stayed<br />
in this same general area, feeding,<br />
through the post-AG 1 control period.<br />
Zodiac personnel noted that after the end<br />
of AG 1, other whales were also moving<br />
inshore to the general area of Whale E.<br />
AG 4, 24 August, 1929-2026<br />
Whale B was observed to be feeding<br />
during the control period between AG 3 <strong>and</strong><br />
AG 4. Figure 13 shows the movement pat-<br />
tern of this whale relative to the NANCY H<br />
during AG 4. At the onset of AG 4, RSL at<br />
Whale B was 159 dB with the NANCY H 1.75<br />
km to the north. Whale B continued to<br />
feed <strong>and</strong> between 1942-1954 was moving<br />
slowly to the north, toward the NANCY H,<br />
which was motoring southward. During this<br />
period, RSL was increasing <strong>and</strong> at 1957 it<br />
-I. 6 (<br />
START TIME: U4000<br />
STOP TIME : 160000<br />
22 Aug 1985 AG 1<br />
2.0 3.0 4 0 5 0<br />
Kilometer; Eost<br />
LEGEND<br />
A =big<br />
= non<br />
n= e<br />
Figure 11. Track plot of whale E during<br />
AGl on 22 August.<br />
had reached 176 dM with the NANCY H<br />
0.18 Km directly offshore of Whale B. At<br />
this point, observers noted that the whale<br />
had turned <strong>and</strong> was moving rapidly to the<br />
south, diving with flukes out. This was<br />
the first time during the entire period of<br />
observation that Whale B displayed a full<br />
fluke out upon diving, <strong>and</strong> this action was<br />
unusual since the whale was in shallow<br />
water (depth < 9 m) in which fluke outs do<br />
not normally occur. The whale continued<br />
to move south, <strong>and</strong> at 2002 another full<br />
fluke out was noted. At this point, RSL<br />
had reached a peak of 177 dB with the<br />
NANCY H 0.17 km distant. Mud was observed<br />
with this dive, <strong>and</strong> Whale B was presumed<br />
to be feeding. The whale continued moving<br />
slowly to the south until approximately<br />
2011, at which time it began to mill. By<br />
2015, mud was again associated with Whale<br />
B, <strong>and</strong> the whale continued to feed<br />
throughout the remainder of AG 4, staying<br />
in the same general location. RSL at<br />
Whale B was decreasing during this period<br />
<strong>and</strong> by the end of the experiment was 159<br />
dB, with the NANCY H 1.80 tan to the south-<br />
east of the whale's location. Whale B<br />
continued to feed during the post AG 4<br />
control <strong>and</strong> was last observed at 2042.
START TIME: 160000<br />
LEGEND<br />
STOP TIME : 171000<br />
= non<br />
x=<br />
22 Aug 1985 Post-AG 1 Control<br />
3.0 4.0 & 0 I<br />
I 1.0 4.0 5 0<br />
Kilometers East-<br />
Figure 12. Track plot of whale E during<br />
post-AGI on 22 August.<br />
START TIME: 192900<br />
STOP TIME : 202600<br />
24 Aug 1985 AG 4<br />
LEGEND<br />
A = non<br />
*= b<br />
Figure 13. Track plot of whale B during<br />
AG4 on 24 August.
Abstract<br />
INDUSTRY OBSERVATIONS OF BOWHEAD WHALES<br />
IN THE CANADIAN BEAUFORT SEA, 1976-1985<br />
In 1976 Canadian Marine Drilling<br />
Ltd. (Canmar) began exploratory<br />
drilling in the deeper offshore<br />
waters of the Canadian Beaufort Sea<br />
using drillships sup<strong>port</strong>ed by<br />
icebreaking supply boats <strong>and</strong><br />
icebreakers. As part of the terms<br />
<strong>and</strong> <strong>conditions</strong> of the approval for<br />
this activity, Canmar personnel were<br />
requested to record incidental<br />
sightings of wildlife in general <strong>and</strong><br />
of marine mammals in particular<br />
during the course of their offshore<br />
exploration activities. This paper<br />
summarizes all bowhead whale<br />
sightings recorded by Canmar<br />
personnel since 1976 <strong>and</strong> discusses<br />
these sightings with respect to the<br />
bowhead whale issue in the Canadian<br />
Beaufort Sea. Namely, it has been<br />
suggested that exploration activities<br />
in the Canadian Beaufort have caused<br />
bowheads to decrease their use of the<br />
area where the exploration activity<br />
has occurred. An alternative<br />
suggestion is that the distribution<br />
of bowheads in the Canadian Beaufort<br />
This is a reviewed <strong>and</strong> edited version of a paper<br />
presented at the Ninth International Conference on<br />
Port <strong>and</strong> Ocean Engineering Under Arctic Conditions,<br />
Fairbanks, Alaska, USA, August 17-22, 1987. @ The<br />
Geophysical Institute, University of Alaska, 1987.<br />
John G. Ward<br />
E. Pessah<br />
Dome Petroleum Limited, Calgary, Alberta, CANADA<br />
Sea has varied from year to year<br />
because of a varying distribution of<br />
the zooplankton on which bowheads<br />
feed. The Canmar incidental<br />
sightings are examined in relation to<br />
the first of these hypotheses <strong>and</strong> to<br />
the various other studies that have<br />
been carried out on bowheads in the<br />
Canadian Beaufort Sea. It is<br />
concluded that the incidental<br />
sightings, together with the results<br />
of other studies, do not sup<strong>port</strong> the<br />
suggestion of a trend to decreasing<br />
use of the exploration area by<br />
bowheads.<br />
Introduction<br />
In 1976, Canadian Marine<br />
Drilling Ltd. (Canmar) began<br />
exploratory drilling in the deeper<br />
(20-65 m) offshore waters of the<br />
Canadian Beaufort Sea region (Figure<br />
1) using drillships sup<strong>port</strong>ed by<br />
icebreaking supply boats <strong>and</strong><br />
icebreakers. Prior to 1976, all<br />
exploratory drilling activity in the<br />
region had been located onshore or in<br />
nearshore waters adjacent to the<br />
Mackenzie Delta <strong>and</strong> Tuktoyaktuk<br />
Peninsula. The nearshore drilling<br />
activity had been carried out from<br />
artificial isl<strong>and</strong>s constructed in<br />
waters less than 15 m deep.
Figure 1. The Canadian Beaufort Sea.<br />
As part of the terms <strong>and</strong> <strong>conditions</strong><br />
of the government approval of<br />
offshore drilling with drillships,<br />
Canmar was requested to have their<br />
personnel record incidental sightings<br />
of wildlife during the course of the<br />
exploration activities in the<br />
Beaufort Sea. This activity was<br />
initiated in 1976 <strong>and</strong> has been<br />
continued each year since that time.<br />
One species of wildlife that<br />
occurs in the eastern Canadian<br />
Beaufort Sea <strong>and</strong> that is of<br />
articular interest is the bowhead<br />
whale (Balaena mysticetus). It is<br />
classified as an endangered species<br />
in both Canada <strong>and</strong> the U.S. The<br />
western Arctic population of this<br />
species is the largest remaining<br />
stock <strong>and</strong> is estimated to number<br />
approximately 4,400 individuals (IWC<br />
1986). This stock of bowheads<br />
winters in the Bering Sea <strong>and</strong> summers<br />
in the eastern Beaufort Sea. During<br />
the spring <strong>and</strong> fall migration through<br />
the Chukchi <strong>and</strong> western Beaufort seas<br />
adjacent to Alaska, the whales are<br />
subject to a subsistence hunt by<br />
Alaska Eskimos.<br />
Since 1980, systematic aerial<br />
surveys of bowhead whale distribution<br />
have been carried out annually in the<br />
southeastern Beaufort Sea during the<br />
last half of August <strong>and</strong> first half of<br />
September (e.g. Davis et al. 1982;<br />
Duval et al. 1986). Also, beginning<br />
in 1980 <strong>and</strong> continuing until 1984, a<br />
major bowhead whale behaviour study<br />
was carried out in the southeasteri<br />
Beaufort Sea to examine the<br />
behavioural responses of bowheads to<br />
oil exploration activities
(Richardson 1985). The latter study<br />
raised a concern about exploration<br />
activities in the Canadian Beaufort<br />
Sea.<br />
The issue as it presently exists<br />
for summering bowheads in the<br />
Canadian Beaufort Sea has been<br />
described by Duval et al. (1986) as<br />
follows. "Two hypotheses have been<br />
formulated as part of the Beaufort<br />
Environmental Monitoring Project<br />
(BEMP) to explain the annual<br />
variability in the distribution of<br />
bowhead whales observed in the<br />
southeastern Beaufort Sea since<br />
systematic aerial surveys were<br />
initiated in 1980 (INAC <strong>and</strong><br />
Environment Canada 1984, 1985). One<br />
hypothesis suggests that activities<br />
of the oil <strong>and</strong> gas industry have<br />
caused, or contributed to, the<br />
exclusion of bowheads from the<br />
industrial zone (the lexclusion<br />
hypothesis1). The other hypothesis<br />
suggests that the distribution of<br />
bowheads is determined by physical<br />
<strong>and</strong> biological <strong>ocean</strong>ographic factors,<br />
particularly those influencing the<br />
distribution <strong>and</strong> abundance of<br />
zooplankton (the 'food hypothesis1).<br />
During the most recent [I9861 BEMP<br />
workshop addressing the bowhead whale<br />
(INAC <strong>and</strong> Environment Canada 1987),<br />
it was concluded that testing of<br />
these hypotheses is unlikely to be<br />
possible within a sound statistical<br />
framework <strong>and</strong>, therefore, must rely<br />
on the lweight-of-evidencel from past<br />
<strong>and</strong> future research <strong>and</strong> monitoring<br />
efforts directed at this species.''<br />
The purpose of this paper is to<br />
examine the Canmar incidental<br />
sightings of bowhead whales in<br />
relation to the exclusion hypothesis<br />
<strong>and</strong> to the various studies that have<br />
been carried out on bowheads in the<br />
eastern Beaufort Sea.<br />
Methods<br />
The recording of wildlife<br />
sightings by Canmar has varied to<br />
some extent between years <strong>and</strong> types<br />
of vessels. Prior to 1980, only<br />
drillship personnel were involved in<br />
the recording of sightings of<br />
wildlife, whereas in 1980 <strong>and</strong><br />
subsequent years, personnel on both<br />
drillships <strong>and</strong> sup<strong>port</strong> vessels<br />
recorded sightings of wildlife.<br />
Most observation activity by<br />
personnel both on the drillships <strong>and</strong><br />
on the sup<strong>port</strong> vessels was<br />
op<strong>port</strong>unistic in nature. However, on<br />
the drillships, limited systematic<br />
observations were also carried out.<br />
Ice observers on the drillships<br />
carried out a 10 minute wildlife<br />
watch every four hours during a 12<br />
hour shift, if work, weather <strong>and</strong><br />
light <strong>conditions</strong> permitted. When two<br />
ice observers were on board each<br />
drillship to provide 24 hour ice<br />
re<strong>port</strong>ing coverage, up to six watches<br />
per day could be conducted.<br />
Generally, only three or four such<br />
watches were <strong>under</strong>taken each day.<br />
Since 1981, ice observers have<br />
carried out either 10 or 15 minute<br />
long watches, with the length of<br />
watch used on each drillship being<br />
the same throughout the drilling<br />
season each year.<br />
As summarized in the next<br />
section, most whale sightings<br />
resulted from op<strong>port</strong>unistic<br />
observations. Because the actual<br />
level of observational effort<br />
expended by personnel on various<br />
vessels in making these sightings is<br />
unknown, there is no good <strong>com</strong>parative<br />
measure of overall effort on a<br />
year-to-year basis. However, it is<br />
suggested that the number of Canmar<br />
vessels operating in the offshore<br />
waters each year can serve as an<br />
approximate indicator of<br />
observational effort made each year.<br />
The number of vessels are shown in<br />
Table 1.<br />
Results<br />
The Canmar sightings of bowhead<br />
<strong>and</strong> unidentified whales since 1976<br />
are summarized in Table 2 according<br />
to whether they were re<strong>port</strong>ed by<br />
personnel on the drillships or on the<br />
various sup<strong>port</strong> vessels. The<br />
sightings of unidentified whales have<br />
been included because it is felt the<br />
majority of these will be bowhead<br />
rather than beluga whales. The<br />
distinctive white or cream colour of
TABLE 1<br />
Number of Canmar Vessels in Offshore Waters of the Eastern Beaufort Sea<br />
VESSEL TYPE 1976 ----------<br />
1977 1978 1979 1980 1981 1982 1983 1984 1985<br />
Drillships 1* 3** 3 4 4 4 4 4 4 4<br />
SupplylSt<strong>and</strong>by*** - - - - 17 22 18 17 17 18<br />
DredgesIBarge Tugs 0 0 0 0 0 4 3 5 1 0<br />
* Three drillships were present but only one was involved in recording wildlife<br />
observations.<br />
** Three drillships recorded sightingsy but records were available only for one ship.<br />
*** Personnel on these vessels did not record sightings prior to 1980.<br />
TABLE 2<br />
Summary of Number of Sightings (<strong>and</strong> Total Numbers seen1) of Bowhead <strong>and</strong> Unidentified<br />
Whales Re<strong>port</strong>ed by Canmar Personnel during the Period August 1 - September 10 for the<br />
Years 1976 - 1985.<br />
Drillships Sup<strong>port</strong> vessels 2<br />
Bowhead Unidentified<br />
~otal~<br />
Supply<br />
Drillships Vessels<br />
1 Numbers in parentheses are total number of whales seen for all sightings.<br />
Data from ~ome/Canmar (1978Â 1979, l98Oy 1982Â 1984ay 1984b, 1985) <strong>and</strong> Marex<br />
(1977).<br />
2 Includes supply/st<strong>and</strong>by vessels <strong>and</strong> dredgeslbarge tugs shown in Table 1.<br />
3 Bowhead <strong>and</strong> unidentified whales.<br />
4 Four sightings of bowheads in 1980 <strong>and</strong> one sighting in 1981 were made during<br />
the systematic watches. All other sightings of both bowhead <strong>and</strong> unidentified<br />
whales resulted from op<strong>port</strong>unistic observations.
adult beluga whales would make them<br />
relatively easy to identify at close<br />
range* but their <strong>com</strong>paratively small<br />
size would make them difficult to<br />
detect at greater distances (Norton<br />
<strong>and</strong> Harwood 1986; Duval et al.<br />
1986). Hence it is probable that<br />
belugas* if seen* would generally be<br />
identified to species. The much<br />
larger bowheads would be easier to<br />
detect at greater distancesy but<br />
their black colouration would<br />
probably create doubt as to species<br />
for some observers if the whale was a<br />
long distance away. Hence bowheads<br />
are more likely to be seen at greater<br />
distances from the vessel than beluga<br />
whales* but such whales may be<br />
classed often as unidentified whales.<br />
Only sightings made during the<br />
period August 1 to September 10 have<br />
been included in Table 2. This time<br />
frame was selected because it<br />
corresponds to the one selected by<br />
Richardson et al. (1985) to show the<br />
zones of industrial activity in the<br />
southeastern Beaufort Sea <strong>and</strong> the<br />
qualitative depictions of the<br />
abundance <strong>and</strong> distribution of<br />
bowheads in this region for the years<br />
1980 - 1984.<br />
With the exception of 19773 1980<br />
<strong>and</strong> l98ly drillship personnel<br />
re<strong>port</strong>ed very few sightings of whales<br />
each year (Table 2). On the other<br />
h<strong>and</strong>* personnel on sup<strong>port</strong> vessels<br />
re<strong>port</strong>ed the majority of the whale<br />
sightings in all years since 1980<br />
when they began re<strong>port</strong>ing sightings.<br />
However* when the differences in<br />
numbers of drillships versus numbers<br />
of sup<strong>port</strong> vessels is considered*<br />
then the numbers of sightings are<br />
more similar for the two types of<br />
vessels. Like the drill ship^^<br />
sup<strong>port</strong> vessels re<strong>port</strong>ed largest<br />
numbers in 1980 <strong>and</strong> l98ly <strong>and</strong> lower<br />
numbers in 1982 - 1985. However*<br />
unlike the drill~hips~ the numbers of<br />
sightings recorded by sup<strong>port</strong> vessels<br />
in 1982-85 as <strong>com</strong>pared to 1980-81 did<br />
not show as large a decrease as that<br />
which occurred for drillships.<br />
Discussion<br />
The Canmar incidental sightings<br />
data provide a reasonable indication<br />
of the relative abundance of bowhead<br />
whales within the overall industrial<br />
zone <strong>and</strong> contribute to the<br />
"weight-of-evidence'' with respect to<br />
the validity of the 'exclusion<br />
hypothesis'. Before considering<br />
these two aspects y we review the<br />
results of studies conducted during<br />
the two bowhead research initiatives<br />
started in 1980 <strong>and</strong> previously<br />
mentioned in the Introduction.<br />
Bowhead Research Studies<br />
The two bowhead research<br />
programs that were started in the<br />
eastern Beaufort Sea in 1980 have<br />
provided a substantive systematic<br />
data base on the relative abundance<br />
<strong>and</strong> distribution of bowheads in the<br />
Canadian Beaufort Sea in August <strong>and</strong><br />
early September y from 1980 to the<br />
present. Richardson et al. (1985)<br />
summarized the data from these<br />
research studies in the form of maps<br />
that showed all sightings of bowheads<br />
in the southeastern Beaufort Sea<br />
during 10-day periods from August 1<br />
to September loy for the years 1980 -<br />
1984. They also summarized the zones<br />
of industrial activity on these maps<br />
for the same periods.<br />
Figure 2 contains <strong>com</strong>posite maps<br />
adapted from Richardson et al. (1985)<br />
that show the zones of industrial<br />
activity <strong>and</strong> the relative abundances<br />
<strong>and</strong> distributions of bowheads seen<br />
during the entire period August 1 -<br />
September 10 for the years 1980 -<br />
1985. They also include the<br />
locations of drillship activity. The<br />
map that is included for 1985 is<br />
based on the results presented by<br />
hval et al. (1986). The maps are<br />
based on the technique used by<br />
Richardson et al. (1985) to summarize<br />
the relative abundance <strong>and</strong><br />
distribution of bowheads during<br />
individual 10-day periods for the<br />
years 1980-84. Areas of abundance<br />
that are designated on these maps as<br />
few* moderate <strong>and</strong> many are those<br />
with3 respectively3 widely separated<br />
sightings of 1-3 whales* many<br />
sightings of 1-3 whales* <strong>and</strong> large<br />
groups of whales (Richardson et al.<br />
1985). The technique is highly<br />
qualitative <strong>and</strong> is presented here
Bowhead Abundance<br />
Many Moderate Few None<br />
--- Industrial Zone Boundary A Canrnar Drillship Location<br />
August 1 - September 10, 1981- -"'''<br />
August 1 - September 10, 1982<br />
,,w ,W' we' ,>.<br />
Beeufo,!<br />
-.<br />
'=' ,,? >w<br />
Beaufort<br />
sea 8<br />
August 1 - September 10, 1983<br />
'"" UP' >w 82.' ,<br />
8ea"rorf<br />
sea 8<br />
Figure 2. Relative Abundances <strong>and</strong> Distributions of Bowheads in the Eastern Beaufort<br />
Sea, 1980 - 1985.
primarily to provide the reader with<br />
an overall impression of where<br />
bowheads were seen in general in the<br />
years 1980-85 <strong>and</strong> where<br />
concentrations (I. e. "many "1 occurred<br />
specifically, relative to the<br />
location of industry activity.<br />
Richardson et al. (1985)<br />
described the relative abundances <strong>and</strong><br />
distributions indicated by the survey<br />
data from 1980 - 1984 as follows.<br />
"Over the 1980 - 1982 period, bowhead<br />
distribution overlapped progressively<br />
less with the area of offshore<br />
dredging, construction <strong>and</strong> drilling.<br />
Bowheads were abundant within the<br />
main industrial area in 1980, much<br />
less abundant there in 1981, <strong>and</strong><br />
virtually absent in 1982. Maximum<br />
numbers in the main industrial area<br />
in 1983 were slightly greater than in<br />
1982, <strong>and</strong> there was some further<br />
increase in 1984". Richardson et al.<br />
(1987) concluded that "utilization of<br />
the main industrial area decreased<br />
markedly from 1980 to 1982 <strong>and</strong> then<br />
increased slightly from 1982 to<br />
1983-84." On the basis of an<br />
apparent overall downward trend from<br />
1980 to 1984, Richardson et al.<br />
(1985, 1987) suggested that industry<br />
activity may be affecting utilization<br />
of the industrial zone by bowheads.<br />
A significant assumption of this<br />
apparent trend is that 1980 <strong>and</strong> 1981<br />
are representative of the historical<br />
"normal" bowhead distribution in the<br />
Canadian Beaufort.<br />
Although Figure 2 indicates that<br />
in the years 1982 - 1985 most<br />
bowheads occurred outside the<br />
industrial zone, localized<br />
concentrations did occur within the<br />
zone in 1983 <strong>and</strong> 1984. In both<br />
years, these localized concentrations<br />
occurred in the offshore area of<br />
east-central Mackenzie Bay,<br />
approximately along the 20 m depth<br />
contour line.<br />
Prior to 1980, limited aerial<br />
surveys north of Kugmallit Bay in<br />
1978 <strong>and</strong> 1979, <strong>and</strong> incidental<br />
sightings by biologists <strong>and</strong> industry<br />
personnel (non-Canmar) in that area<br />
in 1976 - 1977, provide less detailed<br />
but useful additional data.<br />
According to Richardson et al.<br />
(19851, "The fragmentary data from<br />
1976 - 1979 indicate that many<br />
bowheads were seen in the middle of<br />
the main industrial area [i.e., north<br />
of Kugmallit Bay] in early August of<br />
1976 <strong>and</strong> 1977, but not in 1978 or<br />
1979. Bowheads apparently entered<br />
the industrial area in early<br />
September of 1978, but in 1979 there<br />
were very few sightings at any<br />
time." Richardson et al. (1985,<br />
1987) concluded that "the presence of<br />
many whales in 1980, after a period<br />
of apparent scarcity in 1978 - 1979,<br />
casts doubt on the suggestion that<br />
there is a trend for decreasing<br />
utilization of the main industrial<br />
area." As discussed below, the<br />
evidence indicates that the apparent<br />
trend is likely an artifact of the<br />
data initially used to suggest the<br />
trend.<br />
Canmar Incidental Sightings<br />
A <strong>com</strong>parison of the incidental<br />
sightings results (Table 2) <strong>and</strong> the<br />
systematic aerial survey results show<br />
that the Canmar incidental sightings<br />
for the years 1980 - 1985 provide an<br />
indication of the relative abundance<br />
of bowheads in the industrial zone<br />
that is reasonably similar to that<br />
shown by the aerial surveys (Table<br />
3). Namely, bowheads were abundant<br />
in the industry zone in 1980 <strong>and</strong><br />
1981, <strong>and</strong> relatively scarce there in<br />
1982 - 1985. Even if the<br />
unidentified whales, which are<br />
suspected to be largely bowheads,<br />
were added to Table 3, the trend does<br />
not change. The similarity between<br />
these two data sources provides the<br />
confidence to use the 1976 - 1979<br />
Canmar incidental sightings data to<br />
make statements about the presence of<br />
bowheads in the industrial zone in<br />
those years (Figure 3).<br />
The small numbers of bowhead<br />
sightings by Canmar personnel in 1978<br />
<strong>and</strong> 1979 (Table 2) indicate that<br />
bowheads were not abundant in the<br />
industrial zone during the August 1 -<br />
September 10 period in those two<br />
years. Richardson et al. (1985) made<br />
the same suggestion based on other<br />
incidental sightings <strong>and</strong> limited<br />
survey coverage in the area<br />
immediately north of Kugmallit Bay in
- Year<br />
1980<br />
1981<br />
1982<br />
1983<br />
1984<br />
1985<br />
TABLE 3<br />
Comparison of the Canmar Incidental Sightings<br />
<strong>and</strong> the Systematic Aerial Surveys of Bowhead Whales<br />
Sup<strong>port</strong> August Aerial survey2 September Aerial survey2<br />
Drillship Vessel Industry Industry<br />
sightingsl sightingsl zone 3 Entire Area zone3 Entire Area<br />
1 Numbers in parentheses indicate total number of bowhead whales seen for all<br />
sightings. (Values from Table 2).<br />
2 Numbers include both bowheads seen on the transects <strong>and</strong> those seen beyond the<br />
transects. Data taken from Renaud <strong>and</strong> Davis (19811, Davis et al. (19821, Harwood<br />
<strong>and</strong> Ford (1983), McLaren <strong>and</strong> Davis (19851, Harwood <strong>and</strong> Borstad (19851, <strong>and</strong> Duval et<br />
al. (1986).<br />
3 Industry zone for each year same as one shown on Figure 2.<br />
4 1980 survey area mostly in the industry zone.<br />
those two years. It is expected that<br />
drillships would have recorded more<br />
whale sightings during the August 1 -<br />
September 10 period in those two<br />
years as was experienced in 1980 <strong>and</strong><br />
1981 if the whales had been<br />
relatively abundant in the industrial<br />
zone. For example, in 1979, Explorer<br />
IV personnel recorded five sightings<br />
of approximately 30 bowheads in total<br />
at the Natsek site west of Herschel<br />
Isl<strong>and</strong> after September 10. In that<br />
same year <strong>and</strong> month Ljungblad (1981),<br />
who was carrying out bowhead surveys<br />
for the U.S. Eernment, also<br />
recorded significant numbers of<br />
bowheads 56 km west of Natsek. A<br />
drillship was present at Natsek in<br />
1978 also, from September 3 to<br />
October 14, but no whale sightings<br />
were re<strong>port</strong>ed. In 1978, the four<br />
sightings of bowheads <strong>and</strong><br />
unidentified whales by Canmar<br />
personnel (Table 2) consisted of one<br />
sighting from the Tarsiut site <strong>and</strong><br />
three sightings from the Ukalerk<br />
site. Only beluga sightings were<br />
recorded at the Nerlerk <strong>and</strong> Kopanoar<br />
sites (Dome/Canmar 1978). The<br />
sightings in the Ukalerk area were<br />
immediately offshore of Kugmallit Bay<br />
where Fraker (1978) also re<strong>port</strong>ed<br />
bowhead sightings in early September<br />
1978. Thus the drillship sightings<br />
in 1978 <strong>and</strong> 1979 agree with the<br />
results of other studies in those two<br />
years <strong>and</strong> provide additional evidence<br />
of the relative absence of bowheads<br />
in the industrial zone in those two<br />
years.<br />
It is suggested that in 1977,<br />
bowheads were also relatively scarce<br />
in the overall industry zone,<br />
although unlike 1978 <strong>and</strong> 1979,<br />
bowheads were locally abundant in the<br />
area north of Kugmallit Bay <strong>and</strong> Toker<br />
Point. ~ome/Canmar (1979) re<strong>port</strong>ed<br />
that most whale sightings in 1977<br />
occurred at the Ukalerk drill site<br />
located NNE of Kugmallit Bay, <strong>and</strong><br />
unpublished information indicated<br />
that bowheads were sighted in the<br />
Ukalerk area by Canmar personnel from<br />
August 20 to September 20. All of<br />
this is consistent with the findings<br />
summarized by Richardson et al.<br />
(1985). Drillships were also located<br />
at the Nektoralik <strong>and</strong> Kopanoar sites<br />
in 1977 (Figure 3).<br />
The relatively large number of
9<br />
Auaust 1 - September 10.1976<br />
August 1 - September 10,1978<br />
ACanmar Dnllsh#p Location<br />
Beauloff<br />
ACanmar Dnllship Location<br />
Sea k<br />
Yukon \ .~tl\'^L\<br />
iugust 1 - September tu, iyrf<br />
kcanmar Dnllship Location<br />
Beaulort<br />
sea 8<br />
Figure 3. Offshore Industrial Area, 1976 - 1979.<br />
sightirigs of bowheads <strong>and</strong><br />
unidentified whales recorded in 1977<br />
differed from those in 1980 <strong>and</strong> 1981<br />
in that the sightings apparently<br />
occurred mostly or entirely at one<br />
site, while in 1980 <strong>and</strong> 1981 the<br />
sightings were distributed among<br />
three <strong>and</strong> four drillships,<br />
respectively (Dome/Canmar 1980,<br />
1982). This suggests that the<br />
distribution in 1980 <strong>and</strong> 1981 was<br />
relatively widespread in the<br />
industrial area, while in 1977 it was<br />
localized in the eastern corner of<br />
the exploration area in the vicinity<br />
of outer Kugmallit Bay <strong>and</strong> Ukalerk.<br />
It is possible that the concentration<br />
of bowheads in 1977 was in fact<br />
widespread off the Tuktoyaktuk<br />
Peninsula <strong>and</strong> that only the western<br />
edge of the concentration overlapped<br />
the exploration area.<br />
In 1976, there was only one<br />
August 1 - September 10, 1979<br />
A Canmar Dnllship Location<br />
124<br />
Beaufort<br />
SM<br />
8W inr' ***<br />
'*' 1M"' IMC' lie ,<br />
Beauloft<br />
sea i<br />
re<strong>port</strong> of 50+ unidentified whales in<br />
two pods seen 29 km SE of Kopanoar on<br />
August 18 by Canmar personnel<br />
travelling on a helicopter (Marex<br />
1977). In view of the number of<br />
whales seen, it is possible this<br />
sighting was of belugas rather than<br />
bowheads. No whales were re<strong>port</strong>ed<br />
from the Tingmiark location between<br />
July 20 <strong>and</strong> August 5, which is<br />
located immediately north of<br />
Kugmallit Bay where Fraker (1977)<br />
first re<strong>port</strong>ed bowheads on August 3.<br />
Fraker (1977) also noted that 1976<br />
was the first time in five years of<br />
beluga whale studies that bowheads<br />
had been observed within his study<br />
area. Although less certain, it<br />
seems likely that within the<br />
industrial zone, bowheads were only<br />
locally abundant in the area north of<br />
Kugmallit Bay <strong>and</strong> Toker Point.<br />
The reason for the relatively
large numbers of sightings by sup<strong>port</strong><br />
vessels in 1982-85 <strong>com</strong>pared to<br />
1980-81 is unknown <strong>and</strong> cannot be<br />
explained by differences in numbers<br />
of such vessels (Table 1). Possibly<br />
because the sup<strong>port</strong> vessels move<br />
about within the industry zone,<br />
personnel have a greater op<strong>port</strong>unity<br />
to encounter either small localized<br />
concentrations of whales or transient<br />
whales that may be present in the<br />
industry zone for only a very brief<br />
time.<br />
In summary, the Canmar<br />
incidental sightings of bowhead<br />
whales indicate that bowhead whales<br />
were relatively abundant <strong>and</strong> widely<br />
distributed in the industrial zone in<br />
1980 <strong>and</strong> 1981, <strong>and</strong> relatively scarce<br />
in the years 1982 - 1985 <strong>and</strong> 1977 -<br />
1979. Localized concentrations<br />
occurred in the industrial zone in<br />
1983 <strong>and</strong> 1984, <strong>and</strong> probably in 1977.<br />
The situation is less clear for 1976,<br />
but bowheads also may have been<br />
relatively scarce in the overall<br />
industrial zone in that year except<br />
for a localized concentration in the<br />
Kugmallit Bay area. The above<br />
interpretation differs from that of<br />
August<br />
Richardson et al. (1985, 1987) who<br />
equated the bowhead sightings north<br />
of Kugmallit in 1976 <strong>and</strong> 1977 to the<br />
widespread abundance observed in the<br />
industrial zone in 1980. In view of<br />
the results of the Canmar incidental<br />
sightings, this seems unlikely.<br />
Historical Whaling Records<br />
Studies of whaling records from<br />
the late 1800's <strong>and</strong> early 1900's also<br />
provide useful information on the<br />
distribution of bowheads relative to<br />
the "industry zone". Townsend (1935<br />
-<br />
in Dalheim et al. 1980) summarized<br />
the locations where bowheads were<br />
taken by Yankee whalers in the<br />
eastern Beaufort in August <strong>and</strong><br />
September 1848 - 1919. That summary<br />
shown in Figure 4 indicates that most<br />
bowheads were taken in areas approxi-<br />
mately west of longitude 138OOO'W <strong>and</strong><br />
east of 131°00'W A few whales (6%)<br />
were taken in the intervening area<br />
which now en<strong>com</strong>passes the primary<br />
exploration area.<br />
Fraker <strong>and</strong> Bockstoce (1980)<br />
analyzed the locations of both<br />
sightings <strong>and</strong> captures of bowheads by<br />
September<br />
I<br />
'LÑ. U.S.A. 1 Canada<br />
Figure 4. Locations where bowheads were harvested by Yankee whalers in the Eastern<br />
(Canadian) Beaufort Sea in August <strong>and</strong> September, 1848 - 1919 (adapted from<br />
Townsend 1935).
<strong>com</strong>mercial whalers in the period 1891<br />
- 1906. Prior to 1900, August<br />
sightings or captures of bowheads<br />
were mainly in areas east of<br />
longitude 131°00' or west of<br />
138°00' as re<strong>port</strong>ed by Townsend<br />
(1935). Approximately 16% of the<br />
sightings or captures in August<br />
occurred in what is now the main<br />
industrial zone. After 1900, when<br />
the stock was presumably<br />
substantially depleted, all of the<br />
relatively few August sightings or<br />
captures were in the eastern Beaufort<br />
east of 13Z0W longitude or in<br />
Amundsen Gulf.<br />
Thus it is interesting that the<br />
approximate area known as the main<br />
Industrial zone today coincides with<br />
an area in which few bowheads were<br />
taken in the period 1848 - 1919. It<br />
is generally assumed that the Yankee<br />
whalers concentrated their hunt for<br />
bowheads in areas where they were<br />
most likely to encounter the whales.<br />
This then strongly suggests that<br />
historically bowheads were also not<br />
present in the zone in large<br />
numbers. In light of this<br />
information, it seems even less<br />
likely that the exclusion hypothesis<br />
is a valid explanation of the bowhead<br />
distribution observed in recent years.<br />
Conclusions<br />
The Canmar incidental sightings<br />
data provide further evidence towards<br />
determination of the relative<br />
abundance or absence of bowheads<br />
within the industrial zone. During<br />
the period from 1976 to 1985 the<br />
incidental sightings data, together<br />
with the results of other studies,<br />
suggest that bowheads were widely<br />
abundant in the exploration zone only<br />
in 1980 <strong>and</strong> 1981, that localized<br />
concentrations occurred in the<br />
industrial zone in 1976, 1977, 1983,<br />
<strong>and</strong> 1984, <strong>and</strong> that bowheads were<br />
largely absent from this zone in<br />
1978, 1979, 1982 <strong>and</strong> 1985.<br />
Historical whaling records indicate<br />
that in the late 1800's <strong>and</strong> early<br />
1900's bowheads were also not<br />
abundant in the area now known as the<br />
main industrial area.<br />
It is concluded, therefore, that<br />
the available information from 1976<br />
to 1985 <strong>and</strong> the historical whaling<br />
information do not sup<strong>port</strong> the<br />
suggestion of a trend for decreasing<br />
utilization of the industrial zone by<br />
bowheads as a result of oil <strong>and</strong> gas<br />
exploration activities. As a result,<br />
the "weight-of-evidence" suggests<br />
that the exclusion hypothesis is<br />
likely invalid.<br />
References<br />
Dalheim, M., T. Bray <strong>and</strong> H.<br />
Braham. 1980. Vessel survey for<br />
bowhead whales in the Bering <strong>and</strong><br />
Chukchi Seas, June-July 1978. Marine<br />
Fisheries Review 42:51-57.<br />
Davis, R.A., W.R. Koski, W.J.<br />
Richardson, C.R. Evans <strong>and</strong> W.G.<br />
Alliston. 1982. Distribution,<br />
numbers <strong>and</strong> productivity of the<br />
western Arctic stock of bowhead<br />
whales in the eastern Beaufort Sea<br />
<strong>and</strong> Amundsen Gulf, summer 1981.<br />
Prep. by LGL Limited, Toronto,<br />
Ontario. Prep. for Dome Petroleum<br />
Limited, Calgary, Alberta, <strong>and</strong> Sohio<br />
Alaska Petroleum Company, Anchorage,<br />
Alaska. 135 p.<br />
Dome/Canmar. 1978. Canmar<br />
wildlife observation program,<br />
Beaufort Sea - 1978 season.<br />
Unpublished Dome/Canmar Technical<br />
Re<strong>port</strong>, Dome Petroleum Ltd., Calgary.<br />
Dome/Canmar. 1979. Environmental<br />
observations in the Beaufort Sea,<br />
1979 season. Wildlife Re<strong>port</strong>.<br />
Unpublished Dome/Canmar Technical<br />
Re<strong>port</strong>, Dome Petroleum Ltd., Calgary.<br />
Dome/Canmar. 1980. Environmental<br />
observations in the Beaufort Sea,<br />
1980 season. Wildlife Re<strong>port</strong>.<br />
Unpublished Dome/Canmar Technical<br />
Re<strong>port</strong>, Dome Petroleum Ltd.,<br />
Calgary. 71p.<br />
Dome /Canmar. 1982. Wildlife<br />
observations in the Beaufort Sea,<br />
1981 season. Unpublished Dome/Canmar<br />
Technical Re<strong>port</strong>, Dome Petroleum<br />
Ltd., Calgary. 77p.<br />
Dome/Canmar. 1984a. Wildlife
observations in the Beaufort<br />
Sea, 1982 season. Unpublished<br />
~omefCanmar Technical Re<strong>port</strong>, Dome<br />
Petroleum Ltd., Calgary.<br />
72p.~ome/Canmar. 1984b.<br />
Wildlife observations in the<br />
Beauf ort Sea, 1983 season.<br />
Unpublished DomefCanmar Technical<br />
Re<strong>port</strong>, Dome Petroleum Ltd.,<br />
Calgary. 70p.<br />
Dome / Canmar. 1985. Wildlife<br />
observations In the Beaufort<br />
Sea, 1984 season. Unpublished<br />
DomefCanmar Technical Re<strong>port</strong>, Dome<br />
Petroleum Ltd., Calgary. 70p.<br />
Duval, W.S. (ed.), L. W. Harwood,<br />
P. Norton, J. Cubbage, J.<br />
Calambokidis, G.A. Borstad, J.C.<br />
Chemiawsky <strong>and</strong> R. Kerr. 1986.<br />
Distribution, abundance <strong>and</strong> age<br />
segregation of bowhead whales<br />
relative to industry activities <strong>and</strong><br />
<strong>ocean</strong>ographic features in the<br />
southeast Beaufort Sea, August -<br />
September 1985. Environmental<br />
Studies Revolving Funds Re<strong>port</strong> 057,<br />
Ottawa.<br />
Fraker, M.A. 1977. The 1977<br />
whale monitoring program,<br />
Mackenzie estuary, N.W.T.<br />
Unpublished re<strong>port</strong> by F.F. Slaney <strong>and</strong><br />
Company Ltd., Vancouver, B.C., for<br />
Imperial Oil Ltd., Calgary.<br />
Fraker, M.A. 1978. The 1978 whale<br />
monitoring program, Mackenzie<br />
Estuary, N.W.T. Unpubl. Rep. by F.F.<br />
Slaney & Co., Vancouver, for Esso<br />
Resources Canada Ltd., Calgary. 28 p.<br />
Fraker, M.A. <strong>and</strong> J.R. Bockstoce.<br />
1980. Summer distribution of<br />
bowhead whales in the eastern<br />
Beaufort Sea. Marine Fisheries<br />
Review 42:57-64.<br />
Harwood, L. <strong>and</strong> G.A. Borstad.<br />
1985. 1984 Beaufort bowhead whale<br />
monitoring study. Unpublished<br />
re<strong>port</strong> by ESL Environmental Sciences<br />
Limited <strong>and</strong> G.A. Borstad Ltd. for the<br />
Environmental Studies Revolving Fund<br />
<strong>and</strong> Indian <strong>and</strong> Northern Affairs<br />
Canada. ESRF 192-14-02.<br />
Harwood, L.A. <strong>and</strong> J.K.B. Ford.<br />
1983. Systematic aerial surveys of<br />
bowhead whales <strong>and</strong> other marine<br />
mammals in the southeastern Beaufort<br />
Sea, August-September 1982.<br />
Unpublished re<strong>port</strong> by ESL<br />
Environmental Sciences Ltd. for Dome<br />
Petroleum Ltd. <strong>and</strong> Gulf Canada<br />
Resources Inc.<br />
Indian <strong>and</strong> Northern Affairs Canada<br />
(INAC) <strong>and</strong> Environment Canada.<br />
1984. Beaufort Sea Environmental<br />
Monitoring Project, 1983 - 1984.<br />
Final Re<strong>port</strong>. Prepared by LGL Ltd.,<br />
ESL Environmental Sciences Ltd. <strong>and</strong><br />
ESSA Ltd. 292p.<br />
Indian <strong>and</strong> Northern Affairs<br />
Canada (INAC) <strong>and</strong> Environment<br />
Canada. 1985. Beauf ort<br />
Environmental Monitoring Project,<br />
1984-1985. Final Re<strong>port</strong>. Prepared<br />
by ESL Environmental Sciences Ltd.,<br />
LGL Ltd., ESSA Ltd., Arctic<br />
Laboratories Ltd. <strong>and</strong> Arctic Sciences<br />
Ltd. 162p.<br />
Indian <strong>and</strong> Northern Affairs Canada<br />
(INAC) <strong>and</strong> Environment Canada.<br />
1987. Beauf ort Environmental<br />
Monitoring Project, 1985 - 1986 Final<br />
Re<strong>port</strong>. Environmental Studies No.<br />
40. Prepared by LGL Ltd., ESL<br />
Environmental Services Ltd., ESSA<br />
Ltd., Arctic Laboratories Ltd., <strong>and</strong><br />
Arctic Sciences Ltd. 199p.<br />
IWC (International Whaling<br />
Commission). 1986. Re<strong>port</strong> of the<br />
Sub-<strong>com</strong>mittee on protected species<br />
<strong>and</strong> aboriginal subsistence whaling.<br />
Re<strong>port</strong> of the International Whaling<br />
Commission Annex H. Vol. 36: 95-111.<br />
Ljungblad, D.K. 1981. Aerial<br />
surveys of endangered whales in the<br />
Beaufort Sea, Chukchi Sea <strong>and</strong><br />
northern Bering Sea. NOSC Technical<br />
Document 449, Naval Ocean Systems<br />
Center, San Diego, California. 302p.<br />
Marex. 1977. Environmental<br />
Observations - Beaufort Sea 1976.<br />
Appendix 5. Wildlife Observations.<br />
Unpublished re<strong>port</strong> prepared by Marex<br />
for Canadian Marine Drilling Ltd.,<br />
Calgary.<br />
McLaren, P.L. <strong>and</strong> R.A. Davis.<br />
1985. Distribution of bowhead<br />
whales <strong>and</strong> other marine mammals in
the southeast Beaufort Sea,<br />
August-September 1983. Prep. by LGL<br />
Limited, Toronto, Ontario. Prep. for<br />
Environmental Studies Revolving<br />
Funds. COGLA-ESRF-001. 62 p.<br />
Norton, P. <strong>and</strong> L.A. Harwood.<br />
1986. Distribution, abundance <strong>and</strong><br />
behaviour of white whales in the<br />
Mackenzie Estuary. Environmental<br />
Studies Revolving Funds, Re<strong>port</strong> No.<br />
036. Ottawa. 73p.<br />
Renaud, W.E. <strong>and</strong> R.A. Davis.<br />
1981. Aerial surveys of bowhead<br />
whales <strong>and</strong> other marine mammals off<br />
the Tuktoyaktuk Peninsula, N.W.T.,<br />
August- September 1980. Prep. by LGL<br />
Limited, Toronto, Ontario. Prep. for<br />
Dome Petroleum Limited, Calgary,<br />
Alberta. 55 p.<br />
Richardson, W.J.<br />
Behavior, disturbance responses<br />
<strong>and</strong> distribution of bowhead whales<br />
Balaena mysticetus in the eastern<br />
Beaufort Sea, 1980-84. Unpubl. Rep.<br />
from LGL Ecol. Res. Assoc., Inc.,<br />
Bryan, Texas for U. S. Minerals<br />
Management Service, Reston, VA. 306p.<br />
Richardson, W.J., R.A. Davis, C.R.<br />
Evans <strong>and</strong> P. Norton. 1985.<br />
Distribution . of bowheads <strong>and</strong><br />
industrial activity, 1980-84. p.<br />
255-306 In: W. J. Richardson (ed. 1,<br />
Behavior, disturbance responses <strong>and</strong><br />
distribution of bowhead whales<br />
Balaena mysticetus in the eastern<br />
Beaufort Sea, 1980-84. Unpublished<br />
Re<strong>port</strong> from LGL Ecological Research<br />
Associates, Inc. for U.S. Minerals<br />
Management Service, Reston, VA. 306p.<br />
Richardson, W.J., R.A. Davis, C.R.<br />
Evans, D.K. Ljungblad <strong>and</strong> P.<br />
Norton. 1987. Surimer distribution<br />
of bowhead whales, Balaena<br />
mysticetus, relative to oil industry<br />
activities in the Canadian Beaufort<br />
Sea, 1980 - 84. Arctic 40(2): 93 -<br />
104.<br />
Townsend, C.H. 1935. The<br />
distribution of certain whales as<br />
shown by logbook records of American<br />
whaleships. Zoologica (N.Y.119, 50p.<br />
Discussion<br />
T. ALBERT: Is it appropriate to infer<br />
bowhead distribution from catch location<br />
data if there is no indication of the<br />
level of effort? For example, were the<br />
various areas "searched" in a similar<br />
manner? Using catch per unit of effort<br />
(CPUE) seems OK but just using catch<br />
location data does not seem appropriate.<br />
J. WARD: Yes, I believe it is appro-<br />
priate to infer bowhead distribution from<br />
catch location data with the appropriate<br />
qualifiers. As we indicated in the<br />
paper, we have made the assumption that<br />
<strong>com</strong>merical whalers would have concen-<br />
trated their efforts in areas where they<br />
were most likely to encounter bowheads.<br />
During the <strong>com</strong>mercial whaling period, I<br />
would be surprised if whalers did not<br />
look for whales in the area now known as<br />
the industrial zone as well as the other<br />
areas where they did take many whales.<br />
The fact that relatively few whales were<br />
taken from the area off the Mackenzie<br />
Delta suggests to me that even then few<br />
whales used the "industrial zone" area.<br />
D. DICKENS: I am interested to know<br />
whether you have attempted to correlate<br />
your observations with ice severity both<br />
in terms of the extent of open water in<br />
the so-called "Industrial Zone" as we11<br />
as the availability of relatively clear<br />
passage via leads <strong>and</strong> shore openings<br />
along the Alaskan coast.<br />
J. WARD: The short answer is "no." Such<br />
an analysis would not be useful because<br />
of the limited nature of the incidental<br />
sightings. Other studies provide some<br />
information on the subject of ice condi-<br />
tions <strong>and</strong> bowhead whale distribution.<br />
These include the whale surveys carried<br />
out for Minera1.s Management Service in<br />
the Alaska Beaufort Sea, the whale survey<br />
carried out in the Canadian Beaufort Sea<br />
for government <strong>and</strong> industry, <strong>and</strong> a 1985<br />
study of the effects of <strong>ocean</strong>ographic<br />
features on bowheads carried out for the<br />
Canadian Environmental Studies Revolving<br />
Fund.
T. NEWBURY: You have described inciden-<br />
tal sightings from vessels. The data is<br />
im<strong>port</strong>ant because it shows that some<br />
whales <strong>com</strong>e close to vessels. However,<br />
your extrapolation with the incidental<br />
sightings to statements about broad-scale<br />
bowhead distribution is not correct. The<br />
main reason is that you have made no<br />
<strong>com</strong>parable effort to collect incidental<br />
sightings away from vessels. You do<br />
<strong>com</strong>pare the number of incidental sight-<br />
ings with the number of sightings during<br />
broad-scale aerial surveys, but the<br />
correlation is very weak. Further, there<br />
are no estimates of effort for the aerial<br />
surveys, so the correlation between<br />
incidental sightings <strong>and</strong> aerial sightings<br />
may be simply due to changing levels of<br />
effort. To summarize, the incidental<br />
sightings show that whales <strong>com</strong>e<br />
close to vessels, but the incidental<br />
sightings are not useful for analyses of<br />
changes in broad-scale distribution.<br />
J. WARD: I belive the incidental sight-<br />
ings do provide useful information on<br />
changes in distribution of bowheads<br />
within the industrial zone, as I have<br />
described in this paper. Your use of the<br />
term "broad-scale bowhead distribution" I<br />
assume means bowhead distribution within<br />
the entire southeast Beaufort Sea. We<br />
have not used the ship-based incidental<br />
sightings to extrapolate beyond the<br />
industrial zone as suggested by your<br />
question. With respect to your <strong>com</strong>ment<br />
on level of effort, aerial survey effort<br />
for the surveys used in the <strong>com</strong>parisons<br />
has been relatively similar from year to<br />
year with the exception of 1980 when the<br />
area surveyed was quite limited. Inciden-<br />
tal observation effort will have varied<br />
with the level of exploration activity<br />
<strong>and</strong> the location of wellsites. Neverthe-<br />
less, there is an apparent correlation<br />
between the two types of observations in<br />
year-to-year relative numbers of bow-<br />
heads. The results of the incidental<br />
sightings parallel those of the aerial<br />
surveys. Perhaps more im<strong>port</strong>antly, the<br />
incidental sightings provide additional<br />
information on the distribution of<br />
bowheads in the industrial zone in the<br />
years prior to 1980 when broader scale<br />
offshore aerial surveys were first<br />
carried out.<br />
In summary, I agree that the incidental<br />
sightings show that some whales <strong>com</strong>e<br />
close to vessels, but I disagree with<br />
your <strong>com</strong>ment that they are not useful for<br />
analyses of changes in distribution.<br />
When <strong>com</strong>bined with the results of other<br />
studies, the incidental sightings do<br />
assist in providing qualitative insights<br />
into bowhead distribution.
Abstract<br />
MASKED DETECTION THRESHOLDS FOR THE BELUGA<br />
AND BOTTLENOSE DOLPHIN<br />
A beluga <strong>and</strong> an Atlantic bottlenose<br />
dolphin were trained to detect a sphere<br />
target with varying amounts of masking<br />
noise at three distances. Target<br />
detection performance as a function of<br />
masking noise level was determined at<br />
each target range for both species. The<br />
Echo-to-Noise ratio (Ee/No)max for the<br />
beluga was approximately 10 dB better<br />
than the dolphin for all ranges. The<br />
difference in performance between the<br />
two species may be due to critical<br />
b<strong>and</strong>width, signal processing capability,<br />
or a different echolocation strategy.<br />
Variations in the animal detection<br />
performance across the three ranges were<br />
consistent with target strength <strong>and</strong><br />
transmission loss differences.<br />
Introduction<br />
There has been little effort to<br />
<strong>com</strong>pare the echolocation capabilities of<br />
different cetacean species in the same<br />
task (Nachtigall, 1980). Differences in<br />
procedures <strong>and</strong> experimental design have<br />
made cross- species <strong>com</strong>parisons<br />
This is a reviewed <strong>and</strong> edited version of apaperpresented<br />
at the Ninth International Conference on Port <strong>and</strong> Ocean<br />
Engineering Under Arctic Conditions, Fairbanks, Alaska,<br />
USA, August 17-22, 1987.<br />
Charles W. Turl<br />
Ralph H. Penner<br />
W. W. L. Au<br />
Naval Ocean System Center, Kailua, Hawaii, USA<br />
difficult. Au et al. (1986) re<strong>port</strong>ed<br />
that there are some differences in the<br />
echolocation systems of the beluga <strong>and</strong><br />
Tursiops. They re<strong>port</strong>ed that the<br />
transmitted beam of the beluga is<br />
narrower than the dolphin, but that<br />
their echolocation signals had similar<br />
wave-shapes <strong>and</strong> frequency spectra (Au et<br />
al., 1985). The beluga emitted higher<br />
peak frequencies <strong>and</strong> higher intensity<br />
signals in Kaneohe Bay than in San Diego<br />
Bay. Au et al. (1974) suggested that<br />
bottlenose dolphins changed their<br />
signals in order to <strong>com</strong>pensate for the<br />
higher ambient noise in Kaneohe Bay.<br />
Penner et al. (1986) suggested that the<br />
beluga used a narrower beam to minimize<br />
the effects of a noise masker by<br />
receiving target echoes via a surface<br />
reflected path while echolocating. The<br />
objective of this study was to directly<br />
<strong>com</strong>pare a beluga <strong>and</strong> a bottlenose<br />
dolphin using the same experimental<br />
apparatus, procedure, targets <strong>and</strong><br />
masking noise.<br />
Methods<br />
The experiment was conducted in<br />
Kaneohe Bay, Hawaii using an adult male<br />
beluga (Dl 575) <strong>and</strong> an adult male<br />
bottlenose dolphin (Tt 8). The experi-<br />
mental configuration <strong>and</strong> procedure used<br />
were similar to those of Au <strong>and</strong> Penner<br />
(1981). The beluga, stationed in a 40 cm
Figure 1. Experimental configuration<br />
with the beluga in the hoop station.<br />
(The rubber mat is not shown in the<br />
figure) .<br />
dia hoop, is depicted in Figure 1.<br />
Targets were thin-walled stainless<br />
steel, water-filled spheres with<br />
diameters of 7.62 cm (target strength<br />
-28.3 dB) <strong>and</strong> 22.86 cm (target strength<br />
-17.4 dB). Target ranges of 16.5 <strong>and</strong> 40<br />
m were used with the 7.62 cm sphere <strong>and</strong><br />
80 m with the 22.86 cm. The center of<br />
the hoop station <strong>and</strong> the target depth<br />
were both at 1 m.<br />
Masking noise was projected from an<br />
Edo-Western 6166 spherical transducer<br />
initially located, in line with the<br />
target, 4 m from the hoop for the 16.5 m<br />
target range. For the 40 m <strong>and</strong> 80 m<br />
target ranges, the noise hydrophone was<br />
located 5 m from the hoop. The spectrum<br />
of the masking noise measured at the<br />
hoop was relatively flat from 40 to 160<br />
kHz (Figure 2). A rubber mat extended<br />
approximately 0.3 m into the water <strong>and</strong><br />
attached to the end of the pen directly<br />
between the hoop <strong>and</strong> the noise projector<br />
to block surface-reflected paths (see<br />
figure 3 of Penner et al., 1986).<br />
TARGET<br />
CLICK<br />
NOISE<br />
HYDROPHONE<br />
I .-'t<br />
Echolocation signals of both<br />
animals were measured with <strong>and</strong> Apple I1<br />
microprocessor system described by Au et<br />
al. (1982). A click hydrophone (Edo-<br />
Western 6166), located 2 m from the hoop<br />
station, was used to detect each click.<br />
The results of the echolocation signal<br />
measurements obtained in this experiment<br />
are presented in Turl et al. (1987).<br />
A trial started when the animal<br />
was stationed in front of the<br />
experimenter, with the acoustic screen<br />
in the raised position, the target out<br />
of the water, <strong>and</strong> the masking noise<br />
turned off. An <strong>under</strong>water signal cued<br />
the animal to turn <strong>and</strong> swim across the<br />
pen <strong>and</strong> insert its head into the<br />
stationing hoop. The target was either<br />
gently lowered into the water or left<br />
out, the masking noise was turned on <strong>and</strong><br />
the acoustic screen was lowered. The<br />
animal could echolocate for as long as<br />
it desired. When the animal finished<br />
echolocating, it backed out of the hoop<br />
<strong>and</strong> responded by striking one of two<br />
response paddles to indicate whether or<br />
not it detected the target.<br />
Six ten-trial blocks with an equal<br />
number of r<strong>and</strong>omized target present <strong>and</strong><br />
absent trials <strong>com</strong>prised a session. Five
0 100 200<br />
FREQUENCY (kHz)<br />
Figure 2. Frequency spectrum of the<br />
masking noise used in this experiment.<br />
noise levels (No) in 3 dB increments<br />
were used during testing. The received<br />
masking noise levels at the hoop station<br />
are shown in Figure 2. The first <strong>and</strong><br />
last 10-trial blocks were always<br />
conducted at the minimum noise level.<br />
The noise levels of the other blocks<br />
were r<strong>and</strong>omized for each session. Each<br />
animal participated in one session per<br />
day; the animal which participated in<br />
the first session would be used in the<br />
second session of the following day <strong>and</strong><br />
vice versa.<br />
Results<br />
The target detection performance of<br />
each animal, as a function of the<br />
masking noise level for each distance,<br />
is shown in Figure 3. The beluga's<br />
performance exceeded the bottlenose<br />
dolphin by 8 to 13 dB a t all three test<br />
distances. The beluga's 75% correct<br />
response thresholds occurred at n ise<br />
levels of 85, 72 <strong>and</strong> 63 dB re 1 Pa /Hz<br />
for target ranges of 16.5, 40 <strong>and</strong> 80 m,<br />
respectively. The dolphin's correspond-<br />
ing 75% correct response threshold<br />
occurred at 72, 59 <strong>and</strong> 55 dB, respec-<br />
tively. For both animals, response<br />
accuracy decreased as the noise level<br />
increased.<br />
Large fluctuations in the animal's<br />
emitted source levels usually occurred<br />
5<br />
 BELUGA<br />
BOTTLENOSE DOLPHIN<br />
-<br />
40 50 60 70<br />
MASKING NOISE SPECTRUM LEVEL<br />
(dB re 1 pPa2/Hz)<br />
Figure 3. Beluga <strong>and</strong> bottlenose<br />
dolphin's performance data as a function<br />
of the masking noise level at 16.5, 40<br />
<strong>and</strong> 80 meters. The target range (R) <strong>and</strong><br />
spher size at each distance is shown in<br />
each figure.
BELUGA BOTTLENOSED<br />
DOLPHIN<br />
Figure 4. Beluga <strong>and</strong> bottlenose<br />
dolphin's performance data at three<br />
distances plotted as a function of the<br />
echo signal-to-noise ratio.<br />
in most click trains with typical<br />
variations of 15 dB between the minimum<br />
<strong>and</strong> maximum signal levels. Since it is<br />
not known what signal levels the animal<br />
used to detect targets, we used the<br />
maximum level of each signal in the<br />
trial in order to calculate the echo<br />
energy flux density (Ee) returning to<br />
the animal (e.g. Au <strong>and</strong> Penner, 1981).<br />
Such a technique will provide the upper<br />
limit of the E/N, or the maximum E ~ /<br />
No available to the animal.<br />
The performance data from Figure 3<br />
is replotted (Figure 4) as the echo-<br />
signal-to-noise ratio ((Ee/No)max).<br />
Also shown are the two Tursiops<br />
measurements of Au <strong>and</strong> Penner (1981 ).<br />
At the 75% correct response threshold<br />
the (Ee/NOlmax was approxi-<br />
@ 16.5 M<br />
40.0 M<br />
@ 80.0 M<br />
 AU & PENNER<br />
mately 1.0 dB for the beluga at the<br />
three target distances. For the<br />
bottlenose dolphin, (Ee/No)max was<br />
approximate 10 dB.<br />
Discussion <strong>and</strong> conclusions<br />
Our results clearly indicate that<br />
the beluga's detection performance in<br />
masking noise was superior to that of<br />
the dolphin. Differences in the<br />
animals' projected signal amplitudes<br />
cannot explain the performance<br />
differences, since the relative emission<br />
signal amplitudes of both animals were<br />
similar. If the beluga had a narrower<br />
critical b<strong>and</strong>width at frequencies<br />
between 100 <strong>and</strong> 120 kHz, the amount of<br />
noise it received would be less than<br />
that of the dolphin <strong>and</strong> this could<br />
possibly explain the difference in<br />
<strong>com</strong>parative detection performance.<br />
Another possibility which might<br />
affect the difference in detection<br />
performance could be the echolocation
emission rate strategies used by each<br />
animal (Turl et al., 1987). The beluga<br />
emitted more clicks per trial than the<br />
dolphin <strong>and</strong> emitted clicks at a higher<br />
rate. This indicates that the number of<br />
echoes available for processing to the<br />
beluga exceeded that available to the<br />
dolphin by a factor from 1.25 to 2 <strong>and</strong><br />
suggests that the beluga may be<br />
processing more information per unit<br />
time than the dolphin. Since the<br />
animals were not constrained to<br />
echolocate in any particular manner, one<br />
must wonder why the dolphin did not also<br />
increase its repetition rate <strong>and</strong> use<br />
more clicks if that would be to its<br />
advantage. Given differences in<br />
habitats <strong>and</strong> prey it is likely that<br />
different species of toothed whales have<br />
evolved different capabilities <strong>and</strong> use<br />
different strategies depending on<br />
environmental differences.<br />
In this study masked detection<br />
thresholds of a beluga were 8 to 13 dB<br />
better than that of a bottlenose<br />
dolphin. Possible explanations for the<br />
difference in the detection sensitivity<br />
between the beluga <strong>and</strong> bottlenose<br />
dolphin may include differences of<br />
critical b<strong>and</strong>width, echolocation<br />
emission rate strategies <strong>and</strong> signal<br />
processing capabilities. We believe<br />
that it is unlikely that any one of<br />
these reasons could singly account for<br />
the differences in performance; more<br />
likely, a <strong>com</strong>bination of factors are<br />
involved. The beluga lives in an<br />
<strong>arctic</strong>-sub<strong>arctic</strong> environment while the<br />
bottlenose dolphin inhabits more<br />
temperate-tropical waters, but both<br />
species tend to inhabit shallow coastal<br />
water <strong>and</strong> both feed on a variety of prey<br />
organisms. Maybe the beluga's superior<br />
performance in the described experiment<br />
represents an adaptation to an <strong>arctic</strong><br />
ice-covered environment with occasional<br />
high noise levels. Further investi-<br />
gations are required in order to isolate<br />
which mechanisms are relevant to the<br />
beluga's enhanced performance as<br />
<strong>com</strong>pared to the dolphin in a high noise<br />
echolocation detection task.<br />
References<br />
Au, W.W.L., Floyd, R.W., Penner, R.H.,<br />
<strong>and</strong> Murchison, A.E. 1974. Propagation<br />
measurements of echolocation signals of<br />
the Atlantic bottlenose dolphin,<br />
Tursiops truncatus Montagu, in open<br />
water. J. Acoust. g. &. 56:1180-<br />
1290.<br />
Au, W.W.L., Floyd, R.W. <strong>and</strong> Haun, J.E.<br />
1978. Propagation of Atlantic bottle-<br />
nose dolphin echolocation signals. J.<br />
Acoust. SOC. Amer. 64:411-422.<br />
---<br />
Au, W.W.L. 1980. Echolocation signals<br />
of the Atlantic bottlenose dolphin<br />
(Tursiops truncatus) in open waters.<br />
-<br />
In: "Animal Sonar Systems" (R.G. Busnel<br />
<strong>and</strong> J.F. Fish, eds.). Plenum Press, New<br />
York, 251-282.<br />
Au, W.W.L. <strong>and</strong> Penner, R.H. 1981.<br />
Target detection in noise bv Atlantic<br />
bottlenose dolphins. L. Acoust. g.<br />
Amer. 70:687-693.<br />
Au, W.W.L., Penner, R.H. <strong>and</strong> Kadane, J.<br />
1982. Acoustic behavior of echolocating<br />
Atlantic bottlenose dolphin. L. Acoust.<br />
SOC. Amer. 71:1269-1275.<br />
--<br />
Au, W.W.L., Penner, R.H. <strong>and</strong> Turl, C.W.<br />
1987. Propagation of beluga whale<br />
echolocation signals. L. Acoust. x.<br />
&. (in press).<br />
Au, W.W.L., Carder, D.A., Penner, R.H.<br />
<strong>and</strong> Scronce, B.L. 1985. Demonstration<br />
of adaptation in beluga whale<br />
echolocation signals. J. Acoust. z.<br />
Amer. 77:726-730.<br />
-<br />
Nachtigall, P.E. 1980. Odontocete<br />
echolocation performance on object size,<br />
shape <strong>and</strong> material. In "Animal Sonar<br />
Systems" (R.G. ~usnel<strong>and</strong> J.F. Fish,<br />
eds.). Plenum press, New York, 71-95.<br />
Penner, R.H., Turl, C.W. <strong>and</strong> Au, W.W.L.<br />
1985. Target detection by the beluga<br />
using a surface-reflected path. J.<br />
Acoust. SOC. Amer. 80(6): 1842-1843.<br />
---<br />
Turl, C.W., Penner, R.H. <strong>and</strong> Au, Whitlow<br />
W. L. 1987. Comparison of target<br />
detection capabilities of the belutra " <strong>and</strong><br />
bottlenose dolphin. J. Acoust. g.<br />
(in press).<br />
e.
Discussion<br />
T. ALBERT: Have any other dolphins or<br />
toothed whales been looked at which<br />
receive <strong>and</strong> send at the same time?<br />
W. TURL: The other dolphins which have<br />
been tested behave similarly to the<br />
bottlenose dolphin.
EVIDENCE OF GLACIAL SEISMIC EVENTS IN THE ACOUSTIC ENVIRONMENT OF<br />
HUMPBACK WHALES<br />
Abstract<br />
High level impulses of <strong>under</strong>water<br />
sound occurring as frequently as 3-4<br />
times per minute were detected in<br />
Glacier Bay, Alaska during a measurement<br />
project to define the <strong>under</strong>water<br />
acoustic environment in that region.<br />
Analysis of these impulses demonstrates<br />
signal-to-noise ratios as high as 40 dB,<br />
significant broadb<strong>and</strong> energy from below<br />
20 Hz to above 2 kHz <strong>and</strong> the presence of<br />
pure tone <strong>com</strong>ponents. The character of<br />
the impulses is relatively invariant<br />
within the Bay area.<br />
We hypothesize that these events<br />
are associated with the many active<br />
glaciers in the region <strong>and</strong> are the<br />
result of stick-slip action generating<br />
seismic energy at the ice-rock inter-<br />
face. That energy is then propagated<br />
through the bedrock <strong>and</strong> radiated as<br />
sound into the water through the walls<br />
<strong>and</strong>/or bottom of the fjords. Acoustic<br />
instrumentation included a sonobuoy <strong>and</strong><br />
a hydrophone separated by about 3.2 km.<br />
Analysis of simultaneously recorded data<br />
provides directional information relat-<br />
ing to the source of the events. Data<br />
This is a reviewed <strong>and</strong> edited version of a paper submit-<br />
ted to the Ninth International Conference on Port <strong>and</strong><br />
Ocean Engineering Under Arctic Conditions, Fairbanks,<br />
Alaska, USA, August 17-22, 1987.<br />
Paul R. Miles<br />
Charles I. Maime<br />
BBN Laboratories Inc., Cambridge, Massachusetts, USA<br />
are presented for this phenomenon,<br />
relating it to findings of others who<br />
used geophones on <strong>and</strong> near glaciers in<br />
other regions.<br />
Background <strong>and</strong> Hypothesis<br />
This paper resulted from a larger<br />
study, administered by the Marine Mammal<br />
Laboratory of the National Marine<br />
Fisheries Service, to measure <strong>and</strong> define<br />
the <strong>under</strong>water acoustic environment of<br />
Glacier Bay National Park in Southeast<br />
Alaska during the summer of 1981. Major<br />
funding for the overall study (Malme, et<br />
al. 1982) originated with the National<br />
Park Service which had be<strong>com</strong>e concerned<br />
regarding fluctuations in the population<br />
of feeding humpback whales in the area.<br />
Potential detrimental influence on hump-<br />
back whales of man-made noise in Glacier<br />
Bay, especially noise due to increased<br />
traffic from cruise ships, small boats<br />
<strong>and</strong> aircraft, was one driving force in<br />
establishment of the project.<br />
The purposes of the acoustic study,<br />
therefore, were to:<br />
1) determine the natural <strong>and</strong> man-<br />
made contributions to the ambient noise,<br />
with emphasis on areas frequented by<br />
humpback whales,<br />
2) examine sound propagation <strong>and</strong><br />
reverberation properties of representa-
tive areas, such as Frederick Sound/<br />
Stephens Passage for <strong>com</strong>parison to<br />
<strong>conditions</strong> in Glacier Bay,<br />
3) obtain radiated noise spectra<br />
from ships, small boats, <strong>and</strong> aircraft<br />
operating in these areas,<br />
4) examine any unusual acoustic<br />
differences which may exist between the<br />
two field locations.<br />
With respect to the latter element<br />
of the study, two natural phenomena were<br />
observed in Glacier Bay which were not<br />
detected in the Frederick Sound/Stephens<br />
Passage area:<br />
1) frequency high-level acoustic<br />
impulsive events were recorded which had<br />
strong low-frequency <strong>com</strong>ponents <strong>and</strong><br />
which were varying in event rate from<br />
day-to-day, possibly on a diurnal basis,<br />
2) very high level effervescent<br />
sound levels were measured in the<br />
vicinity of tidewater glaciers <strong>and</strong><br />
floating glacial ice.<br />
The first phenomenon is the subject of<br />
this paper, although a brief <strong>com</strong>mentary<br />
on the effervescence phenomenon will<br />
also be included.<br />
We hypothesize that the high-level<br />
impulsive <strong>under</strong>water sound events, which<br />
occur as frequently as 3-4 times per<br />
minute, are associated with the many<br />
glaciers in the region <strong>and</strong> are the<br />
result of stick-slip action generating<br />
seismic energy at the icelrock<br />
interface.<br />
Physical Environment<br />
The characterization of the<br />
acoustic environment of Glacier Bay<br />
required specific measurements to be<br />
made throughout the region as well as<br />
reference to historical data. Figure 1<br />
summarizes the 38 stations which were<br />
occupied in July <strong>and</strong> early August 1981<br />
<strong>and</strong> provides information regarding the<br />
Glacier Bay regional characteristics.<br />
The acoustic data re<strong>port</strong>ed here were<br />
acquired at Station 27-27A <strong>and</strong> in Queen<br />
Inlet (Station 36).<br />
The dynamic glaciological aspects<br />
of Glacier Bay are readily evident when<br />
observing the many active glaciers <strong>and</strong><br />
icefields of the region <strong>and</strong> the fjords<br />
making up the various inlets. Depths in<br />
the steep-walled fjords vary from about<br />
50 meters to 430 meters. The entire<br />
region of the present Park was covered<br />
with ice as recently as 1794 when<br />
Vancouver sailed by the mouth of the<br />
bay. The retreat of the glaciers since<br />
that time has been rapid with the rate<br />
varying somewhat over the last<br />
200 years. Retreat rates of 400 meters/<br />
year, <strong>and</strong> greater have been recorded<br />
(Muir Glacier has recently shown retreat<br />
rates as high as about 2 kml~ear!).<br />
Some advancing has also been observed as<br />
well as some relative inactivity as a<br />
glacier stalls on a sill. The release<br />
of the weight of the ice from the l<strong>and</strong><br />
mass has resulted in isostatic rebound<br />
rates as high as about 4 cm per year in<br />
the Bartlett Cove area <strong>and</strong> an overall<br />
average of about 2 cm/year for the Park<br />
area (Hale <strong>and</strong> Wright, 1979).<br />
The regional geology of the area is<br />
<strong>com</strong>plex <strong>and</strong> has been summarized by<br />
MacKevett et al. (1971). Bedrock<br />
stratigraphic age varies from Early<br />
Silurian through Late Tertiary with<br />
granitic intrusives <strong>and</strong> metamorphic<br />
formations. Foliated granitic bedrock<br />
such as diorite <strong>and</strong> granodiorite <strong>and</strong><br />
detrital clastic rocks such as gray-<br />
whacke <strong>and</strong> shale are major rock types<br />
with <strong>com</strong>mon zones of limestone <strong>and</strong><br />
volcanic rocks. Faulting trends to the<br />
northwest with the Fairweather Fault<br />
being the major fault zone located along<br />
the coast west of the Fairweather moun-<br />
tains. Other fault zones are located<br />
along the West Arm of Glacier Bay, along<br />
the east shore of the Park <strong>and</strong> with some<br />
cross-faulting in the Tlingit Point-<br />
Tidal Inlet area.<br />
The U.S. Geological Survey <strong>com</strong>-<br />
pleted an extensive seismic survey of<br />
the bottom <strong>and</strong> subbottom topography of<br />
Glacier Bay (B. Molnia, personal <strong>com</strong>-<br />
munication). The USGS records reveal<br />
the presence of a series of sills <strong>and</strong><br />
basins throughout the arms <strong>and</strong> inlets.<br />
The terminal moraine of the original<br />
glacier at the entrance to the Park<br />
provides a hard rocky botto'm that is<br />
continually swept clean of silt by tidal
Figure<br />
currents (as high as 7 knots in the<br />
narrows). The bottom there <strong>and</strong> over<br />
other sills is acoustically reflective.<br />
The basins, on the other h<strong>and</strong>, have been<br />
filled with fine silty deposits varying<br />
in thickness from 50 to 150 m. Figure 2<br />
provides sketches of the sediment layers<br />
at several positions within the bay. In<br />
these areas, the bottom is acoustically<br />
absorptive. The sides of the arms <strong>and</strong><br />
inlets are steep <strong>and</strong> rocky with no<br />
acoustically im<strong>port</strong>ant sediments.<br />
Water temperature <strong>and</strong> salinity as a<br />
function of depth <strong>and</strong> area within the<br />
bay area were measured primarily because<br />
these data are required in the deriva-<br />
tion of sound speed profiles to provide<br />
insight into sound propagation char-<br />
acteristics. Increased surface tempera-<br />
tures due to high insolation rates <strong>and</strong><br />
reduced salinity due to melting glacial<br />
ice were observed. Temperature <strong>and</strong><br />
salinity profiles up-bay stabilize at<br />
depths greater than about 30 meters. At<br />
the southern area of the bay where con-<br />
siderable mixing occurs, the profiles
ICr0.s - Chtnnell<br />
UPPER WEST ARM NEAR<br />
QUEEN AND RENDU INLETS<br />
i<br />
ISWI INEI<br />
(WEST1 (EAST!<br />
0 1 2 3nmt<br />
LOWER MUIR INLETQADAMS INLET<br />
APPROX 3 MILESNORTH OF<br />
WILLOUGHBV ISLAND<br />
Ref: B. Molnia. USGS. Unoublished<br />
Note: There is an approximate 30: 1 EAST OF WILLOUGHBV ISLAND<br />
wrtical/horizontal display distortion.<br />
Reflector 1<br />
Reflector 2<br />
ISWI INEI<br />
Figure 2. Rough sketches of sediment thicknesses in Glacier Bay.<br />
are stable to the surface. Sound speed<br />
profiles resulting from Wilson's<br />
Equation,<br />
(where T is water temperature (OC) <strong>and</strong> S<br />
is salinity in parts per thous<strong>and</strong>) are<br />
shown in Figure 3, demonstrating the<br />
stability of the physical characteris-<br />
tics of the water column below 30<br />
meters, in particular. The measurement<br />
system used on this project did not<br />
permit measurements deeper than 50<br />
meters although historical data demon-<br />
strate a repeatable profile with a<br />
slightly negative gradient of 0.06 m/sec<br />
per meter of depth down to 200 m depth.<br />
Sound generated from a source located at<br />
a depth greater than 30 meters will be<br />
propagated with a slightly downward<br />
refracting ray path angle.<br />
directional general purpose hydrophone<br />
system located at the research vessel<br />
<strong>and</strong> an SSQ57A sonobuoy system with the<br />
radio receiver located on the research<br />
vessel.<br />
The general purpose system was bat-<br />
tery operated permitting <strong>com</strong>plete shut-<br />
down of the research vessel propul-<br />
sion system <strong>and</strong> accessories to minimize<br />
the possibility of self-contamination of<br />
acoustic data. The H56 hydrophone,<br />
owned <strong>and</strong> calibrated by the U.S. Navy,<br />
has a frequency range of from 10 Hz to<br />
65 kHz <strong>and</strong> is flat from 10 Hz to 20 kHz.<br />
The data recorder used was a two channel<br />
NAGRA IV SJ stereo recorder with an<br />
additional channel for voice annotation.<br />
The frequency response was flat from<br />
0.02 to 20 kHz. The system was used for<br />
acquisition of vessel radiated noise<br />
signatures <strong>and</strong> for obtaining short term<br />
background noise measurements.<br />
Instrumentation The synoptic ambient noise measure-<br />
ment system used an SSQ57A sonobuoy.<br />
Two acoustic measurement systems This permitted the acquisition of 8<br />
were used as shown in Figure 4; an omni- hours of continuous ambient noise data
-(STA N0.461811<br />
?30 - -(SA No.28) 7/26<br />
I<br />
fc<br />
w<br />
'40-<br />
50 -<br />
60 I<br />
JOHNS HOPKINS INLET-<br />
SOUND SPEED PROFILES IN GLACIER M Y<br />
Figure 3. Sound speed profiles in Glacier Bay.<br />
u<br />
GENERAL PURPOSE ACOUSTIC MEASUREMENT SVSTEM<br />
-v RÇouw<br />
SYMOTTIC AMBIENT NOISE MEASUREMENT SVSTEM<br />
DATA KDUCTKMI BYBTEM<br />
Figure 4. Acoustic measurement <strong>and</strong> data<br />
reduction systems.<br />
I I 1 I / .<br />
using an r-f link from a remotely<br />
emplaced buoy with the data transmitted<br />
to the research vessel, located up to<br />
four miles away. Data were acquired<br />
with this system in the 0.01 to 20 kHz<br />
b<strong>and</strong>. Synoptic data from the sonobuoy<br />
were tape recorded for five minutes<br />
every half-hour for the duration of the<br />
8 hour period. Continuous data were<br />
recorded on a strip chart recorder for<br />
the full 8-hour period.<br />
Figure 4 also outlines the data<br />
analysis system consisting of a Nicolet<br />
446A narrowb<strong>and</strong> spectrum analyzer pro-<br />
viding data in the form of <strong>under</strong>water<br />
sound pressure level as a function of<br />
frequency <strong>and</strong> a graphic level recorder<br />
which provides a continuous plot of log<br />
amplitude of the acoustic signal as a<br />
function of time.<br />
Acoustic Impulse Events<br />
The acoustic impulse events were<br />
heard <strong>and</strong> recorded throughout Glacier<br />
Bay as long as the ambient noise levels<br />
permitted detection. The signals were<br />
heard in near-glacier regions, such as<br />
Queen Inlet <strong>and</strong> Geikie Inlet as well as<br />
in areas 'which -were relatively remote<br />
from glaciers such as the Marble Isl<strong>and</strong>s<br />
<strong>and</strong> Bartlett Cove. The Bartlett Cove<br />
events usually could be heard only at
2 TYPICAL SEISMIC EVENT SIGNATURES NEAR N. MARBLE ISLAND<br />
(log AMPLITUDE) (712111 150)<br />
.<br />
~<br />
- . - ~<br />
-. - . - 4 .. ~ - - . ~.<br />
.<br />
~-<br />
I<br />
-. _1 ... - -~<br />
-- .<br />
EXAMPLE OF SYNOPTIC AMBIENT log AMPLITUDE VS TIME RECORD, STATION 27,7124<br />
Figure 5. Typical seismic event signatures <strong>and</strong> an example of synoptic ambient vs<br />
time record, Station 27, 7/24/81.<br />
night when ambient levels were very<br />
low. The events with their typical<br />
booming impulsive sound with a tail-off<br />
in sound level were also heard in 1982<br />
at Point Adolphus, across Icy Strait<br />
from the Glacier Bay entrance <strong>and</strong> about<br />
24 n.m. or 44 km to Brady Glacier (the<br />
nearest). Pt. Adolphus is an Im<strong>port</strong>ant<br />
feeding area for humpback whales.<br />
Figure 5 provides two strip chart<br />
recordings of such events. The lower<br />
record is a 401ninute continuous record<br />
of the events as recorded by the sono-<br />
buoy system on 24 July 1981 in the early<br />
afternoon. Event rates as high as 4-5<br />
transients per minute are evident. At<br />
other times <strong>and</strong> days the event rate<br />
could be as low as one event every 2 or<br />
3 minutes. The upper figure, obtained<br />
on a high speed <strong>and</strong> high pen response<br />
recorder demonstrates the most <strong>com</strong>mon<br />
characteristics of these events. That<br />
is, signal-to-noise ratios as high as<br />
40 dB at the onset of the fast rise-<br />
time events were frequently observed<br />
with a tail-off of sound level lasting<br />
as long as 7 seconds. A pure tone 63 Hz<br />
<strong>com</strong>ponent, usually occurring about 1.4<br />
seconds after first arrival, was detect-<br />
ed frequently. Occasional emergent<br />
impulses were also seen, peaking in<br />
level at about 3 seconds from first<br />
arrival <strong>and</strong> diminishing in level into<br />
the background after about another<br />
3 seconds. Figure 6 shows similar data<br />
obtained in Queen Inlet on two other<br />
days, which is further up-bay than<br />
Station 27 in the Marble Isl<strong>and</strong>s. The<br />
nearest tidewater glacier to Station 27<br />
is about 45 km away. In Queen Inlet,<br />
the nearest tidewater glacier is 16 km
QUEEN INLET, 7/16/1935, FREQUENT HIGH LEVEL EVENTS<br />
QUEEN INLET, 7/29/1130, SPORADIC EVENTS WITH TONALS<br />
Figure 6. Sporadic impulsive events with tonals recorded in Queen Inlet, 7/29/81 at<br />
1130.<br />
away <strong>and</strong> the closest valley glacier is<br />
9 km away. Notice in particular that<br />
the peak levels of the impulses received<br />
at the two sites are very similar <strong>and</strong> in<br />
the order of 115 dB//uPa <strong>and</strong> that the<br />
general character of the signatures is<br />
the same. Also note the pure tone <strong>com</strong>-<br />
ponent in the Queen Inlet data <strong>and</strong> the<br />
similarity of the overall signature with<br />
that obtained at Station 27, 18 miles or<br />
33 km down-bay. One difference between<br />
the signatures from the two sites is the<br />
duration of the signatures. The more<br />
distant site (Figure 5) showed 6-7 sec.<br />
event duration <strong>and</strong> the Queen Inlet<br />
events in Figure 6 are 4-4.5 sec. long.<br />
These differences possibly may be due to<br />
reverberation but also probably relate<br />
to differences in travel time of differ-<br />
ent seismic wave types <strong>and</strong> dispersion<br />
effects. One <strong>com</strong>mon qualitative element<br />
in all of these events is that immedi-<br />
ately following reception of peak<br />
sound pressure level, there is a "roll-<br />
ing th<strong>under</strong>" type sound which varies in<br />
intensity but reduces in level until it<br />
is lost in the ambient background.<br />
Figure 7 presents three ambient<br />
noise spectra measured in different<br />
areas of the bay. One signature of an<br />
impulsive event is shown (Queen Inlet).<br />
The upper curve (STA 24) demonstrates<br />
the loudness of the effervescent noise
@-",e~<br />
1<br />
STA. 24 MUIR GLACIER<br />
--<br />
STA %QUEEN INLET<br />
1 0 0 2 0 0 3 0 0 4 < 1 0 5 0 0 à ‡ O O T O O a h à ˆ 0 0<br />
FREQUENCY IHzl<br />
Figure 7. Upper Glacier Bay ambient noise (low frequency).<br />
referred to earlier. Levels are as much<br />
as 10 dB noisier than the broadb<strong>and</strong><br />
sound typically experienced in the open<br />
<strong>ocean</strong> for a sea state 6 condition. SS6<br />
corresponds to sustained 28-33 knot<br />
winds <strong>and</strong> 17 to 26 ft wave heights.<br />
Clearly, the broadb<strong>and</strong> ice sound has the<br />
capability of masking significant other<br />
sources of acoustic energy, except at<br />
frequencies below about 150 Hz. We<br />
established through observation <strong>and</strong><br />
others have established, such as Dewart<br />
(1968), that the sound is due to multi-<br />
tudes of small bubbles frozen into the<br />
glacial ice that have been <strong>com</strong>pressed<br />
over time <strong>and</strong> then released with a<br />
popping or frying sound as the water<br />
melts away the surface of the ice. The<br />
lowest curve in the figure shows a<br />
typical spectrum <strong>under</strong> the quietest<br />
condition obtained.<br />
Figures 8 <strong>and</strong> 9 are narrowb<strong>and</strong><br />
spectra of two impulsive events obtained<br />
near North Marble Isl<strong>and</strong> (near Sta 27)<br />
<strong>and</strong> in Queen Inlet, respectively.<br />
Notice in particular the low frequency<br />
tonal <strong>com</strong>ponents at about 63, 126, <strong>and</strong><br />
189 Hz <strong>and</strong> good signal-tonoise ratio<br />
beyond 1 kHz (Fig. 8) <strong>and</strong> out to 2 kHz<br />
in Fig. 10. The cause of the pure tone<br />
<strong>com</strong>ponents in the transients is unknown<br />
although, we feel it may be a resonance<br />
effect associated with the generation of<br />
shear energy at the ice/ rock interface.<br />
One brief experiment was performed<br />
at Station 27 with the hope of providing<br />
some insight regarding the source of the<br />
impulsive events. The H56 hydrophone<br />
was deployed to a 25 meter depth at the<br />
research vessel, located approximately<br />
3.2 km away from the sonobuoy <strong>and</strong> the<br />
impulsive events recorded simultaneously<br />
with the sonobuoy data on a 2-channel<br />
tape recorder. Range to the sonobuoy<br />
was determined acoustically by dropping<br />
a weighted light bulb over the side of<br />
the research vessel where it sank until<br />
hydrostatic pressure caused the bulb to<br />
implode. The resulting sharp sound<br />
transient was recorded from both the H56<br />
hydrophone <strong>and</strong> the sonobuoy. Measuring<br />
the time difference <strong>and</strong> knowing the<br />
speed of sound permits determination of<br />
range between the two sensors. Figure<br />
10 sketches the arrangement showing that<br />
a time difference of 2.2 seconds was<br />
realized, corresponding to a sensor<br />
spacing of 3234 meters (using a sound<br />
speed of 1470 m/sec). Similarly, single<br />
impulsive events are recorded
-<br />
100<br />
. 2<br />
"isa<br />
3<br />
Ã<br />
80<br />
w<br />
?<br />
E 70<br />
h<br />
'g m<br />
a<br />
E<br />
g so<br />
a BACKGROUND<br />
0 0.2 0.4 0.8 0.8 1.0 1.2 1.4 1.6 1.8 2.0<br />
FREQUENCY (kHz1<br />
Figure 8. Narrowb<strong>and</strong> spectrum analysis of an <strong>under</strong>water impulsive event at<br />
N. Marble Isl<strong>and</strong>, Glacier Bay.<br />
-<br />
s<br />
3<br />
2<br />
? -<br />
loo<br />
-i m<br />
><br />
w ¥<br />
8"<br />
h<br />
w<br />
^ so<br />
40 0 0.2 0.4 0.6 0.8 1.0 1.2 1.4 1.8 1.8 2.0<br />
FREQUENCY IkHzl<br />
Figure 9. Narrowb<strong>and</strong> spectrum analysis of an <strong>under</strong>water impulsive event in Queen<br />
Inlet, Glacier Bay.<br />
103
an extra ambiguity for broadside<br />
arrivals.<br />
la1 HYDROPHONE SEPARATION CALIBRATION<br />
1 (BULB SOURCE)<br />
Based on the arrival directions<br />
shown in Fig. 11, we feel that the most<br />
likely source of these events is<br />
associated with the glaciers in the<br />
Brady Ice Field <strong>com</strong>plex to the west<br />
of the measurement site. However, we<br />
cannot totally rule out White Glacier<br />
<strong>and</strong> Casement Glacier to the northeast<br />
because of the small sample of data.<br />
I (bl IMPULSIVE EVENT FIRST ARRIVALS<br />
I<br />
SONOBUOY<br />
Figure 10. Determination of direction<br />
of arrival for impulsive events.<br />
simultaneously. Also sketched in Figure<br />
10 is the first arrival of such an<br />
event, demonstrating that the sonobuoy<br />
registered the event first. The cosine<br />
of the wavefront arrival angle (with an<br />
ambiguity) is the ratio of the arrival<br />
times . Figure 11 illustrates that<br />
ambiguity <strong>and</strong> includes with it a poten-<br />
tial angular error of about 5' due to<br />
imprecise information on the azimuthal<br />
orientation of the research vessel/<br />
sonobuoy line of sight, <strong>and</strong> to some<br />
fluctuation in the time differences in<br />
the first arrivals of the impulsive<br />
events at the two hydrophones. Of the<br />
events measured in this way, all showed<br />
arrival time differences to be within<br />
1.3 to 1.4 seconds. If seismic impulses<br />
were radiating from the bottom of the<br />
fjord, arrivals at the two hydrophones<br />
would be nearly simultaneous, providing<br />
Discussion<br />
-At-<br />
L<br />
0<br />
1.4m-<br />
~ ~ ~ ~ ~<br />
05 1.0 1.5 2 0 2.5<br />
ARRIVAL TIME DIFFERENCE (SECONDS)<br />
~<br />
H 56<br />
~ I<br />
3 0<br />
~<br />
We have stated that we feel that<br />
these events are related to seismic<br />
energy being generated at the icelrock<br />
interface ~ g beneath ~ ~ active a glaciers ~ l of ~ the ~<br />
region. We do not have information<br />
regarding the various degrees of<br />
~<br />
activity of the many glaciers, only that<br />
1cl GEOMETRY<br />
all of the tidewater glaciers were<br />
demonstrating activity. In the West Arm<br />
LINEARIZED IMPULSE<br />
area, Reid, Lamplugh, <strong>and</strong> Johns Hopkins<br />
glaciers are all fed by the Brady Ice<br />
Field. Charpentier <strong>and</strong> Geike, which are<br />
now valley glaciers, are located close<br />
to the fjords. In the vicinity of<br />
Station 27, all the nearby potential<br />
seismic sources are valley glaciers;<br />
White, Adams <strong>and</strong> Morse, <strong>and</strong> Casement to<br />
the north <strong>and</strong> northeast.<br />
Dewart (1968) has measured<br />
impulsive events using seismometers on<br />
<strong>and</strong> near the ice of Kaskawulsh Glacier<br />
in the Yukon. Impulse rates varying<br />
from 1 to 62 per hour were measured <strong>and</strong><br />
were quite short in duration (0.5 to<br />
2 seconds). Further, he noted a diurnal<br />
variation in event rate with changes in<br />
numbers of events per hour similar to<br />
what we observed. While he did not<br />
mention observing pure tones in associa-<br />
tion with these events, he does refer to<br />
work by Oelsner on the Lovenbreen<br />
Glacier in West Spitzbergen where he<br />
observed impulses (which he calls<br />
-eigenimpulses") having a dominant fre-<br />
quency around 60 Hz. He also relates<br />
the event rate to temperature fluctua-<br />
tions, which correlate with run off<br />
fluctuations (lubrication).<br />
Weaver <strong>and</strong> Malone (1979) discuss<br />
extensive seismometer measurements made<br />
in the immediate vicinity of ,glaciers in<br />
the North Cascade mountains of
 SHORT AMBIENT. SVP,<br />
Figure 11. Approximate angle of arrival of impulsive events at Station 27.<br />
Washington. They measured many impulsive<br />
events having a 1-2 Hz dominant fre-<br />
quency <strong>and</strong> event rates which varied from<br />
thee per day to three per minute depend-<br />
ing on the particular glacier being<br />
monitored. At one station (Longmire) on<br />
Mt. Rainier, they re<strong>port</strong>ed that through<br />
a 10-year period, consistent correlation<br />
existed between event rate <strong>and</strong> time of<br />
year; low rates in winter <strong>and</strong> high rates<br />
In the summer when more run-off occurs,<br />
permitting more glacial motion through<br />
lubrication. Magnitudes of the events<br />
based on the earthquake energy relation-<br />
ship developed by Gutenberg <strong>and</strong> Richter<br />
in Richter (1958), varied from 1.2 to<br />
2.4 representing seismic energies at th<br />
source of these events of 1 0 to 10 5<br />
Joules. They re<strong>port</strong> further that only<br />
the very largest surface avalanches<br />
produced a relatively small response at<br />
stations a few hundred meters away.<br />
Crevassing impulses, as referenced by<br />
Weaver <strong>and</strong> Malone (1979) <strong>and</strong> re<strong>port</strong>ed by<br />
Neave <strong>and</strong> Savage (1970) generate in the<br />
order of 1 Joule of seismic energy.
Based on their extensive study, Weaver<br />
<strong>and</strong> Malone conclude that the impulses<br />
which they monitored were due to stick-<br />
slip action through a shear sliding<br />
mechanism at the ice/rock interface.<br />
Van Wormer <strong>and</strong> Berg (1973) re<strong>port</strong><br />
that weak P phases <strong>and</strong> well developed<br />
monochromatic non-dispersive shear-wave<br />
trains are often recorded at University<br />
of Alaska's seismological station SCM in<br />
southern Alaska. They conclude that<br />
these events probably originate at or<br />
near tidewater glaciers, in Prince<br />
William Sound. Frequencies of the shear<br />
wave trains in this case were in the<br />
order of 1 to 2 Hz. Earthquake magni-<br />
tudes of 1.6 to 3.0 were recorded <strong>and</strong><br />
event rates at the remote measurement<br />
facility were in the 2.5 to 3 per hour<br />
range. They hypothesize that these<br />
events are associated with release of<br />
seismic energy at the ice/rock interface<br />
in the order of 107.5 Joules. The<br />
authors <strong>com</strong>pute that a stick-slip motion<br />
of about 3 mm of a glacial section hav-<br />
ing an area of 1 km 2 is sufficient to<br />
generate the earthquake magnitudes<br />
observed.<br />
If we assume that the pure tone<br />
elements of the impulsive events<br />
measured in Glacier Bay are due to<br />
shear-wave energy generated at the<br />
ice/rock interface we have a means for<br />
estimating the focal distance to the<br />
events. Shear waves do not propagate in<br />
water, but they can be converted to<br />
<strong>com</strong>pressional waves at major changes in<br />
impedance or at major discontinuities.<br />
Measuring the time difference between<br />
the first arrival <strong>and</strong> the pure tone<br />
<strong>com</strong>ponent of the signatures in Figure 5<br />
provides a P-S arrival difference of<br />
approximately 1.3 seconds. Jeffreys <strong>and</strong><br />
Bullen (1958) provide a table of seismic<br />
wave arrival times for surf ace focus,<br />
near earthquake events. Their data for<br />
<strong>com</strong>pressional <strong>and</strong> shear wave arrivals in<br />
granite bedrock, demonstrate that the<br />
distance to a seismic event, through the<br />
rock medium, for a time difference of<br />
1.3 seconds is approximately 11.1 km or<br />
6.0 n.m. Referring back to Figure 11<br />
<strong>and</strong> assuming that the radiating<br />
rock/water interface of a fjord wall is<br />
where the shear-to-<strong>com</strong>pressional energy<br />
conversion takes place <strong>and</strong> that the<br />
radiating face is approximately at the<br />
bar mark on the 50Â angle of arrival<br />
line, a 6 n.m. distance to the originat-<br />
ing seismic event is at the end of the<br />
arrow shown. In this estimate, there-<br />
fore, it appears that the source of the<br />
impulsive events measured at Station 27<br />
is associated with the Reid Glacier,<br />
near Its eastern edge. Similarly, for<br />
the ambiguous arrival angle to the<br />
northeast, the range vector indicates<br />
that any source in that direction could<br />
not be associated with a glacier. While<br />
we do not have directivity information<br />
for the Queen Inlet events, we do have a<br />
P-S At estimate from Figure 6 (at the<br />
bottom) of approximately 1.1 seconds<br />
which translates, according to Jeffreys<br />
<strong>and</strong> Bullen, to a distance of 9.4 km or<br />
about 5 n.m. A probable source of the<br />
Queen Inlet events, theref ore, is<br />
Carroll Glacier, immediately to the<br />
north of the measurement site.<br />
With the knowledge of mean sound<br />
pressure levels of these events as<br />
received at Station 27, it is possible<br />
to develop a rough estimate of the<br />
seismic energy released at the source.<br />
Our sound transmission loss measurements<br />
demonstrated a 15 log (range) dependency<br />
for spreading loss in water <strong>and</strong> Ewing,<br />
Jardetsky <strong>and</strong> Press (1957) indicate a<br />
similar dependency for body waves (shear<br />
<strong>and</strong> <strong>com</strong>pressional) propagating over<br />
short distances for surface focus<br />
events.<br />
Sound pressure is related to<br />
radiated acoustic power (W) by the<br />
relationship,<br />
where r is the distance from the source<br />
in meters, p is the r.m.s. acoustic<br />
sound pressure in pascals, <strong>and</strong> p <strong>and</strong> c<br />
are the density <strong>and</strong> sound speed of<br />
water. Radiated acoustic power at the<br />
water/rock interface for a sound<br />
pressure at the research vessel of 100<br />
dB//uPa 18 0.17 watts based on <strong>com</strong>puting<br />
the sound pressure at the radiating rock<br />
face 13 n.m. away <strong>and</strong> using the above<br />
relationship. Sound pressure at the<br />
water/rock interface is estimated from
where po<br />
research<br />
pressure<br />
is the sound pressure at the<br />
vessel <strong>and</strong> p is the predicted<br />
at the rock face r meters away.<br />
For 110 dB//pPa, the acoustic power at<br />
the rock face is 1.7 watts. Predicted<br />
energy at the source of the seismic<br />
event is:<br />
w<br />
Eb = 10 log(;) + 15 log R,<br />
(dB//l watt), (for body waves)<br />
where 11 is the rock-to-water energy con-<br />
version efficiency <strong>and</strong> R is the distance<br />
in meters through the rock material to<br />
the source. Converting these dB values<br />
to power <strong>and</strong> multiplying by the seismic<br />
impulse duration in seconds provides the<br />
watt-sec impulse power at the source.<br />
Energy in the more conventional seismic<br />
units (joules or ergs) is obtained by<br />
application of st<strong>and</strong>ard unit conversion<br />
factors. We have assumed that solid<br />
friction losses in rock for this case<br />
are small <strong>com</strong>pared to spreading losses.<br />
Further, if we assume a 5% seismic<br />
energy-to-<strong>under</strong>water sound energy con-<br />
version efficiency <strong>and</strong> that the 6 n.m.<br />
rock transmission path length is reason-<br />
able, we <strong>com</strong>pute the event energies <strong>and</strong><br />
earthquake magnitudes shown in the<br />
following table. The earthquake energy/<br />
magnitude relationship used for shallow<br />
focus local events <strong>and</strong> body waves is<br />
that provided by Richter (19581,<br />
log E = 9.9 + 1.92 M -0.024M<br />
L L<br />
where E is energy in ergs <strong>and</strong> ML is<br />
local earthquake magnitude.<br />
Source Energy Estimates*<br />
Mean SPL at<br />
Hydrophone<br />
(Initial<br />
Impulse for<br />
1 second<br />
duration) 100 dB//pPa 110 dB//pPa<br />
Body Waves:<br />
Energy 4 x 10 Joules 4 x 1 0 Joules<br />
Earthquake<br />
Magnitude M = 1.9 M = 2.5<br />
*See text for glacially related seismic<br />
event magnitude estimates by others.<br />
Conclusions<br />
Seismic events (primarily body<br />
waves) due to stick-slip action at the<br />
ice/rock interface in glaciers in<br />
Glacier Bay probably are the cause of<br />
<strong>under</strong>water acoustic impulsive events<br />
which often occur as frequently as 3 to<br />
4 times per minute <strong>and</strong> may have a<br />
diurnal <strong>and</strong> seasonal variation in event<br />
rate.<br />
The question regarding the possi-<br />
bility of a microseismic cause of these<br />
impulsive events due to isostatic<br />
rebound <strong>and</strong> resulting fracturing <strong>and</strong><br />
slippage in existing fault zones is not<br />
resolved. A wintertime measurement<br />
period may help to answer this question<br />
since it is expected that stick-slip<br />
action of glaciers would tend to be<br />
suppressed in the winter <strong>and</strong> rebound<br />
rate would remain relatively unchanged.<br />
More synoptic measurements should<br />
be performed using both a hydrophone<br />
array <strong>and</strong> a seismometer array with<br />
simultaneous recording to help remove<br />
assumptions <strong>and</strong> ambiguities which were<br />
used in this analysis.<br />
References<br />
Dewart, G. 1968, "Seismic Investigation<br />
of Ice Properties <strong>and</strong> Bedrock Topography<br />
at the Confluence of Two Glaciers,<br />
Kaskawulsh Glacier, Yukon Territory,<br />
Canada," Institute of Polar Studies,<br />
Re<strong>port</strong> No. 27.<br />
Ewing, W.M., W.S. Jardetsky, <strong>and</strong> F.<br />
Press. 1957, Elastic Waves in Layered<br />
Media, McGraw Hill.<br />
Hale, L.Z. <strong>and</strong> R.G. Wright. 1979, "The<br />
Glacier Bay Marine Ecosystem; A<br />
Conceptual ecological Model," National<br />
Park Service.<br />
Jeffreys, H. <strong>and</strong> K.E. Bullen. 1958,<br />
Seismological Tables, British<br />
Association for Advancement of Science.<br />
MacKevett, E.M., Jr., D.A. Brew, C.C.<br />
Hawley, L.C. Huff, J.G. Smith. 1971,<br />
"Mineral Resources Glacier Bay National<br />
Monument, Alaska," Geological Survey
Professional Paper #632, U.S. Geological<br />
Survey.<br />
Malme, C.I., P.R. Miles, P.T. McElroy.<br />
1982, "The Acoustic Environment of<br />
Humpback Whales in Glacier Bay <strong>and</strong><br />
Frederick SoundIStephens Passage,<br />
Alaska," BBN Re<strong>port</strong> No. 4848.<br />
Neave, K.G. <strong>and</strong> J.C. Savage. 1970,<br />
"Icequakes on the Athabasca Glacier, "<br />
Jour. Geoph. Res. (75), No. 8, pp. 1351-<br />
1362.<br />
Richter, C.F. 1958, Elementary<br />
Seismology, W.H. Freeman Co.<br />
Vanwormer, D. <strong>and</strong> E. Berg. 1973,<br />
"Seismic Evidence for Glacier Motion,"<br />
Journal of Glaciology (12), No. 65, pp.<br />
259-265.<br />
Weaver, C.S. <strong>and</strong> S.D. Malone. 1979,<br />
"Seismic evidence for Discrete Glacier<br />
Motion at the Rock-Ice Interface,"<br />
Journal of Glaciology (23), No. 89, pp.<br />
171-184.
Following presentation of the<br />
technical papers, symposium speakers<br />
participated in a panel discussion on<br />
potential directions for research rela-<br />
tive to noise <strong>and</strong> marine mammals.<br />
Suggested topics for additional<br />
research (<strong>and</strong> the name of the panelist<br />
or audience member initiating each<br />
topic) are summarized as follows:<br />
1. Investigation of the hearing <strong>and</strong><br />
vocalization of seals <strong>and</strong> small ceta-<br />
ceans relative to frequency thresholds<br />
<strong>and</strong> b<strong>and</strong> widths (J. Terhune) ;<br />
2. Selection of a particular species<br />
(e.g., ringed seals) from which data on<br />
ecological effects may be extrapolated<br />
to other species (B. Kelly);<br />
3. Tracking of a large whale species<br />
(e.g., humpback whale) to test acoustic<br />
responses in a manner similar to work<br />
performed by Sam Ridgeway (W. Turl);<br />
4. Further analysis of bowhead whale<br />
distribution data to test the theory<br />
that whales may be excluded from<br />
particular industrial zones (Tom<br />
Newbury, Minerals Management Service<br />
(MMS) ) ;<br />
5. Use of synoptic monitoring systems<br />
(without observers) to collect data on<br />
the physical acoustics of particular<br />
areas (C. Malme);<br />
6. Consideration of the basic behav-<br />
ioral responses of marine mammals to<br />
long-term noise (S. Cosens); <strong>and</strong><br />
7. Radio-tagging large cetaceans to<br />
the extent that this is feasible (Tom<br />
Albert, North Slope Borough (NSB)).<br />
The merits of selecting a particular<br />
key species for extrapolation of<br />
certain results to other species<br />
(suggestion 2 above) were discussed<br />
further. Major points made during this<br />
discussion were the following:<br />
PANEL DISCUSSION<br />
Stephen D. Treacy<br />
Minerals Management Services, Anchorage, Alaska, USA<br />
a. A scientific benefit derives<br />
from long-term research continuity with<br />
a single species (K. Frost).<br />
b. Key species should be select-<br />
ed based to some extent on the ease by<br />
which information can be collected <strong>and</strong><br />
on their wide geographic distribution<br />
(S. Cosens). Key species should be<br />
selected based, in part, on the extent<br />
of existing good data (Tom Newbury,<br />
MMS). Existing data, however, may be<br />
poor <strong>and</strong> may require a great amount of<br />
initial attention (B. Kelly).<br />
c. An overall problem with the<br />
key species approach is that, at least<br />
in the case of Tursiops sp. where<br />
long-term data exist over 20 years, the<br />
data would not extrapolate to other<br />
species (W. Turl).<br />
d. The key species approach may<br />
reflect economic reality . In marine<br />
mammal science (B. Kelly).<br />
e. Any key species had better be<br />
highly similar for data extrapolation<br />
to apply (W. Turl). Extrapolation is<br />
difficult even from area to area for<br />
the same species CJ. Ward).<br />
One qualifying statement on the topic<br />
of bowhead whale exclusionary zones<br />
(suggestion 4 above) was that analyses<br />
of bowhead distribution data showing<br />
areas where impact (or lack of impact)<br />
occurred should indicate the degree of<br />
variability. The accuracy of statis-<br />
tical tests used will determine the use<br />
of such results (Tom Albert, NSB).<br />
Major points made about radio-tagging<br />
of marine mammals (suggestion 7 above)<br />
were:<br />
a. Radio-tagging is an excellent<br />
approach: it provides reams of data<br />
quickly on difficult management <strong>and</strong><br />
scientific issues (J. Terhune).
. Radio-tagging is expensive<br />
<strong>and</strong> provides a small sample of individ-<br />
ual animals tagged (B. Kelly).<br />
c. Radio-tagging of polar bears<br />
has helped greatly in determining off-<br />
shore denning of polar bears (J. Ward).<br />
This is because the polar bear is one<br />
species that does have a large percent-<br />
age of tagged individuals (B. Kelly).
AUTHOR LIST<br />
Au.W.W.L ........................<br />
Bird . J . E . ........................<br />
Burns. J . J . .......................<br />
89<br />
55<br />
27<br />
Cosens. S . ........................ 39<br />
Cowles. C . J . ...................... 1<br />
Dueck. L . P ........................ 39<br />
Frost. K . J . ........................ 15<br />
Imm. J . L . ........................ 1<br />
Kelley. B . P . ....................... 27<br />
Lowry. L . F . ....................... 15<br />
Malme. C . I . ....................... 55:95<br />
Miles. P . R . ....................... 95<br />
Penner.R.H . ...................... 89<br />
Pessah . E ......................... 75<br />
Quakenbush. L . T . ................ 27<br />
Terhune. J . M ...................... 9<br />
Treacy. S . D . ................... 109<br />
Turl. C . W . ....................... 89<br />
Tyack. P . ......................... 55<br />
Ward. J . G . ....................... 75<br />
Wursig. B . ..................... 55<br />
Ill