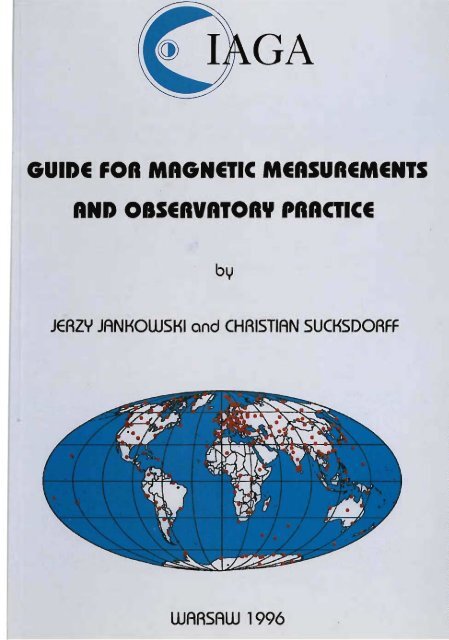
IAGA Guide for magnetic measurements and observatory praxis
IAGA Guide for magnetic measurements and observatory praxis
IAGA Guide for magnetic measurements and observatory praxis

You also want an ePaper? Increase the reach of your titles
YUMPU automatically turns print PDFs into web optimized ePapers that Google loves.
GA<br />
GUIDE FOR MAGNETIC MEASUREMENTS<br />
AND OISERVAIORY PRACTICE<br />
. by<br />
JERZY JANKOWSKI <strong>and</strong> CHRISTIAN SUCKSDORFF<br />
WARSAW 1996
Copyright © 1996<br />
by International Association of Geomagnetism <strong>and</strong> Aeronomy<br />
No part of this publication may be reproduced without the written consent<br />
of the Secretary-General of the International Association of Geomagnetism <strong>and</strong> Aeronomy.<br />
ISBN: 0-9650686-2-5<br />
Published by:<br />
International Association of Geomagnetism <strong>and</strong> Aeronomy<br />
J. A. Joselyn, Secretary-General<br />
NOAA Space Environment Center, 325 Broadway, Boulder, CO 80303-3328, USA<br />
Camera ready copy prepared by:<br />
Editorial Office of the Institute of Geophysics<br />
Polish Academy of Sciences<br />
Ks. Janusza 64, 01-452 Warszawa, Pol<strong>and</strong><br />
Printed <strong>and</strong> bound by:<br />
Zesp6l Wydawniczy Centrum Badm Kosrnicznych PAN<br />
ul. Bartycka 18a. 00-716 Warszawa, Pol<strong>and</strong>
CONTENTS<br />
1. INTRODUCTION ............................................... 7<br />
2. THE MAGNETIC FIELD OF THE EARTH ...................... 15<br />
2.1 Main field <strong>and</strong> secular variation . . . . . . . . . . . . . . . . . . . . . . . . . . . . . . .. 16<br />
2.2 Crustal anomalies ............................................ 23<br />
2.3 Regular variations of the <strong>magnetic</strong> field .......................... 24<br />
2.4 Magnetic disturbances ....................................... 28<br />
2.5 Special events <strong>and</strong> <strong>magnetic</strong> pulsations ........................... 30<br />
2.6 Geo<strong>magnetic</strong> coordinates <strong>and</strong> geo<strong>magnetic</strong> time ................... 33<br />
3. SELECTION OF OBSERVATORY SITE AND LAYOUT<br />
OF THE OBSERVATORY ....................................... 36<br />
3.1 Requirements <strong>for</strong> the <strong>observatory</strong> site ........................... 37<br />
3.2 Buildings at a <strong>magnetic</strong> <strong>observatory</strong> ............................ 38<br />
3.3 Avoiding gaps in recordings ................................... 47<br />
3.4 Some practical advice ........................................ 48<br />
4. MAGNETOMETERS ........................................... 51<br />
4.1 Definitions ................................................. 51<br />
4.2 Short notes about some historical instruments ..................... 53<br />
4.3 Torsion magnetometers ....................................... 54<br />
4.3.1 Declinometer. ......................................... 54<br />
4.3.2 Quartz horizontal magnetometer QHM ..................... 56<br />
4.4 Torsion variometers .......................................... 59<br />
4.5 Photoelectric feed-back magnetometer ........................... 61<br />
4.6 Proton precession magnetometer ................................ 65<br />
4.7 Overhauser magnetometer. .................................... 73<br />
4.8 Optically pumped magnetometers ............................... 76<br />
4.9 Fluxgate magnetometer ....................................... 79<br />
4.10 Superconducting magnetometers ............................... 84<br />
5. ABSOLUTE MAGNETIC MEASUREMENTS ..................... 86<br />
5.1 Use of fluxgate theodolite to measure declination D <strong>and</strong> inclination I .. 87<br />
5.2 Calculation of misalignment of the fluxgate sensor ................. 98<br />
5.3 Use of the proton precession magnetometer to measure<br />
total intensity F .......................................... " 102<br />
5.4 Use of the proton precession magnetometer <strong>for</strong> measurement of the<br />
<strong>magnetic</strong> field components . . . . . . . . . . . . . . . . . . . . . . . . . . . . . . . . . .. 102<br />
5.5 Use of the declinometer to measure declination D . . . . . . . . . . . . . . . .. 111<br />
5.6 Use of the QHM to measure horizontal intensity H ................ 115<br />
5.7 Detennination of azimuth from Sun-observations ................. 118
6. RECORDING OF MAGNETIC VARIATIONS ................... 125<br />
6.1 Installation of the station. . . . . . . . . . . . . . . . . . . . . . . . . . . . . . . . . . . .. 125<br />
6.2 Temperature effects . . . . . . . . . . . . . . . . . . . . . . . . . . . . . . . . . . . . . . . .. 129<br />
6.3 Tilt: compensation <strong>and</strong> correction ............................. 130<br />
604 Time keeping at a <strong>magnetic</strong> <strong>observatory</strong> ........................ 132<br />
6.5 Digital recording . . . . . . . . . . . . . . . . . . . . . . . . . . . . . . . . . . . . . . . . . . . 134<br />
6.6 Analog recording ........................................... 136<br />
6.7 Comparison of analog <strong>and</strong> digital recording systems .............. 136<br />
7. DATA PROCESSING ................ . .................... . ... 138<br />
7.1 Sampling rate ............................................. 139<br />
7.2 Base-line values ........................................... 142<br />
7.3 Removing artificial disturbances .............................. 143<br />
7 A Dissemination of data . . . . . . . . . . . . . . . . . . . . . . . . . . . . . . . . . . . . . .. 146<br />
7.5 Observatory yearbooks ...................................... 148<br />
7.6 Activity indices <strong>and</strong> special events ............................. 150<br />
7.7 INTERMAGNET .......................................... 153<br />
7.8 Observatory routine ... .. .................................... 156<br />
8. TESTING AND CALIBRATING INSTRUMENTS ................ 158<br />
8.1 General connection between field-component variations <strong>and</strong> the output<br />
of variometers ............................................. 158<br />
8.2 Testing orthogonalities by comparison .......................... 160<br />
8.3 Testing orthogonalities <strong>and</strong> sensitivities using coil systems .......... 162<br />
804 Testing using a turntable . . . . . . . . . . . . . . . . . . . . . . . . . . . . . . . . . . . .. 166<br />
8.5 Testing <strong>and</strong> adjusting absolute instruments ....................... 167<br />
8.6 Comparisons of absolute instruments ........................... 171<br />
8.7 Coil systems <strong>for</strong> testing magnetometers ......................... 173<br />
9. INFLUENCE OF INDUCTION IN MAGNETIC RECORDINGS . .. 177<br />
9.1 Practical consequences .................................. . . .. 181<br />
10. USEFUL CONTACTS AND ADDRESSES ....................... 183<br />
10.1 <strong>IAGA</strong>, the International Association of Geomagnetism <strong>and</strong> Aeronomy. 183<br />
10.2 World Data Centers. . . . . . . . . . . . . . . . . . . . . . . . . . . . . . . . . . . . . . . .. 184<br />
10.3 International Service of Geo<strong>magnetic</strong> Indices .............. . . . . .. 186<br />
lOA INTERMAGNET .......................................... 186<br />
11. MISCELLANEOUS. . . . . . . . . . . . . . . . . . . . . . . . . . . . . . . . . . . . . . . . . .. 189<br />
11.1 Micro<strong>magnetic</strong>s ............................ '. . . . . . . . . . . . . . .. 189<br />
11.2 Geomagnetism <strong>and</strong> biology. . . . . . . . . . . . . . . . . . . . . . . . . . . . . . . . . .. 189<br />
11.3 Influence of <strong>magnetic</strong> activity on radio communications, satellites <strong>and</strong><br />
power lines. . . . . . . . . . . . . . . . . . . . . . . . . . . . . . . . . . . . . . . . . . . . . . .. 190
1104 Prediction of <strong>magnetic</strong> activity . ............ . ..... . .. .. .. . ..... 191<br />
12. A FORWARD LOOK ........ .. ... . .......... .. ... . .. . . .. . .. . . 194<br />
12.1 Uses of geo<strong>magnetic</strong> data ... .. . . ......... ... .... ...... .. .. . . . 194<br />
12.2 Future instrumentation .. . .............. . .. .... .. .. ... . . .. . .. 195<br />
12.3 Network of observatories . .. . .......... ....... . ... . ...... . ... 198<br />
13. LITERATURE .............. . . . . . . . . . . . . . . . . . . . . . . . . . . . . . . . . . 200<br />
APPENDIX I: MAGNETIC OBSERVATORIES . .. . .... ....... . .... 205<br />
APPENDIX II: SI AND GAUSSIAN UNITS IN GEOMAGNETIC<br />
PRACTICE ................ .... . ......... . .. . . ............... 213<br />
APPENDIX III: <strong>IAGA</strong> RESOLUTIONS RELEVANT TO<br />
OBSERVATORIES ...... . . ............ .... .. .. . .. . .. .. ........ 217<br />
APPENDIX IV: DISTURBING EFFECT OF MAGNETIC MATERIAL<br />
ON MEASUREMENTS . .... ... .. . ... . . .. . ... . . ............... 225<br />
IV.l Magnetic field of a sphere in an external <strong>magnetic</strong> field . . . . . . . . . . . . 225<br />
IV.2 Demagnetization factor . ... . ..... .. .... . .. . .. . .... . . . . ...... 226<br />
IV.3 Induced <strong>and</strong> remanent magnetization of a <strong>magnetic</strong> body ... . . . .. . .. 228<br />
IVA Simplified <strong>for</strong>mulae <strong>for</strong> the calculation of the effect of a <strong>magnetic</strong><br />
body .... . .. . .. . .. .. . . . ......... . .. .. . . . . .. . . ..... .... . . .. 229<br />
SUBJECT INDEX ... . ...... . ....... . .... . ..... . . ... . ... . . . ... . .. 233
1. INTRODUCTION<br />
The objective of geo<strong>magnetic</strong> observatories is to record continuously, <strong>and</strong> over the<br />
long term, the time variations of the <strong>magnetic</strong> field vector <strong>and</strong> to maintain the<br />
accurate absolute st<strong>and</strong>ard of the <strong>measurements</strong>.<br />
To fulfill the present requirements of accuracy means that over the whole recorded<br />
spectrum, the variations should be recorded with an accuracy of about 1 % or better.<br />
To achieve this at the low frequency end of the spectrum, which means very slow<br />
variations like the annual change, current technology requires independent absolute<br />
<strong>measurements</strong> to be made periodically in order to calibrate the continuously<br />
recording instruments.<br />
This <strong>Guide</strong> describes the present instrumentation in geomagnetism, concentrating<br />
mainly on the use of the instruments so that the required high accuracy is achieved.<br />
The main phenomena studied in geomagnetism are also briefly described, <strong>and</strong> so is<br />
the physics· behind the measurement techniques, because we believe that<br />
underst<strong>and</strong>ing why <strong>and</strong> how the <strong>measurements</strong> are made increases the interest in the<br />
work <strong>and</strong> leads to higher quality results.<br />
The history of magnetism <strong>and</strong> its practical use is thous<strong>and</strong>s of years long,<br />
according to ancient literature <strong>and</strong> poems. No exact data exist on the discovery of the<br />
compass <strong>and</strong> its use; they are only mentioned in other contexts. The mystical power<br />
of magnetite or lodestone of attracting iron particles is mentioned by the Chinese<br />
hundreds of years B.C. So is the method <strong>for</strong> making needles <strong>magnetic</strong> <strong>and</strong> north or<br />
south orienting by rubbing the needles with lodestone. According to the book entitled<br />
Dream Pool Essays by the Chinese scientist Shen Kua, the Chinese used compasses<br />
in seafaring in the eleventh century A.D. On l<strong>and</strong>, south pointing needles were in use<br />
in China perhaps thous<strong>and</strong>s of years earlier. Iron technology was advanced in ancient<br />
China. The Chinese could produce steel, which was a good material <strong>for</strong> compass<br />
needles. The earliest definite mention of the use of a mariner's compass in Europe is<br />
by Alex<strong>and</strong>er Neckam, about 1190, in his De Utensilibus <strong>and</strong> De Naturis Rerum, but<br />
probably the compass was already a routine instrument at that time (<strong>for</strong> the history of<br />
terrestrial magnetism see, e.g., Chapman <strong>and</strong> Bartels (1940), pp. 898-937, <strong>and</strong> <strong>for</strong> the<br />
Chinese inventions, e.g., Temple (1986), <strong>and</strong>, in greater detail, Science <strong>and</strong><br />
Civilisation in China by Joseph Needham (Needham, 1962), where Vol. 4, Part 1,<br />
deals with the physical sciences including music <strong>and</strong> magnetism).<br />
The <strong>magnetic</strong> variation or <strong>magnetic</strong> declination (the compass needle does not point<br />
exactly to geographic north) was probably known in China long be<strong>for</strong>e it became<br />
known in Europe. That the declination was known in Europe by about 1450 A.D. has<br />
been deduced from portable sun-dials, which often have a compass in which the<br />
deviation from geographical north is marked. Centuries older Chinese geomancer's
- 8 -<br />
c')mpasses have two sets of points showing the <strong>magnetic</strong> declination at two different<br />
times in the past (Temple, 1986). Columbus on his voyage to America in 1492<br />
supposedly reported the change of declination with longitude, but no reliable<br />
documents have been found.<br />
That the <strong>magnetic</strong> needle also shows an inclination was probably first discovered<br />
by Georg Hartmann in Rome in about 1510, according to his letter of 1544 in which<br />
he pointed out that in addition to declination, the needle also tilted with respect to<br />
the horizontal plane.<br />
Based on observations of inclination available from different latitudes, William<br />
Gilbert published in 1600 his famous book De Magnete in which he pointed out that<br />
the Earth itself acts as a great spherical magnet. This can be considered the beginning<br />
of the science of Eartfi magnetism.<br />
Until the year 1634 it was believed that <strong>magnetic</strong> declination was only a function<br />
of position. In 1634 Henry Gellibr<strong>and</strong> measured declination in London to be 4.1 °E.<br />
In 1580 Burrow <strong>and</strong> Norman had measured, at the same site, 11.3°W. The change in<br />
declination was too big to be an error in the observations. The conclusion was that<br />
declination changed with time: the so-called secular variation of the geo<strong>magnetic</strong><br />
field was discovered.<br />
The continuous daily variation of <strong>magnetic</strong> declination was published by Graham<br />
in 1722; he observed irregular variations of up to 30' in his improved declinatorium.<br />
Celsius in Uppsala confirmed these observations in 1740, <strong>and</strong> his student Hiorter<br />
found that during auroral displays the compass needle could move by degrees. In a<br />
letter to Graham, Celsius asked him to make observations in London at the same<br />
times as Hiorter made observations in Uppsala. The simultaneity of <strong>magnetic</strong><br />
disturbances was confIrmed. Later observations showed that inclination also varied.<br />
After Coulomb's invention of a relative method to measure the intensity of the<br />
horizontal component of the <strong>magnetic</strong> fIeld in 1785 (torque, oscillating magnet), the<br />
intensity was also found to vary with time. Finally, in 1832 Carl Friedrich Gauss'<br />
paper on absolute measurement of the intensity of the <strong>magnetic</strong> field was published.<br />
Now tools were available <strong>for</strong> the measurement of all components of the vector<br />
representing the <strong>magnetic</strong> fIeld of the Earth. The field was observed to vary with<br />
place <strong>and</strong> time.<br />
Alex<strong>and</strong>er von Humboldt showed that the intensity of the horizontal <strong>magnetic</strong> field<br />
was strongest at the equator <strong>and</strong> weakest at the poles. He made observations of<br />
oscillating magnets over several years in different parts of the world, including both<br />
Americas (1799-1803). On his initiative, <strong>magnetic</strong> observatories were created in<br />
many countries <strong>for</strong> synoptic observation of the variations of the fIeld. In Gottingen,<br />
Gauss <strong>and</strong> Weber began in 1834 to participate in von Humboldt's program: during<br />
eight periods of 44 hours the needle was observed at least once every hour. In 1838
- 9 -<br />
von Humboldt wrote to different authorities encouraging them to adopt Gauss'<br />
manner of observing. A number of observatories joined the Magnetische Verein<br />
(Gottingen Magnetic Union) which proposed that observations be made at 5-minute<br />
intervals. The total number of observatories participating in the years 1836-1841 was<br />
about fifty. The simultaneity of <strong>magnetic</strong> disturbances over large areas was<br />
confirmed. Gauss developed his general theory of geomagnetism <strong>and</strong> showed that<br />
almost all the <strong>magnetic</strong> field observed at the Earth's surface originated inside the<br />
Earth (Gauss, 1839).<br />
Since the time of Gauss, the number of geo<strong>magnetic</strong> observatories has grown to<br />
about 150 (Figure 1.1), partly due to international campaigns like the International<br />
Polar Year 1882-1883, Second International Polar Year 1932-1933, International<br />
Geophysical Year 1957-1958 <strong>and</strong> several campaigns thereafter. The role of<br />
observatories has been <strong>and</strong> still is essential in monitoring the variations of the<br />
geo<strong>magnetic</strong> field, both <strong>for</strong> science <strong>and</strong> <strong>for</strong> commercial <strong>and</strong> governmental uses, as<br />
will be briefly discussed later. Today, in addition to the permanent geo<strong>magnetic</strong><br />
observatories, there are many recording stations in operation during special<br />
campaigns in different parts of the world. These temporary stations have as a rule<br />
similar magnetometers to those used at modern <strong>magnetic</strong> observatories.<br />
There are global, regional <strong>and</strong> local needs <strong>for</strong> geo<strong>magnetic</strong> observatories. An<br />
140<br />
130<br />
120<br />
110<br />
100<br />
90<br />
....<br />
Q)<br />
80<br />
..0<br />
E 70<br />
::l<br />
Z 60 !.<br />
50<br />
40<br />
30<br />
20<br />
10<br />
o ,<br />
1830 1840 1850 1860 1870 1880 1890 1900 1910 1920 1930 1940 1950 1960 1970 1980 1990<br />
Year<br />
Figure 1.1. Number of <strong>magnetic</strong> observatories providing annual means to WDC Cl<br />
by the end of 1994, located in the northern (grey) <strong>and</strong> southern (black) hemispheres.<br />
Courtesy of the Geomagnetism Group, British Geological Survey.
Currently operating observatories on a Hammer equal-area projection<br />
Figure 1.2a. Pennanent geo<strong>magnetic</strong> observatories in operation in 1994. A list of the observatories with codes <strong>and</strong> coordinates is given<br />
in Appendix 1. Courtesy of the Geomagnetism Group, British Geological Survey.<br />
o
- 11 -<br />
Figure 1.2b. European permanent geo<strong>magnetic</strong> observatories in operation in 1994.<br />
Courtesy of the WDC A.<br />
important global task is to monitor the secular variation of the <strong>magnetic</strong> field allover<br />
the world, because the secular variation is the only known way to study the motions<br />
of the electrically conducting fluid in the Earth's outer core, in which the main<br />
geo<strong>magnetic</strong> field is generated. A sufficiently dense global network is also needed <strong>for</strong><br />
the calibration <strong>and</strong> control of <strong>magnetic</strong> survey satellites used in detailed surveys of<br />
the <strong>magnetic</strong> field. A global network is essential in monitoring <strong>magnetic</strong> storms <strong>and</strong><br />
other <strong>magnetic</strong> variations, · because these phenomena affect large areas of the Earth<br />
<strong>and</strong> have different effects in different areas. A global network is needed <strong>for</strong> research<br />
into current systems in the ionosphere <strong>and</strong> magnetosphere <strong>and</strong> induced currents in the<br />
crust <strong>and</strong> mantle. A more dense network than the present one is needed in the polar<br />
cap areas due to their special role in a number of studies connected with<br />
magnetospheric phenomena, <strong>and</strong> also in the equatorial region, where the behavior of<br />
the equatorial electrojet needs detailed study. The variations of the <strong>magnetic</strong> field
- 12 -<br />
near the equator are also important <strong>for</strong> studies of the ring current in the near-Earth<br />
space.<br />
A typical regional need <strong>for</strong> a <strong>magnetic</strong> <strong>observatory</strong> is to serve as a base station <strong>for</strong><br />
<strong>magnetic</strong> surveys. The data from the <strong>observatory</strong> or preferably from several<br />
observatories in the region are used in reducing the measured survey data to the<br />
desired epoch (more on the reduction of data is to be found in the <strong>Guide</strong> <strong>for</strong> Magnetic<br />
Repeat Station Surveys by Newitt, Barton <strong>and</strong> Bitterly, 1996). The final product of a<br />
survey is usually a regional <strong>magnetic</strong> chart, which is later updated at regular intervals<br />
with the help of the secular variation recorded at the observatories, thus making a<br />
new detailed <strong>magnetic</strong> survey unnecessary. In many cases this means large savings of<br />
funds . Another regional use is working as a base station in magnetotelluric<br />
soundings.<br />
From a local point of view, a <strong>magnetic</strong> <strong>observatory</strong> monitors the local <strong>magnetic</strong><br />
variations, the knowledge of which is needed, <strong>for</strong> example, in cormection with<br />
observed power failures or difficulties in telecommunications. An <strong>observatory</strong><br />
provides facilities <strong>for</strong> calibration of <strong>magnetic</strong> instruments. Very often the <strong>observatory</strong><br />
is the only place to obtain in<strong>for</strong>mation on local geo<strong>magnetic</strong> declination <strong>and</strong> its<br />
change, <strong>and</strong> in the case of special phenomena like aurora, confirmation of the natural<br />
character of the phenomenon may be obtained from the <strong>observatory</strong>. Local recording<br />
of <strong>magnetic</strong> variations is often needed by prospecting companies <strong>for</strong> the reduction of<br />
their data.<br />
The examples mentioned above show the need <strong>for</strong> <strong>magnetic</strong> observatories. To<br />
facilitate work at observatories, several guides <strong>for</strong> <strong>observatory</strong> practice have been<br />
written over the years. The last manual was K. Wienert's (1970) Notes on<br />
Geo<strong>magnetic</strong> Observatory <strong>and</strong> Survey Practice. It is an excellent book giving<br />
practical advice <strong>and</strong> solutions to probably all the problems at observatories <strong>and</strong> in<br />
<strong>magnetic</strong> field work faced at that time, more than twenty years ago.<br />
Many of the problems in <strong>observatory</strong> work <strong>and</strong> their solutions are still the same.<br />
These we shall discuss only briefly in this <strong>Guide</strong>, referring to Wienert, whose Notes .. .<br />
we expect every <strong>observatory</strong> to have on its bookshelf. The older manuals, D.L.<br />
Hazard's (1947) Directions <strong>for</strong> Magnetic Measurements, H.E. McComb's (1952)<br />
Magnetic Observatory Manual <strong>and</strong> R. Bock's (1942) Praxis der Magnetischen<br />
Messungen deal with classical instruments which are practically no longer in use.<br />
Many chapters in these old manuals are devoted to the fields of permanent magnets.<br />
The nature of the <strong>observatory</strong> work has changed much since Wienert's book was<br />
written. Today most observatories produce their data in digital <strong>for</strong>m, which was so<br />
rare twenty-five years ago that Wienert did not discuss it at all. New techniques in<br />
instrumentation have made it possible to automate part of the <strong>observatory</strong> work. This,<br />
in principle, positive, fund-saving development has at the same time created some
- 13 -<br />
new problems. One is the fact that professional observers in charge are becoming<br />
more <strong>and</strong> more scarce. This has led, at some observatories, to a reduction in accuracy.<br />
We feel that this does not need to be the case. On the contrary, the modem<br />
instruments allow, if properly used, an increase of absolute accuracy. This is<br />
important, because the new era with global <strong>magnetic</strong> surveys using satellites will<br />
need even more accurate <strong>observatory</strong> data than be<strong>for</strong>e. For example, the annual<br />
secular variation in some areas is only of the order of one nT per year, which shows<br />
that the accuracy of the annual mean values has to be at least this high. There<strong>for</strong>e, the<br />
highest possible absolute accuracy is a goal at all observatories. Ef<strong>for</strong>ts to achieve<br />
high accuracy used to be a tradition at the observatories where specially trained<br />
scientific staff with scientific ambitions worked. Today the observers are often<br />
technicians who are highly skilled in h<strong>and</strong>ling modern technology. One of the<br />
intentions of this <strong>Guide</strong> is to convince the observers of the importance of their work.<br />
Methods of absolute <strong>magnetic</strong> measurement have changed during the last twenty<br />
years. The introduction of the proton magnetometer <strong>and</strong> non-<strong>magnetic</strong> theodolites<br />
with flux gate sensors have dramatically improved the situation <strong>and</strong> made it possible<br />
<strong>for</strong> almost anyone, with proper training, to succeed in making good <strong>measurements</strong>.<br />
Twenty years ago the <strong>measurements</strong> were almost an art, requiring special skill <strong>and</strong><br />
much training.<br />
The importance of absolute <strong>measurements</strong> as a verification of the recording<br />
instruments is roughly the same as be<strong>for</strong>e. Some of the new recording instruments are<br />
stable enough to allow a reduction of the number of absolute <strong>measurements</strong>,<br />
especially at observatories with back-up recording. Some other methods to control<br />
the stability can in some cases also be applied. Although they do not replace real<br />
absolute <strong>measurements</strong>, they are helpful <strong>and</strong> will be discussed in this <strong>Guide</strong>.<br />
The global network of <strong>magnetic</strong> observatories is in many areas too sparse to meet<br />
all the needs of <strong>magnetic</strong> surveying <strong>and</strong> <strong>for</strong> the study of physical phenomena inside<br />
<strong>and</strong> outside the Earth, as can be seen from Figure I.2a, which shows large areas<br />
without observatories even outside the oceans. Some new observatories are under<br />
construction <strong>and</strong> planned, especially <strong>for</strong> developing countries, but more are needed.<br />
This <strong>Guide</strong> gives some advice <strong>for</strong> the construction of new observatories <strong>and</strong><br />
recording stations. New observatories may also be needed <strong>for</strong> other reasons:<br />
railways, roads, buildings or other constructions may <strong>for</strong>ce the sensitive instruments<br />
at existing observatories to be moved to undisturbed areas.<br />
Many <strong>magnetic</strong> observatories are traditionally places capable of answering special<br />
questions concerning magnetism <strong>and</strong> its measurement. Also measurement of the<br />
magnetism of some objects or limited <strong>magnetic</strong> surveys are sometimes requested.<br />
This <strong>Guide</strong> h<strong>and</strong>les some of the most common questions <strong>and</strong> problems expected to<br />
appear.
- 14 -<br />
In addition to advice on <strong>observatory</strong> practice, we try to give some physical<br />
background on the instruments <strong>and</strong> phenomena because we feel that this in<strong>for</strong>mation<br />
is often requested from <strong>observatory</strong> staff <strong>and</strong> also that this may be helpful <strong>for</strong><br />
repairing instruments or judging the relevance of the results of recordings or<br />
<strong>measurements</strong>.<br />
As stated above, the <strong>measurements</strong> themselves require less skill from the observer<br />
than in older times. In many cases it is only a question of pushing a button or<br />
transmitting data collected in the memory of a computer. All this seems to favor<br />
automatic recording stations, visited rather infrequently by technicians. This is surely<br />
true <strong>for</strong> instrument arrays installed <strong>for</strong> special purposes, such as induction studies or<br />
studies of current systems in the ionosphere. But in the case of real <strong>magnetic</strong><br />
observatories producing data <strong>for</strong> a variety of studies starting from secular variation<br />
where the absolute accuracy should be at least 1 nT, we favor manned observatories<br />
with skilled personnel, whose interest is to produce data of as high quality as<br />
possible. So, the difficulty today is not in the absolute <strong>measurements</strong> but in the skill<br />
to judge the correctness of the data produced <strong>and</strong> in taking action as soon as some<br />
doubt appears. This is not possible without continuous monitoring <strong>and</strong> use of the<br />
data. Using modem electronic networks, monitoring can be centralized <strong>for</strong> a number<br />
of observatories, but we still believe that having the observer ori the spot is best to<br />
ensure the quality of the data.<br />
Referring to the general needs <strong>for</strong> <strong>magnetic</strong> observatories mentioned above, one of<br />
the first matters in planning a new <strong>observatory</strong> is to consult the map <strong>and</strong> see if in the<br />
planned area there possibly already exists an <strong>observatory</strong> close enough <strong>for</strong> the<br />
planned needs (e.g., a base station <strong>for</strong> <strong>magnetic</strong> surveys, <strong>for</strong> the updating of <strong>magnetic</strong><br />
charts, <strong>for</strong> tests of instruments or <strong>for</strong> scientific research). Advice <strong>and</strong> help from the<br />
Working Group <strong>for</strong> Magnetic Observatories (<strong>IAGA</strong> Div.V, WG 1; see Chapter 10) is<br />
always available <strong>and</strong> contact with the working group is recommended. In planning a<br />
new <strong>magnetic</strong> <strong>observatory</strong>, <strong>IAGA</strong> will provide advice, approve the official<br />
three-letter code <strong>for</strong> the <strong>observatory</strong>, recommend the scale <strong>for</strong> the activity indices K<br />
to be produced at the <strong>observatory</strong>, etc. INTERMAGNET (see Chapter 10) is also an<br />
excellent source of help <strong>and</strong> advice on <strong>observatory</strong> matters.<br />
The authors of this <strong>Guide</strong> wish to thank <strong>IAGA</strong> Division V <strong>and</strong> its Working Group<br />
<strong>for</strong> Magnetic Observatories <strong>for</strong> the encouragement to write this <strong>Guide</strong>. We especially<br />
wish to thank the participants of the roundtable meeting arranged by the Polish<br />
Academy of Sciences to discuss the <strong>Guide</strong> during one week in February 1994. The<br />
participants were David Kerridge, Richard Coles, Emil Kring Lauridsen, <strong>and</strong> the<br />
authors. The roundtable workshop was of great importance in shaping the final <strong>for</strong>m<br />
of the <strong>Guide</strong>.<br />
Special thanks are due to David Kerridge <strong>and</strong> Richard Coles <strong>for</strong> their thorough<br />
revision of the final text <strong>and</strong> very beneficial language corrections.
2. THE MAGNETIC FIELD OF THE EARTH<br />
The <strong>magnetic</strong> field of the Earth observed allover the globe is a vector field. Three<br />
components of the vector F are needed to describe the field. The usual components<br />
recorded or observed are plotted in Figure 2.1.<br />
z<br />
Figure 2.1. The elements of the field vector describing the Earth s <strong>magnetic</strong> field.<br />
X = north component of the vector, Y = east component of the vector, Z = vertical<br />
component of the vector (positive down) called vertical intensity, H = horizontal<br />
intensity or the horizontal component of the vector along local <strong>magnetic</strong> meridian<br />
(positive direction towards the north), D = <strong>magnetic</strong> declination or the angle (positive<br />
east) between the geographic north direction <strong>and</strong> the <strong>magnetic</strong> meridian (angle<br />
between X <strong>and</strong> H), <strong>and</strong> 1 = <strong>magnetic</strong> inclination or the angle between the horizontal<br />
intensity vector (H) <strong>and</strong> the direction of the <strong>magnetic</strong> field vector of total intensity<br />
(F). 1 is positive downward.<br />
The <strong>for</strong>mulas showing relations between the components (Figure 2.1) are<br />
r- = X2 + y2 + Z2 = H2 + Z2;<br />
H2=X2+ y2;
X=HcosD;<br />
Y=H sinD =Xtan D;<br />
- 16-<br />
Z = F sin I = H tan I; (2.1)<br />
D= arctan (Y/X);<br />
I = arctan (Z/H).<br />
As mentioned in the historical notes of Chapter 1, William Gilbert (1600) deduced<br />
from observations made at different latitudes that the Earth's <strong>magnetic</strong> field is similar<br />
to that of a magnetized sphere. His conclusion was that the Earth is a spherical<br />
magnet. Later, more detailed observations showed that the field at the Earth's surface<br />
roughly resembles the field of a <strong>magnetic</strong> dipole placed close to the Earth's center<br />
<strong>and</strong> tilted 11.5 0 from the rotation axis of the Earth. More than 90% of the observed<br />
field can be approximated by this simple dipole model. Today-we know that the field<br />
of a magnetized sphere is similar to the field of a <strong>magnetic</strong> dipole placed at the center<br />
of the sphere. We also know that the hypothesis of a magnetized sphere cannot be<br />
right because the iron in rocks cannot be magnetized at temperatures higher than the<br />
Curie point, which is exceeded at a depth of a few tens of kilometers. A static model<br />
cannot explain the long period variations of the field <strong>and</strong> even less the reversals of the<br />
field which are known to have occurred at irregular intervals of the order of hundreds<br />
of thous<strong>and</strong>s of years.<br />
According to the present explanation, the so-called hydro<strong>magnetic</strong> dynamo theory,<br />
the main part of the Earth's <strong>magnetic</strong> field arises from electrokinetic currents running<br />
at or close to the surface of the outer liquid core at a depth of about 2900 km. The<br />
field at the Earth's surface due to these currents is about 30 000 nT at the equator <strong>and</strong><br />
60000 nT in polar areas. The current systems in the core do not seem to be stable <strong>and</strong><br />
homogeneous. There<strong>for</strong>e, the field measured at the Earth's surface shows large<br />
anomalies compared to a dipolar field. These regional <strong>magnetic</strong> anomalies have<br />
dimensions of thous<strong>and</strong>s of kilometers <strong>and</strong> are caused mainly by the inhomogeneity<br />
of the electric currents inside the Earth. The non-uni<strong>for</strong>m distribution of <strong>magnetic</strong><br />
minerals in the Earth's crust is also seen as smaller scale anomalies in the otherwise<br />
rather smooth field. These local anomalies can be strong, several tens of thous<strong>and</strong>s<br />
ofnT.<br />
2.1 Main field <strong>and</strong> secular variation<br />
The main field of the Earth is that part of the field which has its origin in the core.<br />
The change of the main field is called secular variation, which well describes the<br />
slow character of the variation.
- 20-<br />
geo<strong>magnetic</strong> north pole, is, in 1995, situated at 10.5 0 northern colatitude <strong>and</strong> 288.6 0<br />
eastern longitude. The dipole moment (4n/l1o) Bo a 3 is approximately 8.1 ·1cr 2 A m 2 .<br />
The coefficients g; <strong>and</strong> h; are based on <strong>magnetic</strong> <strong>measurements</strong> made by satellites<br />
<strong>and</strong> at the surface. For many practical tasks <strong>and</strong> scientific work allover the world, a<br />
knowledge of the main field in different parts of the Earth is needed. There<strong>for</strong>e, the<br />
International Association of Geomagnetism <strong>and</strong> Aeronomy (lAG A, see Chapter 10)<br />
has decided to publish at five year intervals the so-called International Geo<strong>magnetic</strong><br />
Reference Field (IGRF), which is the field represented by harmonic coefficients up to<br />
10th degree (n = 1, 2, ... , 10). The coefficients were first calculated <strong>for</strong> the year<br />
1965.0. Later, IGRF's have been determined <strong>for</strong> the five-year epochs starting from<br />
1945.0. The 1990 revision of the IGRF is described by Langel (1991). The IGRF's<br />
are <strong>for</strong>mally accepted at the Assemblies of lAG A, which declares the IGRF as the<br />
Definitive International Geo<strong>magnetic</strong> Reference Field. (DGRF) when changes or<br />
additions to the data used in the calculation of the coefficients are no longer probable.<br />
Figures 2.2-2.4 show the geo<strong>magnetic</strong> charts of the world based on the 1990.0 IGRF.<br />
Table 2.1<br />
The first three harmonic coefficients <strong>for</strong> the representation of the Earth s <strong>magnetic</strong><br />
field <strong>for</strong> 1955.0-1990.0 (Langel, 1991). The first coefficient gives the intensity of the<br />
axial dipole, the second <strong>and</strong> third ones refer to the dipoles perpendicular to the first<br />
one. All three together represent the tilting dipole at the center of the Earth. The last<br />
column gives the annual change <strong>for</strong> 1990-1995<br />
n m 1955 1960 1965 1970 1975 1980 1985 1990 1990<br />
-95<br />
g 1 0 -30500 -30421 -30334 -30220 -30100 -29992 -29873 -29775 18.0<br />
g 1 I -2215 -2169 -2119 -2068 -2013 -1956 -1905 -1851 10.6<br />
h 1 1 5820 5791 5776 5737 5675 5604 5500 5411 -16.1<br />
The geo<strong>magnetic</strong> zero-meridian is the meridian running from the geographical<br />
north pole through the geo<strong>magnetic</strong> north pole to the geographical south pole. In<br />
Figure 2.5 the geographical <strong>and</strong> dipole coordinates are superimposed on each other.<br />
As mentioned earlier, the Earth's <strong>magnetic</strong> field experiences slow changes called<br />
secular variation. It is included in the harmonic representation of the field by adding<br />
time derivatives of coefficients to the representation of the International<br />
Geo<strong>magnetic</strong> Reference Field (IGRF). In Table 2.1 they are given <strong>for</strong> the year 1990<br />
(1990.0-1995.0). The knowledge of the secular variation is essential in updating<br />
<strong>magnetic</strong> charts <strong>and</strong> in theoretical modeling of the geo<strong>magnetic</strong> dynamo responsible<br />
<strong>for</strong> the generation of the field. Monitoring the secular variation is the most difficult<br />
task of <strong>magnetic</strong> observatories because the annual changes are small. In the majority
2.2 Crustal anomalies<br />
- 23 -<br />
The actual <strong>magnetic</strong> field departs from the model discussed above. The dipole field<br />
is a crude approximation, <strong>and</strong> a spherical harmonic representation of 10th degree is<br />
only an approximation of the field, which may differ by thous<strong>and</strong>s of nT from the<br />
locally measured field. Harmonics of higher degree take more <strong>and</strong> more into account<br />
the local anomalies of the field, but the model is still limited in its ability to describe<br />
them. Separate harmonic representations can be used in limited areas to describe the<br />
field. The so-called spherical cap harmonics have been successfully used in Canada<br />
(Haines, 1985) <strong>and</strong> Finl<strong>and</strong> (Nevanlinna et at., 1988). Polynomial representation is<br />
simplest <strong>and</strong> has been widely used. All these smoothing methods are useful in<br />
making <strong>magnetic</strong> charts <strong>for</strong> rather large areas like countries. They are not intended to<br />
show local crustal anomalies but rather to show a reference field <strong>for</strong> the identification<br />
of the local anomalies. The local anomalies originate in the crust <strong>and</strong> provide<br />
in<strong>for</strong>mation about the properties of the rock complexes. Thus, geo<strong>magnetic</strong><br />
<strong>measurements</strong> are an important part of geophysical prospecting.<br />
Originating at a depth of 2900 km, the current systems inside the Earth cannot be<br />
expected to produce anomalies of a scale less than the order of thous<strong>and</strong>s of<br />
kilometers in diameter. The smaller ones, from hundreds of kilometers to a few<br />
meters, are of crustal origin. Part of the anomalous field is caused by remanent<br />
magnetization. For example, volcanic rocks may become magnetized in the Earth's<br />
field when cooling. Part of the field may be caused by induced magnetization in the<br />
Earth's present field. The ratio of these magnetizations is not known generally; it has<br />
been determined only <strong>for</strong> rocks close to the surface in connection with geophysical<br />
prospecting or in special geological research.<br />
A very strong local anomaly has been found near Kursk, 400 km south of Moscow.<br />
It is 250 km long, <strong>and</strong> is composed of two parallel strips running from NE to Sw. The<br />
horizontal intensity varies from 20 000 to 80 000 nT <strong>and</strong> the vertical intensity from<br />
40 000 to 180 000 nT. The declination varies from 1000W to 60 o E. Another strong<br />
anomaly is in Kiruna in Sweden, where the maximum value of the vertical intensity<br />
reaches 360 000 nT. The Kiruna ore is almost pure magnetite. An example of<br />
dangerous anomalies occurs at Jussaro in the Gulf of Finl<strong>and</strong>, where the anomalous<br />
part of the field is over 60 000 nT <strong>and</strong> where the disturbances in declination have<br />
caused several shipwrecks. Very local anomalies of a similar strength can be found in<br />
many areas. Sometimes the dimensions can be just a few meters if there is a boulder<br />
containing much magnetite close to the surface.<br />
In the h<strong>and</strong>s of experienced geophysicists, maps of anomalies of the <strong>magnetic</strong> field<br />
tell about the geological structure of the crust. Combined with other geophysical <strong>and</strong><br />
geological in<strong>for</strong>mation, the <strong>magnetic</strong> data may lead to the finding of profitable ores.<br />
There<strong>for</strong>e, aero<strong>magnetic</strong> surveys are commonly carried out in most areas of the<br />
world. The whole area of many countries has been surveyed. An example of an
- 24-<br />
aero<strong>magnetic</strong> map is shown in Figure 2.7, depicting the <strong>magnetic</strong> field in the<br />
surroundings of the Sodankylli <strong>observatory</strong>.<br />
Figure 2.7. Aero<strong>magnetic</strong> map of total intensity F of the area of Sodankylti<br />
<strong>observatory</strong> in North Finl<strong>and</strong>. The separation of contour lines is 50 nT. The spacing<br />
of the numbered lines is 200 nT. The lines labeled 1,2 <strong>and</strong> 3 mean 50 nT, 100 nT <strong>and</strong><br />
150 nT higher values counted from the line with the explicit field value. The flight<br />
altitude was 40 m <strong>and</strong> the spacing of flight lines 200 m. Finl<strong>and</strong>'s whole area has<br />
been aero<strong>magnetic</strong>ally measured from an altitude of 150 m, line spacing 400 m.<br />
Courtesy of Geological Survey of Finl<strong>and</strong>.<br />
2.3 Regular variations of the <strong>magnetic</strong> field<br />
The regular variations of the <strong>magnetic</strong> field are related to rotation <strong>and</strong>/or orbital<br />
movements of the Earth, Sun <strong>and</strong> Moon. The most prominent is the diurnal variation
1993\/<br />
- 26-<br />
o 12 24 0 12 24 0<br />
Z QUIET DAYS<br />
12<br />
nT<br />
60<br />
o<br />
24 UT<br />
Figure 2.9. Diurnal variation of the <strong>magnetic</strong> field during solar quiet days (Sq<br />
variation) at Belsk <strong>observatory</strong> <strong>for</strong> different months of 1993.
- 28-<br />
<strong>magnetic</strong> effect, which is small, a few nT, depending on time <strong>and</strong> latitude, can be<br />
separated only statistically from the solar effect having an amplitude up to 100 nT<br />
during summer times. The regular solar daily variation is also a function of the time<br />
of the year, solar activity, <strong>and</strong> the geo<strong>magnetic</strong> latitude (Figures 2.8 <strong>and</strong> 2.9).<br />
Observatory yearbooks often give the average solar daily variation <strong>for</strong> different<br />
months of the year, <strong>and</strong> even separately <strong>for</strong> quiet, disturbed <strong>and</strong> all days. Based on the<br />
activity index K (see Chapter 7), the five quiet <strong>and</strong> disturbed days are selected very<br />
soon after the end of each month by the International Service of Geo<strong>magnetic</strong> Indices<br />
(now in Paris, see Chapter 10) <strong>and</strong> distributed quickly to all researchers interested in<br />
this in<strong>for</strong>mation (see Chapter 7). The variation of the <strong>magnetic</strong> field on <strong>magnetic</strong>ally<br />
quiet days is called the solar quiet day variation or Sq variation. Correspondingly, <strong>for</strong><br />
disturbed days, the variation that is fixed to the local time is called the SD-variation,<br />
S <strong>for</strong> solar <strong>and</strong> D <strong>for</strong> disturbed. The variation fixed to the time of a <strong>magnetic</strong> storm is<br />
called the DSI variation, D <strong>for</strong> disturbance <strong>and</strong> St <strong>for</strong> storm time. In this way, the<br />
storm has the same time scale everywhere in the world.<br />
Another periodic variation seen in <strong>magnetic</strong> data is the yearly variation, which has<br />
a small amplitude, of the order of a few nT. A possible explanation <strong>for</strong> this variation<br />
is the orbital movement of the Earth around the Sun <strong>and</strong> the tilting of the Earth's<br />
rotational axis compared to the Sun's equatorial plane so that the corpuscular<br />
radiation is more likely to hit the Earth during some times of the year than during<br />
others.<br />
In <strong>magnetic</strong> activity, a period of27 days can also be seen. The period corresponds<br />
to the rotation of the Sun's latitude zone where the most active areas <strong>and</strong> sunspots are<br />
situated (the equatorial zones of the Sun rotate faster than the areas close to the<br />
poles).<br />
2.4 Magnetic disturbances<br />
Big <strong>magnetic</strong> disturbances are mainly caused by particle radiation from the Sun.<br />
The flow of these particles is called the solar wind. The interaction of the solar wind<br />
with the Earth's <strong>magnetic</strong> field ,creates a system of magnetospheric <strong>and</strong> ionospheric<br />
currents. Also the solar X-rays <strong>and</strong> UV-radiation can enhance the ionospheric current<br />
systems so much that the <strong>magnetic</strong> field experiences strong disturbances.<br />
At the Earth's surface, the effects of these currents are seen as <strong>magnetic</strong> storms,<br />
which are usually a sum of several substorms, if the currents are strong. In the very<br />
complicated magnetospheric current system, there are some general features. One is<br />
the ring current, which flows around the Earth mainly in the equatorial plane at a<br />
distance of a few Earth radii. It runs in the east-west direction, diminishing the<br />
horizontal <strong>magnetic</strong> field observed at the surface. The ring current receives more<br />
particles from the Sun during disturbed <strong>and</strong> active periods of the Sun. The time
- 29-<br />
constant of the ring current is a few hours. How the particles, mainly electrons <strong>and</strong><br />
protons, penetrate the boundary layer of the magnetosphere <strong>and</strong> are fed to the ring<br />
current is still under intensive research, as are also the changes in the other current<br />
systems in the magnetosphere. The mechanism of injecting particles to the<br />
ionosphere at auroral latitudes, creating auroras <strong>and</strong> currents along the auroral<br />
latitudes, is an object of intensive studies as well. Schematic pictures of the principal<br />
current systems in the magnetosphere are shown in Figures 2.11 <strong>and</strong> 2.12.<br />
Depending on the strength of a <strong>magnetic</strong> storm, the most disturbed area may move<br />
from its nonnal position at auroral latitudes several degrees toward the equator.<br />
During strong <strong>magnetic</strong> stonns, auroras may be seen at unusually low latitudes, radio<br />
propagation may be severely disturbed <strong>and</strong> radio connections over polar areas<br />
completely cut. As a result of some severe storms, electric power lines have suffered<br />
from induced currents. Breaks in power have sometimes lasted several hours <strong>and</strong><br />
caused remarkable economic losses. As a consequence of <strong>magnetic</strong> storms, satellites<br />
suffer from enhanced density of particles from the Earth's exp<strong>and</strong>ing atmosphere <strong>and</strong><br />
disturbances in radio connections. All these consequences, in addition to other ones,<br />
are reasons to enhance the observations of the <strong>magnetic</strong> field <strong>and</strong> to learn more about<br />
the mechanisms of <strong>magnetic</strong> disturbances <strong>and</strong> finally to learn to predict severe<br />
<strong>magnetic</strong> storms.<br />
Figure 2.11. Schematic picture of the current systems around the Earth The numbers<br />
attached to the currents give, in mega-amperes (MA), the normal value <strong>and</strong> a value<br />
during <strong>magnetic</strong> stonns (courtesy of Hannu Koskinen, Finnish Meteorological Institute).
- 30 -<br />
Figure 2.12. Current systems in the ionosphere. The numbers attached to the currents<br />
give, in mega-amperes (MA), the normal value <strong>and</strong> the value during <strong>magnetic</strong> stmms.<br />
The grey color corresponds to the day-side, <strong>and</strong> the black area of the globe is in<br />
shadow. The current circling the polar cap area is in the auroral zone. The day-side<br />
currents are simplified dynamo currents in the atmosphere (courtesy of Hannu<br />
Koskinen, Finnish Meteorological Institute).<br />
2.5 Special events <strong>and</strong> <strong>magnetic</strong> pulsations<br />
Sudden impulses (SI) are often seen on magnetograms. Sometimes they are clearly<br />
seen be<strong>for</strong>e the start of a <strong>magnetic</strong> storm. In that case, the sudden impulse is<br />
identified as a storm sudden commencement, ssc, which is a rapid change of the<br />
<strong>magnetic</strong> field back <strong>and</strong> <strong>for</strong>th, a few nT or tens of nT (Figure 2.13). Ssc's (<strong>and</strong> SI's in<br />
general) are produced by a sudden change of the pressure of the solar wind against<br />
the sunward boundary of the magnetosphere (at a distance of about 10 Earth radii).ln<br />
the case of the ssc, the magnetosphere is compressed <strong>and</strong> pushed in towards the<br />
Earth. Solar flare effect, sfe, is another group of rather sudden phenomena seen on<br />
<strong>magnetic</strong> recordings. It happens rather infrequently, <strong>and</strong> is difficult to distinguish on
- 32-<br />
statistical distribution of the occurrence of the pulsations in frequency b<strong>and</strong>s,<br />
although the statistical distribution is no longer as clear as it was thought in 1963,<br />
when <strong>IAGA</strong>made its recommendation on the classification (Samson, 1991).<br />
Pc 1, period 0.2 to 5 seconds<br />
Pc 2, period 5 to 10 s<br />
Pc 3, period 10 to 45 s<br />
Pc 4, period 45 to 150 s<br />
Pc 5, period 150 to 600 s<br />
Pc 6, period over 600 s.<br />
The irregular or impulsive pulsations have also been grouped by <strong>IAGA</strong> according<br />
to their period:<br />
Pi 1, period to 40 seconds<br />
Pi 2, period 40 to 150 s<br />
Pi 3, period over 150 s.<br />
The <strong>magnetic</strong> pulsations are intensively studied today because they are a profitable<br />
way to study phenomena <strong>and</strong> conditions in the ionosphere <strong>and</strong> magnetosphere.<br />
Samson (1991) divides the pulsations into two types of wavepackets, continuous<br />
<strong>and</strong> impulsive. In the frequency domain he divides both continuous <strong>and</strong><br />
impulsive pulsations into three sub-classes: low-frequency 0-10 mHz),<br />
mid-frequency (10 mHz - 0.1 Hz) <strong>and</strong> high-frequency (0.1-10 Hz).<br />
The low-frequency continuous pulsations are generated mainly by hydro<strong>magnetic</strong><br />
instabilities, such as the Kelvin-Helmholtz, drift-mirror <strong>and</strong> bounce resonance<br />
instabilities. Many pulsations of the mid-frequency b<strong>and</strong> are caused by proton<br />
cyclotron instabilities in the solar wind. High frequency continuous pulsations are<br />
mostly due to the ion cyclotron instabilities in the magnetosphere where the energy<br />
<strong>for</strong> this instability is provided by anisotropic distributions of energetic protons.<br />
The Pi-pulsations are generated by transient phenomena, such as sudden impulses<br />
in the solar wind, flux transfer events <strong>and</strong> rapid changes in magnetospheric<br />
convection. In the mid- <strong>and</strong> high-frequency b<strong>and</strong> of impulsive pulsations, much of<br />
the energy is due to field-aligned current-driven instabilities.<br />
There has been good progress in the theory of pulsations during the last two to<br />
three decades, especially <strong>for</strong> continuous pulsations. These pulsations are useful in the<br />
diagnosis of the near-Earth plasmas, fields <strong>and</strong> their interactions. Long records of<br />
pulsations at observatories are important in investigating the long-term variability of<br />
the plasma regions.<br />
Figure 2.14 shows a schematic amplitude spectrum of <strong>magnetic</strong> variations.
- 34-<br />
where 11 <strong>and</strong> cP are the geo<strong>magnetic</strong> coordinates <strong>and</strong> CAl <strong>and</strong> Ao are the geographic<br />
latitude <strong>and</strong> longitude of the northern geo<strong>magnetic</strong> pole. 11 is measured positive<br />
eastward from the dipole meridian, running from the geo<strong>magnetic</strong> northern pole<br />
through the geographical south pole to the geo<strong>magnetic</strong> pole in the southern hemisphere.<br />
While calculating 11 one can get two possible angles due to the ambiguity in<br />
inverting sine or cosine, <strong>and</strong> a proper one is to be chosen (see Fraser-Smith, 1987).<br />
cP is the geo<strong>magnetic</strong> latitude.<br />
Normally an accuracy of 0.1 ° is sufficient <strong>for</strong> the geo<strong>magnetic</strong> coordinates.<br />
Geo<strong>magnetic</strong> time t8 is another unit used in connection with studies of <strong>magnetic</strong><br />
storms, auroras <strong>and</strong> other ionospheric <strong>and</strong> magnetospheric phenomena. Geo<strong>magnetic</strong><br />
time is defined by the angle between the geo<strong>magnetic</strong> meridian through the station<br />
<strong>and</strong> the one opposite to that through the Sun. It can there<strong>for</strong>e be found by computing<br />
the geo<strong>magnetic</strong> longitude of the station <strong>and</strong> the azimuth of the Sun. At stations in<br />
middle <strong>and</strong> low latitudes, the geo<strong>magnetic</strong> time differs only slightly from the<br />
geographical local time. The apparent geo<strong>magnetic</strong> local time T I differs from the<br />
geo<strong>magnetic</strong> hour angle t' by 12h<br />
T' = 12h+ t'<br />
t' can be calculated from the <strong>for</strong>mula (Simonov, 1963)<br />
sinCAl cos(t - A + Ito) - coscp tano<br />
cot (t' - 11) = ± -..:....:....--'-----=--------'--sin(t<br />
- A + Ito)<br />
(2.7)<br />
where t = T + te - 12h, t is the hour angle of the apparent Sun, T is the local mean<br />
time, 0 is the declination of the Sun. Times are given in degrees (10 = 4 min).<br />
te = t + 12h - T is called the equation of time (apparent minus mean time); te can be<br />
obtained from astronomical almanacs (here represented in degrees). Also the declination<br />
of the Sun is available from astronomical almanacs. In this connection, the<br />
requirement of accuracy is rather low. There<strong>for</strong>e, simple <strong>for</strong>mulas are enough <strong>for</strong> the<br />
calculation of te <strong>and</strong> 0 as presented by van Biel (1990). These <strong>for</strong>mulas give an<br />
accuracy of ±O.14° <strong>for</strong> te <strong>and</strong> 0.20 <strong>for</strong> the declination.<br />
te = 0.00429718 + 0.107029 cosf3 - 1.83788 sinf3 - 0.837378 cos2f3 - 2.34048sin2f3<br />
0= 0.39637 - 22.913 cosf3 - 4.0254 sinf3 - 0.38720 cos2f3+ 0.05197 sin2f3<br />
13= 360(day)/365 (day = 0 is Jan 1).<br />
Here te <strong>and</strong> all the other units are expressed in degrees. Time te varies roughly<br />
between +4° <strong>and</strong> -40. The declination of the Sun, 0, is the angle between the Earth's<br />
equatorial plane <strong>and</strong> the direction to the Sun, varying from +23.5° (summer solstice,<br />
northern "midsummer") to -23.5° (winter solstice).
- 35 -<br />
In detailed studies of conjugacy, the dipole coordinates are not accurate enough. In<br />
many cases the eccentricity of the dipole has to be taken into account, which means<br />
at least the fIrst eight harmonic coefficients to be known. We have to notice, however,<br />
that as more than 99 percent of the surface <strong>magnetic</strong> fIeld is a potential field<br />
originating inside the Earth, only the <strong>magnetic</strong> fIeld produced by the dipole decreases<br />
inversely proportional to r3. The contributions of the higher order terms decrease<br />
more rapidly, so that every unit added to n increases the power of r with one unit.<br />
That means that the contribution of the higher order terms rapidly looses signifIcance<br />
with growing distance from the Earth. For the study of conjugacy of, <strong>for</strong> example,<br />
auroras <strong>and</strong> <strong>magnetic</strong> pulsations <strong>and</strong> the footprints of satellites, more accurate<br />
<strong>magnetic</strong> coordinates have to be used (Gustafsson et ai., 1992). Going farther out, a<br />
few Earth radii, the contribution of the magnetospheric electric current systems<br />
begins to be the most important, <strong>and</strong> more sophisticated models of the <strong>magnetic</strong> field<br />
have to be used (Zyganenko, 1989).
3. SELECTION OF OBSERVATORY SITE AND LAYOUT<br />
OF THE OBSERVATORY<br />
Twenty years ago. Wienert wrote in his Notes on Geo<strong>magnetic</strong> Observatory <strong>and</strong><br />
Survey Practice: "The creation of a geo<strong>magnetic</strong> <strong>observatory</strong> is an ambitious<br />
enterprise which entails considerable financial commitments. Even more of a burden<br />
is the maintenance of the installation <strong>and</strong> the processing of data. A full-scale st<strong>and</strong>ard<br />
<strong>observatory</strong> can neither be run by one individual nor can the work be coped with by<br />
part-time scientists <strong>and</strong> technicians. With efficient <strong>and</strong> inventive staff. a full-time<br />
scientist <strong>and</strong> two technicians will be adequate to h<strong>and</strong>le the data output of a st<strong>and</strong>ard<br />
<strong>observatory</strong> in the sense of the International Association of Geomagnetism <strong>and</strong><br />
Aeronomy (<strong>IAGA</strong>). which includes the production of yearbooks <strong>and</strong> reporting to one<br />
of the world data centers. Research will hardly be possible. A staff of four. two<br />
scientists <strong>and</strong> two teclmicians, will permit a modest research programme. Practical<br />
experience has shown that there is very little point in trying with less, because the end<br />
will invariably be inadequate perfonnance <strong>and</strong> hence frustration".<br />
Over the last twenty years, the huge progress made in instrumentation, data<br />
collection, data processing <strong>and</strong> data transmission using electronic means has in<br />
principle made it possible to meet <strong>observatory</strong> st<strong>and</strong>ards without the full staff<br />
described by Wienert. However, a <strong>magnetic</strong> <strong>observatory</strong> still cannot be run totally<br />
unattended. Absolute <strong>measurements</strong> need a person <strong>and</strong> have to be made regularly, say<br />
once a week at least. Also someone has to be available to carry out repairs in case of<br />
malfunctions. So at the moment there are two solutions available <strong>for</strong> a real <strong>magnetic</strong><br />
<strong>observatory</strong>: full-time or part-time manning.<br />
Partly manned observatories are becoming more <strong>and</strong> more popular. Modern, less<br />
elaborate absolute <strong>measurements</strong> are in use, modem computer technology is applied<br />
with centralized remote control of data, <strong>and</strong> servicing of instruments is done by<br />
replacing whole units. The data may be transmitted in real time to a central office<br />
thous<strong>and</strong>s of Ian away <strong>and</strong> checked there <strong>for</strong> proper functioning of the instruments.<br />
However, the authors of this <strong>Guide</strong> support the idea of manned observatories at the<br />
present state of technology. An observer in charge with the ambition of producing<br />
good data is difficult to replace: the absolute <strong>measurements</strong> can be made more<br />
frequently, especially if doubt appears in the results, <strong>and</strong> calibrations <strong>and</strong> checking<br />
can be made without delay. A manned <strong>observatory</strong> can also serve as a place <strong>for</strong><br />
calibration. training <strong>and</strong> infonnation, as will be described in other chapters. If the<br />
country has only one or two observatories, they should preferably be manned. It is<br />
especially good if the <strong>magnetic</strong> data produced at the <strong>observatory</strong> are used by the<br />
observer in charge <strong>for</strong> scientific or other purposes. This guarantees the quality of the<br />
data produced.
- 37-<br />
It is often possible to carry out other scientific activities at a <strong>magnetic</strong> <strong>observatory</strong>.<br />
Observatories recording several geophysical parameters show considerable savings<br />
in operational costs. Having several geophysical programs at an <strong>observatory</strong> adds to<br />
the number of staff, which is also good, because a one-man <strong>observatory</strong> is too<br />
vulnerable. In addition to the economic benefits in having several geophysical<br />
programs concentrated at the same <strong>observatory</strong>, there come the benefits of<br />
cross-discipline communications. So we feel that Wienert's views of an <strong>observatory</strong><br />
are still at least partly valid.<br />
3.1 Requirements <strong>for</strong> the <strong>observatory</strong> site<br />
Magnetic observatories are intended to operate over the long-term. One of their<br />
main tasks is to keep track of the geo<strong>magnetic</strong> secular variation. For that task, ten or<br />
even hundred years is a short time. There<strong>for</strong>e, the choice of the site <strong>for</strong> the<br />
<strong>observatory</strong> is of the utmost importance: changes in the <strong>magnetic</strong> properties of the<br />
surroundings are not acceptable. It is important that the <strong>observatory</strong> site be<br />
<strong>magnetic</strong>ally representative of its region, both <strong>for</strong> the secular variation <strong>and</strong> <strong>for</strong><br />
short-term variations.<br />
The <strong>magnetic</strong> properties of the area <strong>for</strong> the planned <strong>observatory</strong> have to be studied<br />
carefully in advance. If <strong>magnetic</strong> maps are available (see Fig. 2.7), they will give a<br />
good general impression of the <strong>magnetic</strong> homogeneity of the planned area. In<br />
addition, a local survey at the surface must be carried out. This is easily accomplished<br />
using two proton magnetometers, one as a reference <strong>for</strong> temporal variations of the<br />
field, the other <strong>for</strong> the survey. The entire area of the planned <strong>observatory</strong> should be<br />
surveyed using a net of about 10 by 10 meters or less. If there are no aero<strong>magnetic</strong><br />
charts available, the neighborhood should be surveyed using a more coarse network<br />
to distances of several km from the <strong>observatory</strong>. Large <strong>magnetic</strong> anomalies (hundreds<br />
of nT) should not be accepted close to the <strong>observatory</strong> area, <strong>and</strong> the <strong>observatory</strong> area<br />
itself should preferably not have differences between the 10m points larger than a few<br />
nT. In particular, the place <strong>for</strong> absolute <strong>measurements</strong> should be free of horizontal<br />
<strong>and</strong> vertical gradients (less than 1 nT/m, if possible).<br />
There is also another possible cause of non-representative data at a <strong>magnetic</strong><br />
<strong>observatory</strong>, namely induced currents in the Earth. The effect of induced currents at<br />
the <strong>observatory</strong> is much more difficult to study: simultaneous recordings of <strong>magnetic</strong><br />
disturbances at the <strong>observatory</strong> <strong>and</strong> at sites around the <strong>observatory</strong> should be made.<br />
In most of the <strong>magnetic</strong> observatories in the world such a study has not been made.<br />
That is underst<strong>and</strong>able, because suitable portable recording instruments have been<br />
available only during recent years. It has been known <strong>for</strong> a long time, however, that<br />
due to the high conductivity of seawater, the variations of the <strong>magnetic</strong> field at<br />
coastal stations are different from the variations observed inl<strong>and</strong>. There<strong>for</strong>e, coastal
- 38 -<br />
observatories cannot be used as base stations, <strong>for</strong> example, <strong>for</strong> <strong>magnetic</strong> surveys. The<br />
influence of induced currents will be discussed in greater detail in Chapter 9.<br />
In addition to the <strong>magnetic</strong> properties of the area of the <strong>observatory</strong>, many other<br />
factors also have to be taken into account: <strong>for</strong> example the manned or partly manned<br />
<strong>observatory</strong> should not be too far from civilization or else it may be unattractive to<br />
skilled personnel. On the other h<strong>and</strong>, the <strong>observatory</strong> should be <strong>and</strong> should remain far<br />
enough from man-made disturbances. It is difficult to predict building activities <strong>for</strong><br />
future decades or hundreds of years, but one should try to do that. In any case, a large<br />
enough area should be reserved <strong>for</strong> the <strong>observatory</strong>, which means an area of 300 m<br />
radius measured from the absolute house <strong>and</strong> at least I kIn to the nearest railroad. If<br />
the railroad is electric, the distance has to be several kilometers, <strong>and</strong> in case of DC<br />
trains tens of kilometers, depending on the conductivity of the ground. Examples of<br />
the disturbing effects of some objects are listed in Table 3.1 at the end of this chapter<br />
(Section 3.4). The disturbing effects of <strong>magnetic</strong> material are described in greater<br />
detail in Appendix IV.<br />
3.2 Buildings at a <strong>magnetic</strong> <strong>observatory</strong><br />
The buildings needed at a manned <strong>magnetic</strong> <strong>observatory</strong> with mainly classical<br />
instruments <strong>for</strong> recording <strong>and</strong> <strong>for</strong> absolute <strong>measurements</strong> are well-described in<br />
Wienert's Notes on Geo<strong>magnetic</strong> Observatory <strong>and</strong> Survey Practice. The old variation<br />
rooms are usually excellent shelters <strong>for</strong> modem instrumentation, although modem<br />
instruments do not need such large <strong>and</strong> expensive constructions.<br />
There are three main requirements <strong>for</strong> the shelter of modern variometers: stable<br />
pillars <strong>for</strong> the sensors, stable temperature (typical temperature coefficients <strong>for</strong><br />
fluxgate variometers are 1 nTfC) , <strong>and</strong> non-<strong>magnetic</strong> materials in the building. The<br />
variation rooms of classical observatories usually fulfill these requirements. Modem<br />
sensors are usually small <strong>and</strong> rarely require servicing, <strong>and</strong> the electronics usually<br />
does not need to be adjusted after installation. So, the classical variation room with<br />
several pillars may be reduced to a well insulated hut or even a box. This of course<br />
can be constructed inside an old variation room. If there are no other reasons <strong>for</strong><br />
keeping the temperature constant in the whole building, then only the box <strong>for</strong> the<br />
variometers needs to be heated.<br />
Using modem instruments, absolute <strong>measurements</strong> can be made closer to the<br />
recording instruments than be<strong>for</strong>e, depending on the instruments. Figures 3.1-3.3<br />
show examples of a layout of buildings at a new <strong>magnetic</strong> <strong>observatory</strong>. The distance<br />
between the absolute house <strong>and</strong> the variation room can of course be less than that in<br />
Figure 3.1, if the absolute instruments produce a sufficiently small disturbing field. If<br />
a vector proton magnetometer is used, then the <strong>magnetic</strong> field of the compensating
VARIATION ROOM<br />
MAINS<br />
3-PHASE<br />
- 42-<br />
MAIN BUILDING<br />
SCREENED<br />
SIGNAL LINE<br />
OPTO-ISOLATION<br />
ABSOLUTE<br />
HOUSE<br />
Figure 3.4. A possible wiring diagram <strong>for</strong> the <strong>magnetic</strong> <strong>observatory</strong> presented in<br />
Figure 3.1. All the cables should be buried in the ground to reduce the risk of damage<br />
cau.sed by lightning. The cables should be well marked <strong>and</strong> shielded. The signal cable<br />
should have optical isolation at both ends. It is even better if an optical fiber cable is<br />
used.<br />
In the construction of a modern variation room there is a remarkable difference in<br />
comparison with classical designs: the observer had to visit classical variation rooms<br />
every day, whereas the modem variometers hardly need any servicing after<br />
installation. There<strong>for</strong>e, the variation room can be just a shelter <strong>for</strong> the variometer. We<br />
stress, however, that the pillars <strong>for</strong> modern sensors have to be very stable. Using<br />
electronic tiltmeters <strong>and</strong> good temperature sensors it is in principle possible to correct<br />
digitally <strong>for</strong> the effects of tilting <strong>and</strong> <strong>for</strong> the variations of temperature. The use of<br />
tiltmeters has, however, proved to be rather difficult in practice. The solution<br />
successfully used in geomagnetism has been tilt-correcting suspended sensors<br />
(Rasmussen <strong>and</strong> Kring Lauridsen, 1990, Trigg <strong>and</strong> Olson, 1990). We recommend<br />
stabilized temperature in the cover <strong>for</strong> the sensor assembly or in the whole variation<br />
room, <strong>and</strong> temperature should be recorded (see Figure 3.5).
- 44-<br />
The constructions shown in Figures 3.2 <strong>and</strong> 3.3 are naturally just examples. Often<br />
it is not reasonable or economically possible to have all needs fulfilled , <strong>and</strong> the<br />
absolute house can be made very small. Only a hut with one pillar may be required if<br />
the instruments normally used do not need separate pillars. If there are two pillars in<br />
the variation room, building them on the same foundation adds to stability (see<br />
Figure 3.2). Where a vector proton magnetometer is used, it should be mounted on a<br />
single isolated pillar. The final construction depends very much on local conditions.<br />
There are, however, some important points to be taken into account in planning:<br />
I) The pillars <strong>for</strong> the sensors in the variation room have to be stable. It is good if<br />
bedrock is available <strong>for</strong> the foundation, but this is seldom the case. There<strong>for</strong>e, the<br />
pillar has to be founded deep enough below the level which can be affected by<br />
freezing in cold climates or by rainwater. In practice this means some 2 m below the<br />
ground in the majority of areas. It is advisable to consult the local building<br />
authorities. Rainwater is a common problem. There<strong>for</strong>e, water has to be free to run<br />
away from the surroundings of the pillars, which means that gravel should be placed<br />
under <strong>and</strong> around the pillars <strong>and</strong> tubes <strong>for</strong> drainage should be placed at the level<br />
below the pillars <strong>and</strong> also in the surroundings. The foundation of the hut has to be<br />
separated from the pillars. The floor has to be separated from the pillars using a soft<br />
material. In some areas (e.g. permafrost) the construction of stable pillars is<br />
impossible <strong>and</strong> other solutions, such as suspended sensors (see Chapter 6), or<br />
recording of tilt have to be found.<br />
2) Thermostatically controlled temperature to better than O.5°C is important in the<br />
variation room or in the box of the variometers, in addition to the systems<br />
compensating <strong>for</strong> the temperature effects of the variometers. The variation room or<br />
the boxes containing the sensors or both (Figure 3.2) have to be well insulated to<br />
ensure that the temperature variations are smooth, which makes the possible<br />
corrections of the temperature effects in the final treatment of the data mOre accurate.<br />
If there is enough electric power available, it is quite easy to keep the temperature of<br />
the boxes or the whole room constant. If the insulation is good, then power<br />
requirement is, in practice, low, just a few tens of watts, depending on the climate <strong>and</strong><br />
the insulation of the boxes. A good way to stabilize the temperature is to have the<br />
sensors in a shelter under ground. For heating, st<strong>and</strong>ard electric heaters made of<br />
aluminum foil are non-<strong>magnetic</strong> <strong>and</strong> generally available. Usually, the heating foil is<br />
installed behind the ceiling panel or inside the floor. Commercially available<br />
thermostats are usually <strong>magnetic</strong>. They have to be checked <strong>and</strong> the <strong>magnetic</strong> parts<br />
removed. One possibility is to have the sensor of the thermostat close to the<br />
magnetometer <strong>and</strong> the regulator or switch far away, <strong>for</strong> example in the electricity hut.<br />
One solution <strong>for</strong> the heating system <strong>for</strong> a box <strong>for</strong> variometers is shown in Figure 3.5.<br />
The electronics may also have a temperature coefficient, sometimes of the order of<br />
I nTfc. Such electronics have to be kept in a temperature-stabilized environment.<br />
Naturally, the temperature coefficients of both the variometers <strong>and</strong> their electronics
- 45-<br />
have to be tested be<strong>for</strong>e installing the instrument. The temperature of the variometers<br />
has to be monitored together with <strong>magnetic</strong> field data. It is advisable to change the<br />
temperature of the variation room (or box <strong>for</strong> the variometers) twice a year, following<br />
the mean temperature outside. This practice saves on the power used <strong>for</strong> heating <strong>and</strong><br />
enables thennal coefficients to be checked.<br />
In a very warm or hot climate, sunshine is a problem. Painting with white, heatreflecting<br />
paint helps, as does a double roof. A variation room under ground is the<br />
best solution, if other conditions will allow.<br />
3) All materials close to the sensors have to be non-<strong>magnetic</strong>. In practice this<br />
means that everything has to be tested: concrete (white cement to be used, the s<strong>and</strong> to<br />
be tested), bricks, metal parts like hinges, locks, thennostats, electric heaters,<br />
switches, plugs, even the asphalt <strong>for</strong> the roof. Testing the materials is easy using the<br />
fluxgate theodolite, nonnally used <strong>for</strong> absolute <strong>measurements</strong>. Naturally, a QHM (in<br />
the tumed, field-measuring position, see Chapter 5) can also be used. The concrete<br />
can be tested by making a small test block which can be brought close to the fluxgate.<br />
In the sensor room it is sufficient if at a distance of 0.5 m from the sensor the<br />
materials give a field smaller than 1 nT. In the absolute house, the requirement is<br />
higher. This means that slightly <strong>magnetic</strong> materials, if unavoidable, have to be farther<br />
from the sensor. The cleanliness of the pillar is especially important. Usually the<br />
concrete part of the pillar in the absolute house is made only to the level of the floor,<br />
<strong>and</strong> the upper part is made of some tested non-<strong>magnetic</strong> material like wood, bricks of<br />
glass or limestone (the latter may be <strong>magnetic</strong> <strong>and</strong> has to be carefully tested, which is<br />
not easy because of the weight of the pillar).<br />
There are some other general considerations which should be taken into account in<br />
building a new <strong>observatory</strong>. One very un<strong>for</strong>tunate tendency is the growing level of<br />
v<strong>and</strong>alism. This <strong>for</strong>ces the construction of observatories in places which are under<br />
continuous supervision. This is contradictory to the requirement that the <strong>observatory</strong><br />
should be in a remote place, far from disturbances from urban society. To make an<br />
<strong>observatory</strong> safe against v<strong>and</strong>alism adds to the construction costs considerably, <strong>and</strong><br />
this is a factor supporting the case <strong>for</strong> manned observatories.<br />
The absolute house should preferably have at least two pillars to make<br />
simultaneous <strong>measurements</strong> by two instruments possible; very often <strong>observatory</strong><br />
staff are asked to test instruments <strong>and</strong> to make special <strong>measurements</strong>.<br />
It is important, as recommended by <strong>IAGA</strong>, to install <strong>for</strong> reference at least one pillar<br />
outside of the building, <strong>and</strong> preferably two or more in different directions from the<br />
buildings. The distance from the absolute house should be at least 50 m. The<br />
differences of the fleld elements between these pillars <strong>and</strong> the main pillar in the<br />
absolute house have to be measured regularly, say once a year. Any change in the<br />
differences should be investigated.
- 46-<br />
From the pillars <strong>for</strong> absolute <strong>measurements</strong> there has to be a free view to an<br />
azimuth mark, preferably hundreds of meters or more away. The geographical<br />
direction to the azimuth mark is determined using observations of the Sun (see<br />
Chapter 5) or stars. If it is not possible to observe the Sun or stars directly from the<br />
absolute pillar, the direction to the azimuth mark can be determined by making the<br />
observation of the Sun exactly on the absolute pillar-azimuth mark line. Only one<br />
theodolite is needed <strong>for</strong> this. The Sun observation can also be made anywhere at a<br />
place with a clear view of the theodolite on the absolute pillar (through the door or<br />
through the window). In this case two theodolites are required: the geographic<br />
direction from the theodolite outside to the theodolite on the pillar is determined by<br />
observing the Sun, <strong>and</strong> the geographic direction from the theodolite inside to the<br />
theodolite outside is the reverse bearing. The readings from theodolite to theodolite<br />
are very accurate if it is possible to view through the other theodolite's objective to<br />
the vertical line in the optics. From the latter, the direction to the azimuth mark is easy<br />
to calculate. If it is not possible to view through the objectives, which is only possible<br />
when the theodolites are quite close to each other, the theodolites have to be several<br />
tens of meters from each other to achieve an accurate enough result. The whole<br />
procedure has to be repeated several times to reach the required accuracy (at least 6").<br />
If the azimuth mark is viewed through a closed window then, depending on the<br />
quality of the glass, there may be an error in the apparent direction to the mark<br />
because of refraction. The possible effect of the window should be determined by<br />
observing the mark with the window closed <strong>and</strong> open during quiet climatological<br />
conditions, when the temperature outside <strong>and</strong> inside is roughly the same. Other<br />
windows are not needed in the absolute house, <strong>and</strong> that used to observe the azimuth<br />
mark may be small. To provide illumination, a strong lamp must be placed above the<br />
pillar. Needless to say the lamp has to be non-<strong>magnetic</strong> <strong>and</strong> preferably high above the<br />
pillar, at least 1 m above the fluxgate theodolite. The lamp has to be exactly over the<br />
middle point of the theodolite to provide light to the theodolite through its side<br />
mirror. (The mirror will be in shadow of the body of the theodolite if the lamp is<br />
closer than about 1 m.) Opal glass with lamps above it is sometimes used above the<br />
pillar. Another solution is a roof window <strong>and</strong> outside, at a safe distance, a lamp. The<br />
heat of the lamp may in some cases be a source of error in the measurement by<br />
heating the sensor of the fluxgate theodolite more strongly when it is in the<br />
up-position (see Chapter 5) than in the down-position. This may change the<br />
alignment of the sensor with the telescope between the measurement positions,<br />
causing an error which is not compensated by the observing procedure. This is<br />
another reason <strong>for</strong> keeping the lamp as far as possible from the theodolite.<br />
If the azimuth mark is not far enough away, say at least 100m from the absolute<br />
pillar, one has to place the theodolite very carefully in the middle of the pillar. For a<br />
distance of 100 m, a displacement of 1 cm perpendicular to the direction to the<br />
azimuth mark means 0.3 minutes of arc (0.3'). There<strong>for</strong>e, there have to be fixed slots
- 47-<br />
on the top of the pillar <strong>for</strong> locating theodolite bases, which may have different sizes,<br />
exactly at the same spot (Figure 3.6). A poor azimuth mark may be a source of error<br />
in the measurement of declination D. Figure 3.6 (right) shows an azimuth mark<br />
which is found to give good results.<br />
Figure 3.6. Left: Slots of copper or aluminum on the top of the pillar <strong>for</strong> absolute<br />
<strong>measurements</strong>; below is shown the cross-section of a slot. The angles between the<br />
slots have to be 12(J'. Right: An azimuth mark suitable <strong>for</strong> accurate sighting. The size<br />
of the mark has to be such that the vertical line of the telescope of the theodolite does<br />
not cover the white triangle.<br />
3.3 Avoiding gaps in recordings<br />
At <strong>magnetic</strong> observatories, continuous operation without interruptions is very<br />
important. There<strong>for</strong>e, all measures have to be taken to avoid gaps in the recorded<br />
data. One source of gaps is interruptions in electric power. There<strong>for</strong>e, all systems<br />
have to be supported by batteries (UPS, Uninterruptible Power Supplies). The<br />
duration of interruptions in the mains power depends on local conditions. Breaks of<br />
one day are possible almost everywhere, meaning that the station has to be able to run<br />
<strong>for</strong> at least 24 hours on its own batteries.<br />
Equipment failure is another source of gaps. Usually professional technical help is<br />
not available immediately even when a fault is detected promptly. To ensure<br />
continuous recording, most observatories run secondary systems. This usually is not<br />
a very expensive solution, especially if there is older system which has been replaced
- 48-<br />
by more modern equipment. It is often possible to keep the old system running <strong>and</strong><br />
use the data when the primary system fails. However, both recordings should be<br />
compared at regular intervals to ensure functioning of both systems <strong>and</strong> to keeping<br />
track on the absolute level so that in case of failure of the primary system the<br />
secondary system data can be used to fill the gaps. In constructing the shelter <strong>for</strong> the<br />
sensors in a new <strong>observatory</strong>, it is good to allow space <strong>for</strong> another sensor. This<br />
requires another pillar in the sensor hut or room, 2-3 m from the first one. In the<br />
variation rooms of old observatories there is usually plenty of space <strong>for</strong> several<br />
sensors. It is recommended that the pillars be oriented according to geographic or<br />
geo<strong>magnetic</strong> north <strong>and</strong> that the directions on the top of the pillars be shown by clearly<br />
drawn lines.<br />
In some areas of the world, humidity may create a problem, although new<br />
instruments are not as sensitive to humidity as classical ones. To reduce the effect, it<br />
is best to arrange good ventilation in the <strong>observatory</strong> buildings. In seriously humid<br />
areas the sensitive parts may be put in sealed containers, which is not difficult with<br />
modern small sensors. The electronics may be specially treated to withst<strong>and</strong> humidity<br />
effects. In some places, the parts <strong>and</strong> cables have to be protected against insects <strong>and</strong><br />
small animals. Modern data collection equipment often uses floppy or hard discs or<br />
cassettes, which can be rather sensitive to dust.<br />
Usually, electronics like preamplifiers which must be placed close to the sensors<br />
are non-<strong>magnetic</strong> enough so that they can be tolerated within 1 m or even less. The<br />
main electronics, as stated earlier, should be in the electricity hut not less than 15 m<br />
from the sensors, <strong>and</strong> the data collecting unit may be even hundreds of meters away.<br />
If there is a house <strong>for</strong> staff living nearby, it is best to keep the data collection there so<br />
that it is under good control.<br />
The main building of an <strong>observatory</strong> may have different functions depending on<br />
the site <strong>and</strong> the level of automation. The main instruments <strong>for</strong> servicing may be kept<br />
there. At an <strong>observatory</strong>, a mechanical workshop with basic tools is useful. The main<br />
building may also be the residence of the observer in charge, <strong>and</strong> it may have guest<br />
rooms <strong>for</strong> visitors.<br />
As stressed in the introduction, a <strong>magnetic</strong> <strong>observatory</strong> should preferably be made<br />
a part of a geophysical <strong>observatory</strong>. This means that the main building serves other<br />
activities <strong>and</strong> so the <strong>magnetic</strong> <strong>observatory</strong> can be run very economically.<br />
3.4 Some practical advice<br />
Very strict precautions are found to be necessary in building work at an<br />
<strong>observatory</strong>. No nails of iron should be allowed, even in scaffolding. All tools should<br />
be counted every day after work, because in building work it is common <strong>for</strong><br />
screwdrivers, hammers or saws to be <strong>for</strong>gotten <strong>and</strong> lost during construction. Iron is
- 49-<br />
naturally not allowed anywhere in the constructions. Aluminum can be used instead<br />
of iron in the concrete.<br />
It is inadvisable to run long cables through the <strong>observatory</strong> area. During <strong>magnetic</strong><br />
disturbances, strong currents may be induced in them, producing <strong>magnetic</strong> fields<br />
which distort the recordings. For example, in high-voltage AC power lines, DC<br />
currents of the order of 10 A (at high latitudes even 100 A is possible on rare<br />
occasions) have been recorded during <strong>magnetic</strong> storms. The <strong>magnetic</strong> effect of 10 A<br />
at a distance of 1000 m is 2 nT, as can be seen from the law of Biot-Savart which<br />
states that the <strong>magnetic</strong> induction of a very long straight line current, is<br />
B = J1oi/2w<br />
where J10 is the permeability of free space (= 4n · 10- 7 henry per meter), i is the<br />
current in amperes [A), r is the distance in meters [mJ, <strong>and</strong> B is the <strong>magnetic</strong><br />
induction in teslas [f).<br />
Many observations are spoiled by a <strong>magnetic</strong> object the observer is carrying while<br />
observing or which is kept too close to the site of observation or recording.<br />
Dangerous items are tools, electronic instruments, cars, bicycles, etc. Spectacles are<br />
especially dangerous <strong>for</strong> absolute observations, because they may be used very close<br />
to the magnetometer. Sometimes even a mended tooth is found to contain enough<br />
iron to cause a measurable disturbance. Modern methods of making absolute<br />
<strong>measurements</strong> do not require as high absolute cleanliness of the observer as the older<br />
methods <strong>for</strong> reasons described in Chapter 5.<br />
Table 3.1<br />
Distances r i at which some common objects, if suitably placed <strong>and</strong> oriented,<br />
produce a <strong>magnetic</strong> field of 1 nT.<br />
Object ri [m)<br />
Safety pin 1<br />
Buckle of belt I<br />
Watch I<br />
Metallic pen 1<br />
Knife 2<br />
Screwdri ver 2<br />
Revolver 3<br />
Hammer 4<br />
Spade 5<br />
Rifle 7<br />
Bicycle 7<br />
Motorcycle 20<br />
Car 40<br />
Bus 80
- 50-<br />
It is not easy to answer the question how far away one has to keep a <strong>magnetic</strong><br />
object to be at a "safe" distance (see Appendix IV); Table 3.1 gives rough estimates<br />
of the effect of some objects.<br />
At a distance r the amplitude of the anomaly is (r;lr)3, where r i is the distance listed<br />
in Table 3.1. In two cases, namely when the pennanent magnetization is higher than<br />
the induced magnetization, or when the body is large compared to the distance to the<br />
measurement point, the value shown in Table 3.1 can be smaller than that actually<br />
observed. The best way to avoid problems caused by a <strong>magnetic</strong> body is to measure<br />
the <strong>magnetic</strong> effect at a much shorter range than the distance at which it is required to<br />
know the disturbing field <strong>and</strong> to use the (r;lr)3 <strong>for</strong>mula to calculate the effect.<br />
However, the effect of very long objects may diminish only as r;lr.<br />
In testing the <strong>magnetic</strong> effect of a body by bringing it close to a magnetometer one<br />
has to move the object very slowly, especially if it is made of gooci conductor like<br />
aluminum or copper. Moving the object in the Earth's <strong>magnetic</strong> field induces currents<br />
in the object which are seen in the magnetometer as variations of the <strong>magnetic</strong> field,<br />
<strong>and</strong> a <strong>magnetic</strong>ally clean object may be mistaken to be <strong>magnetic</strong>.<br />
From Table 3.1 it is easy to see that <strong>for</strong> the accuracy required at modem <strong>magnetic</strong><br />
observatories (about 0.1 nT) the distances to the listed objects have to be more than<br />
twice those listed.
4. MAGNETOMETERS<br />
The history of geomagnetism recognizes a large number of instruments, starting<br />
from ancient compasses <strong>and</strong> inclinatoriums through Gauss', Eschenhagen' s, La<br />
Cour's <strong>and</strong> many others instruments, to the present ones. There are many ingenious<br />
inventions in these instruments. Detailed descriptions <strong>and</strong> theories of them are to be<br />
found in many textbooks on geomagnetism, <strong>and</strong> also in the earlier <strong>observatory</strong><br />
manuals, listed at the beginning of this <strong>Guide</strong>.<br />
The main objective of this chapter is to describe the physical principles of the most<br />
popular contemporary magnetometers. We start with the physics behind the classical<br />
ones; they are still in operation at many observatories, <strong>and</strong> several modem<br />
variometers use classical sensors combined with sophisticated feed-back systems.<br />
Classical magnetometers are still used also in some absolute <strong>measurements</strong>. The<br />
main emphasis is, however, in the operation of the most modern instruments, the<br />
fluxgate, proton precession, <strong>and</strong> optical pumping magnetometers.<br />
Knowledge of the operation of magnetometers is not needed <strong>for</strong> the practical<br />
per<strong>for</strong>mance of <strong>measurements</strong> which will be presented in Chapter 5. In case of<br />
failure, however, it is often good to know how the instruments work. And knowing<br />
the general principles makes the measurement more interesting <strong>and</strong> may positively<br />
influence the work.<br />
4.1 Definitions<br />
Be<strong>for</strong>e describing the operation of <strong>magnetic</strong> instruments, let us define some terms<br />
commonly used in geo<strong>magnetic</strong> vocabulary.<br />
o Absolute instrument means an instrument capable of giving the magnitude of the<br />
<strong>magnetic</strong> field or its component in absolute physical basic units (m, kg, s, A, or<br />
their derivatives or angle compared to geographical direction or horizontal<br />
plane) or universal physical constants (e.g., gyro<strong>magnetic</strong> ratio of proton or<br />
electron).<br />
o Relative instrument is an instrument which measures the deviation from an<br />
undetermined field. To know the value of the undetermined field, it is necessary<br />
to make an absolute determination. In the case of a variometer this value is<br />
called a base-line.<br />
o Semi-absolute instrument means a relative instrument which by frequent enough<br />
comparisons with absolute instruments gives acceptably high absolute accuracy<br />
<strong>for</strong> the measurement in question.
o<br />
o<br />
- 53-<br />
Precision describes the scatter of values. Precision of 0.1 nT means that the<br />
values are within 0.1 nT from their mean value, but it says nothing of the<br />
accuracy.<br />
Variometer is a magnetometer which is used to record variations of the <strong>magnetic</strong><br />
field.<br />
4.2 Short notes about some historical instruments<br />
Be<strong>for</strong>e describing the operation of <strong>magnetic</strong> instruments, we list below names of<br />
some classical instruments which are commonly found on the shelves of<br />
observatories but are not used anymore. We also mention some instruments which<br />
have been used in geomagnetism, but are so seldom in use that they are not described<br />
in detail in this <strong>Guide</strong>.<br />
o<br />
o<br />
o<br />
o<br />
Magnetic theodolite. This was an instrument <strong>for</strong> measuring the declination <strong>and</strong><br />
the horizontal intensity. The declination was measured using the method<br />
described in this <strong>Guide</strong>. In the measurement of horizontal intensity, the Gauss<br />
method was mainly used. It was based on free oscillation of a magnet with<br />
<strong>magnetic</strong> moment M. This measurement gives the product MR. The ratio<br />
MIH was obtained from the deviation of another magnet from the direction of<br />
the <strong>magnetic</strong> meridian in the field of H <strong>and</strong> in the field of the magnet with<br />
momentM.<br />
The Earth inductor is an instrument which measures the inclination of the field.<br />
The method is based on the alignment of the axis of a rotating coil along the<br />
direction of the <strong>magnetic</strong> field.<br />
BMZ (magnetometric zero balance). This instrument was designed by La Cour<br />
<strong>and</strong> has been used as relative instrument <strong>for</strong> the measurement of the vertical<br />
component. It has a zero indicator (freely moving horizontal magnet), <strong>and</strong> two<br />
magnets which compensate the vertical component of the field. One of the<br />
magnets is vertical. The other can be rotated. The measure of the field is the<br />
angle of rotation of this magnet.<br />
Field balance. Many of these instruments were used <strong>for</strong> prospecting <strong>and</strong><br />
mapping of the vertical intensity <strong>and</strong>, in some cases, the horizontal intensity. It<br />
was an instrument <strong>for</strong> relative <strong>measurements</strong> only. This instrument has a magnet<br />
supported by an agate edge. The zero reading corresponded to the horizontal<br />
position of the magnet (in Z-measurement) which means that the <strong>magnetic</strong><br />
moment was in balance with the gravity <strong>for</strong>ce. Deviation from this position was<br />
a measure of the <strong>magnetic</strong> field component.
4.3 Torsion magnetometers<br />
- 54-<br />
The classical magnetometers are based on the observation of a magnet in a<br />
changing <strong>magnetic</strong> fjeld. The magnet is suspended by a thin fibre. The torque of the<br />
<strong>magnetic</strong> field on the suspended magnet is compensated by the torque of the<br />
suspension fibre. More generally, one should take into account also the moment of<br />
the gravity field, but if the center of mass is on the rotational axis of the magnet,<br />
which is the usual practice, this moment is zero. The basic equation <strong>for</strong> torque T, in<br />
the static case when the <strong>magnetic</strong> field is not changjng, is<br />
mxB=T (4.1)<br />
where m is the vector <strong>magnetic</strong> moment of the magnet, <strong>and</strong> B is the vector describing<br />
the <strong>magnetic</strong> field<br />
For a horizontal field H the <strong>for</strong>mula of equilibrium is<br />
mHsjn a= cq> (4.2)<br />
where m st<strong>and</strong>s <strong>for</strong> the <strong>magnetic</strong> moment of the magnet, c is the torsion constant of<br />
the fibre, a is the angle between the <strong>magnetic</strong> meridian <strong>and</strong> the <strong>magnetic</strong> axis of the<br />
magnet, q> is the angle of twisting of the fibre, <strong>and</strong> H is the horizontal component of<br />
the <strong>magnetic</strong> field. The classic absolute <strong>measurements</strong> of declination Dusing declinometers<br />
(as an example, see Kring Lauridsen, 1981), <strong>and</strong> horizontal intensity H<br />
using QHM (Kring Lauridsen, 1977) are typical static cases. Sections 4.3.1 <strong>and</strong> 4.3.2<br />
will h<strong>and</strong>le those <strong>measurements</strong>.<br />
4.3.1 Declinometer<br />
In the classical measurement of <strong>magnetic</strong> declination D (see, <strong>for</strong> example, Kring<br />
Lauridsen, 1981), the magnet is hanging from a very thin (low torque) fiber. The<br />
system with the suspended magnet is placed on top of a non-<strong>magnetic</strong> theodolite so<br />
that it is possible to look at the magnet's rillrror through the telescope of the<br />
theodolite. The theodolite is turned so that the rillrror is perpendicular to the optical<br />
axis of the theodolite. Let the circle reading of the theodolite be A, which is the<br />
theodolite reading of the <strong>magnetic</strong> meridian, provided that the rillrror is perpendicular<br />
to the <strong>magnetic</strong> axis of the magnet <strong>and</strong> there is no torque in the fiber. If we look with<br />
the same theodolite at an azimuth mark with known azimuth A z (geographical<br />
direction), <strong>and</strong> take the reading B from the theodolite, we get <strong>for</strong> the <strong>magnetic</strong><br />
declination<br />
(4.3)<br />
In principle, the measurement of declination is this easy. In practice, there are some<br />
sources of error, which have to be eliminated in'the measurement. It is almost<br />
impossible to fix the mirror to the magnet so that it is perpendicular to the magnet's
- 55-<br />
<strong>magnetic</strong> axis. There<strong>for</strong>e, another measurement has to be taken, turning the magnet<br />
by 180 0 round its own axis (A = [Aup + A dow ,JI2).<br />
Another source of error is the possible torque of the suspending fibre. Usually the<br />
suspension fibre is very thin, 0.02-0.04 mm in diameter, or it is a ribbon, made of<br />
tungsten, phosphor-bronze or quartz, <strong>and</strong> rather long, 15-50 cm, so that it has a low<br />
torque. The effect of torsion can be measured by turning the torsion head. The head<br />
is on top of the tube inside which the wire is suspended. The head usually has a<br />
degree-scale. The turning of the magnet can be observed at the diaphragm scale of the<br />
theodolite. Usually turning the torsion head by 1 0 means about 0.1' in the orientation<br />
of the magnet.<br />
In practice, it is not possible to have zero torsion in the D-measureme There<strong>for</strong>e,<br />
the measurement has to be made using two magnets with different <strong>magnetic</strong><br />
moments. The stronger magnet naturally opposes the torsion better than the weaker<br />
magnet giving a possibility to calculate the true, torsionless direction of the magnets.<br />
It is not necessary to know the <strong>magnetic</strong> moments of the magnets, only their ratio,<br />
which is easily obtained by deflecting the magnets in the theodolite by turning the<br />
torsion head, say, ±90 0 <strong>and</strong> taking the mean a l of the deflection angles of the stronger<br />
magnet (I) <strong>and</strong> the corresponding value au of the weaker magnet. The moments of<br />
the magnets are inversely proportional to the deflected angles.<br />
The final <strong>for</strong>mula <strong>for</strong> the declination using both magnets is<br />
(4.4)<br />
where AI is the circle reading (actually mean of a number of readings Aup <strong>and</strong> Adown)<br />
of the stronger magnet, An is the corresponding reading of the weaker magnet, <strong>and</strong> B<br />
is the circle reading of the azimuth mark whose azimuth is A z . yis called the torsion<br />
ratio. It is a constant <strong>for</strong> the same pair of magnets <strong>and</strong> can be determined as shown<br />
below.<br />
From Figure 4.1 <strong>and</strong> applying <strong>for</strong>mula (4.2) <strong>for</strong> both magnets we get<br />
c
Magnetic<br />
Meridian<br />
Ao<br />
- 56-<br />
Figure 4.1. Influence of torque of the suspension fibre on the stronger (theodolite<br />
reading AI) <strong>and</strong> weaker (theodolite reading An) magnet of the declinometer. Ao would<br />
be the theodolite reading to the <strong>magnetic</strong> north.<br />
4.3.2 Quartz horizontal magnetometer QHM<br />
The QHM is a compact tubelike instrument containing a small magnet with a<br />
mirror suspended on a quartz fibre (Figure 4.2). There naturally is a clamping system<br />
<strong>for</strong> transport of the instrument; moving the QHM in the unclamped position almost<br />
certainly breaks the thin quartz fibre, which can be replaced only at the manufacturer's<br />
laboratory in Denmark. The QHM can be mounted on almost every<br />
non-<strong>magnetic</strong> theodolite using a self-made or factory-provided adaptor.<br />
The principle of measurement of horizontal intensity H with a QHM is shown in<br />
Figure 4.3.<br />
Denoting (A+ - Ao) = a+ <strong>and</strong> (Ao - AJ = a_ we get the following equations of<br />
equilibrium, applying <strong>for</strong>mula 4.2 (see also Figure 4.3),<br />
mHsina= up<br />
mHsin(a+ CLt) = c(qJ+ 2n)<br />
mHsin( a - a_) = c( qJ - 2n)<br />
From these we can obtain H:<br />
(4.8)<br />
(4.9)
! I '<br />
- 57-<br />
Figure 4.2. The quartz horizontal magnetometer QHM.
Ao<br />
- 58-<br />
Magnetic<br />
N<br />
Figure 4.3. The principle of measurement of horizontal intensity H with QHM. The<br />
thick arrows show the positions of the magnet. The angles k between the directions of<br />
the magnet <strong>and</strong> the theodolite directions (A-readings) are caused by collimation.<br />
They are constant in one series of observations unless the telescope is touched, which<br />
would ruin the observation. a is a small angle caused by torsion qy of the suspending<br />
fibre. a is made small by the manufacturer of the instrument.<br />
Using the well-known trigonometric fonnula (subtraction of two sine terms) we<br />
get<br />
(4.10)<br />
The <strong>magnetic</strong> moment m of the speciaUy treated QHM-magnet is very stable, <strong>and</strong><br />
so is the torsion constant c of quartz. m <strong>and</strong> c keep their values <strong>for</strong> a long time <strong>and</strong> can<br />
be considered constant so that the term 27rClm can be set equal to C. a usually is<br />
very small by adjustment of the instrument so that cos«a+ - aJ/2 + a) can be<br />
replaced with 1, <strong>and</strong> we get:<br />
H= C/sinqy (4.11)
- 64 -<br />
several tens of percent in the light intensity cannot be seen as a change in sensitivity<br />
in practice. It has to be stressed, however, that the feed-back system does not correct<br />
<strong>for</strong> possible instabilities in the permanent compensation of the main part of the<br />
external field, nor does it correct <strong>for</strong> the possible change of recording due to tilting or<br />
thermal coefficient. But, as presented above, the use of phototransfer with feed-back<br />
not only allows us to express the variation of the <strong>magnetic</strong> field as electric voltage,<br />
but also improves some parameters of the variometer.<br />
Widely used is the Polish torsion photoelectric magnetometer TPM, which has<br />
been installed at observatories in several countries <strong>and</strong> is also used in field work.<br />
Based on roughly the same principle, similar magnetometers have been constructed<br />
(e.g, Beblo, 1990). Below we describe the Polish TPM as a typical one (Marianiuk et<br />
al.,1978).<br />
The instrument is based on quartz variometers designed by Bobrov (1962). Bobrov<br />
quartz variometers are of a type in which the quartz fibres are attached to both sides<br />
of a magnet so that the magnet is suspended on the fibre . During recording, the<br />
Figure 4.7. The box of torsion photoelectric variometer with sensors <strong>and</strong> sensor<br />
electronics.
- 65 -<br />
<strong>magnetic</strong> field perpendicular to the magnet is kept almost zero. Most of the field is<br />
compensated using stable magnets with near-zero thermal coefficients. These<br />
magnets are fixed to the quartz frame of the variometer. Additional small magnets<br />
can be used outside the variometer to produce compensation in a field different from<br />
that <strong>for</strong> which the magnetometer was designed.<br />
To the classical variometers, photoelectric converters are added. The electronics<br />
<strong>and</strong> the photoelectric converters are similar <strong>for</strong> all three components. The interior of<br />
a TPM is shown in Figure 4.7. In addition to the three quartz variometers <strong>and</strong> the<br />
three photoelectric converters, the casing contains the electronics <strong>for</strong> the<br />
compensation of temperature variations <strong>and</strong> <strong>for</strong> the recording of temperature. The<br />
instrument is shown to have quite good teclmical parameters. The long-term stability<br />
is usually a few nanoteslas per year, <strong>and</strong> the resolution is not less than 0.0 I nT. After<br />
transportation one can expect some work to be needed in correcting the position of<br />
the light spot <strong>and</strong> possibly in changing the lamp (or LED which is sometimes used<br />
instead of a lamp to save power) or in some cases also the photodiodes. The normal<br />
life-time of the lamps is more than five years. The LEDs also last several years be<strong>for</strong>e<br />
losing too much of their light intensity.<br />
4.6 Proton precession magnetometer<br />
In contemporary physics, the measurement of frequency is the most accurate<br />
technique. The modern ways to measure frequencies are easy due to the progress in<br />
electronic technology. This is the reason why <strong>for</strong> any physical quantity to be<br />
measured an attempt has been made to trans<strong>for</strong>m its measurement to that of<br />
frequency.<br />
In geomagnetism, proton <strong>and</strong> optical-pumping magnetometers are based on the<br />
trans<strong>for</strong>mation of intensity of the <strong>magnetic</strong> field to a frequency to be measured. The<br />
measurement in the spectral domain is the determination of the location of the center<br />
of the spectral line. When the spectral line is narrow, it is possible to determine its<br />
position with a very high relative accuracy, 10- 12 is common in physics. In<br />
geo<strong>magnetic</strong> <strong>measurements</strong> the accuracy is not higher than 10- 7 (often only 10- 5 ),<br />
due to the rather broad spectral line depending on the signal-to-noise ratio in the<br />
magnetometers.<br />
The proton precession magnetometer or simply proton magnetometer is based on<br />
free precession of protons in a liquid. The angular precession OJ of protons depends<br />
linearly on the <strong>magnetic</strong> field :<br />
(4.26)<br />
where 'Yp is the gyro<strong>magnetic</strong> ratio of the proton which is a natural constant known<br />
with high accuracy. The National Bureau of St<strong>and</strong>ard value of 'Yp is
lP = 2.6751525.10 8 ±40 T -IS-I.<br />
- 66-<br />
<strong>IAGA</strong> has recommended that from the beginning of the year 1992 the best known<br />
value should be used in geo<strong>magnetic</strong> work. Prior to 1992, the value used in<br />
geo<strong>magnetic</strong> work was the value adopted by <strong>IAGA</strong> in 1960<br />
All <strong>magnetic</strong> data produced <strong>and</strong> published be<strong>for</strong>e 1992 are based on this value.<br />
As mentioned above, the gyro<strong>magnetic</strong> ratio yis a natural constant relating the spin<br />
of a subatomic particle to mechanical moment p <strong>and</strong> <strong>magnetic</strong> moment m:<br />
m=yp (4.27)<br />
where p = jhl2n, withj being the quantum number of the particle; <strong>for</strong> the proton<br />
<strong>and</strong> electron it is 112, <strong>and</strong> h is Planck's constant (6.62.10- 34 Is). The gyro<strong>magnetic</strong><br />
ratio of a free electron, Ye, is about 658 times higher than that of a proton.<br />
The coupling energy E of <strong>magnetic</strong> moment m in <strong>magnetic</strong> field F is<br />
E = -m . F = -mFcos{} (4.28)<br />
Because, as a rule, there are 2j + 1 allowed energy levels, protons <strong>and</strong> electrons<br />
withj = 112 have only two possible energy levels, corresponding to (}..values of plus<br />
<strong>and</strong> minus 45°. In a sensor, which is a large sample of, say, protons, the populations<br />
of the two energy levels are proportional to exp(-Elk1), where k is the Boltzmann<br />
constant (1.38.10- 23 11K) <strong>and</strong> Tis the absolute temperature. This means that the ratio<br />
of populations at two energy levels is<br />
N}IN2 = exp [(El - E2)]lkT (4.29)<br />
where NI <strong>and</strong> N2 are the numbers of particles at the two energy levels.<br />
In thermal equilibrium, the lower energy level is slightly more populated than the<br />
upper one. In a <strong>magnetic</strong> field F , <strong>and</strong> when there is a difference in the populations of<br />
the energy levels, there will be a net magnetization M of the sensor colinear with F<br />
(4.30)<br />
where /C = nuclear susceptibility <strong>and</strong> N = number of particles in the sample. In a<br />
<strong>magnetic</strong> field, M is oriented along the field. In a proton magnetometer, M is<br />
deflected from this direction by applying a roughly perpendicular <strong>magnetic</strong> field,<br />
which means that M orientates along the new field direction acquiring a new value of<br />
M which depends on the strength of the perpendicular field <strong>and</strong> on its duration. The
- 67-<br />
new value is achieved exponentially with time constant TI. It is essential to realize<br />
the two effects of the deflecting field in a proton magnetometer:<br />
1) the deflecting additional field increases the magnetization of the sensor<br />
according to <strong>for</strong>mula (4.30), <strong>and</strong><br />
2) the additional field deflects M from the direction of the field to be measured, so<br />
that when the deflecting field is removed rapidly, the protons begin to precess around<br />
the remaining field spiralling towards the direction of the field, again exponentially<br />
with time constant T 2 .<br />
The gyro frequency J of protons is measurable in <strong>magnetic</strong> fields which are of the<br />
same order of magnitude as the field of the Earth. F <strong>and</strong>J are connected by equation<br />
(4.26). From this equation it follows that 1 Hz corresponds to 23.48720 nT (the old<br />
<strong>IAGA</strong> value was 23.4874 nTlHz).<br />
The sensor of the proton magnetometer is usually a bottle contalrung some<br />
200- 500 cc proton-rich liquid such as water (good but not practical in cold climate),<br />
alcohol or kerosene. Around the bottle there are about 1000 windings of copper or<br />
aluminum wire <strong>for</strong> applying a polarizing field to the liquid (fields up to 0.01 Tare<br />
used) <strong>and</strong> <strong>for</strong> picking up the signal from the precessing protons after cutting off the<br />
polarizing field. In some proton magnetometers a double bottle with oppositely<br />
directed coils is used to compensate <strong>for</strong> possible disturbing electro<strong>magnetic</strong> fields<br />
(Jankowski et al., 1965). In the measurement the bottle is oriented so that the<br />
polarizing field is roughly perpendicular to the measured field. When the polarizing<br />
field is cut off rapidly, the protons begin to precess around the <strong>magnetic</strong> field<br />
vector, whose magnitude is to be measured. The signal from the protons is small, only<br />
of the order of one microvolt in the coil, but its frequency is measurable <strong>for</strong> 1-5<br />
seconds depending on the homogeneity of the measured field <strong>and</strong> the polarizing field<br />
used. As shown above, the frequency is linearly proportional to the magnitude of<br />
the field. The generation of the free precession signal of a proton magnetometer is<br />
shown in Figure 4.8.<br />
The ratio of amplitude-to-noise of the decaying signal shown in Figure 4.8 depends<br />
on several factors: the volume of the sensor, strength <strong>and</strong> duration of the field used<br />
<strong>for</strong> the polarization, the b<strong>and</strong>-pass of the filter <strong>and</strong> the homogeneity of the field to be<br />
measured. For practical purposes the sensor should be light, the power consumption<br />
low <strong>and</strong> the filter not too narrow. All these factors can influence the signal-to-noise<br />
ratio, which in commercially available magnetometers is usually some tens to one.<br />
In any case, it is necessary to measure a frequency between I <strong>and</strong> 4 kHz of a weak,<br />
noisy signal which decays exponentially in a few seconds, with an accuracy not less<br />
than 10- 5 .<br />
There are several methods <strong>for</strong> the determination of the frequency Jfrom the proton
- 71 -<br />
phase-locked to the signal from the proton sensor. The principle of this method is<br />
illustrated in Figure 4.10.<br />
On the display of the phase-locked proton magnetometer we have a number N<br />
which corresponds to cycles of the veo counted in period T g .<br />
N = Tgfvco = Tg mf<br />
<strong>and</strong><br />
(4.32)<br />
F= 27rNIYp Tg m. (4.33)<br />
Putting the ratio 27r1'Yp Tg m = 1, which is easy by selecting a suitable<br />
multiplication factor m <strong>and</strong> a proper time period T g , we get<br />
F=N.<br />
One advantage of the phase-locked system compared to the previous one is first of<br />
all that the readings are directly in nanoteslas, which is convenient. There is some<br />
profit in the use of the frequency of the voltage-controlled oscillator. This means<br />
some averaging. There<strong>for</strong>e, the phase of its signal has smaller fluctuations than the<br />
original signal of the free precession. In this magnetometer the sensitivity can be<br />
made higher than in the previous one, say to about 0.1 nT. On the other h<strong>and</strong>, the fact<br />
that the precession frequency is not measured directly but rather a frequency which is<br />
synchronized with the precession frequency is a shortcoming of this method: the<br />
indirect measurement may be worse than the direct one. In some cases, the voltagecontrolled<br />
oscillator may generate a signal even when the precession signal no longer<br />
exists, <strong>for</strong> example when a high gradient causes the signal at the end of the measuring<br />
period to be smaller than the noise.<br />
Based on a central microprocessor, new proton magnetometers have been designed<br />
during recent years. The use of new technology has made it possible to improve the<br />
technical parameters of the instrument. Using processors <strong>for</strong> the measurement of the<br />
precession frequency is rather simple. This is illustrated in Figure 4.11.<br />
The use of computer technology allows sophisticated treatment of the<br />
measurement results stored in the memory of the processor. Figure 4.11 presents one<br />
example where the least squares fit can be used, or the so-called digital filter<br />
algorithm. In any case, as can be seen from Figure 4.12 where data from the first<br />
method <strong>and</strong> the microprocessor method are presented, the statistical possibilities<br />
clearly improve the precision. Naturally, using computer technology it is easy to<br />
obtain the results directly in nanoteslas.<br />
Additionally, the use of computer technology can make the instrument "intelligent"<br />
in the sense that only signals higher than noise are utilized. Also, it is easy to produce,
t<br />
- 73 -<br />
Simple method<br />
of the period<br />
calculation<br />
Figure 4.12. Illustration of the difference between the simple <strong>and</strong> microprocessor<br />
methods of the period calculation. n = consecutive number of zero crossing, t = time<br />
of the corresponding crossing. In the old simple method the line had to be determined<br />
from 2 points (crossings of the amplified precession signal through the zero line) only,<br />
one at the beginning <strong>and</strong> one at the end of the measuring period. The processor<br />
allows all the crossings to be taken into account <strong>and</strong> a statistical fit to be applied.<br />
4.7 Overhauser magnetometer<br />
Proton magnetometers described above are the nonnal instruments <strong>for</strong> absolute<br />
<strong>measurements</strong> at <strong>magnetic</strong> observatories, <strong>and</strong> also <strong>for</strong> taking samples of the field in<br />
other connections. As shown above, proton magnetometers cannot take samples very<br />
frequently. When faster sampling is needed, without reducing the accuracy, two<br />
methods using the proton precession have been applied. In the method of Skripov<br />
(1958) the liquid is polarized outside the pick-up coil <strong>and</strong> the liquid runs through the<br />
coil continuously. In this method, the time used <strong>for</strong> polarizing is saved <strong>and</strong> the<br />
samples can be taken once in a second or so. There are only very few such<br />
magnetometers in use.<br />
The other method, applying the so-called Overhauser effect, has become widely<br />
used (Overhauser, 1953; Hrvoic, 1990). In this method:<br />
n
- 76-<br />
It is also possible to create continuous proton precession by applying a weak<br />
<strong>magnetic</strong> field which rotates in the plane of precession with a frequency very close to<br />
the frequency of the gyrating protons (within the width of the spectral line of the<br />
protons, which is about 2 nT). In this method the precession signal is detected <strong>and</strong> a<br />
voltage controlled oscillator (VeO) is locked to it. The veo frequency is measured<br />
<strong>and</strong> a small correction applied leading to an accuracy of a small fraction of nT.<br />
Another method is to amplify the proton precession signal <strong>and</strong> feed it back to the<br />
coils to produce the excitation field. The major advantage over the much simpler<br />
veo method is the possibility to follow the changes of the <strong>magnetic</strong> field with high<br />
speed.<br />
The advantages of the Overhauser magnetometers compared to the classical proton<br />
magnetometers can be listed as follows:<br />
o<br />
o<br />
o<br />
o<br />
It is possible to create a steady proton precession signal, which makes possible<br />
the true average measurement of the <strong>magnetic</strong> field, instead of sampling.<br />
Small consumption of power. Pulsed Overhauser magnetometers use typically 1<br />
Ws of energy per reading compared with several times higher consumption in<br />
classical proton magnetometers.<br />
Faster rate of readings, because no time is wasted <strong>for</strong> polarization.<br />
The sensor can be made rather small (pulsed Overhauser magnetometers have<br />
used sensors smaller than 0.2 I liquid with noise st<strong>and</strong>ard deviations 0.02 nT<br />
rms).<br />
However, shortcomings have also been found in Overhauser magnetometers<br />
compared to the classical ones:<br />
o<br />
o<br />
o<br />
o<br />
The radio frequency used may disturb nearby instruments.<br />
Production of the polarizing signal is more difficult than in the classical proton<br />
magnetometers.<br />
The construction is more complicated leading to reduced reliability.<br />
The liquid used is not always stable <strong>and</strong> it is often a secret of the manufacturer.<br />
4.8 Optically pumped magnetometers<br />
In this <strong>Guide</strong>, the optically pumped magnetometers are described shortly, because<br />
they are rather seldom used in <strong>observatory</strong> practice. More detailed description can be<br />
found in geophysical literature (see Stuart, 1972; Forbes, 1987). The operation of<br />
optically pumped magnetometers is based on Zeeman splitting of the energy levels of<br />
atoms into sublevels, whose energy separation depends on the orientation of the
Rb lamp<br />
- 78 -<br />
lens filter pol ariz.<br />
freq.<br />
meas.<br />
lens<br />
modu-I--__ ---l<br />
lation<br />
photo<br />
cell<br />
Figure 4.15. The working principle of rubidium magnetometer. The rubidium light<br />
passes through an interference filter, a circular polarizer <strong>and</strong> an absorbing cell,<br />
which is filled with rubidium vapor. The light is pumping atoms <strong>and</strong> the cell becomes<br />
transparent to the resonant light. The light intensity is measured by means of a<br />
photocell. The radio frequency from the oscillator follows the resonance frequency<br />
due to negativefeedbackfrom the photocell.<br />
Table 4.1<br />
Properties of the elements used in optically pumped magnetometers<br />
Quantum number<br />
Total no. of<br />
GyroIll:agnetic<br />
Element F of relevant<br />
sublevels mF rauJ1l<br />
atomic state (Hz n I)<br />
85 Rb 3 7 4.667<br />
87 Rb 2 5 6.999<br />
133 CS 4 9 3.499<br />
4He I 3 28.0<br />
their <strong>magnetic</strong> number by 0 or ±I. This means that after certain time nearly all atoms<br />
will be pumped into sublevel mF = +2 of the ground state. This phenomenon is called<br />
optical pumping. In this state, atoms in a gas cell cannot absorb photons of light. If<br />
we now apply a radio frequency electro<strong>magnetic</strong> field offrequency corresponding to<br />
the difference between mF = +2 <strong>and</strong> mF = + I sublevels of the F = 2 hyperfine level,
-79 -<br />
the mF = + 1 sublevel will be again populated <strong>and</strong> optical a+ photons will be absorbed.<br />
The resonant frequency is called a Larmor frequency, <strong>and</strong> is characterized by a<br />
gyro<strong>magnetic</strong> ratio (see Table 4.1). In Figure 4.15 we give an example of block<br />
diagram of rubidium magnetometer.<br />
There is a variety of designs of optically pumped magnetometers. The one<br />
presented in Figure 4.15 is of a locked oscillator type. Another type is a self-oscillator<br />
magnetometer. There are several differences even between the instruments of the<br />
same type, related, e.g., to relaxation processes in the gas cell, direction of alternating<br />
field <strong>and</strong> so on. Comparing with proton magnetometers, the optically pumped<br />
magnetometers have some advantages:<br />
o<br />
o<br />
o<br />
o<br />
o<br />
o<br />
The gyro<strong>magnetic</strong> ratio is bigger <strong>and</strong> the measured frequency is higher.<br />
The resolution is very high, up to 0.001 nT.<br />
The duration of <strong>measurements</strong> can be shorter.<br />
The disadvantages are the following:<br />
The relation between the frequency <strong>and</strong> the <strong>magnetic</strong> field <strong>for</strong> alkali vapor is<br />
slightly nonlinear; <strong>for</strong> example, <strong>for</strong> 85Rb we have f = (4.667 . B - 72 . 10- 10 B2)<br />
Hz · nr l .<br />
The construction of magnetometers is more sophisticated <strong>and</strong> the whole<br />
instrument is expensive. Some elements of the instrument can be subject to<br />
ageing.<br />
For absolute <strong>measurements</strong>, the instrument IS not as suitable as a proton<br />
magnetometer.<br />
4.9 Fluxgate magnetometer<br />
The fluxgate magnetometers are based on the nonlinearity of the magnetization of<br />
"soft" <strong>magnetic</strong> materials. The sensitive element of a fluxgate magnetometer consists<br />
of an easily saturable core made of material with high permeability. Around the core<br />
there are two windings: an excitation coil <strong>and</strong> a pick-up coil. If an alternating<br />
excitation current with frequency f ((0= 27Tf) is fed into the excitation coil so that<br />
saturation occurs <strong>and</strong> if there is an external field along the fluxgate element, there<br />
exists in the pick-up coil a signal having not only the frequency f but also other<br />
harmonics. The second harmonic is particularly sensitive to the intensity of the field.<br />
Fluxgate magnetometers have a long history. The first instrument was described<br />
be<strong>for</strong>e the second world war (Aschenbrenner <strong>and</strong> Gaubau, 1936), <strong>and</strong> it was further<br />
developed during the war <strong>for</strong> detecting mines. Up to now more than a hundred
- 80-<br />
different types of instruments have been designed. Different types of cores are in use:<br />
single bar cores, cores of two parallel bars, ring cores. Several different alloys are<br />
also in use as cores: permalloy, mumetal, ferrite, amorphous <strong>magnetic</strong> materials, etc.<br />
Different configurations <strong>for</strong> the excitation field are also in use: parallel or<br />
orthogonal to the axis of the sensor with many different wave<strong>for</strong>ms of the excitation<br />
signals. An excellent review offluxgate magnetometers has been written by Primdahl<br />
(1979); see also Coles, (1988). Because the fluxgate magnetometer is now at most<br />
observatories the basic instrument <strong>for</strong> the absolute measurement of D <strong>and</strong> I <strong>and</strong><br />
widely used also <strong>for</strong> recording, we shall describe its principle of operation in greater<br />
detail.<br />
Let us start from a simple mathematical model (Yanovskiy, 1978). We assume that<br />
the hysteresis curve can be approximated by a polynomial of third degree<br />
B=aH 3 +cH (4.37)<br />
In the fluxgate sensor the <strong>magnetic</strong> field consists of the external field Ho <strong>and</strong> the<br />
excitation field HI cos OJ t, <strong>and</strong> we get <strong>for</strong> B<br />
i exc<br />
I<br />
BAR CORE<br />
UpiCk-uP<br />
B<br />
Figure 4.16. Wave<strong>for</strong>ms of afluxgate sensor with the core consisting of a single bar.<br />
t<br />
t<br />
t
- 83 -<br />
voltage induced in the pick-up coil, <strong>and</strong> cancelling of the fundamental <strong>and</strong> odd<br />
harmonics. The ring core sensors can be treated as a generalization of double core<br />
sensors <strong>and</strong> the wave<strong>for</strong>ms of the signals are similar.<br />
Most magnetometers use a negative feed-back system in which the fluxgate sensor<br />
is a zero-field indicator. In this case there are two practices in use: the whole field<br />
component is compensated by the feed-back current, or the majority of the field is<br />
compensated by a bias current from an independent power supply <strong>and</strong> only the rest of<br />
the field is compensated by the feed-back current. A block diagram of a simple<br />
second harmonic fluxgate magnetometer having a unit <strong>for</strong> bias current <strong>and</strong> a<br />
feed-back loop is shown in Figure 4.18.<br />
In a st<strong>and</strong>ard fluxgate magnetometer, the excitation of the sensor is produced by an<br />
oscillator. The signal from the pick-up coil is amplified with a tuned amplifier <strong>and</strong> fed<br />
to a phase-sensitive detector, referenced to the second harmonic of the excitation<br />
frequency. A current proportional to the output voltage is fed back to the feed-back<br />
winding of the sensor to oppose the field detected by the sensor. Due to high<br />
amplification <strong>and</strong> strong feed-back, the stability <strong>and</strong> linearity of the magnetometer<br />
are high <strong>and</strong> depend on changes of the parameters of the feed-back loop, especially<br />
on the resistance <strong>and</strong> the coil constant.<br />
In <strong>observatory</strong> practice, long-term stability is the essential requirement. As<br />
presented above, it depends mainly on the stability of the compensation of the main<br />
part of the field. It is not easy to construct a good offset compensator, because all<br />
parameters should be stable to ten parts per million. A serious problem is the<br />
temperature stabilization of the dimensions of the bias coil. There<strong>for</strong>e, the bias <strong>and</strong><br />
feed-back coils are as a rule wound around quartz tubes or frames. Also some<br />
ceramics <strong>and</strong> plastics have very small temperature coefficients.<br />
Fluxgate magnetometers exist also without separate field compensation, which<br />
means that the whole component of the <strong>magnetic</strong> field is compensated <strong>for</strong> by the<br />
feed-back current. These magnetometers are used to record not only variations of the<br />
field but also the full strength of the field itself. To have a resolution of O.lnT requires<br />
20 bits in the analog-ta-digital converter. This kind of construction seems to be more<br />
difficult to make stable than the construction with a bias field.<br />
Some parameters of the magnetometer can be corrected <strong>for</strong> by additional<br />
electronics or mechanical construction. Sometimes the compensation of temperature<br />
effects is done electronically. Today it is possible to make the corrections digitally,<br />
because most of the new magnetometers have microprocessors <strong>and</strong> the temperature<br />
is as a rule recorded together with the <strong>magnetic</strong> data. It is, however, important also to<br />
store the raw data be<strong>for</strong>e the calculated temperature correction. In places with<br />
unstable pillars, suspending the fluxgate sensor has proven to be a good solution<br />
(Rasmussen <strong>and</strong> Kring Lauridsen, 1990, Trigg <strong>and</strong> Olson, 1990). Also the corrections
- 85 -<br />
<strong>magnetic</strong> pulsations today. Until recent years liquid helium was needed <strong>for</strong> the use of<br />
SQUIDs, making them difficult <strong>and</strong> expensive to run continuously, such as at<br />
<strong>magnetic</strong> observatories. Today there are SQUIDs working at the temperature of<br />
liquid nitrogen (77K or -196°C). These SQUIDs are based on new superconducting<br />
materials which are ceramics, the most common at the moment being an oxide of<br />
yttrium, barium <strong>and</strong> copper, called YBCO.<br />
SQUIDs are based on three discoveries in physics, all leading to the Nobel Prize:<br />
superconductivity at low temperature (H. K. annes), the physical explanation of<br />
superconductivity (J. Bardeen, L. N. Cooper <strong>and</strong> 1. R. Schrieffer), <strong>and</strong> the effect of a<br />
thin insulating layer between two superconductors called a Josephson junction (B.D.<br />
Josephson). Superconductivity is explained by electrons fonning pairs so that the two<br />
electrons in each pair have opposite spin <strong>and</strong> momentum (Cooper pairs). Each pair is<br />
weakly bound together <strong>and</strong> has zero net spin <strong>and</strong> momentum. At low enough<br />
temperature the lattice vibrations are so weak that they do not disrupt the Cooper<br />
pairs which are free to move without resistance. At higher temperature, these pairs<br />
are disrupted <strong>and</strong> the electrons scatter, experiencing resistance.<br />
In a superconductor, there is a single wave function describing all the Cooper pairs.<br />
The Josephson junction separates two superconductors. The wave functions leak<br />
through the thin junction (tunneling effect) <strong>and</strong>, depending on the difference in phase,<br />
the voltage over the junction is higher or lower in a superconducting ring with two<br />
Josephson junctions, as shown in Figure 4.19. When the flux of the <strong>magnetic</strong> field<br />
through the ring changes, the voltage oscillates back <strong>and</strong> <strong>for</strong>th, each cycle meaning<br />
one flux quantum, a very small unit. So the SQUID is a quantum mechanical device,<br />
<strong>and</strong> the changes of the <strong>magnetic</strong> field are measured in flux quanta. A short, clear <strong>and</strong><br />
illustrative description of SQUIDs has been published by John Clarke in Scientific<br />
American (Clarke, 1994). More details are to be found in Clarke (1993).<br />
As shown above, the SQUID measures only changes of the <strong>magnetic</strong> field, but does<br />
so with always the same small <strong>and</strong> accurate steps (flux quanta, which depend on the<br />
construction of the SQUID). There<strong>for</strong>e, it can be used also in observatories in all<br />
recordings from pulsations to secular variation, the data being in digital fonn. Until<br />
now the main use close to geomagnetism has been in the measurement of<br />
paleo<strong>magnetic</strong> <strong>and</strong> archeo<strong>magnetic</strong> samples. Where very sensitive gradiometers are<br />
needed, the SQUID is superior. The SQUID magnetometers are commercially<br />
available, <strong>and</strong> the prices are not much higher than the prices of conventional<br />
magnetometers.
5. ABSOLUTE MAGNETIC MEASUREMENTS<br />
Observatories record variations of the geo<strong>magnetic</strong> field using different kinds of<br />
variometers, as will be described in Chapter 6. The absolute value of the recorded<br />
data is determined by separate absolute <strong>measurements</strong>. The variations of the<br />
components of the geo<strong>magnetic</strong> field are usually within ±3000 nT, although at high<br />
latitudes the variations may be as great as ±4000 nT. There<strong>for</strong>e, there is no need to<br />
record larger values than these, <strong>and</strong> one has to add a value, usually called base-line<br />
value, to obtain the final absolute value of the component of the field. Most<br />
variometers nowadays are rather stable. Changes of the base-line values of the best<br />
modem instruments are about 5 nT per year or less. But there are changes, <strong>and</strong><br />
there<strong>for</strong>e absolute <strong>measurements</strong> are unavoidable. There is no way to know when a<br />
change of the base-line may happen. There<strong>for</strong>e, quite frequent absolute<br />
<strong>measurements</strong> are necessary. Once a week is normal practice if there are two<br />
independent recording systems which are compared to each other on a daily basis or<br />
continuously.<br />
Over the last 150 years several authors of textbooks on geomagnetism have<br />
described in detail classical geo<strong>magnetic</strong> absolute <strong>measurements</strong>. Wienert's Notes on<br />
geo<strong>magnetic</strong> <strong>observatory</strong> <strong>and</strong> survey practice describes the methods which were in<br />
use in 1970. Here we shall discuss briefly the classical methods which are still<br />
commonly used today <strong>and</strong> concentrate on the new ones, which means the use of the<br />
proton precession magnetometer <strong>and</strong> the fluxgate theodolite. Today the fluxgate<br />
theodolite (often called DI-flux because D <strong>and</strong> I are determined using the instrument)<br />
combined with the proton magnetometer is the recommended pair of absolute<br />
instruments.<br />
In principle, the accuracy of some classical instruments is the same as that<br />
attainable by modem instruments (with the exception of measurement of the total<br />
intensity F), but the use of classical instruments, especially <strong>for</strong> the intensities of the<br />
geo<strong>magnetic</strong> field components, is much more difficult, <strong>and</strong> almost impossible<br />
without long training, which makes the results less accurate in practice.<br />
As pointed out in Chapter 3, observatories should have special pillars outside the<br />
absolute house <strong>for</strong> checking the absolute level from time to time, especially if there<br />
is doubt on artificial changes of the field in the absolute house. A good routine would<br />
be to measure the field components at the auxiliary pillars once a year <strong>and</strong> follow the<br />
year to year change, which should not differ from the recorded secular variation.
- 87 -<br />
5.1 Use of Ouxgate theodolite to measure declination D <strong>and</strong> inclination I<br />
The fluxgate theodolite <strong>for</strong> the measurement of the <strong>magnetic</strong> declination D <strong>and</strong><br />
inclination I is based on the so-called geodetic universal theodolite capable of<br />
measuring horizontal <strong>and</strong> vertical angles with an accuracy of roughly one second of<br />
arc (1"). A fluxgate sensor is mounted on top of the telescope of the theodolite. The<br />
most popular modem non-<strong>magnetic</strong> theodolites are Zeiss OJOB (precision of I") <strong>and</strong><br />
Zeiss 020A (precision of 0.1'). Both are available in degree-scale <strong>and</strong> grad-scale. In<br />
<strong>observatory</strong> work, the higher-precision model is preferable, which also makes the<br />
<strong>measurements</strong> easier. Such a theodolite is shown in Figure 5.1. A convenient feature<br />
of these theodolites is their gravity-oriented vertical scale, which means that the<br />
Figure 5.1. Theodolite Zeiss OJOB withjluxgate sensor ("jluxgate theodolite ") <strong>for</strong><br />
the measurement of <strong>magnetic</strong> declination D <strong>and</strong> inclination I.
- 88 -<br />
reading of the vertical scale is correct even when the levelling (see below) of the<br />
theodolite is not perfect. The gravity orienting system works if the levelling of the<br />
theodolite is better than ±4'.<br />
All <strong>measurements</strong> begin with levelling of the theodolite. Levelling means adjusting<br />
the theodolite's vertical axis into the vertical with the help of levels, which are fixed<br />
to the alidade (the upper turning part of the theodolite). It is best to first adjust the<br />
theodolite roughly vertical. Usually there is a low-sensitivity circular level <strong>for</strong> this<br />
purpose. For the final adjustment the alidade is turned into the position where the<br />
high-sensitivity level is parallel with the line of two footscrews. The reading of the<br />
level is observed <strong>and</strong> the alidade is turned 180°. In this position, half of the difference<br />
between the new reading of the level <strong>and</strong> the previous reading is corrected by turning<br />
two footscrews in opposite directions so that the left h<strong>and</strong> turns the left screw<br />
clockwise <strong>and</strong> the right h<strong>and</strong> the right screw anticlockwise, or vice versa. The<br />
levelling in the perpendicular direction will not change if both screws are turned<br />
equally. The new reading of the level is the level's zero position. Thereafter the<br />
alidade is turned 90° <strong>and</strong> the bubble of the level is adjusted to its zero position by<br />
turning the third footscrew. Now the vertical axis is supposed to be vertical, which<br />
has to be checked by repeating the procedure.<br />
The measurement of <strong>magnetic</strong> declination is simple. The flux gate sensor (see<br />
Chapter 4) is fixed to the telescope of the theodolite so that it measures the <strong>magnetic</strong><br />
field roughly in the direction of the optical axis of the theodolite. By setting the<br />
telescope horizontal (the vertical scale reads exactly 90° or 270°) <strong>and</strong> turning the<br />
theodolite until the sensor measures no <strong>magnetic</strong> field, the sensor is brought<br />
perpendicular to the <strong>magnetic</strong> field. Let us call the horizontal circle reading of the<br />
theodolite in this position Awr, indicating that the theodolite has been turned into a<br />
position where the telescope looks to the west <strong>and</strong> the flux gate sensor is on the upper<br />
side of the telescope. The telescope must be exactly horizontal, which has to be<br />
checked by reading the vertical scale. The next reading is taken after turning the<br />
telescope around its vertical axis by approximately 180° into the opposite horizontal<br />
position where the sensor measures zero again, which shows that the sensor is again<br />
perpendicular to the field. The horizontal circle reading is then Art ; the telescope<br />
looks to the east <strong>and</strong> the sensor is on top of the telescope. The next horizontal circle<br />
reading is Aw.I., taken after turning the telescope around its horizontal axis 180° <strong>and</strong><br />
finding the position giving a zero reading on the magnetometer (a null position) by<br />
adjusting the horizontal direction. Finally, AE.i. is found by turning the theodolite<br />
around its vertical axis to the opposite null position. The circle reading A to <strong>magnetic</strong><br />
north is the mean of the four readings:<br />
A = (Awt+A£i+Aw.!. +AE.!.)/4<br />
The <strong>magnetic</strong> declination D is then (see Chapter 4, <strong>for</strong>mula 4.3)
- 89 -<br />
D=A - (B-A z ) (5.1 )<br />
where B is the circle reading to the azimuth mark, whose geographical azimuth is Az.<br />
D is naturally the mean declination of the times of the four observations Awj, Art,<br />
Aw.J., <strong>and</strong> AE.J.·<br />
The four observations compensate <strong>for</strong> the misalignment between the <strong>magnetic</strong> axis<br />
of the fluxgate sensor <strong>and</strong> the optical axis of the telescope <strong>and</strong> <strong>for</strong> the possible<br />
zero-field offset of the fluxgate magnetometer. Naturally, the observations can be<br />
taken in any order, but it is advisable to always use the same order. To increase the<br />
accuracy, at least two readings should be taken in each position. It is important to<br />
ensure that the telescope is horizontal be<strong>for</strong>e each reading. As described above, this<br />
is easy <strong>for</strong> modern theodolites with gravity-oriented vertical scales; one only needs to<br />
adjust the telescope so that the vertical scale shows exactly 90° or 270°. The levelling<br />
has to be better than 2" <strong>for</strong> an accuracy of 0.1' in declination.<br />
The fluxgate magnetometer which is used <strong>for</strong> the search of zero position usually<br />
has an output in nanoteslas. Instead of searching <strong>for</strong> the position of exactly zero by<br />
turning the alidade of the theodolite, it is often more practical to turn the theodolite to<br />
a close-to-zero value <strong>and</strong> to record the reading in nanoteslas from the magnetometer.<br />
This is especially advisable if several readings are taken from the same theodolite<br />
position. It also makes possible an accurate measurement even when the observer is<br />
slightly <strong>magnetic</strong>, because one does not need to be close to the theodolite when<br />
taking the readings from the magnetometer. Naturally, the electronics box has to be<br />
far enough from the sensor. The batteries are often rather <strong>magnetic</strong> (this has to be<br />
tested using the same magnetometer <strong>and</strong> bringing the electronics with its batteries<br />
close to the sensor <strong>and</strong> turning it in different positions). The close-to-zero technique<br />
can be used only if the output of the magnetometer close to the zero position is linear.<br />
Usually this is the case with sufficient accuracy.<br />
Using the close-to-zero technique, the correction to be added to each A-reading is<br />
M = arc sineS/H). (5.2)<br />
which in degrees of arc [0] is<br />
M[O] = (180I1r)(S/ H) = 57.296 (S/ H)<br />
<strong>and</strong> which in arc seconds ["] is<br />
M["] = 206265 (S/ H)<br />
where S is the reading of the magnetometer in nanoteslas <strong>and</strong> H is an approximate<br />
value of the horizontal component. The sign of the correction M depends on what is<br />
the positive direction of the fluxgate sensor, so that if the magnetometer shows
Position<br />
TableS.}<br />
An example of a complete measurement of declination.<br />
Place: Nurmijiirvi <strong>observatory</strong>, main pillar. Date: 1991-11-27.<br />
Fluxgate theodolite: Zeiss OlOB + GEO jluxgate. Observer: P. Posio.<br />
(UT) A" S L1A A=A"+M X",e free De A'<br />
[h m s] [0 ,<br />
"] [nTJ ["] [0 ,<br />
"] [nT] [nT] [0 ,<br />
"] [0 ,<br />
B,J,. 07 56 00 150 25 18<br />
Bj 58 00 330 25 08<br />
Wj 08 01 00 247 52 43 -0.3 +4. 1 14960.3 1314.1<br />
02 00 - 0.1 +1.4 14959.6 1314.0<br />
03 00 - 0.4 + 5.5 14958.7 1314.4<br />
04 00 -0.1 +1.4 14958.4 1314.3<br />
Mean + 3.1 247 52 46 14959.2 1314.2 5 01 14 247 52 32<br />
Ej 08 05 00 67 49 45 +0.2 + 2.8 14958.4 1315.0<br />
06 00 - 0.2 - 2.8 14958.2 1314.9<br />
07 00 -0.4 -5.5 14957.7 1314.4<br />
08 00 -1.0 -13.7 14956.8 1313.6<br />
Mean - 4.8 67 49 40 14957.8 1314.5 5 01 20 67 49 20<br />
'1
Position<br />
CUT) A" S<br />
[h m s] [0 I "] [nT]<br />
WJ. 08 10 00 67 47 52 - 0.1<br />
Mean<br />
11 00 + 0.2<br />
12 00 + 1.2<br />
13 00 +2.4<br />
EJ. 08 14 00 247 57 04 -0.1<br />
Mean<br />
All mean<br />
15 00 -0.4<br />
16 00 + 0.3<br />
17 00 + 1.0<br />
BJ. 19 00 150 25 16<br />
B1' 20 00 330 25 09<br />
B Mean 240 25 13<br />
L1A<br />
["]<br />
+1.4<br />
-2.8<br />
- 16.5<br />
-33.0<br />
-12.7<br />
-1.4<br />
- 5.5<br />
+ 4.1<br />
+ 13.7<br />
+ 2.7<br />
Table 5.1<br />
(continued)<br />
A=A"+M<br />
[0 I "]<br />
67 47 39<br />
247 57 07<br />
157 51 48<br />
X ree<br />
[nT]<br />
14956.3<br />
14955.7<br />
14955.0<br />
14955.8<br />
14955.7<br />
14954.4<br />
14954.6<br />
14953.3<br />
14953.4<br />
14953.9<br />
14956.66<br />
Y ree<br />
[nT]<br />
1315.9<br />
1315.5<br />
1314.7<br />
1313.8<br />
[0<br />
De<br />
I "] [0<br />
A'<br />
I "]<br />
1315.0<br />
1313.7<br />
1313.8<br />
1313.9<br />
1315.1<br />
5 01 30 67 47 09<br />
1314.1 5 01 20 247 56 47<br />
1314.44 5 01 21 157 51 27
Table 5.2<br />
An example of a complete measurement of inclinatioll.<br />
Place: Nurmijiirvi <strong>observatory</strong>.<br />
Continuation of D-measurement of Table 5.1.<br />
Position<br />
[h<br />
(UT)<br />
m s] [0<br />
V'<br />
I "]<br />
S<br />
[nT]<br />
L1V<br />
["]<br />
V=V '+L1V<br />
I [0 "]<br />
Xree<br />
[nT]<br />
Yree<br />
[nT]<br />
Zree<br />
[nT]<br />
He<br />
[nT]<br />
Fe<br />
[nT] [0<br />
Ie<br />
I<br />
Nt 08 21 00 73 02 48 -l.l 4.4 14953.0 1314.6 49267.9<br />
22 00 - 1.4 5.6 14953.1 1314.4 49267.7<br />
(1) 23 00 - 1.5 5.9 14954.0 1316.1 49267.5<br />
24 00 -1.4 5.6 14953 .5 1315.9 49268.4<br />
Mean 5.4 73 02 53 14953.40 1315.25 49267.88 15011.13 51503.96 73 03 18<br />
sJ- 08 25 00 253 01 57 - 0.5 - 2.0 14955.0 1316.1 49268.1<br />
26 00 - 1.9 - 7.5 14954.9 1314.7 49268.2<br />
(2) 27 00 - 1.6 - 6.3 14953.6 1314.6 49267.4<br />
28 00 - 2.3 - 9.1 14953.5 1313.8 49267.5<br />
Mean - 6.2 253 01 51 14954.25 1314.80 49267.80 15011.94 51504.12 73 03 14<br />
"]
Position<br />
[h<br />
(UT)<br />
m s] [0<br />
V'<br />
I<br />
"]<br />
S<br />
[nT]<br />
..1V<br />
["]<br />
Nt 08 30 00 286 55 11 +0.5. + 2.0<br />
31 00 -1.1 -4.4<br />
(3) 32 00 - 1.8 -7.1<br />
33 00 - 2.3 - 9.1<br />
Mean - 4.6<br />
sf 08 34 00 106 56 10 + 0.9 - 3.6<br />
35 00 + 0.9 - 3.6<br />
(4) 36 00 + 0.8 - 3.2<br />
37 00 0.0 0.0<br />
Mean - 2.6<br />
All mean<br />
Table 5.2<br />
(continued)<br />
V=V '+..1V Xree<br />
[0 I<br />
"] [nT]<br />
14951.7<br />
14950.2<br />
14949.9<br />
14949.6<br />
286 55 06 14950.35<br />
14948.2<br />
14947.4<br />
14947.4<br />
14948.5<br />
106 56 07 14947.88<br />
14951.47<br />
Yree<br />
[nT]<br />
1313.4<br />
1312.8<br />
1312.2<br />
1314.3<br />
1313.18<br />
1316.2<br />
1315.9<br />
1315.5<br />
1314.8<br />
1315.60<br />
1314.71<br />
Zree<br />
[nT]<br />
49267.1<br />
49267.0<br />
49267.2<br />
49267.1<br />
He<br />
[nT]<br />
Fe<br />
[nT] [0<br />
Ie<br />
I "]<br />
49267.10<br />
49267.4<br />
49267.5<br />
49267.4<br />
49268.1<br />
15007.91 51502.28 73 03 29<br />
49267.60 15005.66 51502.10 73 03 38<br />
49267.59 15009.16 51503.11
- 94 -<br />
positive field when the telescope is turned towards the north, then the corrections <strong>for</strong><br />
the observations with the telescope looking west have the opposite sign to S, <strong>and</strong> the<br />
corrections to observations where the telescope looks towards the east have the same<br />
sign as S. If, however, the fiuxgate sensor has been installed in the opposite position,<br />
giving positive readings when the telescope is directed towards the south, then the<br />
signs of the corrections are opposite to those given above.<br />
For example, in a field H = 15,000 nT <strong>and</strong> where the magnetometer shows<br />
positive values when directed northwards, the corrections to the circle readings A in<br />
seconds of arc ["] are<br />
<strong>and</strong><br />
M = -13.75· S, when the telescope is looking towards the west (the observer<br />
in the east <strong>and</strong> the observation marked A w),<br />
M = +13.75· S, when the telescope is looking towards the east (the observer<br />
in the west <strong>and</strong> the observation marked AE).<br />
An example of a complete measurement of declination D is shown in Table 5.1. In<br />
this table, Bt <strong>and</strong> B.J. are the circle readings of the azimuth mark when the fiuxgate<br />
sensor is above or under the telescope, Xree <strong>and</strong> Yree are the X <strong>and</strong> Y values from the<br />
digital recording <strong>for</strong> the times of the observations, <strong>and</strong> De is the declination calculated<br />
from the X ree <strong>and</strong> Yree values. The "All mean" value of A is the only one needed<br />
<strong>for</strong> the calculation of declination. The "All mean" value of calculated declination De<br />
is needed <strong>for</strong> the final calculation of the base-line values. A' is the mean value of A<br />
reduced to De = 5°01'00", used <strong>for</strong> calculation of the misalignment of the sensor (see<br />
section 5.2).<br />
If the direction to the mark (the azimuth of the mark) is A z = - 2°25'06", which is<br />
the case at the Nurmijiirvi <strong>observatory</strong>, we obtain, applying <strong>for</strong>mula (5.1)<br />
In our example, D calculated from the recorded X <strong>and</strong> Y is 5°01'21". This shows<br />
that there is a small error in the base-line value of X or Y or both, so that the recorded<br />
Dis 8" too small.<br />
An ambiguity of 180° may appear in the result if the zero of the horizontal circle<br />
has been crossed in the observations. It is possible to avoid this by adjusting the<br />
horizontal circle of the theodolite suitably, but an error of 180° is usually easy to<br />
detect <strong>and</strong> correct <strong>for</strong>.<br />
If one of the components recorded is declination D, then the D-value obtained in<br />
the absolute measurement minus the recorded D (mean of the D-values from the<br />
times of observations) is the correction to be added to the base-line of the recording.
- 95 -<br />
If, however, the components X <strong>and</strong> Yare recorded, then <strong>for</strong> the determination of the<br />
base-lines of X <strong>and</strong> Y we also need the absolute value of H <strong>for</strong> the time of the<br />
observation of D. It is obtained from the results of the absolute measurement of the<br />
total intensity F <strong>and</strong> the inclination I.<br />
The inclination angle I is measured immediately after the measurement of D,<br />
because A, detennined in the D-measurement, is used to orientate the theodolite so<br />
that the telescope is in the <strong>magnetic</strong> meridian. TheA-value without correction is good<br />
enough <strong>for</strong> this, because in the observation of I the horizontal direction of the<br />
theodolite is not critical; an accuracy of 10' is good enough. The circle reading is<br />
simply fixed to the mean of the A-readings (or A - 180 0 after turning the theodolite)<br />
which means that the telescope <strong>and</strong> the flux gate sensor are in the plane of the<br />
<strong>magnetic</strong> meridian.<br />
In the I-observation, the zero readings on the magnetometer are found by turning<br />
the telescope around its horizontal axis <strong>and</strong> the vertical circle readings are noted.<br />
Again, it is not necessary to adjust the inclination of the telescope so that the value is<br />
exactly zero, meaning that the fluxgate sensor is exactly perpendicular to the<br />
<strong>magnetic</strong> field. It is more convenient to observe small readings in the same way as in<br />
the D-measurement.<br />
Assuming again that the magnetometer shows positive values when the telescope<br />
looks northwards, we get analogously to the D-case a correction AI:<br />
AI= arc sin(S/F) (5.4)<br />
which in degrees of arc is<br />
AI = (180hr)(S/F) = 57.296(S/F)<br />
<strong>and</strong> in seconds of arc is<br />
AI=206265(S/F)<br />
For example, in a field F = 52000 nT this means, in seconds of arc, the following<br />
corrections L1 V to the readings of the vertical circle:<br />
L1 V /I = - 4.0 . S when the telescope looks towards the north <strong>and</strong> the sensor is<br />
on top of the telescope (1)<br />
L1 V /I = + 4.0 . S when the telescope looks towards the south <strong>and</strong> the sensor is<br />
under the telescope ( .1)<br />
L1 V /I =<br />
+ 4.0 . S when the telescope looks towards the north <strong>and</strong> the sensor is<br />
under the telescope (.1)
- 96-<br />
..1 V" = - 4.0 . S when the telescope looks towards the south <strong>and</strong> the sensor is<br />
on top of the telescope ('I)<br />
If the theodolite is a modem one with a gravity-controlled vertical circle, the circle<br />
readings are correct automatically. If an older theodolite is in use, levelling has to be<br />
carried out carefully <strong>and</strong> has to be checked after each turning of the theodolite or its<br />
telescope, so that an accuracy of at least 2" is achieved.<br />
An example of a series of observations of inclination I, which is a continuation of<br />
the D-observation, is shown in Table 5.2.<br />
The A-value calculated from the uncorrected A-values <strong>for</strong> the D-measurement is<br />
Al = 157°51'51". This is the fixed position of the theodolite during two observations,<br />
<strong>and</strong> the opposite, A2 = 337°51'51", is the position <strong>for</strong> the other two observations. As<br />
in the D-observation, four observations are taken <strong>for</strong> each of the four readings of the<br />
vertical scale V. Here Nt is an observation with the telescope looking towards the<br />
north <strong>and</strong> the fluxgate sensor on top of the telescope; this observation is marked VI'<br />
etc.<br />
From these observations the mean value of the inclination is<br />
For the calculation of I, it can be shown that two observations are sufficient:<br />
I = (VI - V 4 )/2 + 90° or 1= (V2 - V 3 )12 + 90°. By calculating both separately we<br />
get in<strong>for</strong>mation on the precision of the measurement.<br />
For the final absolute values we would ideally measure the total intensity F at the<br />
same time <strong>and</strong> at the same place as the D- <strong>and</strong> I-<strong>measurements</strong>. This is naturally not<br />
possible. There<strong>for</strong>e, F should be measured simultaneously with the measurement of<br />
I but at another place, which is far enough from the absolute pillar not to disturb the<br />
measurement of I, or it should be measured totally separately. The difference in F<br />
between the main pillar <strong>and</strong> the remote side <strong>for</strong> the proton sensor is easy to determine<br />
by measuring F alternately at both places many times so that the difference is known<br />
to 0.1 nT. The difference can be considered constant except during a big <strong>magnetic</strong><br />
disturbance, which is not a suitable time <strong>for</strong> absolute <strong>measurements</strong> anyway. The<br />
difference has to be checked, however, say once a year. Naturally, F can be measured<br />
be<strong>for</strong>e or after the I-measurement at the absolute pillar, or at the remote site. Then the<br />
result of the F-measurement has to be reduced to the time of the I-observation by<br />
using values from the <strong>observatory</strong> recording system.<br />
Let us assume that F at the F-pillar is 5.1 nT lower than at the main pillar where D<br />
<strong>and</strong> I were measured, which is the case at Nurmijfuvi. A typical observation of F is<br />
shown in Table 5.3.
ZI = Fr sin 1= 49267.94 nT<br />
- 98 -<br />
The correction to be added to the base-line of Z is thus<br />
& = ZI - Ziree = 49267.94 - 49267.59 = +0.3 nT.<br />
where Ziree is the mean value of the recorded Z values during the I-measurement.<br />
The corrections <strong>for</strong> the base-lines of X <strong>and</strong> Y have to be calculated from HI <strong>and</strong> the<br />
absolute D. The recorded H value during the I-measurement was<br />
HJc= 15009.16 nT<br />
which shows that the H-values recorded have to be corrected by an amount<br />
L1H = H I - HIe = 15009.72 - 15009.16 = +0.56 nT.<br />
The H-value during the D observation is<br />
2 2 112 2 2 112<br />
HDree= (XDree+ YDree) = (14956.66 + 1314.44) = 15014.31 nT,<br />
<strong>and</strong> the absolute H-value during the D-measurement, HD, is<br />
HD = 15014.31 + 0.56 = 15014.87 nT,<br />
<strong>and</strong><br />
XD = HD . cos D = 15014.87 cos(5°01'29") = 14957.17 nT<br />
YD = HD . sin D = 15014.87 sin(5°01'29") = 1315.09 nT<br />
The corrections to be added to the X <strong>and</strong> Y base-lines are then<br />
fiX =XD - XDree = 14957.l7 - 14956.66 = +0.5 nT<br />
L1Y = Y D - YDree = 1315.09 - 1314.44 = +0.6 nT<br />
where XDree <strong>and</strong> YDree are the means of the recorded X <strong>and</strong> Y values during the<br />
D-observation.<br />
5.2 Calculation of misalignment of the fluxgate sensor<br />
Instead of computing only the absolute D- <strong>and</strong> I-values from the observations<br />
described above, we recommend that one should also calculate the angles between<br />
the direction of the fluxgate sensor <strong>and</strong> the optical axis of the theodolite, <strong>and</strong> the<br />
offset of the fluxgate electronics.
- 99-<br />
To determine of the misalignment, the observations of A in the four different<br />
positions of the D-observation are needed, corrected <strong>for</strong> the change of declination.<br />
There<strong>for</strong>e, the mean recorded D-values <strong>for</strong> each position are listed in Table 5.1 on the<br />
right side of the series of D-observations. The A-values can be corrected relative to an<br />
arbitrary D-value, as recommended <strong>and</strong> used in the Danish practice by Kring<br />
Lauridsen. It is convenient to select a numerically simple value; in the example, we<br />
have chosen 5°01'00", which means that the corrections to be added to the observed<br />
A-values are 5°01'00" minus the corresponding recorded value. The so corrected<br />
A-values are marked A' in the table of D-observations.<br />
From the D-observation, using the A'-values we can calculate D':<br />
(5.5)<br />
instead of 5°01'00", which shows that the recorded values of D are by 8" too small<br />
(we obtained the same result in <strong>for</strong>mula (5.3».<br />
The <strong>for</strong>mulas <strong>for</strong> I) (the angle between the direction of the fluxgate sensor <strong>and</strong> the<br />
optical axis of the theodolite in the horizontal plane when the telescope is horizontal),<br />
€ (the corresponding vertical angle), <strong>and</strong> So (the offset of fluxgate electronics) are<br />
presented below (Kring Lauridsen, 1985). The results using data from our examples<br />
are also given.<br />
1)=(A3 +A4 -A) -A2)/4<br />
= (67°47'09" + 247°56'47" - 247°52'32" - 67°49'20")/4 = 31" (5.6)<br />
€=(A) -A2 -A3 +A4 ±360V4tanl<br />
= (247°52'32" - 67°49'20" - 67°47'09" + 247°56'47" -3600)/4tan73° = 59" (5.7)<br />
SO=(A) -A2 +A3 -A4)·H/4·57.296=-7.1nT (5.8)<br />
€ <strong>and</strong> So can also be found from the I-observations. The values used below are the<br />
observations of the vertical scale (V) corrected using the values of S. Ie <strong>and</strong> He are<br />
calculated means from the recorded Xrec> Y ree <strong>and</strong> Zree. Let the corrected VNt be VI<br />
<strong>and</strong> the corresponding Ie-value be Icl, etc. Then<br />
€= 180° - (VI + V2 + V3 + V4 )/4 + (leI + le2 - le3 - le4)/4<br />
or<br />
= 180° - (73°02'53" + 253°01'51" + 286°55'06" + 106°56'07")/4<br />
+ (73°03'18" + 73°03'14" -73°03'29" -73°03'38")/4 = 52" ,
- 100-<br />
£O= 180° - (VI + V2 + V3 + V4 )/4 - [(Hel + He2 - He3 - He4) sin I<br />
- (Zreel + Zree2 - Zree3 - Zree4) cos 1]/( 4F /57.296)<br />
= 180° - (73°02'53" + 253°01'51" + 286°55'06" + 106°56'07")/4<br />
- [(15011.1 + 15011.9 -15007.9 -15005.7) sin 73°<br />
- (49267.9 + 49267.8 - 49267.1- 49267.6) cos 73°]1(4.51500/57.296) = 52"<br />
(5.9)<br />
So = - [(VI - V2 - V3 + V4 )/4 + 90°] . F /57.296<br />
or<br />
+ [(lei - le2 + le3 - le4)/4] . F/57.296,<br />
- (Zreel - Zree2 + Zree3 - Zree4) cos 1]/4 = - 8.0 nT<br />
The values are close to the values obtained from the D-measurement.<br />
(5.10)<br />
For rapid <strong>measurements</strong>, when high accuracy is not needed, 8, £ <strong>and</strong> So can be used<br />
to correct a single reading of the horizontal or vertical circle:<br />
D = A I - 90° - (B - A z ) + 8 - 57.296 . Sol H - £ tan I<br />
1= VI + £O+ 57.296· SoiF<br />
In (5.11) <strong>and</strong> (5.12) 8 <strong>and</strong> £ are expressed in degrees.<br />
(5.11 )<br />
(5.12)<br />
Some remarks regarding the examples given above: the results show that the<br />
fluxgate sensor is well aligned with the optical axis of the theodolite; the offset is<br />
rather large <strong>and</strong> should be adjusted, but it does not cause an error in the results<br />
because of the measuring method. In our example the offset seems to have slightly<br />
changed from the D-series to the I-series. The change during the measurement series<br />
is a source of error. There<strong>for</strong>e, the calculation of So is recommended <strong>for</strong> all series.<br />
There may be ambiguities of ±180· or its multiples, but such errors are easy to<br />
detect. If the theodolite reads a value between 90° <strong>and</strong> 270° when the telescope points<br />
to <strong>magnetic</strong> north, no correction of ±1800 will be needed. The times given <strong>for</strong> the<br />
observations of the azimuth marks are not needed <strong>for</strong> the calculations, but they may<br />
be useful in some cases when the observation has taken a long time or there is a doubt<br />
concerning the stability of the theodolite during the measurement.<br />
It is instructive to go through the different steps of the calculations presented<br />
above, but <strong>for</strong> routine <strong>observatory</strong> use it is best to make a one-page <strong>for</strong>m <strong>for</strong> the<br />
measurement <strong>and</strong> a program <strong>for</strong> a PC or <strong>for</strong> a pocket calculator. Two calculations of
- 101 -<br />
D are presented above; the fIrst nne is <strong>for</strong> explaining the procedure step by step, the<br />
second one is <strong>for</strong> routine calculations. We recommend the use of the second method,<br />
in which the measured A-values are reduced using <strong>observatory</strong> data to an arbitrary,<br />
convenient D-value. Using these values the misalignment <strong>and</strong> the offset can be<br />
calculated. These quantities should be calculated in connection with every absolute<br />
measurement, because they provide a good check of the fiuxgate theodolite. Kring<br />
Lauridsen (1985) trans<strong>for</strong>ms the A-values to minutes of arc (seconds could also be<br />
used), but we have used degrees in the calculations, which is convenient when using<br />
pocket calculators. In <strong>for</strong>mula (5.8) <strong>for</strong> So one radian has to be expressed in the same<br />
unit which has been used in the calculations (57.296°, 3438' or 206265").<br />
Four observations in each position, as in our example, may not be necessary,<br />
depending on the stability of the readings of the magnetometer. At high latitudes,<br />
where the fIeld is seldom really quiet, the number of observations clearly adds to<br />
accuracy. If the field is quiet, two observations in each position are enough.<br />
If the absolute <strong>measurements</strong> are analysed using a computer having direct access to<br />
the recorded data, one only needs to feed in the results of the absolute observations<br />
<strong>and</strong> their times. But to let the computer correct the base-lines automatically is not a<br />
good idea, because an error in the absolute measurement may damage the recording<br />
badly. The observer has to decide whether the base-line corrections are sensible, or<br />
whether a new absolute measurement may be needed.<br />
It is recommended that a <strong>for</strong>m is made <strong>for</strong> recording the observations. The <strong>for</strong>m has<br />
to have places <strong>for</strong> at least the following in<strong>for</strong>mation, in addition to the results of the<br />
measurement itself: location (which pillar etc.), date <strong>and</strong> time are compUlsory; the<br />
instrument used (the theodolite <strong>and</strong> fiuxgate unit); <strong>and</strong> the name of the observer,<br />
which may be important to know at a later date. It is good to have some room <strong>for</strong><br />
notes: all in<strong>for</strong>mation on unusual incidents or disturbances during the measurement<br />
may be valuable afterwards. One easy way to keep the observations in good order is<br />
to draw the <strong>for</strong>ms on pages of a booklet or notebook.<br />
The absolute observation described above is a normal, typical one. It is, however,<br />
possible to measure both D <strong>and</strong> I simultaneously in the same series of observations<br />
(Kerridge, 1985, or Forbes, 1987). In this case the telescope is tilted from its<br />
horizontal position by an angle {3, which is about half of 90° - I. The observations are<br />
then taken in exact tilted positions 90° + {3, 270° + {3, 90° - {3, <strong>and</strong> 270° - {3, each<br />
with the sensor up <strong>and</strong> down.<br />
If the <strong>magnetic</strong> azimuth of the sensor (<strong>and</strong> telescope) is a, the reading of the<br />
vertical circle is {3, <strong>and</strong> the position is found where the output S is zero, we have<br />
S = F( cos I cosa cos{3 - sinI sinfJ) = 0 (5.13)<br />
I = arc tan(cosaltanfJ)
- 102-<br />
If both of the two possible null positions have been found, then the mean of the two<br />
respective readings of the horizontal circle will give the reading corresponding to<br />
<strong>magnetic</strong> north.<br />
This type of measurement may be h<strong>and</strong>y in rapid field work, where two<br />
observations are usually enough <strong>for</strong> the accuracy needed. For <strong>observatory</strong> use we<br />
recommend the nonnal series described above.<br />
5.3 Use of the proton precession magnetometer to measure total intensity F<br />
The proton magnetometer is a push-button device, usually robust <strong>and</strong><br />
weatherproof. As described in Chapter 4, older instruments may give the results in<br />
counts; modern instnunents produce the results in nanoteslas. The most modern<br />
proton magnetometers are microprocessor controlled <strong>and</strong> use statistical methods to<br />
improve the accuracy of the measurement. They also may present an estimate of the<br />
accuracy of the result.<br />
In <strong>observatory</strong> absolute <strong>measurements</strong>, one should not trust an instrument without<br />
verification. The correct functioning of the proton magnetometer should be checked<br />
by measuring a known artificial frequency close to the frequency at which the<br />
protons would precess in a typical field (2 kHz), as described in Chapter 8. In some<br />
older type magnetometers, checks have to be carried out be<strong>for</strong>e <strong>and</strong> after the absolute<br />
measurement <strong>and</strong> the possible corrections have to be interpolated to the measured<br />
data. Usually the crystals <strong>and</strong> the electronics of the most modern proton<br />
magnetometers are so stable that it is sufficient to carry out checks once a year.<br />
The measurement itself is easy, <strong>and</strong> a series like that presented in the previous<br />
section is a typical one. It is important to know F exactly at the same place where D<br />
<strong>and</strong> I are measured, which means at the level of the horizontal axis of the theodolite<br />
over the middle point of the theodolite. The nonnal routine is to measure F at another<br />
pillar. The difference between the main pillar <strong>and</strong> the F-pillar has to be measured a<br />
sufficient number of times so that it is known with an accuracy of 0.1 nT. The<br />
constancy of the difference has to be checked from time to time, say once a year,<br />
because it may change.<br />
5.4 Use of the proton precession magnetometer <strong>for</strong> measurement<br />
of the <strong>magnetic</strong> field components<br />
By installing the proton magnetometer sensor inside a coil, it is possible to measure<br />
the magnitude of the vertical <strong>and</strong> horizontal components Z <strong>and</strong> H of the <strong>magnetic</strong><br />
field vector. The coil must produce a sufficiently homogeneous field in the volume of<br />
the sensor bottle, otherwise the proton precession signal decays too rapidly <strong>for</strong> an<br />
accurate measurement. There are many types of coils which produce a large enough
- 103-<br />
homogeneous field (see Section 8.7). The best known <strong>and</strong> simplest is the Helmholtz<br />
coil, which has two circular windings on the same axis, separated r cm from each<br />
other, where r is the radius of the winding. A Helmholtz coil with r = 40 cm produces<br />
a large enough homogeneous field <strong>for</strong> proton vector <strong>measurements</strong>. Much smaller,<br />
but more complicated, coils producing large enough homogeneous fields have been<br />
described in the literature, e.g. Shtamberger (1972). However, leading the current<br />
into the coil, so that it does not cause a field inside, is often difficult in small coils.<br />
The Helmholtz coil can also be made square. In this case, the separation of the<br />
windings is 0.554 times the length of the side.<br />
Figure 5.2. Proton vector magnetometer at Belsk <strong>observatory</strong>. The coil is of the<br />
Braunbeck-type (see Section 8.7).
- 104-<br />
It is possible to use fixed coils <strong>for</strong> the measurement of H <strong>and</strong> Z, as will be shown<br />
later, but usually the proton vector magnetometer has a coil which can be turned<br />
around the vertical axis. An old non-<strong>magnetic</strong> theodolite can be used as the turntable<br />
(see Fig. 5.2), but also other constructions are in use, allowing the coil to be turned<br />
180° back <strong>and</strong> <strong>for</strong>th. A level has to be attached to the coil. It has to be sensitive<br />
enough to measure tilts of two seconds or smaller. (The sensitivity, or the scale value<br />
of the level, is easy to detennine by putting the level on top of the telescope of a<br />
theodolite <strong>and</strong> reading the vertical scale together with the readings of the level). A<br />
stable current source is needed <strong>for</strong> the coil.<br />
There are two methods widely used to measure the components of the <strong>magnetic</strong><br />
field using proton vector magnetometers. In Nelson s method, one of the field<br />
components is compensated by applying an equal <strong>and</strong> opposite coil field <strong>and</strong> the<br />
remaining component is then measured with the proton magnetometer. Nelson's<br />
method is good <strong>for</strong> middle latitudes <strong>for</strong> both H <strong>and</strong> Z but cannot be used <strong>for</strong> H at high<br />
latitudes <strong>and</strong> <strong>for</strong> Z at low latitudes because after compensating one of the components<br />
the remaining field is too small to be measured with a proton magnetometer (the<br />
practical limit is 15,000-20,000 nT). In Serson s method, a bias field is added to the<br />
weaker component, which makes it usable everywhere. Both methods have the<br />
advantage that the current in the coil does not need to be known. The only<br />
requirement in Serson's method is that the current remains the same <strong>for</strong> the short time<br />
needed <strong>for</strong> a pair of observations with the coil in opposite positions <strong>and</strong> the current in<br />
opposite directions. In Nelson's method the stability of the current is not very critical.<br />
One part in 1,000 is enough which is easy to obtain with common laboratory<br />
instruments. In Serson's method the current has to be stable with an accuracy of one<br />
part in 100,000 during the short time of two <strong>measurements</strong> with opposite currents.<br />
The principle of Nelson's method is depicted in Figure 5.3. It is important to level<br />
the coil system so that the vertical axis around which the coil is turned is vertical with<br />
an accuracy of at least 2". The north-south position is detennined by turning the coil<br />
approximately to the east-west direction <strong>and</strong> by producing a bias field in the coil. The<br />
value F+ (current in positive direction in the bias coil) has to be the same as the value<br />
F_, which is the observed F after reversing the current (same bias field but in the<br />
opposite direction). If F+ is not the same as F_, the coil direction has to be adjusted<br />
until this is true. After that, the coil is turned 90°. The <strong>magnetic</strong> axis is now in<br />
north-south direction with high accuracy (actually this is not very critical, 10' is good<br />
enough). After this, by applying a field opposite to H, so that the values of F with <strong>and</strong><br />
without the opposing H-field are the same, <strong>and</strong> then using half of the current, H is<br />
compensated (see Figure 5.3). Z is then the reading of the proton magnetometer,<br />
provided the <strong>magnetic</strong> axis of the coil is exactly horizontal. This is practically never<br />
the case. There<strong>for</strong>e, another similar measurement has to be made after turning the coil<br />
180° <strong>and</strong> reversing the current. The final Z is the mean of the two observations, which<br />
can be called ZN <strong>and</strong> Zs. The possible change of levelling can be corrected <strong>for</strong> in
- 106-<br />
(5.15)<br />
where the Hr-values are the H data from the digital recording <strong>for</strong> the times of the<br />
<strong>measurements</strong> of HN, HE, Hs <strong>and</strong> Hw.<br />
With Serson's proton vector method, any component of the <strong>magnetic</strong> field can be<br />
measured even when the component is too small « 15,000-20,000 nT) to be<br />
measured accurately with the proton magnetometer utilizing Nelson's method. The<br />
principle of the method is shown in Figure 5.4.<br />
F<br />
/<br />
/<br />
/<br />
/<br />
/ /<br />
---<br />
/ /<br />
/<br />
--- ---<br />
/<br />
Fo --- --- /<br />
--- --- --- /<br />
F+<br />
Figure 5.4. Serson s method <strong>for</strong> the measurement of components T <strong>and</strong> S of the<br />
<strong>magnetic</strong> field using a proton vector magnetometer. The coil field A is chosen to be<br />
roughly 2xT.<br />
In Serson's method, an additional field A is added to the component to be<br />
measured. The coil axis is aligned with the component. Three <strong>measurements</strong> are<br />
necessary: a reading Fo with no current in the coil; a reading F+ ,i.e., the magnitude<br />
of the sum of vectors Fo <strong>and</strong> A (A is an additional field), <strong>and</strong> a reading F_ , i.e., the<br />
magnitude of the sum of vectors F <strong>and</strong> -A. In practice, two additional<br />
<strong>measurements</strong> are needed with the coil turned 180°, as will be shown later.<br />
Referring to Figure 5.4 we get
- 108-<br />
(5.17)<br />
where Ho <strong>and</strong> Zo are the recorded values of H<strong>and</strong> Z at the time of the Fo observation,<br />
etc. If the current i used in the production of the bias field A has changed from the F +<br />
observations to the F _ observations, this correction has also to be taken into account,<br />
so that both F + <strong>and</strong> F _ are corrected <strong>for</strong> the effect of the deviation of the i-value from<br />
its mean value (irn). If the coil constant is {3 [nT/rnA], we get instead of (5.17)<br />
where irn = (i+ + L)I2.<br />
(5.18)<br />
The <strong>for</strong>mulas above are given <strong>for</strong> the measurement of H (the numerical example<br />
below is <strong>for</strong> H). The other components, Z <strong>and</strong> D, are measured in the same way,<br />
applying the general <strong>for</strong>mula (5.16), but the measurement of D is not strictly<br />
absolute.<br />
At both high <strong>and</strong> low latitudes it is recommended to measure the stronger<br />
component using Nelson's method <strong>and</strong> to determine the weaker component by<br />
Serson's method.<br />
The vector proton magnetometer methods <strong>for</strong> determining the absolute<br />
components H <strong>and</strong> Z are not as easy as the use of the fluxgate theodolite, but they<br />
give, if correctly per<strong>for</strong>med, high absolute accuracy (in long series of observations<br />
the error is less than 0.5 nT), <strong>and</strong> are an independent method, <strong>and</strong> so are highly<br />
recommended.<br />
An example of a real measurement with a proton vector magnetometer at high<br />
latitude is given in Table 5.4. The corrections due to changes of the field <strong>and</strong> changes<br />
of current during the measurement have been included in the calculations.<br />
Here No is the observation without current in the bias coil, N+ the observation<br />
with the coil pointing towards <strong>magnetic</strong> north <strong>and</strong> with current in the bias coil in<br />
such a direction that the measured F is larger, N_ is the observation with opposite<br />
current in the bias coil, S+ <strong>and</strong> S_ are the corresponding observations after turning<br />
the coil 180 D , <strong>and</strong> i is the current in the coil in rnA. The level readings are in seconds<br />
of arc ("). Taking the zero-current observation as a reference <strong>and</strong> correcting the<br />
other observations to that time, we obtain, applying (5.18) <strong>and</strong> knowing that <strong>for</strong><br />
the Nurmijarvi coil {3= 175.587 nT/rnA <strong>and</strong> approximate values are H = 15100 nT,<br />
Z = 49100 nT, <strong>and</strong> A = 26500 nT
2 2<br />
Hs= [(Fs) - (FsJ ]/4A<br />
- 110-<br />
= [(64431.6 - 1.69)2 - (50417.3 + 1.54)2]/(4.26578.63) = 15135.79 nT .<br />
The final value of His<br />
H= (HN+Hs)/2 = 15134.8 nT<br />
Z can be calculated from Fo <strong>and</strong> H:<br />
...:l 2 112<br />
Z= (1'0 - H ) =49103.5 nT<br />
Here the change of level has not been taken into account in the calculation. The<br />
level has only been checked in each position to make sure that it has not changed<br />
during the turning of the coil by more than one second (from the mean value), which<br />
is good-enough <strong>for</strong> an accuracy of 0.2 nT. The effect of tilting can be taken into<br />
account by subtracting (N - S)Z/2 from the final H value. Here N<strong>and</strong> S are the<br />
readings of the level in N<strong>and</strong> S positions expressed in radians. It is convenient,<br />
however, to keep the level the same in both N <strong>and</strong> S positions by adjusting after<br />
turning, when necessary.<br />
Five series of observations like the series described above are usually enough <strong>for</strong><br />
adequate final accuracy of the base-line values. The new Z base-line can be obtained<br />
directly. In the series described above, the recorded Z was 49103.5 nT, which was<br />
also the result of the absolute measurement. The difference of 2.8 nT in H shows that<br />
X or Y, or both, need to be corrected, but <strong>for</strong> that a knowledge of the absolute D-value<br />
is also needed, as described in connection with the observations using the fluxgate<br />
theodolite.<br />
Kring Lauridsen (1980) has successfully used rather large fixed square Helmholtz<br />
coils <strong>for</strong> the determination of H<strong>and</strong> Z at Rude Skov <strong>and</strong> Brorfelde <strong>magnetic</strong><br />
observatories in Denmark. As he points out, <strong>and</strong> as described above, the elimination<br />
of a possible misalignment of the coil axis is usually achieved by turning the coil <strong>and</strong><br />
making <strong>measurements</strong> in two opposite directions of the coil. This dem<strong>and</strong>s an<br />
installation which occupies the pillar, making it unavailable <strong>for</strong> other purposes. For<br />
instance, the important check of pillar differences becomes troublesome.<br />
The use of a stationary coil has some advantages. There is no need <strong>for</strong> a turntable,<br />
the coil can be large, whereby a homogeneous field can be achieved with less<br />
perfection of the coil geometry, the proton sensor can easily be removed from the<br />
pillar so that other <strong>measurements</strong> (<strong>for</strong> instance of D <strong>and</strong> l) can be per<strong>for</strong>med at the<br />
same pillar which then becomes the main pillar of the <strong>observatory</strong>. In addition, a<br />
spacious coil af<strong>for</strong>ds a good working place <strong>for</strong> all sorts of calibrations. For<br />
descriptions of coils <strong>and</strong> their fields, see Chapter 8.
- 111 -<br />
In order to solve problems with possible misalignments of the coil, classical or<br />
fluxgate instruments can be used to detect the influence of the coil field on the<br />
component to be measured. For instance, if Z is annulled in Nelson's method <strong>for</strong><br />
measurement of H, a variometer is put up at the place of the sensor <strong>and</strong> the influence<br />
of the field in the coil on H is measured by means of the variometer. This value can<br />
then be used as a correction to the H-value measured by the proton magnetometer, or<br />
the levelling of the coil can be adjusted until no measurable misalignment remains.<br />
If a classical variometer is used it should be well damped <strong>and</strong> it is recommended to<br />
submerge the magnet <strong>and</strong> mirror system in silicone oil. The variometer housing can<br />
simply be an acrylic tube with a window arrangement. The reading facility can be a<br />
lamp <strong>and</strong> scale, or a telescope <strong>and</strong> scale. In old observatories there probably are old<br />
variometers available <strong>for</strong> the purpose described here.<br />
If H is too small to be measured by the proton magnetometer, it is possible to use a<br />
similar procedure <strong>for</strong> Z. In this case, an old Z-variometer or BMZ-instrument must be<br />
used in determining the effect of misalignment.<br />
5.5 Use of the declinometer to measure declination D<br />
All older <strong>magnetic</strong> observatories have classical declinometers, which usually<br />
consist of a non-<strong>magnetic</strong> theodolite <strong>and</strong> on top of it a box in which a suspended<br />
magnet is free to move.<br />
The classical determination of D has roughly the same accuracy as the<br />
measurement with a fluxgate theodolite, but requires more skill <strong>and</strong> care. Because the<br />
classical D-measurement is an independent method to the flux gate method, it is<br />
highly recommended to per<strong>for</strong>m a measurement from time to time as a check.<br />
Let the circle reading of the theodolite be A when observing the magnet (see Fig.<br />
5.5). This is the theodolite reading of the <strong>magnetic</strong> meridian. The corresponding<br />
reading to the azimuth mark with known azimuth A z (geographical direction) is B,<br />
<strong>and</strong> the <strong>magnetic</strong> declination is given by<br />
(5.19)<br />
Taking into account the effect of torsion of the suspending fibre, the final <strong>for</strong>mula<br />
<strong>for</strong> declination is:<br />
D =A[+ y(A[- All) - (B -A z )<br />
Y = a[l(all- a[)<br />
(5.20)<br />
(5.21)<br />
where A[ is the circle reading (actually mean of a number of readings Aup <strong>and</strong> Adown)<br />
<strong>for</strong> the stronger magnet, All is the corresponding reading <strong>for</strong> the weaker magnet, <strong>and</strong>
B<br />
- 112 -<br />
Figure 5.5. The principle of the measurement of <strong>magnetic</strong> declination D. A is the<br />
circle reading in the direction of the magnet, N is the direction to geographic north,<br />
<strong>and</strong> B is the circle reading to the azimuth mark, whose azimuth A z is known.<br />
B is the circle reading of the azimuth mark whose azimuth is A z , yis the torsion ratio.<br />
The torsion ratio y <strong>and</strong> its determination <strong>for</strong> a pair of magnets is explained in<br />
Chapter 4.<br />
The <strong>magnetic</strong> field almost always changes during the measurement. The changes<br />
have to be taken into account as corrections. There<strong>for</strong>e, it is best to take all the<br />
readings A at full minutes (or half-minutes) so that it is easy to find the corresponding<br />
values from the recorded digital data. In practice, this means that the value of All has<br />
to be corrected by the change of declination from the time of observation of A J to the<br />
time of observation of AI/. so that if the declination has increased, the change of D has<br />
to be subtracted fromAI/. The <strong>for</strong>mula above then gives the absolute declination D <strong>for</strong><br />
the time of the observation of A J (actually <strong>for</strong> the mean time of all observations AI). If<br />
D calculated from the recorded digital data is not the same as the measured absolute<br />
D, then the base-line value of the digital recording has to be corrected.<br />
The D-measurement is very sensitive to possible small amounts of <strong>magnetic</strong><br />
material in the theodolite. There<strong>for</strong>e, it is good to make the observations in all<br />
possible positions of the theodolite by turning the base by 120 0 <strong>and</strong>, if the magnets<br />
have mirrors at both ends, as is usual, to make the observations from both north <strong>and</strong><br />
south. The final value is then the mean of all observations. Even the mean value may<br />
be erroneous if the results from different positions differ much, say by more than I'.<br />
N<br />
A
- 114 -<br />
charges may be accumulated at the surfaces deflecting the magnets or the torsion<br />
weight. In this case, cleaning the surfaces with antistatic liquid is recommended.<br />
Such a liquid is used in making gramophone records antistatic.<br />
One common source of error is the window of the box through which one looks at<br />
the mirror. The window is very often slightly prismatic. There<strong>for</strong>e, the observation of<br />
the azimuth mark has to be made through the same window. The other window on the<br />
other side of the box has to be open when observing the azimuth mark. Alternatively,<br />
the window has to be checked by observing the azimuth mark with <strong>and</strong> without the<br />
window until one is convinced that it really is plane-parallel.<br />
Taking into account all the precautions discussed above it is possible to make a<br />
very good absolute determination of D using classical instruments. The final<br />
accuracy is usually 0.2' or better.<br />
In Table 5.5 we give an example of a D-measurement. The symbols used are the<br />
same as above.<br />
The left side of the table contains the readings of the observation, <strong>and</strong> the right side<br />
presents the simultaneous <strong>observatory</strong> readings. Here the recorded components were<br />
X <strong>and</strong> Y. If H<strong>and</strong> D had been recorded, the calculation would have been even more<br />
straight<strong>for</strong>ward.<br />
Here the circle readings <strong>for</strong> the azimuth mark are marked B, <strong>and</strong> the readings <strong>for</strong><br />
the stronger magnet are AI. S means the observation from the south, <strong>and</strong> N that from<br />
the north (there are mirrors at both ends of the magnet). The notations "up" or<br />
"down" show which position the magnet is in when turning 180° around its <strong>magnetic</strong><br />
axis (there is a mark on the magnet pointing up or down). The values of X ree <strong>and</strong> Y ree<br />
recorded simultaneously with the observations are also shown, as well as the<br />
declination D calculated from the recorded values during the series made with the<br />
stronger <strong>and</strong> the weaker magnet. We see that the declination has increased 7" from<br />
the series made with the stronger magnet to the series made with the weaker magnet,<br />
which means that 7" has to be subtracted from All. From experiments made with the<br />
magnets the torsion ratio yis known to be 0.70 (see <strong>for</strong>mula 5.21), <strong>and</strong> the direction<br />
to the azimuth mark, A z ' is, at Nurrnijarvi, -2°25.1', so we can calculate the<br />
declination by applying <strong>for</strong>mula (5.20):<br />
D = A/+ y(A/-AJJ) - (B - Az)<br />
= 264°10.59' + 0.70(264°10.59 - (264°11.28' -7"» - (257°15.85' + 2°25.1')<br />
= 4°29.2'<br />
This is the measured absolute D. The recorded value, D ree , <strong>for</strong> the same time (the<br />
time of the series with the stronger magnet) was 4°28'48" = 4°28.8', which is 0.4'<br />
lower than the true value. This means that the base-lines of X <strong>and</strong>/or Y have to be
- 115 -<br />
corrected. To be able to make the corrections to the X <strong>and</strong> Y base- lines we need to<br />
know the absolute value of the horizontal intensity H <strong>for</strong> the time of the<br />
D-observation. Naturally, if D is one of the components recorded, the correction is<br />
applied directly to the Dbase-line.<br />
5.6 Use of the QHM to measure horizontal intensity H<br />
The quartz horizontal magnetometer (QHM) is an excellent instrument <strong>for</strong> the<br />
measurement of horizontal intensity H. It is still in wide use at many observatories. It<br />
is not an absolute instrument, but keeps its constants so well, with an accuracy better<br />
than 1 nT/year, that it can be used to check the H base-lines of recording instruments<br />
if the constants are detennined regularly (say every 1 to 3 years). The QHM has also<br />
been used <strong>for</strong> declination <strong>measurements</strong>, but it is not good enough <strong>for</strong> <strong>observatory</strong><br />
practice. Like many other geo<strong>magnetic</strong> instruments of the first half of this century,<br />
the QHM is an invention of D. La Cour (Kring Lauridsen, 1977).<br />
The principle of a QHM-measurement is very simple (see also Chapter 4): the fIrst<br />
step is to unclamp the instrument in roughly the north-position (the telescope looking<br />
northward) <strong>and</strong> to turn it until the reflection of the scale or cross of the telescope<br />
coincides with itself. Let us call the reading of the theodolite circle in this position Ao.<br />
The next step is to turn the theodolite clockwise (+ direction) 360 0 = +2n , or any<br />
multiple of n , <strong>and</strong> some more until the reflection of the scale or cross of the telescope<br />
coincides with itself again. The number of half-turns has to be chosen so that the<br />
magnet turns at least 45 0 from its zero-position. Let us call the reading of the<br />
theodolite circle in the plus-position A+. We now know that the quartz fibre has been<br />
twisted exactly 2n in the plus-direction (or some other multiple of n, but 2n is the<br />
normal value <strong>and</strong> we shall use that in this example). The next step is to tum the<br />
theodolite in the corresponding minus-position where the circle reading is A_. We<br />
obtain the value of the horizontal intensity H from the <strong>for</strong>mula (see Chapter 4)<br />
H = C/ (l - klt)(1 + kifcoscp) sincp (5.22)<br />
where C, kl <strong>and</strong> k2 are the main constant (always given <strong>for</strong> torsion angle 2n), the<br />
temperature <strong>and</strong> induction constants, respectively, determined at a st<strong>and</strong>ard <strong>observatory</strong>,<br />
<strong>and</strong> if is an approximate value of H. cp is (Q+ + Q_)/2, where Q+ = (A+ - Ao)<br />
<strong>and</strong> Q_ = (Ao - A_). If (Q+ - Q_) is large (> 1 0'), then the denominator has an additional<br />
term:<br />
where a is determined from<br />
(5 .23 )<br />
(5.24)
- 116-<br />
If the torsion angle 2n does not give a suitable
- 117-<br />
same during both half-series, which makes the observation easier. In this kind of<br />
series it is very important to always use the same schedule. An exactly similar series<br />
has to be used when determining the main constant C at a st<strong>and</strong>ard <strong>observatory</strong>. Also,<br />
the temperature should be roughly the same, because the elastic after-effect of the<br />
quartz fibre, the elastic creep, depends on temperature.<br />
Position<br />
A z mark<br />
0<br />
+2n<br />
+2n<br />
+2n<br />
+2n<br />
+2n<br />
Mean.<br />
-2n<br />
-2n<br />
-2n<br />
-2n<br />
-2n<br />
Mean<br />
Az mark<br />
Table 5.6<br />
An example of a QHM measurement.<br />
Place: Nurmijarvi, Main pillar; Date: November 14, 1983<br />
QHM: 219, Theodolite: Askania 580144, Observer: M. Kivinen<br />
C: 9026.5 nT, kl = 0.000408 1°C, "-l = 115.10- 10 InT<br />
UT t [0C] A<br />
Xrec [nT] Yrec [nT]<br />
D<br />
[h m s] [ 0 ' II] [0 cn,IC,,]<br />
257°16'54"<br />
094100 854542 15116.8 nT 1195.7 nT 4 31 21<br />
094300 17.2 1223542 15118.4 1192.6<br />
4400 17.3 3530 15119.2 1194.1<br />
4500 17.4 3530 15119.2 1194.9<br />
4600 17.4 3512 15120.0 1195.3<br />
4700 17.4 3500 15120.8 1195.3<br />
1223523 15119.52 1194.44 4 31 52<br />
094900 17.5 485612 15120.8 1193.3<br />
5000 17.5 5612 15120.8 1192.2<br />
5100 17.6 5618 15121.9 1192.2<br />
5200 17.6 5606 15121.9 1194.9<br />
5300 17.7 5606 15121.6 1194.9<br />
17.46 485611 15121.40 1193.50 4 31 37<br />
257°16'54"<br />
The st<strong>and</strong>ard QHM-series where the QHM is turned more often is not critically<br />
dependent on the schedule of the observation.<br />
If the QHM is well adjusted, which is normally the case, <strong>for</strong>mula (5.22) gives a<br />
sufficiently accurate result <strong>for</strong> H. Below we calculate H first applying (5.22), <strong>and</strong><br />
later using the complete <strong>for</strong>mula (5.23).<br />
From the recorded data we see that the declination D has decreased 15" = 0.25'
- 118 -<br />
from the +2n series to the -2n series. There<strong>for</strong>e, the angle A obtained in the -2n<br />
series is by 0.25' too small. Applying this correction we get <strong>for</strong>
N<br />
\<br />
\<br />
\<br />
\<br />
\<br />
\<br />
\<br />
\<br />
\<br />
- 119-<br />
z<br />
\<br />
\<br />
\<br />
\<br />
\<br />
\<br />
\<br />
\<br />
\<br />
\ \<br />
Figure 5.6. Celestial spherical triangle from which the azimuth A z of the Sun is<br />
determined. Z is the Zenith, Z = zenith distance of the Sun, 8 = the declination of the<br />
Sun, t = meridian angle or hour angle of the Sun, 90° - 8 = distance (angle) of the<br />
Sun from the pole P, 90° - qJ = colatitude of the place of observation, N shows the<br />
north <strong>and</strong> S the south in the local horizontal plane. T is the location of the Sun.<br />
sinz cosA z = - cosqJ sin8 + sinqJ cos8 cos t, (5.25)<br />
sinz sinAz = cos8 sint,<br />
<strong>and</strong> by dividing the lower by the upper expression:<br />
A z = arc tan [sint/(sinqJ cos t - cosqJ tan8)] (5.26)<br />
which is the <strong>for</strong>mula <strong>for</strong> the calculation of the azimuth Az of the Sun. The Greenwich<br />
hour angle OHA <strong>and</strong> the declination of the Sun, 8, can be found in nautical or<br />
astronomical almanacs. Simple computer programs are available <strong>for</strong> their calculation<br />
as well. t is simply GHA + longitude (positive to the east).<br />
For the calculation we need the Julian day (JD) of the observation. The Julian<br />
s
- 120-<br />
period starts on the first of January year 4713 BC at noon Universal Time (UT or<br />
Greenwich Mean Time), <strong>and</strong> can be obtained from the <strong>for</strong>mula<br />
10 = int(365.25F) + int(30.600l(G + 1)) + D - int(F/100)<br />
+ int(F /4(0) + 1720996.5 (5.27)<br />
where F = year - 1 <strong>and</strong> G = month + 12 if month < 3, otherwise F = year <strong>and</strong> G =<br />
month, <strong>and</strong> D = day in both cases. (To know how to calculate the Julian day may be<br />
useful also in some other connections, as the Julian day is commonly used in<br />
astronomical calculations.) In astronomical calculations a time unit (1) is introduced,<br />
giving the time in fractions of centuries starting from some even number of hundreds<br />
of years. In the <strong>for</strong>mulas below the reference time <strong>for</strong> Tis 00 UT on January 1, year<br />
1900 (corresponding to Julian day 2415020), giving <strong>for</strong> T:<br />
T = (10 + UT - 2415020)/36525 (5.28)<br />
where UT has to be given in fraction of day (three digits are enough).<br />
The calculations below are based on an algorithm by G. G. Bennett (1980). Note<br />
that when programming the <strong>for</strong>mulas below <strong>for</strong> a computer, double precision has to<br />
be used. Pocket calculators often use a sufficient number of decimals. Nine will be<br />
enough.<br />
The orbital elements needed in the calculation of the right ascension (a) <strong>and</strong> the<br />
declination /5 of the Sun are<br />
M = 358.475 + 35999.050 T - 360 int[(358.475 + 35999.051)/360]<br />
V = 63 + 22518 T - 360 int[(63 + 22518 1)/360]<br />
Q = 332 + 33718 T - 360 int[(332 + 337181)/360]<br />
J = 222 + 32964 T - 360 int[(222 + 32964 1)/360]<br />
.Q = 101 + 1934 T - 360 int[(10 1 + 19341)/360]<br />
(5.29)<br />
Most pocket calculators can deal with angles over 360 0 <strong>and</strong> then the latter parts in<br />
the above equations beginning with -360 etc. are not needed. The constituents in the<br />
Apparent Longitude of the Sun are then:<br />
The Mean Longitude:<br />
L1 = 279.69019 + 36000.76892 T<br />
- 360 int[(279.690l9 + 36000.768921)/360] (5.30)<br />
The Equation of Center:
- 121 -<br />
Lz = (1.91945 - 0.00479 I) sinM + 0.02 sin2M + 0.00029 sin3M (5.31)<br />
The Lunar Perturbation:<br />
L3 = 0.00179 cos(261 + 445267 I) (5.32)<br />
The Perturbation Due to Venus:<br />
L4 = 0.00134 cos(90 + V) + 0.00154 cos(90 + 2V) + 0.00069 cos(258 + 2V - M)<br />
+ 0.00043 cos(78 + 3V - M) + 0.00028 cos(51 + 3V - 2M) (5.33)<br />
The Perturbation Due to Mars:<br />
LS = 0.00057 cos(90 + Q) + 0.00049 cos(306 + Q - M)<br />
The Perturbation Due to Jupiter:<br />
L6 = 0.00200 cos(91 + 1) + 0.00076 cos(270 + 2J) + o.ooon cos(175 + J - M)<br />
+ 0.00045 cos(293 + 2J - M)<br />
The Effect of Nutation in Longitude:<br />
u, = 0.00479 cos(90 - Q) + 0.00035 cos(295 + 2M)<br />
The apparent longitude of the Sun, L, is<br />
L = L) + Lz + L3 + L4 + Ls + 4 + U,<br />
L = L - 360 int(L/360)<br />
The obliquity of the ecliptic, e, is<br />
e = 23.45229 - 0.01301 T + 0.00256 cosQ<br />
The right ascension a <strong>and</strong> the declination 0 are<br />
a= arc tan(sinL COse/cosL)<br />
0= arc sine sinL sine)<br />
The Greenwich Hour Angle (GHA) is then<br />
GHA = UT + 99.6913 + 36000.76892 T + 0.917 U, - a<br />
GHA = GHA - 360 int(GHA/360)<br />
(5.34)<br />
(5.35)<br />
(5.36)<br />
(5.37)<br />
(5.38)<br />
(5.39)<br />
(5.40)<br />
(5.41)<br />
The GHA obtained may differ by 180 0 from the correct value, which should be 00 0<br />
<strong>for</strong> north <strong>and</strong> 180 0 <strong>for</strong> south.
- 122 -<br />
The local (east longitude = A) hour angle (LHA) is<br />
t= GHA + A<br />
arid the azimuth of the Sun (A z ) is finally calculated using <strong>for</strong>mula (5.26).<br />
(5,42)<br />
As an example of calculation of the direction to azimuth mark we show, in Table<br />
5.7, a real measurement. For the GHA the <strong>for</strong>mulas given above are used.<br />
TableS.7<br />
An example of calculation of the direction to an azimuth mark.<br />
Place: Kumlinge, lat. (ep) 6(/15' J2"N, long. (A) 2rf46'48"E.<br />
Date: September 21, 1961.<br />
Theodolite: Askania.<br />
Az-mark 1: Middle of the second floor window in the house close to N.<br />
Az-mark 2: Right-h<strong>and</strong> comer of the chimney of the house in E.<br />
UT Theodolite reading<br />
[h m s] [ ° ''']<br />
Az-mark 1 151 10 33<br />
Az-mark 2 242 56 39<br />
Sun right 12 58 27.0 187 20 15<br />
Sun left 125846.1 186 50 24<br />
Sun left 12 59 44.0 187 05 09<br />
Sun right 13 00 27.9 187 51 54<br />
Sun right 13 00 59.4 187 59 48<br />
Sun left 13 01 22.9 187 30 36<br />
Sun left 13 01 49.6 187 37 24<br />
Sun right 13 02 20.5 188 20 33<br />
Sun right 13 02 48.9 188 28 00<br />
Sun left 13 03 15.1 187 59 57<br />
Mean value 13 01 00.1 187 42 24<br />
Az-mark 1 151 10 33<br />
Az-mark 2 242 56 39<br />
The calculation of GHA by applying the procedure presented above is<br />
GHA = 16°58'25", <strong>and</strong> t = GHA + A= 37°45'13"<br />
0= 0°40'34"
- 123 -<br />
Applying (5.26) we finally get <strong>for</strong> the azimuth of the Sun<br />
A z = arc tan [sintl(sintp cost - costp tanO)] = 41 °58'27"<br />
The azimuths Azm of the marks are then<br />
where A <strong>and</strong> ASun are theodolite readings to the mark <strong>and</strong> Sun, respectively.<br />
Az-mark 1: 151°10'33" + (41 °58'27" - 187°42'24") = 5°26'36"<br />
Az-mark 2: 242°56'39" + (41 °58'27" - 187°42'24") = 97°12'42"<br />
In the example above, a theodolite having only a normal ocular was used. There are<br />
special oculars available <strong>for</strong> the Zeiss theodolites which point at the middle of the<br />
Sun, making the measurement easier <strong>and</strong> more accurate.<br />
Sometimes it is interesting to know also the elevation h of the Sun. From the stellar<br />
triangle (Figure 5.6) we get<br />
h = arc sin [sino sintp + coso costp cost] (5.43)<br />
which gives the elevation angle without taking into account refraction; the latter lifts<br />
objects at the horizon by 0.5° (about the diameter of the Sun). An object seen at the<br />
horizon, e.g., the upper limb of the Sun, is in reality 37' below the horizon. The effect<br />
of refraction, r, is calculated by applying the recursive <strong>for</strong>mula<br />
r= [(60.305 sin z')/3600]l[O.68 cos z' + 0.32((cos z,)2 + 0.00726)112] (5.44)<br />
z' = z - r<br />
so many times that the absolute difference between two subsequent r-values is<br />
smaller than say 0.00001°. The first value <strong>for</strong> z' = z = 90 - h, which is the zenith<br />
distance without taking into account refraction.<br />
Some remarks about observations of the Sun are to be made: the telescope must<br />
have a dark glass eyepiece made <strong>for</strong> Sun observations. Looking at the Sun without a<br />
special eyepiece may cause permanent damage to the eye. There is a special prism<br />
available <strong>for</strong> Wild theodolites, called a Wild-Roelofs solar prism. It allows direct<br />
pointing to the center of the Sun, improving accuracy <strong>and</strong> simplifying the<br />
calculations. The theodolite has to be carefully levelled. At least one, <strong>and</strong> preferably<br />
several azimuth marks in different directions have to be observed be<strong>for</strong>e <strong>and</strong> after the<br />
Sun observation. Several observations of the Sun have to be made reading the time<br />
<strong>and</strong> the circle when, alternately, the left <strong>and</strong> the right side of the limb, or, if the<br />
Wild-Roelofs prism is available, the middle point of the limb passes the vertical line<br />
of the diaphragm of the telescope. The correction required to the time of the clock<br />
used has to be known with an accuracy of 0.2 s. The time signals from most of the
- 124-<br />
nonnal radio stations are much more accurate than needed <strong>for</strong> this purpose. Special<br />
radio stations giving continuous time signals transmit in most parts of the world.<br />
Accurate time is available everywhere today from the GPS satellites (GPS = Global<br />
Positioning System) (see Section 6.4). The geographic coordinates needed in the<br />
calculations of the azimuth of the Sun or stars may be obtained from the position<br />
given by GPS (an accuracy of 50 m is enough in practice).<br />
The time given in radio time signals is the so-called UTC-time (Universal Time<br />
Coordinated). This is not exactly the same as the time which is fixed to the rotation<br />
of the Earth, which is the time needed in the calculation of the azimuth. The UTC or<br />
UT, as it is called in the text above, is kept to be close to the rotational time by adding<br />
one second at the beginning of the year, if needed. This means that the UT time <strong>and</strong><br />
the rotational time may differ from each other by up to one second which is too much<br />
<strong>for</strong> the required accuracy. There<strong>for</strong>e, a correction has to be obtained <strong>and</strong> applied. In<br />
most countries the place receiving the lists of corrections from the Bureau<br />
International de L'Heure in Paris is the local Geodetic Institute. (One second in time<br />
may mean 15" in azimuth angle.)<br />
The elevation of the Sun has to be lower than 45° above the horizon to obtain<br />
accurate observations of the azimuth. Most systematic errors can be eliminated by<br />
taking sunshots in the morning <strong>and</strong> the afternoon with the Sun at equal elevations.<br />
A Fortran program written by Andrew Lewis, <strong>and</strong> advice concerning Sun<br />
observations, is to be found in the <strong>Guide</strong> <strong>for</strong> Magnetic Repeat Station Surveys<br />
(Newitt et at., 1996).<br />
For accurate detennination of the direction to the azimuth mark at an <strong>observatory</strong>,<br />
observation of North Star (in the northern hemisphere) is the best method. The star<br />
measurement is more accurate than the observation of the Sun partly because the star<br />
has no angular diameter, the ephemerides are exact, <strong>and</strong> the requirement on the<br />
accuracy of time is less when the star is not too far from the pole. Many stars can be<br />
used. Their ephemerides (right ascensions <strong>and</strong> declinations) are given in<br />
astronomical almanacs.
6. RECORDING OF MAGNETIC VARIATIONS<br />
Magnetic variometers are magnetometers which continuously measure <strong>and</strong> record<br />
the <strong>magnetic</strong> field variations. Three components of the field are usually recorded. For<br />
special purposes, like functioning as a base station <strong>for</strong> prospecting, one component,<br />
usually F in this case, might be enough. In <strong>observatory</strong> use three components are<br />
recorded, <strong>and</strong> often F with proton magnetometer as an additional, absolute<br />
verification. The most commonly used variometers at modem <strong>magnetic</strong><br />
observatories are three-component fluxgate magnetometers combined with<br />
microprocessor-based digital data coUection.<br />
The data are samples of the magnitude of the field components variations. The<br />
primary samples are usually taken at very short intervals, several times per second.<br />
Applying digital filtering techniques, one-minute or more dense values are produced<br />
<strong>and</strong> stored. If <strong>magnetic</strong> pulsations have to be recorded using the same original data,<br />
much more dense component values have to be stored <strong>and</strong> a higher resolution has to<br />
be used. As a rule, the samples represent only the varying part of the field, having a<br />
range of ±4000 nT or so, <strong>and</strong> a base value has to be added to the recorded one <strong>for</strong><br />
getting the final value of the component. The base values are determined by making<br />
absolute <strong>measurements</strong> as presented in Chapter 5.<br />
For a more complete description of recording instruments, including SQUID<br />
magnetometers <strong>and</strong> recording systems using optical pumping <strong>and</strong> three-component<br />
proton magnetometers, see <strong>for</strong> example Forbes (1987) or Stuart (1972). Here we<br />
concentrate on instruments which we consider the best at a modem <strong>magnetic</strong><br />
<strong>observatory</strong>. For the physics of the magnetometers used as variometers, see<br />
Chapter 4.<br />
6.1 Installation of the station<br />
Be<strong>for</strong>e installing the instruments at a <strong>magnetic</strong> <strong>observatory</strong> one should be sure of<br />
the foUowing:<br />
o<br />
o<br />
The place is suitable <strong>for</strong> the <strong>observatory</strong> (see Chapter 3).<br />
The shelter is suitable <strong>for</strong> the sensor of the variometer (Chapter 3).<br />
The pillar is stable. If one cannot be sure of that, a suspended sensor should be<br />
selected (see Section 6.3 below).<br />
The geographic direction (north-south or east-west line) is drawn on the pillar<br />
to facilitate the installation of the sensor. The geographic direction can be<br />
determined as explained in Chapter 3.
- 127 -<br />
against it has not been incorpoprated. Opto-isolation is a good protection <strong>for</strong> the<br />
signal cable, which, however, should preferably be of optical fiber itself. The<br />
proposal <strong>for</strong> wiring at a <strong>magnetic</strong> <strong>observatory</strong> described in Chapter 3 is an example<br />
of how to shield the system against lightning pulses propagating along the main<br />
power line <strong>and</strong> pulses caused by induction in the wiring at the <strong>observatory</strong>. As<br />
suggested in Chapter 3, the batteries should preferably be in an isolated <strong>and</strong><br />
ventilated place within the electronics hut if they are of the type producing hydrogen<br />
or corroding gases when charged.<br />
Be<strong>for</strong>e installing the variometer, the magnetism of the preamplifier or the<br />
electronics box of the magnetometer has to be measured. This can be done simply by<br />
bringing it close to the absolute instrument in the absolute house or by using the<br />
variometer itself. Preferably the preamplifier (or the whole electronics) should be<br />
installed in the variometer room far enough from the sensors to give an effect of less<br />
than 2 nT, <strong>and</strong> the unit should be fixed so that it cannot be moved. The unit should not<br />
produce any varying fields at the sensor due to any varying DC-currents in the<br />
electronics. This also has to be checked be<strong>for</strong>e installation. The magnetism of the<br />
sensor has to be measured, if there is a likely effect on another variometer in the same<br />
variometer room. As stated in Chapter 3, we recommend two variometers <strong>for</strong><br />
<strong>magnetic</strong> observatories, <strong>for</strong> backup.<br />
The sensor of the variometer usually has two perpendicular levels. If not, separate<br />
levels have to be used. Their readings corresponding to the correct vertical position<br />
of the Z-sensor should be kept in mind from the calibration at the <strong>magnetic</strong> st<strong>and</strong>ard<br />
<strong>observatory</strong>, or they should be adjusted there to show the middle position. This makes<br />
it easy to install the sensor at its final place, so that the vertical intensity is measured<br />
correctly. If the sensor head can be turned around its vertical axis, the verticality can<br />
be checked by adjusting the sensor until the Z-sensor shows the same value in all<br />
positions. If the components H<strong>and</strong> D will be recorded, then the installation is easy:<br />
just turn the sensor until the D-component shows zero value (in undisturbed field).<br />
But after a few years, due to the secular variation, the orientation will no longer be in<br />
the H-D direction, <strong>and</strong> the sensor will have to be turned or one will have to introduce<br />
small corrections to the components, as described in Chapter 7.<br />
Very often the sensor is oriented geographically, as recommended also by <strong>IAGA</strong>,<br />
especially <strong>for</strong> observatories at high latitudes. This has the advantage that no turning<br />
of the sensor is needed because of the secular variation <strong>and</strong> also no corrections are<br />
needed in the calculations during big <strong>magnetic</strong> disturbances, common especially at<br />
high latitudes. It is also important to notice that if the declination at the .site is not<br />
representative <strong>for</strong> the area (not close to the declination shown in <strong>magnetic</strong> charts),<br />
then the recorded variations of H <strong>and</strong> D are not representative <strong>for</strong> a larger area<br />
(Eleman, 1966). For example, the observed secular variation of H<strong>and</strong> D can differ<br />
from the secular variation of the surroundings <strong>and</strong> not represent the sOUrce inside the<br />
Earth. Similarly, all variations of D <strong>and</strong> H, e.g., the daily variation, will be
- 129-<br />
difference between the F-pillar, where F is recorded with the proton magnetometer,<br />
<strong>and</strong> the variometer pillar. Large differences are presented in the example below, <strong>and</strong><br />
are not likely at <strong>magnetic</strong> observatories where the homogeneity of the field has been<br />
checked carefully, but even much smaller differences may be seen in modem<br />
<strong>measurements</strong> with 0.1 nT resolution.<br />
Let us assume that in nonnal field the F-difference between the pillars is zero, <strong>and</strong><br />
the different components at the pillars are<br />
Variometer pillar<br />
F = 50 000.0 nT<br />
X= 20100.0<br />
y= 2000.0<br />
Z = 45738.3<br />
If X grows by 1000 nT, we get<br />
at the variometer pillar<br />
F= 50410.3 nT<br />
F-pillar<br />
F = 50 000.0 nT<br />
X=20 000.0<br />
y= 2000.0<br />
Z = 45782.1<br />
at the F-pillar<br />
F = 50408.3 nT<br />
showing that there now is a difference of 2 nT between the pillars. In <strong>observatory</strong><br />
areas the difference of 100 nT in one component is Dot likely; <strong>and</strong> the field rarely<br />
changes by 1000 nT, but as our aim is an accuracy of a fraction of nT, even moderate<br />
changes of field components may be seen as changes in pillar differences.<br />
Our example shows that a) it is important to know the differences of the<br />
components between the pillars <strong>and</strong> not only the difference of the total intensity F, b)<br />
the difference of F between the pillars may change with time, <strong>and</strong> c) F is not<br />
necessarily a good verification of the other components if there is a difference in<br />
some of the components between the pillars, as in our example where both X <strong>and</strong> Z<br />
had rather large differences. Ten times smaller differences would affect modem<br />
accurate <strong>measurements</strong> where 0.1 nT is in use.<br />
6.2 Temperature effects<br />
The elements of the variometer have temperature coefficients. The manufacturers<br />
of the magnetometers have tried to make them as temperature stable as possible <strong>and</strong><br />
have often also equipped them with electronic temperature compensation. In fluxgate<br />
elements the most sensitive part is the compensating coil, which usually is wound on<br />
a frame made of quartz or some other material having a very small temperature<br />
coefficient. The usual temperature coefficients are about 1 nTfC, which shows that<br />
the temperature has to be measured at least close to the sensor <strong>and</strong> preferably also
10cm<br />
- 131 -<br />
Damping fan<br />
Figure 6.1. Suspended three-component fluxgate sensor of the Danish Meteorological<br />
Institute.<br />
The suspended sensor or correction of the tilt using the tiltrneter does not correct<br />
<strong>for</strong> any possible turning of the pillar. This naturally can also be recorded using, <strong>for</strong><br />
example, a light beam reflected from a mirror fixed to the pillar, but no commercially<br />
available systems exist as far as we know. The easiest check of the turning is to make<br />
frequent absolute <strong>measurements</strong>. In Section 3.2 we recommended that if there are<br />
two or more pillars in the variation room, they should be connected to each other<br />
under ground. This reduces the turning. If the whole block turns <strong>and</strong> there are two<br />
independent variometers, the turning will be seen as similar effects in both<br />
recordings.
- l33 -<br />
Often normal personal computers (PC), lap-top computers or corresponding<br />
microprocessors are used as recorders of <strong>magnetic</strong> data. As a rule, the clocks of the<br />
PC's are not accurate enough <strong>for</strong> this purpose. A drift of 1 s per day or more seems to<br />
be common. There<strong>for</strong>e, the time of the PC has to be corrected several times per day<br />
if the PC comm<strong>and</strong>s the data sampling <strong>and</strong> if the time of the PC is recorded. The<br />
programming of the correction of the PC-time is not trivial, because it has to be done<br />
at the same time as the PC collects the data. Using a data logger which has a<br />
satisfactory clock is there<strong>for</strong>e a more simple solution, but not as flexible as a PC, <strong>for</strong><br />
example in changing data collection rate.<br />
In <strong>magnetic</strong> recording it is advisable to use universal time (UTC, see Chapter 5).<br />
Time is available several times per day in most radio programs with sufficient<br />
accuracy but in impractical <strong>for</strong>m <strong>for</strong> use in modem automatic recording systems.<br />
Nowadays there are exact time signals available in coded <strong>for</strong>m from different<br />
sources. After decoding, the time is in normal digital fOnTI. We would like to mention<br />
GPS (Global Positioning System) which transmits the time continually with very<br />
high accuracy <strong>and</strong> which is easily available allover the globe. Commercial clocks<br />
based on GPS are available. All over Europe there is the DCF-system (transmitter in<br />
Germany). There are also clocks utilizing the Omega navigation system. The time of<br />
Omega is precise, but has a systematic error of several seconds due to leap seconds<br />
which have not been taken into account (see Chapter 5). Sophisticated clocks based<br />
on the systems mentioned above have st<strong>and</strong>ard RS 232 or NMEA outputs.<br />
Un<strong>for</strong>tunately, most of them are rather expensive.<br />
There are many manufacturers of GPS receivers. They are made primarily <strong>for</strong><br />
navigation. Most of them have a st<strong>and</strong>ard NMEA or RS 232 output which allows <strong>for</strong><br />
easy construction of a clock. In Figure 6.3 we give an example of the l)se of a<br />
st<strong>and</strong>ard GPS receiver as a self-made <strong>observatory</strong> clock. In our example the time<br />
signal from the GPS receiver is fed to a microprocessor. It is programmed to produce<br />
the time using a stable frequency from an auxiliary oscillator. The processor is<br />
programmed to compare the processor time with the exact time of the GPS, when<br />
available, <strong>and</strong> to correct the processor time. The PC used <strong>for</strong> data collection receives<br />
the correct time from the processor. It also receives the exact minute pulses which are<br />
used to make the correction of the PC-clock more accurate, because the time through<br />
the RS 232 may not be accurate enough. Programming the PC to correct its internal<br />
clock to the exact time when collecting data simultaneously from the channels of the<br />
magnetometer may not always be easy, depending on the computer.<br />
The clock presented in Figure 6.3 is actually a rather simple <strong>and</strong> accurate central<br />
clock which can be used <strong>for</strong> several purposes at the <strong>observatory</strong>. If its oscillators are<br />
accurate enough, the output frequency may be used <strong>for</strong> controlling <strong>and</strong> adjusting the<br />
proton magnetometer, <strong>for</strong> example.
- 135 -<br />
During recent years, several institutes have made their own digital loggers <strong>for</strong> the<br />
collection of geo<strong>magnetic</strong> data in digital <strong>for</strong>m. Some of these have even been made<br />
commercial. The rapid development in processors, personal computers (PC's),<br />
lap-top computers <strong>and</strong> hard discs <strong>and</strong> even optical discs have opened an enormous<br />
variety of possibilities to use commercially available, not too expensive equipment<br />
<strong>for</strong> the data collection. Suitable hardware is easy to obtain in most places, <strong>and</strong> the<br />
main problem lies in programming the processor or the computer. For programming<br />
it is best to use professional help, but so that the observer in charge works together<br />
with the programmer presenting the requirements <strong>for</strong> the program <strong>and</strong> becoming<br />
sufficiently familiar with the program that he or she can make changes to the program<br />
if needed later. What tasks the program has to per<strong>for</strong>m will be discussed also in<br />
Chapter 7.<br />
When applied to geo<strong>magnetic</strong> work, the commercial PC's have two problems. One<br />
is that most of them need power from normal mains, 110 or 240 V ac. As stressed<br />
several times, the <strong>magnetic</strong> recording should not have gaps, <strong>and</strong> the mains sometimes<br />
have interruptions. So <strong>for</strong> every type of recording we recommend the use of UPS<br />
(Uninterruptible Power Supply) or batteries. The laptop computers run on batteries<br />
<strong>and</strong> usually do not use as much power as the other PC's. There<strong>for</strong>e, they are more<br />
suitable <strong>for</strong> recordings at observatories in many cases. But the development in this<br />
field is rapid; <strong>for</strong> example, the CMOS solid state memories are getting bigger <strong>and</strong><br />
cheaper every year, so the power consumption probably will be a minor problem in<br />
the near future.<br />
The other common problem in commercial personal computers is their poor clock,<br />
which means that they do not keep time with the accuracy requested from<br />
<strong>observatory</strong> recordings, as stated in Section 6.4. There<strong>for</strong>e, it is very important to<br />
introduce an automatic correction to the time of the logger (PC or laptop computer)<br />
using time from an accurate clock.<br />
The original signals from variometers are usually in volts, which means that analog<br />
to digital (AID) conversion has to be made be<strong>for</strong>e the data can be treated <strong>and</strong> stored.<br />
To be able to record variations of the order of ±4000 nT with a resolution of 0.1 nT,<br />
which are realistic figures, that means the sign <strong>and</strong> 16 bits. Fast (many conversions<br />
per second), stable <strong>and</strong> reliable AID converters <strong>for</strong> even more bits are available, <strong>and</strong><br />
the prices of these are going down all the time, although the best ones are still rather<br />
expensive. But because the converters are fast enough, it is possible to use the same<br />
converter <strong>for</strong> all three components <strong>and</strong> also <strong>for</strong> the temperature, but we do not<br />
recommend it.<br />
The data h<strong>and</strong>ling <strong>and</strong> related problems will be discussed in Chapter 7,<br />
complementing this chapter.
6.6 Analog recording<br />
- 136-<br />
The classical, traditional method of recording the variations of three components of<br />
the Earth's <strong>magnetic</strong> field is photographic. The light from one or more lamps is<br />
reflected from the mirrors of magnetometers (one fixed mirror <strong>for</strong> the base-line <strong>and</strong><br />
one mirror fixed to the moving magnet) to photopaper which is wrapped on a drum.<br />
The drum rotates so that the light spot focussed on its surface moves 20 mm per hour<br />
in the direction of the time axis of the magnetogram. The classical photographic<br />
recording systems have been described in detail in Wienert's Notes ....<br />
The analog photographic recordings have been in use <strong>for</strong> more than hundred years<br />
<strong>and</strong> are still in wide use. They are reliable <strong>and</strong> practically no service is needed besides<br />
the change of the lamp once a year or so. If a flashing lamp is used, the lamps seem<br />
to last many years. Once in, say, five years some service is needed to the clock which<br />
drives the photopaper drum. The analog curve on the photopaper is produced by a<br />
light beam without any friction in the system, which is an advantage compared to the<br />
ink recorders. One shortcoming in the photographic recording is the disappearance of<br />
the curve during rapid changes of the field, or, if the rapid changes are made visible,<br />
the curve during quiet times is too thick. This shortcoming can be avoided by letting<br />
the lamp flash every ten seconds <strong>and</strong> not letting it be on all the time. Selecting a<br />
suitable current <strong>for</strong> the lamp will not make too thick a trace during quiet time <strong>and</strong> the<br />
points will still be visible during storm. By making the lamp stay on <strong>for</strong> a longer time<br />
every ten minutes <strong>and</strong> even longer at a full hour, the trace will have the time marks.<br />
For the ten-second flashes, the lamp may be on <strong>for</strong> one second.<br />
Two separate recording systems are recommended <strong>for</strong> <strong>magnetic</strong> observatories. The<br />
old photographic system may be kept as a supplementary one if funds <strong>and</strong> space<br />
permit. Monitoring the <strong>magnetic</strong> field in real time is highly recommended, because<br />
the observatories should be prepared to answer questions on the behavior of the<br />
<strong>magnetic</strong> field in almost real time. Visualizing digital data at the computer screen as<br />
graphs of the components of the <strong>magnetic</strong> field is naturally one good way to monitor<br />
the field. To keep a chart recorder running <strong>for</strong> the monitoring is also a simple <strong>and</strong><br />
economic way.<br />
6.7 Comparison of analog <strong>and</strong> digital recording systems<br />
The shortcomings of photographic recording systems are obvious compared to the<br />
digital systems, which have many possibilities <strong>for</strong> providing a supplementary analog<br />
monitoring of the field as well, as can be seen from the following table in which<br />
characteristics of photorecorders are compared with digital recorders.
- 137 -<br />
Photographic recording system Digital recording system<br />
o delay in visualizing the data 0 data may be monitored in real time<br />
o geometry makes the trace nonlinear 0 linear data<br />
o expensive <strong>and</strong> laborious photo paper 0 cheap memory media<br />
o limited dynamic range, two systems needed 0 large dynamic range<br />
o crosstalk between sensors in storms 0 no crosstalk<br />
o traces overlapping <strong>and</strong> may be mixed 0 no mixing of data possible<br />
o traces may disappear in rapid changes 0 no losses because of rapid changes.<br />
o difficult to put in machine readable <strong>for</strong>m 0 in machine readable <strong>for</strong>m<br />
o necessary to visit the variometer room 0 no need to visit the sensor room<br />
o laborious routines 0 easy <strong>and</strong> flexible routines<br />
o reliable, simple construction 0 failures rare but may be<br />
difficult to repair
7. DATA PROCESSING<br />
The processing of analog data is h<strong>and</strong>led in detail in Wienert's Notes ... <strong>and</strong> we shall<br />
not discuss it here.<br />
Most recording stations today produce raw data in digital <strong>for</strong>m. That makes the<br />
processing of the data easy in principle, only a prograrruning problem. But the whole<br />
system of data processing depends on the equipment in use. The <strong>for</strong>mats of data are<br />
different, although INTERMAGNET (see Chapter 10) is setting some st<strong>and</strong>ards, <strong>and</strong><br />
so are the World Data Centers. Program languages are quite different <strong>and</strong> change with<br />
time. In practice, the programs needed <strong>for</strong> data processing at a <strong>magnetic</strong> <strong>observatory</strong><br />
are rather large <strong>and</strong> not easy to produce. In addition to the data collection, the<br />
programs have to be able to display the recorded data on the monitor of the computer<br />
<strong>and</strong> treat the data in many different ways, as will be described in detail below.<br />
Here we shall not discuss prograrruning. We only stress the importance of<br />
obtaining with new instrumentation the programs needed, including the necessary<br />
training in their use. If the programs are not available, it is advisable to contact<br />
experienced people from some other <strong>observatory</strong> having similar instrumentation.<br />
There are two types of programs. There are programs in the data collecting unit<br />
controlling the sensors <strong>and</strong> data capture. Other programs do the data processing <strong>and</strong><br />
reduction, which may be per<strong>for</strong>med at the <strong>observatory</strong> or at the headquarters, which<br />
may be thous<strong>and</strong>s of kilometers away.<br />
The main tasks of the data processing programs are listed below. The division<br />
between tasks per<strong>for</strong>med at the data collection plat<strong>for</strong>m <strong>and</strong> somewhere else depends<br />
on local circumstances.<br />
Filtering the raw data<br />
Storing the filtered data<br />
Displaying the data<br />
Correcting the time (automatic or keyboard operation or both)<br />
Adjusting the base-line values (keyboard operation)<br />
o Adjusting the sensitivities (keyboard operation)<br />
o Adjusting temperature coefficients (keyboard operation)<br />
o Corrections <strong>for</strong> orientations of the sensors (keyboard operation)
o<br />
o<br />
o<br />
o<br />
o<br />
o<br />
- 139-<br />
Removal of artificial disturbances such as<br />
- calibration signals<br />
- spikes<br />
- clearly seen artificial disturbances<br />
Filling gaps using data from a second variometer<br />
Plotting the data<br />
Preparing tables <strong>for</strong> the yearbook<br />
Re<strong>for</strong>matting the data<br />
Calculation of K-indices<br />
As is obvious from the simple list given above, the requirements <strong>for</strong> the<br />
programming are rather heavy. In addition to the list above, there are some special<br />
requirements like alarm functions in case of failures of some parts of the system or<br />
discrepant data.<br />
7.1 Sampling rate<br />
There are different sampling rates to be discussed: the sampling of the raw data<br />
from the sensors <strong>and</strong> the time resolution of the final products which will be stored.<br />
The distribution of products to the World Data Centers (WOC) <strong>and</strong> to possible<br />
customers is another important consideration. The fonnat should be suitable <strong>for</strong> the<br />
distribution to the WOC's, <strong>and</strong>, as a rule, to users of the <strong>observatory</strong> data.<br />
The sampling rate of <strong>magnetic</strong> data to be stored in data archives is normally<br />
one-minute. Many users request, <strong>and</strong> several observatories store, ten-second or more<br />
rapidly sampled data. Technically, it is easy to sample much faster. When a signal is<br />
sampled, frequencies above the Nyqvist frequency (lI2Llt, where Llt is the sampling<br />
interval) contaminate those below this frequency; this phenomenon is caned aliasing.<br />
By sampling rapidly enough, the effect of aliasing can be made small because the<br />
power in the geo<strong>magnetic</strong> field spectrum decreases with increasing frequency. To<br />
derive longer-period averages, one-minute values, <strong>for</strong> example, from more rapidly<br />
sampled raw data, a digital filter is used. Probably the most commonly used is the<br />
Gaussian filter which is also recommended by INTERMAGNET. Below we describe<br />
the Gaussian filter as presented by A. W. Green, Jr. in the INTERMAGNET context.<br />
The Gaussian filter can be described by the Fourier trans<strong>for</strong>m pair fl.t) <strong>and</strong> F(w),<br />
where<br />
fl.t) = exp[-Ct/r)2/2] (7.1)
- 140-<br />
(7.2)<br />
Both functions have the shape of the Gaussian distribution. At zero frequency<br />
(ro= 0),<br />
F(O) = 'r<br />
<strong>and</strong> at the -3 dB cut-off point<br />
or<br />
from which an= 0.83255461.<br />
As an example we <strong>for</strong>m a filter operating on 5-second values to generate I-minute<br />
values. The filter is designed as a low-pass filter with its -3 dB point at a period of<br />
120 seconds:<br />
ro120 = 2TC/120 = 2TC 1120<br />
'r=0.83255461 . 12012TC= 15.90062182<br />
from which<br />
j(t) = exp[-(tI15.90062182)2/2]<br />
Assuming the t = 0 coefficient to be 1.0, <strong>and</strong> requiring the smallest coefficient to be<br />
1 % of that<br />
j(t) = 0.01 = exp(-4.605170)<br />
which, applying fomlUla (7.1), gives<br />
t = 3.03485420 . 15.90062182 = 48.2561s<br />
<strong>and</strong><br />
F(48.2561) = 0.01 . j(0)<br />
For t = 45 s we get<br />
j(45) = 0.01823029· j(0)<br />
which we consider to be small enough at the end points of our filter. We assumed that<br />
Lit = 5 s in our filter. This means that the filter will have 19 coefficients:
flO) = 1.0 i = 0<br />
f(5) = 0.95176190 i = 1<br />
f(10) = 0.82056552 i = 2<br />
f(15) = 0.64084772 i= 3<br />
f(20) = 0.45337029 i=4<br />
f(25) = 0.29054132 i = 5<br />
f(30) = 0.16866283 i = 6<br />
f(35) = 0.08869262 i = 7<br />
f(40) = 0.04224859 i = 8<br />
f(45) = 0.01823029 i= 9<br />
- 141-<br />
The coefficients have to be nonnalized, so that when convolved with the data time<br />
series, there will be unity scaling. In other words,<br />
i=9<br />
L C i = 1.0<br />
i=-9<br />
j(i) = f(-i)<br />
k = 7.949842162 leading to the final coefficients shown in Table 7.1.<br />
Table 7.1<br />
The Gaussian coefficients of a I9-pointfilter used by INTERMAGNET<strong>for</strong> the<br />
production of I-minute values from 5-second values (C j = C_ j )<br />
Co = 0.12578865 C 5 = 0.03654680<br />
C) = 0.11972085 C 6 = 0.02121585<br />
C 2 =0.10321785 C 7 = 0.01115655<br />
C 3 = 0.08061140 Cg = 0.00531440<br />
C 4 = 0.05702885 Cg = 0.00229315<br />
The output value has to be centered on the minute which means that the first<br />
coefficient Cg is applied to the 5-second values 45 seconds be<strong>for</strong>e <strong>and</strong> after the<br />
minute, <strong>and</strong> the coefficient Cg to the values 40 seconds be<strong>for</strong>e <strong>and</strong> after the minute,<br />
etc.<br />
To have a concrete example of the processing of digital data at a <strong>magnetic</strong><br />
<strong>observatory</strong> we present an outline of the procedure used in Canada (courtesy of the<br />
National Geomagnetism Program, Geological Survey of Canada) in Section 7.3.
- 142-<br />
The most rapid data rate currently recommended by <strong>IAGA</strong> to be stored is one<br />
minute. This is also the greatest sampling rate in data collected by the WDC's at the<br />
moment, although the new data storage devices with ever-growing capacity may<br />
change this situation. Many observatories are already storing more dense values.<br />
They are used <strong>for</strong> studies of <strong>magnetic</strong> disturbances <strong>and</strong> even pulsations.<br />
The hourly mean values in digital systems are calculated from the more dense<br />
values during the hour in question, <strong>and</strong> the annual mean values are the mean values<br />
of the hourly mean values. The annual <strong>and</strong> hourly mean values are, there<strong>for</strong>e,<br />
centered on the middle of the year or of the hour. This is not the case with one-minute<br />
values, which, according to the <strong>IAGA</strong> resolutions, are centered on fuji minutes. This<br />
has led to confusion in timing. There<strong>for</strong>e, it is very important to use the same timing<br />
system everywhere. The lAG A resolution from Canberra (1979) states:<br />
The first value within an hour is labeled od' Or<strong>and</strong> is the mean calculated from<br />
ad' O(f' 3rt to ad' or 3rt.<br />
It follows from this that the first hour of a day is labeled 00.<br />
The hourly mean value is the mean of the values taken at 01 m _60 m , or the<br />
correspondingly filtered value. The daily mean value is then the mean of the values<br />
of the hours 0-23, the monthly mean value is the mean of the daily mean values<br />
starting from day I, <strong>and</strong> the annual mean value is the mean of the daily mean values<br />
of the calendar year. Thus, as a consequence of the different logic, some values start<br />
from 00 <strong>and</strong> others from 01. The disparity is a consequence of the traditional thinking<br />
of time as a more step-like function instead of a continuous function, which it<br />
naturally is.<br />
The same labeling as that presented <strong>for</strong> one-minute values is valid <strong>for</strong> the more<br />
dense ones. The one-minute mean value <strong>for</strong> the minute XX calculated <strong>for</strong> example<br />
from ten-second values is the mean of the values of the times (XX-l)m30s_XXm30 s .<br />
The values centered at full ten seconds may be spot values, filtered values or mean<br />
values; preferably, however, filtered ones as explained be<strong>for</strong>e. Also the one-minute<br />
value produced from the more dense values should preferably be a filtered one.<br />
Note: In the INTERMAGNET system the first minute of an hour is labeled 00, <strong>and</strong><br />
so is the first hour of a day, but the first day of a year is still 01. We prefer the<br />
INTERMAGNET practice.<br />
7.2 Base-line values<br />
The base-line value is the value which has to be added to the data produced by the<br />
variometer to obtain the final absolute value of the <strong>magnetic</strong> field component.<br />
Usually, the variometer only measures variations within ±4000 nT, which is the range
- 143-<br />
of possible <strong>magnetic</strong> variations in most areas of the world. Modem magnetometers<br />
are so stable that the base-line values change very slowly. The same value with an<br />
accuracy of better than 0.25 nT is often valid <strong>for</strong> weeks. The base-line values are<br />
determined in absolute <strong>measurements</strong>, as described in Chapter 5. In the calculation of<br />
final <strong>magnetic</strong> data, final base-line values have to be used. These are usually obtained<br />
by smoothing the results of the absolute <strong>measurements</strong> over a time of several weeks.<br />
It is good practice to plot the result of each absolute measurement on graph-paper.<br />
The scale should be sensitive enough, say one or half mm per 0.1 nT. The smoothing<br />
can be done by h<strong>and</strong>. The points should be added to the graph immediately after each<br />
absolute measurement to see whether the result fits the general trend. If not, a new<br />
measurement should be made, <strong>and</strong> if that also shows a jump from the normal trend,<br />
there may be a real change of the base-line, which should be confirmed with new<br />
<strong>measurements</strong>.<br />
The smooth line through the points represents the final base-line values which<br />
should be fed into the computer <strong>for</strong> the calculation of the final <strong>magnetic</strong> data. The<br />
final data are then stored in the data archives. Spikes <strong>and</strong> other artificial effects have<br />
to be removed from the data be<strong>for</strong>e the final storage. Figure 7.1 shows a plot of<br />
base-line detenninations over a year <strong>and</strong> the adopted base-lines.<br />
7.3 Removing artificia1 disturbances<br />
In <strong>magnetic</strong> recordings there may be artificial disturbances. Spikes may be caused<br />
by lightning or other sudden changes of voltage in electronic circuits. They have to<br />
be removed from the final data. Calibration signals are necessary but should not be<br />
present in the final data. Gaps have to be filled, if possible. Someone may have been<br />
close to the variation room on a bicycle, causing a strange looking signal, which has<br />
to be removed, <strong>for</strong> example.<br />
Some of the artificial signals may be removed automatically in the data processing.<br />
For example, too rapid changes of the field can be removed by a program. But there<br />
is always a risk that a record of an unusual <strong>and</strong> interesting natural phenomenon will<br />
be lost. There<strong>for</strong>e, we recommend that the recording is displayed on the screen of a<br />
computer in large enough <strong>for</strong>m <strong>and</strong> the editing of the curve is carried out by an<br />
experienced geo<strong>magnetic</strong>ian. If possible, there should be the same curve from the<br />
secondary variometer visible at the same time very close to the other curve so that it<br />
is possible to compare the curves accurately. Programming the computer to do this<br />
<strong>and</strong> to make it possible to remove part of the curve <strong>and</strong> replace the gap, <strong>and</strong> other<br />
possible gaps, with pieces of the other curve (recorded digital data) is not a trivial<br />
task. Such programs exist at some observatories or organizations running <strong>magnetic</strong><br />
observatories, <strong>and</strong> we recommend consulting these, especially if they have a similar<br />
equipment.
nT<br />
18920<br />
18900<br />
18880<br />
nT<br />
1190<br />
1170<br />
1150<br />
nT<br />
45760<br />
45740<br />
45720<br />
SET 1 BASE VALUES<br />
18900<br />
I<br />
I<br />
I<br />
1166 I 11 7<br />
,<br />
I<br />
I<br />
I<br />
I ,<br />
JAN. FEB.<br />
I<br />
I<br />
I<br />
I<br />
I<br />
I<br />
I<br />
I<br />
I<br />
I<br />
.<br />
,<br />
I<br />
I ,<br />
I<br />
I ,<br />
I ,<br />
I<br />
18899<br />
MAR. APR.<br />
NORTH COMPONENT X BELSK 1994<br />
I<br />
I<br />
I I<br />
I<br />
I<br />
I<br />
I<br />
I 18898 I 18897<br />
I I<br />
I<br />
I<br />
--<br />
I<br />
I<br />
I<br />
I<br />
I<br />
I<br />
, I<br />
EAST COMPONENT Y<br />
1166 1167<br />
VERTICAL COMPONENT Z<br />
45739 45738<br />
MAY JUN. JUL. AUG. SEP . OCT. NOV . DEC.<br />
Figure 7.1. Yearly plot of the results of base-line <strong>measurements</strong> <strong>for</strong> the year 1994 at Belsk <strong>observatory</strong>. The fuUlines show the adopted<br />
final base-line values.
- 145-<br />
As an example of a data sampling system which removes at least the main part of<br />
artificial disturbances, we describe the system used at the Canadian observatories.<br />
The CANMOS <strong>observatory</strong> magnetometer system has a basic sampling rate<br />
of 8 Hz. The data are first checked to eliminate spikes:<br />
o If the difference between two consecutive values is greater than 100 nT, the later<br />
value is invalidated <strong>and</strong> the preceding value becomes the reference <strong>for</strong> the next<br />
value.<br />
For this next value, one uses a consecutive difference of 200 nT relative to the<br />
reference.<br />
If there is no success, the fifth value is taken as good <strong>and</strong> the sequential<br />
verification is restarted.<br />
The I-Hz data are produced from the 8-Hz data by simple averaging. In case of<br />
errors, a single invalid value is pennitted; it is replaced by the mean of the two<br />
neighboring values. For t, t+ I, t+2, ... etc. seconds<br />
where H denotes one of the recorded geo<strong>magnetic</strong> field elements.<br />
o<br />
o<br />
o<br />
o<br />
o<br />
The following corrections are made to the I-Hz data <strong>for</strong> each component:<br />
multiplication by the scale values<br />
subtraction of the zero-offset value<br />
(7.3)<br />
correction <strong>for</strong> temperature at the electronics (not in use, temperature is maintained<br />
constant)<br />
correction <strong>for</strong> temperature at the sensor (not in use, temperature is maintained<br />
constant)<br />
correction <strong>for</strong> errors in orthogonality<br />
correction <strong>for</strong> pillar differences<br />
correction <strong>for</strong> residual base-lines to reduce the variometer values to those at the<br />
absolute pillar at the time of installation.<br />
The 5-second data are produced from the I-Hz data by applying a 9-point Gaussian
- 147-<br />
In addition, it has been recommended that annual mean values of all days of the<br />
year, of international quiet days (five each month selected monthly by the<br />
International Service of Geo<strong>magnetic</strong> Indices, see Chapter 10), <strong>and</strong> international<br />
disturbed days (five each month) be supplied as early as possible, because they <strong>for</strong>m<br />
the basis <strong>for</strong> calculation of the secular variation. This in<strong>for</strong>mation is needed <strong>for</strong><br />
updating of <strong>magnetic</strong> charts, <strong>for</strong> example.<br />
Many observatories have stopped producing values of international quiet <strong>and</strong><br />
disturbed days because there are better ways of finding, <strong>for</strong> example, quiet periods<br />
from recorded data using computer methods.<br />
The data are sent to one of the World Data Centers (WDC), which distributes the<br />
data or the in<strong>for</strong>mation on the availability of the data to the other WDC's. The<br />
addresses of the WDC's are given in Chapter 10. Usually it is enough to send the data<br />
once a year, as soon after the end of the year as possible when the data are in final<br />
<strong>for</strong>m. For more dense data than one-minute values <strong>and</strong> in many cases also <strong>for</strong><br />
one-minute values it is enough to in<strong>for</strong>m the WDC that data are available <strong>and</strong> from<br />
where. During special international research campaigns, the data may be requested to<br />
be more dense <strong>and</strong> to be sent more often.<br />
Some recommendations exist as to the <strong>for</strong>mats of the data. The WDC's use<br />
st<strong>and</strong>ard <strong>for</strong>mats in their data exchange. Un<strong>for</strong>tunately, the precision they use is only<br />
1 nT. INTERMAGNET has clear <strong>for</strong>mats <strong>for</strong> data transmitted via satellites, via<br />
electronic mail, etc. (Trigg <strong>and</strong> Coles, 1994), which could be used also <strong>for</strong> other data.<br />
Computer specialists claim, however, that changing <strong>for</strong>mat is not a problem, <strong>and</strong><br />
because of the rapid progress in computers <strong>and</strong> data media the most convenient<br />
<strong>for</strong>mats may change. Naturally, a common <strong>for</strong>mat facilitates data exchange. Here we<br />
give some general features which should be taken into account.<br />
The resolution of the digital data in the data exchange has been under discussion<br />
without general agreement. Our feeling is that because the accuracy of absolute<br />
<strong>measurements</strong> using modern instruments is clearly better than 1 nT, <strong>and</strong> the recording<br />
instruments easily produce data with higher resolution than 1 nT, the dense values,<br />
like one-minute <strong>and</strong> more rapidly sampled data, should be stored with a<br />
resolution of 0.1 nT. There are scientific requirements <strong>for</strong> this. This means that six<br />
digits are the minimum <strong>for</strong> each component. For the storage of the hourly mean<br />
values, a resolution of 1 nT has been used by the WDC's, but also here 0.1 nT could<br />
be realistic <strong>for</strong> the best observatories, where the absolute accuracy already exceeds 1<br />
nT. So we advise a resolution oJO.1 nT to be used in the dataJormats in storing the<br />
data.<br />
Depending on the use of data, some people prefer to have the data organized so that<br />
all values of one component are stored first <strong>for</strong> some period which may be one hour,<br />
one day, one month or even one year, then the next component <strong>for</strong> the same time
- 148 -<br />
period, <strong>and</strong> finally the third one <strong>for</strong> the same period. Other users prefer having all<br />
three components following each other <strong>for</strong> each of the shortest times to be stored. The<br />
conversions are not a problem anymore.<br />
The next question· discussed in planning <strong>for</strong>mats has been: should whole<br />
component values (meaning 6 digits per component) be stored or should a constant<br />
part be subtracted first, which saves some room in the data storage media. The high<br />
density of modem data media, <strong>and</strong> the data compression programs available, have<br />
made the number of digits used less critical at least in hourly mean values. In<br />
one-minute <strong>and</strong> more dense values the subtraction of a constant part is often done in<br />
spite of the fact that these constants are shown to be a source of mistakes in data<br />
archives. Even the signs are found to be wrong sometimes. So one has to be very<br />
careful in programming the subtraction of a constant. Exceptionally large variations<br />
of the <strong>magnetic</strong> field have to be taken into account. Another method to save space has<br />
been to store the whole field value only infrequently, say once each hour, <strong>and</strong> to store<br />
the changes of the field from minute to minute (or from sample to sample in case of<br />
more dense sampling). With the capacity of modem mass storage media the space<br />
should not be a problem anymore. There<strong>for</strong>e, we recommend the storing offullfield<br />
values.<br />
The date <strong>and</strong> the time have to be stored preferably rather often, say once per hour<br />
or at least every day, to avoid problems if some values are missing or there is some<br />
confusing error in the data. Having the time stored often enough may save time <strong>and</strong><br />
trouble in using the data. Universal time (UT or UTC) should be always used (UTC=<br />
Universal Time Coordinated, which corresponds to the time at the zero-meridian or<br />
Greenwich meridian, very often given in the <strong>for</strong>m UT or GMT).<br />
And finally: in data exchange it is simplest <strong>and</strong> safest to use the ASCII <strong>for</strong>mat.<br />
7.5 Observatory yearbooks<br />
<strong>IAGA</strong> recommends the publication of recorded hourly mean values <strong>and</strong> of some<br />
combinations of these in the <strong>for</strong>m of yearbooks, in addition to the hourly values sent<br />
to the WDC's in digital <strong>for</strong>m. The yearbooks have a long tradition <strong>and</strong> it is good<br />
practice to produce them, because in preparing the yearbook the work from the<br />
previous year gets its final touch, including final base-lines, filling of possible gaps<br />
using supplementary recording, etc. The yearbooks contain in<strong>for</strong>mation which is<br />
usually not available from the data files.<br />
According to the convention, the yearbook should contain monthly tabulations of<br />
the hourly mean values of the three recorded elements of the <strong>magnetic</strong> field. Daily<br />
mean values should be given, <strong>and</strong> also monthly mean values <strong>for</strong> each hour. The<br />
<strong>magnetic</strong> element, the possible constant to be added to the hourly values, the unit
- 149-<br />
used, the time used (which should be UT) <strong>and</strong> also the name of the <strong>observatory</strong><br />
should appear in each tabulation.<br />
Today, with the data in digital <strong>for</strong>m available from several archives, even more<br />
important in<strong>for</strong>mation in the yearbook is a description of the <strong>observatory</strong> <strong>and</strong> of<br />
possible changes there during the year. The legend should include at least the<br />
geographical coordinates, altitude above sea level, <strong>and</strong> a short history of the<br />
<strong>observatory</strong>. A description of the <strong>measurements</strong> of the base-line values, the<br />
instruments used, <strong>and</strong> the results of the absolute <strong>measurements</strong> are important parts of<br />
the description. The instruments used <strong>for</strong> the production ofthe data are also described<br />
there, also the calibrations, sensitivities, temperature coefficients <strong>and</strong> the procedure<br />
of calculating the data including the filters used. The names of the persons in charge<br />
of different parts of the work should be mentioned as well.<br />
In addition to the monthly tabulations of the hourly values, the yearbooks usually<br />
contain some useful additional tabulations: the daily variation <strong>for</strong> each month <strong>and</strong> <strong>for</strong><br />
each Lloyd season: Winter (Nov., Dec., Jan., Feb.), Equinox (Mar., Apr., Sep., Oct.),<br />
<strong>and</strong> Summer.<br />
It is useful to include tabulations of annual mean values recorded at the <strong>observatory</strong><br />
since its beginning. Also, the values <strong>for</strong> all-day means, means based on the<br />
international quiet days, as well as those <strong>for</strong> the international disturbed days should<br />
be given. For the convenience of the users, the observatories usually print the annual<br />
mean values of all components, X, Y, Z, D, H, I <strong>and</strong> F, <strong>and</strong> not only the recorded ones.<br />
Many observatories scale or calculate the three-hourly activity indices K, which<br />
need only a couple of pages of the yearbook <strong>and</strong> it is convenient to find them in the<br />
same place with all the other current in<strong>for</strong>mation.<br />
Some observatories have started to produce the in<strong>for</strong>mation discussed above on a<br />
monthly basis, in addition to the yearbooks or instead of the yearbooks. In these<br />
monthly bulletins copies of magnetograms (nowadays mostly plots made using the<br />
digital data) are published. The monthly bulletins are as a rule made <strong>for</strong> prompt use.<br />
There<strong>for</strong>e, the base-line values may not be final, nor the quiet <strong>and</strong> disturbed days.<br />
With the modern stable recording instruments <strong>and</strong> excellent instruments <strong>for</strong> base-line<br />
control, the base-line values usually do not need adjustment afterwards by more than<br />
1 nT.<br />
It is recommended to make copies of the magneto grams available. Many<br />
observatories send microfiches or microfilms of the recordings to the WDC's on a<br />
yearly or monthly basis, if they do not publish them as described above. Some<br />
observatories do both. Users of digital <strong>magnetic</strong> data often like to see a copy of an<br />
analog recording <strong>for</strong> the same time, produced by a different system, because<br />
sometimes the digital data show mysterious errors, which are not easy to detect <strong>and</strong><br />
correct without an independent source.
- 150-<br />
Many observatories have dropped the publication of yearbooks, because the<br />
quantities routinely published in yearbooks are nowadays easy to calculate from<br />
computer files of the original <strong>observatory</strong> data. These data are usually available at the<br />
World Data Centers. For reasons given above, <strong>IAGA</strong>recommends the publication of<br />
the yearbooks as a not too expensive way to preserve the very important in<strong>for</strong>mation<br />
on the instrumentation, absolute <strong>measurements</strong>, treatment of the data, <strong>and</strong> persons<br />
working at the <strong>observatory</strong>. All in<strong>for</strong>mation on quality control of the data is of<br />
uppermost importance. Also, having the hourly mean values, etc., in a st<strong>and</strong>ard <strong>for</strong>m<br />
from year to year in similar yearbooks is useful, but not as important as be<strong>for</strong>e,<br />
because all combinations of data are easy to produce using the data archives <strong>and</strong><br />
computers. Instead, the yearbooks could present, in addition to the important legend<br />
in<strong>for</strong>mation mentioned above, combinations of the data <strong>and</strong> deductions from the<br />
data, e.g., in the <strong>for</strong>m of plots <strong>and</strong> figures.<br />
7.6 Activity indices <strong>and</strong> special events<br />
A measure of <strong>magnetic</strong> activity is needed <strong>for</strong> the studies of different phenomena<br />
observed in the ionosphere or in the near-Earth space. There<strong>for</strong>e, most <strong>magnetic</strong><br />
recording stations scale from their recordings indices which describe the state of the<br />
<strong>magnetic</strong> field. For different purposes, several indices of <strong>magnetic</strong> activity have been<br />
introduced (see, e.g., Mayaud, 1980). The most commonly produced <strong>and</strong> used is the<br />
K-index, which <strong>for</strong> each three-hour period gives a one-digit number to describe the<br />
<strong>magnetic</strong> activity. The index is quasi-logarithmic, as shown in Table 7.2, <strong>and</strong> it is<br />
based on the amplitudes of the <strong>magnetic</strong> field variation during the three-hour period.<br />
The K-index is scaled from the two horizontal components H<strong>and</strong> D or X <strong>and</strong> Y, <strong>and</strong><br />
the larger of the scaled amplitudes determines the index. The amplitude is measured<br />
by subtracting the minimum value from the maximum value measured from a smooth<br />
curve, which represents undisturbed conditions <strong>for</strong> that time (Figure 7.2).<br />
Table 7.2<br />
The st<strong>and</strong>ard scale of K-indices. The ranges are different <strong>for</strong> different observatories,<br />
so that statistically the K-values from all observatories are the same. The scale <strong>for</strong> an<br />
individual <strong>observatory</strong> is obtainedfrom the st<strong>and</strong>ard one by multiplying the values of<br />
the st<strong>and</strong>ard scale by afactor a, which can be receivedfrom the International Service<br />
of Geo<strong>magnetic</strong> Indices (see Chapter 10).<br />
K-value 0 2345678 9<br />
Range 0 5 10 20 40 70 120 200 300 500<<br />
Until recent years observatories have scaled K-indices from analog magneto grams<br />
by h<strong>and</strong>, which is the original recommendation by <strong>IAGA</strong>. Today most of the<br />
observatories record digital one-minute or more dense values <strong>and</strong> have started to
- 152-<br />
produce the K-indices using computers. There<strong>for</strong>e, <strong>IAGA</strong>, after elaborate testing of<br />
different computer methods <strong>for</strong> the K-production, at its assembly in Vienna 1991<br />
could only confIrm that the h<strong>and</strong>-scaling by experienced observers still is the best<br />
method, but that the best computer methods are better than the h<strong>and</strong>-scaling at most<br />
observatories today. We describe here two of the methods shown to give good results.<br />
The only difficulty in computer production of K-indices is the estimation of the<br />
so-called SR-curve (SR <strong>for</strong> Solar Regular), which is the imagined curve <strong>for</strong> the day in<br />
question in quiet <strong>magnetic</strong> conditions. In the method called Adaptive Smoothing<br />
(Nowozynski et at., 1991), the SR-curve is deduced from a least squares fIt of<br />
one-minute values, with limitations on the second derivatives <strong>and</strong> with weight factors<br />
to make the influence of quiet periods larger than that of the disturbed ones during the<br />
24 or 48 hours long data set (the day in question <strong>and</strong> 12 hours from the previous <strong>and</strong><br />
the following day). There are three free parameters to be adjusted (in reality, two of<br />
them are the same) <strong>for</strong> each <strong>observatory</strong> to achieve the best agreement with the<br />
h<strong>and</strong>-scaled Ks.<br />
Another method giving good results is the so-called FMI-method (FMI <strong>for</strong> Finnish<br />
Meteorological Institute) (Menvielle et ai., 1995). The 24 values (one <strong>for</strong> each hour)<br />
used in producing the SR-curve are the means of all data points inside each UT hour<br />
<strong>and</strong> n + m minutes on both sides of the hour. The mean is thus the same as the middle<br />
point of a line fItted to the values in question. m depends on the local time, <strong>and</strong> n<br />
depends on the <strong>magnetic</strong> activity (n = K 3 . 3 minutes, where K is a preliminary value<br />
obtained from the difference: maximum minus minimum). During disturbed times<br />
n + m can be so high that the values from the whole previous day or the next day or<br />
both are needed <strong>for</strong> the calculation.<br />
There are other computer programs giving satisfactory results <strong>for</strong> the production of<br />
K-indices. They are available at the International Service of Geo<strong>magnetic</strong> Indices<br />
(<strong>for</strong> the address see Chapter 10).<br />
The K-indices produced at observatories SIT, MEA, FRD, OTT, HAD, ESK, LER,<br />
WNG, LOV, BFE, CAN, EYR (A list of observatories is reproduced in Appendix I)<br />
are used to produce the so-called planetary K-indices K p , which are widely used in<br />
many studies of geophysical phenomena. The computation of the Kp-indices <strong>and</strong><br />
their linear equivalent, the Ap-indices, is carried out monthly at the Institut fiiI<br />
Geophysik, Gottingen, <strong>for</strong> the International Service of Geo<strong>magnetic</strong> Indices. The<br />
Kp-indices have a more dense scale than the K-indices using also values in between<br />
<strong>and</strong> marking them with + or -, e.g., 5+, 60 or ?--. Also, other than the Kp<br />
observatories usually send their K-values to the Service of Geo<strong>magnetic</strong> Indices,<br />
which is now in Paris, <strong>and</strong> also to the WDC's.<br />
There are several other indices describing the behavior of the <strong>magnetic</strong> field or<br />
<strong>magnetic</strong> activity (parkinson, 1983). Individual observatories do not produce these
- 153-<br />
indices; they are produced by using K-indices from several observatories or by<br />
processing other synoptic <strong>magnetic</strong> data from several observatories. Widely used is<br />
the AE-index, which is calculated using data from observatories under the auroral<br />
oval <strong>and</strong> describes the strength of the auroral electrojet, <strong>and</strong> the DSI index, which<br />
describes the strength of the ring current around the Earth (see Chapter 2).<br />
According to the <strong>IAGA</strong> resolutions, <strong>magnetic</strong> observatories are recommended to<br />
select from their magneto grams some special events <strong>and</strong> report them to the <strong>IAGA</strong><br />
Service collecting such data. Storm sudden commencements (ssc) should be reported<br />
as well as their type, <strong>and</strong> also solar flare effects (sfe) <strong>and</strong> other sudden impulses (si).<br />
Classification of the special events can be found in the Provisional Atlas of Rapid<br />
Variations (1959).<br />
7.7 INTERMAGNET<br />
For many scientific campaigns <strong>and</strong> also <strong>for</strong> practical purposes like protecting<br />
satellites <strong>and</strong> protecting electric <strong>and</strong> electronic systems against induced electric<br />
currents during <strong>magnetic</strong> storms, real-time or nearly real-time global knowledge of<br />
the behavior of the <strong>magnetic</strong> field is needed. For real-time collection of <strong>magnetic</strong> data<br />
from observatories allover the world, a system called INTERMAGNET has been<br />
created. Observatories collect their digital data on floppy or hard discs. There are two<br />
ways to transmit data to INTERMAGNET: through electronic mail or through<br />
satellites (Fig. 7.3). In data collection via satellites, the data are transmitted in a<br />
specified <strong>for</strong>mat to the nearest geostationary meteorological satellite, which<br />
transmits the data to GIN's (Geo<strong>magnetic</strong> In<strong>for</strong>mation Node). The radio frequency<br />
used is of the order of 400 MHz. METEOSAT receives the <strong>magnetic</strong> data once per<br />
hour, <strong>and</strong> the other satellites every 12 minutes. More <strong>and</strong> more observatories are<br />
sending their data to the GIN's via electronic mail.<br />
The INTERMAGNET one-minute data are in 0.1 nT units. The data are collected<br />
via satellite in near real-time, <strong>and</strong> via electronic mail within 72 hours. All details<br />
about <strong>for</strong>mats, data, organization, etc., are in the INTERMAGNET Technical<br />
Reference Manual obtainable from<br />
INTERMAGNET<br />
c/o U.S. Geological Survey<br />
Box 25046 MS 968<br />
Denver Federal Center<br />
Denver, CO 80225-0046<br />
USA<br />
or from INTERMAGNET<br />
c/o National Geomagnetism Program<br />
Geological Survey of Canada<br />
1 Observatory Crescent<br />
Ottawa, CANADA<br />
KlAOY3<br />
Complete addresses ofINTERMAGNET<strong>and</strong> its GIN's can be found in Chapter 10.
- 154 -<br />
Figure 7.3. The footprints of geostationary meteorological satellites in 1993. Most of<br />
the satellites are receiving <strong>and</strong> transmitting <strong>magnetic</strong> data in the INTERMAGNET<br />
system. The observatories in the INTERMAGNET system in 1993 are also shown.<br />
As an example of fonnats we give below the INTERMAGNET GIN dissemination<br />
fonnat <strong>for</strong> one-minute values:<br />
Block header (64 characters):<br />
IDC_DDDDDDD_DOY_HH_COMP_LGIN_COLALONG_DECBAS_RRRRR<br />
RRRRRRRRRRRCrLf<br />
where<br />
IDC<br />
DDDDDDD<br />
DOY<br />
HH<br />
<strong>IAGA</strong> three-letter code <strong>for</strong> the <strong>observatory</strong> (see Appendix I).<br />
Date, e.g. FEB 1591, <strong>for</strong> February 15, 1991<br />
Day of the year (1-366).<br />
Hour (0-23). The first line following the header will contain the<br />
values corresponding to minute 0 <strong>and</strong> 1 of this hour. The first<br />
value of the day file is hour 0 minute O.
COMP<br />
T<br />
GIN<br />
- 155-<br />
Order of components, e.g. HDZF or XYZF.<br />
Data type: R = reported (raw data), A = adjusted, D = definitive.<br />
Three-letter code <strong>for</strong> the GIN responsible <strong>for</strong> the processing of the<br />
data.<br />
COLALONG Colatitude <strong>and</strong> east longitude of the <strong>observatory</strong> in tenths of<br />
degrees.<br />
DECBAS<br />
RR ... RRR<br />
CrLf<br />
Base-line declination value in tenths of minutes East (0-216000).<br />
If components are X, Y, Z then DECBAS = 000000.<br />
Reserved 16 bytes.<br />
S pace character.<br />
Carriage return, Line feed.<br />
Data space (64 characters per line):<br />
AAAAAAA_BBBBBBB_CCCCCCC_FFFFFF _AAAAAAA_BBBBBBB_CCC<br />
CCCC_FFFFFFCrLf<br />
AAAAAAA_BBBBBBB_CCCCCCC_FFFFFF _AAAAAAA_BBBBBBB_CCC<br />
CCCC_FFFFFFCrLf<br />
where<br />
AAAAAAA<br />
BBBBBBB<br />
CCCCCCC<br />
FFFFFF<br />
Component 1 data field, (' +' sign <strong>for</strong> positive values optional)<br />
Component 2 data field, ('+' sign <strong>for</strong> positive values optional)<br />
In case of D, in hundredths of minutes<br />
Component 3 data field, (' +' sign <strong>for</strong> positive values optional)<br />
Total field data field, (unsigned)<br />
INTERMAGNET has corresponding data <strong>for</strong>mats <strong>for</strong> hourly <strong>and</strong> arulUal mean<br />
values <strong>and</strong> also <strong>for</strong>mats <strong>for</strong> transmitting data to different satellites, all published in<br />
the INTERMAGNETTechnical Reference Manual.<br />
If an <strong>observatory</strong> wishes to join the INTERMAGNET system <strong>and</strong> so to make its
- 156 -<br />
data available on a timely basis, <strong>and</strong> at the same time to get the corresponding data<br />
from all the INTERMAGNET observatories on a timely basis, an Application Fonn<br />
is available from the INTERMAGNET addresses above.<br />
The INTERMAGNET organization has strict rules on the quality of data. For the<br />
final data, the final base-lines are used, the spikes removed from the recordings, <strong>and</strong><br />
gaps filled, if possible. All the data collected are copied on CD-RaM's on a yearly<br />
basis. The INTERMAGNET CD-RaM's are available from the INTERMAGNET<br />
Office, free of charge to all contributing observatories.<br />
7.8 Observatory routine<br />
The routine at a manned <strong>observatory</strong> differs somewhat from the routine at a partly<br />
manned one, although the same checks have to be done at both. In the case of a partly<br />
manned <strong>observatory</strong>, the checks are often done using remote control.<br />
Utilizing computer technology, some important checks are possible on a<br />
continuous basis. If there are two independent variometers, the difference of the<br />
recorded data can be calculated all the time <strong>and</strong> an alarm can be given if the<br />
recordings differ from each other. The same can be done by comparing readings from<br />
a proton magnetometer with the value calculated from the components. An alarm<br />
may also be given if one of the temperature sensors shows an unusual value.<br />
Daily at a manned <strong>observatory</strong>, the routine includes overall checking. This means a<br />
check of the nonnal running of the system, checking of the temperature of the sensor,<br />
checking of the data to confirm that they are meaningful. The latter can be done by<br />
comparing the recorded data with the reading of a proton magnetometer, if it is not<br />
done automatically. It is also good to check the voltage of the batteries. Preferably the<br />
data recorded should be shown on the screen of a monitor or displayed in some other<br />
way <strong>for</strong> checking that there are no unusual spikes or gaps in the recording. To put the<br />
daily mean values on a graph-paper manually is also a good practice, one new point<br />
<strong>for</strong> each component every day. It is important to check the clock every day.<br />
Observatory time (recorder time) is expected to be correct with an accuracy of better<br />
than one second.<br />
All adjustments <strong>and</strong> everything done to the recording system has to be carefully<br />
noted in a diary.<br />
Weekly, or more often if needed, the absolute level of the recorded data has to be<br />
checked by making absolute <strong>measurements</strong>. It is important to calculate the results of<br />
the absolute <strong>measurements</strong> immediately after making them. If the result does not fit<br />
the recorded data, a new absolute measurement should be done to check that there<br />
was no mistake in the measurement. After this, the base-line values of the<br />
variometer(s) can be changed. The time of the change of the base-line value has to be
- 157-<br />
carefully recorded. It is convenient to keep the base-lines as close to their final<br />
absolute values as possible, so reducing the work in the final adjustment, which is<br />
usually done after the end of each year be<strong>for</strong>e publishing the annual yearbook <strong>and</strong><br />
be<strong>for</strong>e the final data are archived <strong>and</strong> sent to the WDC's. The modern instruments are<br />
often so stable that the preliminary data may be the final version.<br />
Also the sensitivities (scale values) should be checked once a week unless<br />
experience shows that once a month is enough.<br />
Monthly one should check the sensitivities. Usual monthly routine is to print<br />
monthly tabulations of hourly mean values, draw daily magnetograms <strong>for</strong> the month,<br />
<strong>and</strong> calculate monthly means <strong>for</strong> each hour. The international quiet <strong>and</strong> disturbed<br />
days have usually not been selected at the beginning of the next month <strong>for</strong> the<br />
previous month, but many observatories select their own five quiet <strong>and</strong> five disturbed<br />
days <strong>and</strong> also include these preliminarily selected days in their tabulations. The<br />
K-values <strong>for</strong> the month are also tabulated. Several observatories publish the monthly<br />
tabulations <strong>and</strong> send them to the World Data Centers. Other observatories send to the<br />
WDC's the tabulations <strong>and</strong> copies of magneto grams as microfilm or microfiche.<br />
For a classical <strong>observatory</strong> with analog recordings, a very detailed description of<br />
the <strong>observatory</strong> routine can be found in Wienert's Notes on Geo<strong>magnetic</strong><br />
Observatory <strong>and</strong> Survey Practice.
8. TESTING AND CALIBRATING INSTRUMENTS<br />
The testing <strong>and</strong> calibrating of instrwnents is an essential part of all <strong>measurements</strong>,<br />
especially important in <strong>observatory</strong> practice where the user of data has to be able to<br />
trust in the given absolute accuracy. As mentioned in previous chapters, modern<br />
instruments are capable of measuring the field components with an absolute accuracy<br />
of 0.1 nT. To meet this high requirement, careful testing <strong>and</strong> calibrations are needed.<br />
There<strong>for</strong>e, rather regular international comparisons <strong>and</strong> tests have been arranged <strong>for</strong><br />
both absolute <strong>and</strong> recording instruments (see, <strong>for</strong> example, Kauristie et ai., 1990b).<br />
8.1 General connection between field-component variations <strong>and</strong> the output of<br />
variometers<br />
Normally, a <strong>magnetic</strong> variometer recording three orthogonal elements of the<br />
<strong>magnetic</strong> field has three sensors. As a rule, one sensor is vertical <strong>and</strong> one of the<br />
horizontal sensors is pointing towards the geographic or geo<strong>magnetic</strong> north <strong>and</strong> the<br />
third is perpendicular to the plane containing the other two. In field work <strong>and</strong>, <strong>for</strong><br />
example, in sea bottom magnetometers, any orientation is acceptable. It is only<br />
necessary to know the azimuth of the variometer. In all recording practice it is<br />
necessary to know the corrections to the data if the sensors are not orthogonal.<br />
z<br />
x<br />
Figure B.1. The direction of one magnetometer sensor with respect to the geographical<br />
coordinate system used in geomagnetism.<br />
y
- 159 -<br />
Let the angle between the horizontal plane <strong>and</strong> the direction of the sensor be e <strong>and</strong><br />
the angle in the horizontal plane between the projection of the sensor <strong>and</strong> the x-axis<br />
be lp (Figure 8.1). In a <strong>magnetic</strong> field B = [ X, Y, Z] the sensor will measure the field<br />
F= X coslpcosO+ Y sinlpcose+ Z sine (8 .1)<br />
For field variations we can simplify <strong>for</strong>mula (8.1) by taking into account that the<br />
angles lp <strong>and</strong> e are small in practice (not more than 1°-2°). Let us call M'x the<br />
amplitude of the variation in a direction deviating from the X-component by small<br />
angles lpx <strong>and</strong> ex ' <strong>and</strong> similarly M'y <strong>and</strong> M'z (lpz may not be small)<br />
or in matrix <strong>for</strong>m<br />
(8.2a)<br />
(8.2b)<br />
(8.2c)<br />
(8.3)<br />
The output of a variometer is as a rule in volts which are changed to bits by an AID<br />
converter. To get the data in nT, it is necessary to multiply the numbers of bits .1n x •<br />
.1ny <strong>and</strong> .1n z • by scale values cx' cy, c z :<br />
(8.4)<br />
Multiplying equations (8.3) by the inverse of the matrix of these equations (the<br />
inverse matrix is computed under the assumption that the second-order terms are<br />
neglected) we get<br />
j L1X]<br />
{ 1<br />
,1Y - -q>y<br />
LiZ -ez coslpz<br />
Taking into account equation (8.4) <strong>and</strong> changing notation, we have<br />
(8.5)<br />
(8.6)
- 160-<br />
The matrix (8.6) is called the scale values matrix. It has nine elements. For accurate<br />
recording one has to know all of them, or to adjust the orientations so that the<br />
nondiagonal elements are small enough. In the next sections we shall discuss how to<br />
measure all the elements of the scale values matrix (8.6).<br />
8.2 Testing orthogonalities by comparison<br />
The method described below can be used to determine all components of the matrix<br />
(8.6), which means that we can compute the diagonal scale values, the orthogonality<br />
of the sensors <strong>and</strong> the orientation of the sensor assembly after the installation of the<br />
station. The method is easily used if there is a st<strong>and</strong>ard recording station with well<br />
known characteristics nearby. It will be more elaborate to collect the needed data<br />
from absolute <strong>measurements</strong> made during a <strong>magnetic</strong>ally active day. The method is<br />
based on a comparison of recorded natural variations of the <strong>magnetic</strong> field with<br />
simultaneously measured or recorded data which have no systematic errors. Because<br />
the natural variations generally have small amplitudes, the data series should be long<br />
<strong>and</strong> a least squares method of data treatment will be necessary.<br />
Let us assume that there is no difference between the sites where the tested recorder<br />
is located <strong>and</strong> where the normal data come from. If not, the true values (x) have to be<br />
adjusted to the recording site ({-values). We start from the first of equations (8.6):<br />
Assuming that we have n <strong>measurements</strong> with errors denoted by v, we can write in<br />
matrix <strong>for</strong>m<br />
X+V=je (8.7)<br />
The unknown quantities eX' e xy ' e xr can be found from the so-called normal<br />
equations<br />
The <strong>for</strong>mula <strong>for</strong> the mean square error 11 is then<br />
(8 .8)<br />
(8 .9)
- 161 -<br />
The squares of the mean square errors of the unknowns are equal to the diagonal<br />
elements of the matrix<br />
(8.10)<br />
Exactly the same procedure should be repeated to find the unknown elements of the<br />
second <strong>and</strong> third row of equation (8.6).<br />
The necessary data <strong>for</strong> the computation of quantities Llx 1 , ••• , Llx n can be obtained<br />
from absolute <strong>measurements</strong> made during a disturbed day or disturbed days. It is a<br />
rather laborious <strong>and</strong> time consuming way, but has the advantage that it can be<br />
accomplished after the installation of the variometer. And every <strong>observatory</strong> has the<br />
facilities <strong>for</strong> these <strong>measurements</strong>. The other possibility is to use simultaneous data<br />
from another very carefully calibrated <strong>and</strong> oriented recording station, if available.<br />
The majority of observatories measure only diagonal elements of the matrix (8 .6).<br />
That procedure is based on the assumption that the nondiagonal elements are<br />
negligible. If the variations have to be recorded with high accuracy, say higher than<br />
1 %, we cannot assume without checking that the nondiagonal elements of the matrix<br />
are small enough to be neglected. An assumption of 1 % accuracy means that c xy I CX'<br />
cxz/c x ' fyxlEy. fyz/fy. czxlc z <strong>and</strong> cZylc Z are smaller than 0.01. That is fulfilled if the<br />
accuracy of the orthogonality is about 0.25°. Such an accuracy is quite difficult to<br />
achieve in constructing magnetometers. In any case, the true orientation of the<br />
sensors should be checked. The only two ways to achieve an accurate recording are<br />
either to use all nine elements of the matrix or to correct the orientation of the sensors<br />
so that the nondiagonal elements have no importance. We rather recommend the first<br />
solution.<br />
If the variometer has not been installed so that the sensors are close to the correct<br />
directions (within 2°), then more complete <strong>for</strong>mulas have to be used <strong>for</strong> the<br />
corrections. Such <strong>for</strong>mulas will be presented in connection with the tests in<br />
three-component coils.<br />
In the descriptions of the above procedures we made the assumption that the<br />
unknown angles are small. Theoretically this is not necessary, <strong>and</strong> both procedures<br />
can be based on the more exact equation (8.1) instead of equations (8.2). In this case<br />
the calculations are more complicated, but it does not matter when using computers<br />
which have matrix programs.<br />
The testing of the variometer as described above is highly recommended at all<br />
observatories. Especially at low latitudes, however, it may take years be<strong>for</strong>e a<br />
suitable <strong>magnetic</strong> disturbance happens to occur at the same time that the observer has<br />
an opportunity to make the long series of observations needed. There<strong>for</strong>e. it is good<br />
to have the instrument tested be<strong>for</strong>e installation at an <strong>observatory</strong> having the
- 162 -<br />
necessary facilities. Several observatories today have a sufficiently large <strong>and</strong> accurate<br />
three component coil system suitable <strong>for</strong> testing the sensor assemblies.<br />
We point out that the testing of the instruments is very important in spite of the fact<br />
that the manufacturers of the instruments give values <strong>for</strong> the sensitivities <strong>and</strong> the<br />
orientations of the sensors. These quantities may have changed in time <strong>and</strong> during the<br />
transportation of the instrument. The test at a st<strong>and</strong>ard <strong>observatory</strong> gives the angles<br />
between the sensors <strong>and</strong> the sensitivities as described above, either by comparing to<br />
a st<strong>and</strong>ard recording or by testing in a coil system. The test naturally does not give the<br />
orientation of the sensor assembly at the place of installation, which may be very far<br />
from the test <strong>observatory</strong>. But if the instruments are carefully transported, the angles<br />
between the sensors, <strong>and</strong> in many cases also the sensitivities, probably remain the<br />
same. Note that there is no need to have the sensors really orthogonal <strong>and</strong> properly<br />
oriented. It is enough to know the angles between the sensors <strong>and</strong> the right directions.<br />
Modern data h<strong>and</strong>ling systems always have computer capacity available <strong>for</strong> the<br />
calculation of the corrections, in real time if needed. Naturally, it is more convenient<br />
to have the true components recorded, thus possibly avoiding mistakes in the long<br />
chain of data processing. In practice, it is usually possible to install the sensor<br />
assembly so that the vertical sensor is really vertical by leveling the assembly to the<br />
same level-readings as at the test <strong>observatory</strong> where the verticality was adjusted, or<br />
by turning the assembly around its vertical axis <strong>and</strong> adjusting the sensor assembly so<br />
that the reading of the vertical sensor does not depend on the orientation. The azimuth<br />
orientation can be made very close to correct by turning the assembly to an<br />
orientation giving zero <strong>for</strong> the Y-component (orientation to the <strong>magnetic</strong> north) or by<br />
turning until the Y-component shows the absolute value calculated or measured <strong>for</strong><br />
the site.<br />
The tests should be made just be<strong>for</strong>e the installation of the instrument. The<br />
observer in charge <strong>and</strong> possibly also other persons from the <strong>observatory</strong> where the<br />
instrument will be installed should be present during the tests. The instruments to be<br />
installed at temporary recording stations should also be tested the same way as the<br />
<strong>observatory</strong> instruments, at least once be<strong>for</strong>e the survey, <strong>and</strong> always after a possibly<br />
rough transportation of the instrument.<br />
8.3 Testing orthogonalities <strong>and</strong> sensitivities using coil systems<br />
A three-component coil system (see Section 8.7) is very useful in testing<br />
instruments, because both sensitivities <strong>and</strong> angles between the components are<br />
obtained in a rather simple measurement. In the coil system it is possible to determine<br />
all the unknown quantities without statistical evaluation of the data, as was necessary<br />
<strong>for</strong> the method described in .the previous section. The reason <strong>for</strong> that is that the<br />
additional field can be made large enough <strong>for</strong> the required accuracy. For the sake of<br />
completeness, however, we also present a more general approach.
- 165 -<br />
still be tilted relative to the horizontal plane. This angle can be detennined by adding<br />
a known Z-field, LiZ, in the Z-coil. Then<br />
8y = arc sin (L1Y/.1Z) (8.19)<br />
where L1Y is the change of the Y-reading. It is good to use both positive <strong>and</strong> negative<br />
additional Z-fields, which may be rather large, thous<strong>and</strong>s of nT. The same method can<br />
be used to detennine the angle ex between the horizontal plane <strong>and</strong> the X-sensor <strong>and</strong><br />
the angle CfJx between the X-sensor <strong>and</strong> the north direction, which is accomplished by<br />
adding a known additional field L1Y in the Y-coil:<br />
ex = arc sin (L1X/.1Z)<br />
(8.20)<br />
({Jy = arc sin (L1X/ L1Y)<br />
(8.21 )<br />
The correct east-west direction or north-south direction should be carefully<br />
marked on the sensor head to be able to install the sensor correctly at the pillar at the<br />
future recording site. If the sensor is small, as often is the case, then it may be difficult<br />
to have the direction marked accurately enough. Fixing a mirror to the sensor head is<br />
then a possible solution. The mirror should be installed in a known astronomical<br />
direction, say east-west, so that a reflection of a laser beam or a view through a<br />
theodolite can be used to align it in the final installation.<br />
Naturally the directions of the sensors in the sensor head can also be adjusted in the<br />
test procedure described above, if the manufacturer has made it possible.<br />
After orienting the sensor head in the coil system, the sensitivities of the three<br />
sensors are detennined simply by adding currents alternately in opposite directions to<br />
the three coils. Observe that the sensitivities so obtained are the true ones taking into<br />
account the small misalignments of the Y- <strong>and</strong> X-sensors.<br />
The effects of the two components on the third one have to be taken into account<br />
using the angles obtained as presented above. Because the angles are as a rule small,<br />
less than 1°, it is sufficient to make a linear correction:<br />
Y = Yo + fyny + ay(X-Xo) + cy(Z-Zo)<br />
Z = Zo + Eznz + az
- 166 -<br />
used instead of the changes of the field values as presented here in the corrections. In<br />
other words, the factor bx in (8.22) corresponds to exy ICy, etc.<br />
8.4 Testing using a turntable<br />
It is possible to make all the determinations also in the following simple way: A<br />
turntable is needed <strong>for</strong> the sensor assembly. This can be an old theodolite. First, level<br />
the turntable carefully so that its axis is vertical. Then place the sensor assembly on<br />
the turntable (controlling the leveling of the turntable) so that the vertical sensor is<br />
vertical with high accuracy. The sensor assembly has to be adjusted until turning the<br />
table does not change the Z-reading. We now know that the Z-sensor is vertical <strong>and</strong><br />
measures only the Z-component. The levels of the sensor now have to be adjusted so<br />
that when installing the sensor at a new place it takes up the same vertical position.<br />
We then turn the turntable until the X-sensor shows zero. The contributions of small<br />
deviations of the X-sensor from the north direction <strong>and</strong> horizontal plane compensate<br />
<strong>and</strong> we get:<br />
H sinq>x - Z sinex = 0 (8.23)<br />
When turning the turntable carrying the sensor assembly by exactly 180 0 we get:<br />
- H sinq>x - Z sinOx = L1 N (8.24)<br />
where L1 N is the reading of magnetometer in nT.<br />
From (8.23) <strong>and</strong> (8.24) we get the <strong>for</strong>mula <strong>for</strong> angle ex which gives the tilting of<br />
X-sensor compared to the horizontal plane.<br />
ex = - arc sin (L1N/2Z) (8.25)<br />
The tilting of Y-sensor, 0y, will be determined in the same way. For this procedure<br />
the offset of the magnetometer should be small.<br />
The angle in horizontal plane between X- <strong>and</strong> Y-sensors can be measured in the<br />
following way: First tum the turntable until the Y-sensor reads zero. In that position<br />
the contribution of the Z-field in the Y-sensor is compensated by the contribution of<br />
the H-field:<br />
Z sinOy = H sinlPy (8.26)<br />
from which IPy is solved. Let ,the reading of the turntable be Ay in this position. The<br />
turntable is then turned until the X-sensor shows zero-reading <strong>and</strong> the reading of the<br />
turntable is denoted Ax. Then<br />
Z sin8x = H sinq>x (8.27)
- 167 -<br />
from which q>x is solved. The deviation of value (Ay + q>y) - (Ax + q>x) from 90° is the<br />
measure of non-perpendicularity.<br />
The measured angle q>y or q>x has to be utilized in orienting the sensor assembly at<br />
the pillar, which, as presented earlier, has to have the astronomical or <strong>magnetic</strong><br />
directions marked on top of it. The transfer of the astronomical or <strong>magnetic</strong> direction<br />
to the variation room has been discussed in Chapter 5.<br />
In some magnetometers the sensors are oriented so that there are angles of 45°<br />
between the sensors <strong>and</strong> the <strong>magnetic</strong> field, <strong>and</strong> the readings of the proton<br />
magnetometer are used to adjust the base-line values so that the sum of the<br />
components is the same as the reading of the proton magnetometer. This is not<br />
recommended <strong>for</strong> two obvious reasons: it is not known in which of the components<br />
there may be a change of the base-line, <strong>and</strong> the proton magnetometer records spikes<br />
more often than the other sensors, thus producing erroneous values in the<br />
components, if used automatically <strong>for</strong> checking each reading. On the other h<strong>and</strong>, this<br />
method allows a missing component to be recorded using F <strong>and</strong> the two remaining<br />
components. We recommend the recording of X, Y <strong>and</strong> Z <strong>and</strong> independently F with a<br />
proton magnetometer. X, Y <strong>and</strong> Z are preferred over H, D <strong>and</strong> Z <strong>for</strong> the reasons<br />
discussed in Chapter 3.<br />
Worth mentioning is also the method of recording D <strong>and</strong> I (actually deviations of<br />
the direction to mean <strong>magnetic</strong> meridian <strong>and</strong> deviations of the mean inclination<br />
angle) with fluxgate sensors combined with a proton magnetometer. This method<br />
naturally requires the installation of the sensors so that they show almost zero field,<br />
<strong>and</strong> the D-sensor has to be in the horizontal plane with high accuracy, so as not to<br />
record variations of Z; the I sensor correspondingly has to be in the <strong>magnetic</strong><br />
meridian plane, although here the requirement of accuracy is not as high as in the case<br />
ofD.<br />
8.S Testing <strong>and</strong> adjusting absolute instruments<br />
The checking <strong>and</strong> testing of the absolute instruments is at least as important as the<br />
testing of the variometers. No instruments can be trusted without tests <strong>and</strong><br />
comparisons.<br />
The proton magnetometer is a typical push-button device, also usualIy robust <strong>and</strong><br />
weatherproof, although the new microprocessor-controlled ones are not as simple to<br />
use as the previous ones. In <strong>observatory</strong> use, checking of proton magnetometers is<br />
also necessary. In <strong>observatory</strong> practice one should suspect <strong>and</strong> check everything.<br />
The first item to test is the sensor which has to be free of <strong>magnetic</strong> material. If the<br />
result is exactly the same regardless of the orientation of the sensor, then the sensor is<br />
clean. In addition to <strong>magnetic</strong> material there might be a small <strong>magnetic</strong> field from
- 168 -<br />
DC-current running into the coil through the switch of the polarizing voltage source:<br />
the switch may not have a sufficiently high resistance. In practice, the field does not<br />
cause an error to F if the bottle axis is perpendicular to the field vector.<br />
The magnetometer has a crystal oscillator, which is used to measure the Larrnor<br />
frequency of protons. The frequency of the oscillator may change with time.<br />
There<strong>for</strong>e, it has to be checked at regular intervals. Also the frequency may be a<br />
function of temperature, so that tests have to be made in different temperatures unless<br />
the electronics of the proton magnetometer are always kept in the same temperature<br />
at the <strong>observatory</strong>. The test is easy if there is a suitable frequency (about 2 kHz)<br />
available from a good crystal clock or some other source with an accuracy of 10--6 or<br />
better. The frequency can be fed to the bottle by one turn of wire around the bottle.<br />
The magnetometer should give the field which corresponds to the frequency. The<br />
frequency of 2000 Hz should give the value of 46,974.4 nT. If not, a small correcting<br />
factor has to be adopted to be used <strong>for</strong> the readings of the magnetometer, or the<br />
crystal of the oscillator has to be adjusted. This may be a function of temperature. In<br />
some cases it may also be a function of the voltage of the magnetometer batteries,<br />
which should be checked.<br />
If the magnetometer has a clock, then the checking of the frequency of the crystal<br />
is simple by observing the time given by the clock. If the time correction in seconds<br />
remains the same after ten days it means that the stability is not less than 10--6. Some<br />
magnetometers have different crystals <strong>for</strong> the clock <strong>and</strong> <strong>for</strong> counting the proton<br />
frequency, in which case the checking of the clock is not equivalent to the checking<br />
of accuracy of the magnetometer. Measuring the frequency of the crystal oscillator<br />
with a frequency meter (which are usually accurate to 10- 7 ) is a simple <strong>and</strong> safe<br />
method <strong>and</strong> is recommended.<br />
Some magnetometers have given slightly different values depending on the<br />
sensitivity used or depending on the tuning adjustments <strong>for</strong> the field (many of the<br />
new magnetometers adjust automatically to the field). The manufacturer of the<br />
instrument is probably the only one able to correct this. Tests described above reveal<br />
the best sensitivities <strong>and</strong> adjustments to be used.<br />
Almost every malfunctioning of proton magnetometers is connected with the<br />
analog part where signals of microvolt amplitude are generated <strong>and</strong> amplified.<br />
Typical reasons <strong>for</strong> erroneous signals are<br />
a bad contact in the socket<br />
a too high gradient of the <strong>magnetic</strong> field<br />
a<br />
pick-up of external noise.<br />
For all these reasons, the signal-to-noise ratio can be reduced. If there is something
- 169 -<br />
wrong in the measurement, clean <strong>and</strong> dry the socket, move the sensor to another<br />
location, <strong>and</strong> try again. If this does not help, it is necessary to check the<br />
signal-to-noise ratio. Some magnetometers have a meter or earphones <strong>for</strong> that<br />
purpose. In any case, an oscilloscope can be used. If the signal-to-noise ratio is too<br />
small, the magnetometer needs professional service.<br />
Fluxgate theodolites have sometimes been found to give wrong results. The main<br />
reason has been small amounts of iron somewhere, usually in a screw. It is easy to<br />
replace the screw with a <strong>magnetic</strong>ally clean one. To detect the error is often difficult.<br />
In a comparison of instruments, the error may be detected. Measurements with the<br />
lower part of the theodolite in different positions may give different results which<br />
shows that something is wrong. The parts of the theodolite may also be tested using<br />
a flux gate sensor or a classical instrument <strong>and</strong> bringing the suspected part of the<br />
theodolite close to the sensor. An astatic magnetometer is excellent <strong>for</strong> testing a<br />
weakly <strong>magnetic</strong> material. Such instruments are available at many classical<br />
observatories. An astatic magnetometer consists of two similar magnets which are<br />
fixed to a vertical rod in opposite positions. The system is suspended from one end of<br />
the rod with a low-torsion fibre. The Earth's <strong>magnetic</strong> field does not affect the system<br />
because the magnets are in opposite positions <strong>and</strong> have the same <strong>magnetic</strong> moments.<br />
If the piece to be tested is brought close to one of the magnets, the system turns if<br />
there is magnetism in the material.<br />
Fluxgate theodolites often have small errors in the adjustments. If the absolute<br />
<strong>measurements</strong> are made properly, as described in Chapter 5, these small maladjustments<br />
usually do not cause any errors in the final results. The errors are due to the<br />
following reasons:<br />
o<br />
o<br />
o<br />
The optical axis <strong>and</strong> the direction of the fluxgate sensor do not coincide.<br />
There is an offset in the electronics.<br />
The readings are not linear, which would be necessary in one of the measuring<br />
techniques described in Chapter 5.<br />
The vertical line of the optics is not vertical.<br />
The optical axis of the theodolite is not perpendicular to the horizontal axis of the<br />
theodolite.<br />
In Chapter 5 we described how to calculate the two angles of misalignment<br />
between the <strong>magnetic</strong> axis of the sensor <strong>and</strong> the optical axis. It is convenient to have<br />
the misalignment rather small. The corrections can be made according to the results<br />
of the calculations presented in Chapter 5, or the adjustments can be made, <strong>for</strong>
- 170-<br />
example, in the following way if there is a possibility <strong>for</strong> making them. Not all<br />
commercially available fluxgate theodolites have this possibility.<br />
To begin with, be sure that the <strong>magnetic</strong> field is quiet, <strong>and</strong> make the normal<br />
determination of the <strong>magnetic</strong> declination D as described above. Then we know the<br />
true <strong>magnetic</strong> meridian, <strong>and</strong> we turn the theodolite perpendicular to that (in the<br />
east-west position) <strong>and</strong> with the telescope carefully horizontal at the same time. If the<br />
sensor makes an angle a with the direction perpendicular to the <strong>magnetic</strong> meridian<br />
<strong>and</strong> {3 with the horizontal plane, <strong>and</strong> if there is in addition a bias field B along the<br />
sensor, then we get in the monitor the reading R instead of zero:<br />
R = H sina+ Z sin{3+ B. (8.28)<br />
When the theodolite is turned 180° around its vertical axis, we get<br />
R = -H sina+ Z sin{3+ B. (8.29)<br />
This shows that we have to turn the fluxgate sensor in the horizontal plane (compared<br />
to the optical axis) so that the part containing H disappears, which means reducing<br />
half of the difference between the two readings of R. That the adjustment has been<br />
made successfully has to be checked by repeating the turnings between the east <strong>and</strong><br />
west positions. Now the term containing His absent from the <strong>for</strong>mulas above, <strong>and</strong> we<br />
can make the adjustment in the vertical direction. For that we tum the theodolite<br />
around its horizontal axis, again by exactly 180°. Now the term containing Z changes<br />
its sign, <strong>and</strong> we adjust the sensor by turning it in the vertical direction so that half of<br />
the difference is again compensated. Naturally this operation has to be repeated until<br />
one is sure that the Z-term has disappeared.<br />
If the electronics produces an offset <strong>and</strong> if there is a possibility to adjust it, the<br />
adjustment is easily done by making the reading of the monitor zero. The offset is one<br />
of the values obtained in the routine calculations of the results from the fluxgate<br />
theodolite, as described in Chapter 5.<br />
In practice, the adjustment is not as straight<strong>for</strong>ward as described above, because<br />
adjusting the sensor in one direction often changes the other direction, <strong>and</strong> leads to<br />
many rounds of checking <strong>and</strong> adjustments. A perfect alignment of the sensor with the<br />
optical axis is very difficult to achieve, <strong>and</strong> better than 10' is a good result.<br />
More important than a good alignment or a small bias field is that they do not<br />
change during the measurement. The sensor may be slightly loose in its holder so that<br />
it changes position when turning the telescope. There<strong>for</strong>e, it is important to ensure<br />
that the fluxgate sensor is properly attached to the telescope <strong>and</strong> that the sensor inside<br />
its holder is properly fixed. Also the possible effect of temperature change to the<br />
sensor should be tested, because in some cases the heat from the lamp above the<br />
theodolite may cause the sensor to move. When turning the telescope to the down
- 171 -<br />
position where the sensor is in shadow it cools <strong>and</strong> may change its position again.<br />
Heating from one side naturally tilts the whole theodolite, but by making the<br />
observations as described above the effect is compensated. Direct sunshine is not<br />
permitted on the theodolite.<br />
Temperature may have some effect also on the electronics. There<strong>for</strong>e, it is best to<br />
keep the electronics at the observation temperature long enough be<strong>for</strong>e the<br />
measurement, <strong>and</strong> also to turn the power on at least a few minutes be<strong>for</strong>e the<br />
observations begin.<br />
One also has to test the linearity <strong>and</strong> make sure that the readings of the fluxgate<br />
magnetometer are in known units. This is easily done by turning the theodolite to plus<br />
<strong>and</strong> minus directions from the null position <strong>and</strong> taking the readings, say, <strong>for</strong> each<br />
minute of arc close to the null position <strong>and</strong> less frequently farther away. If the angle<br />
is a <strong>and</strong> the field H, then the reading X corresponding to the angle a should be<br />
X=Hsina. (8.30)<br />
Sometimes the vertical line of the eyepiece of the telescope is not exactly vertical.<br />
This can be checked by moving the telescope in the vertical direction. If this is the<br />
case, then one has to align at exactly the middle point of the line where the horizontal<br />
line crosses the vertical one. This is a good practice in any case.<br />
It is common to have a small collimation in the telescope which means that the<br />
optical axis is not exactly perpendicular to the horizontal axis of the theodolite <strong>and</strong><br />
not exactly perpendicular to the vertical direction in positions 90 0 or 270 0 of the<br />
vertical circle. The effect of collimation is compensated totally by taking the readings<br />
in up <strong>and</strong> down positions (see above). Most telescopes have a small collimation error.<br />
There<strong>for</strong>e, the <strong>measurements</strong> have always to be made in both positions.<br />
8.6 Comparisons or absolute instruments<br />
Comparisons of absolute instruments were of uppermost importance during the era<br />
of quasi-absolute instruments like the QHM. Also the measurement of the <strong>magnetic</strong><br />
declination at observatories arranging comparisons was found useful because the<br />
measurement of declination, in spite of its absoluteness, was difficult as discussed<br />
above in connection with the possible sources of error in classical magnetometers.<br />
Today, when making the absolute <strong>measurements</strong> with the proton magnetometer<br />
<strong>and</strong> the flux gate theodolite, the comparisons are no longer needed as frequently as<br />
be<strong>for</strong>e. But they are still useful, as shown by the experiences from the Nordic<br />
countries who make comparisons every two years. The enhanced requirements of<br />
accuracy (tenth of a nanotesla instead of one nanotesla which used to be the<br />
requirement a few years ago) support the continuation of the comparisons. To reach
- 172-<br />
this high accuracy, perfectly working instruments are necessary. Defects have been<br />
found during comparisons. The importance of the observers-in-charge to meet each<br />
other <strong>and</strong> to learn from each other's experiences also supports the organizing of<br />
comparisons.<br />
The proton magnetometer is often thought to be a fool-proof absolute instrument.<br />
Do not trust it without testing. It is best to compare it with a tested proton<br />
magnetometer.<br />
The comparison of two proton magnetometers is made simply by putting the<br />
sensors on two non-<strong>magnetic</strong> supports (e.g. wooden chairs or poles of wood) some<br />
20 m apart <strong>and</strong> making exactly simultaneous <strong>measurements</strong> with both of them. One<br />
series of ten observations is nonnally enough. After that, the locations of sensors are<br />
interchanged <strong>and</strong> a new series of observations taken. If magnetometer A is known to<br />
be right <strong>and</strong> the mean of its readings at Place 1 is A 1 <strong>and</strong> the mean of its readings at<br />
Place 2 is A2, <strong>and</strong> the corresponding data of magnetometer Bare B2 <strong>and</strong> B1, we get<br />
<strong>for</strong> the correction to be added to the F-reading of magnetometer B<br />
M' B = [(A 1 + A2) - (B1 + B2)]/2 (8.31)<br />
<strong>and</strong> the difference of F between the places (Place 1 minus Place 2) is<br />
M'1_2=(A1-A2+Bl-B2)/2 (8.32)<br />
The comparison of other instruments is carried out by making normal absolute<br />
<strong>measurements</strong> <strong>and</strong> determining the base-line values <strong>for</strong> the recording system. If the<br />
base-lines of the variometer are correct, then the possible difference is caused by<br />
change of the constant of the QHM or, in the case of a flux gate theodolite, some error<br />
in the measurement, impurities in the theodolite (sometimes a screw has been found<br />
containing iron), loose sensor which moves when turning the theodolite, etc.<br />
Measuring declination with a declinometer has several possible sources of error, as<br />
described in the section dealing with classical <strong>measurements</strong>. The comparisons may<br />
show that something is wrong <strong>and</strong> one has to find the source. In any case, the<br />
measurement has to be repeated several times <strong>and</strong> preferably during at least two or<br />
three days be<strong>for</strong>e making any final conclusions.<br />
In comparison <strong>measurements</strong> at <strong>magnetic</strong> observatories, the final base-line values<br />
with the final accuracy which nowadays is about 0.2 nT are not known as a rule<br />
during the comparisons. The differences between the different instruments can be<br />
calculated immediately during <strong>and</strong> after the comparisons, <strong>and</strong> the final adjustments<br />
can be made afterwards, as soon as the final base-lines are available.<br />
Naturally, if two or more pillars <strong>for</strong> the absolute <strong>measurements</strong> are available <strong>and</strong><br />
are located far enough from each other, the instruments can be compared directly by<br />
making the <strong>measurements</strong> simultaneously, provided the pillar difference is known. If
- 173 -<br />
it is not known, both the pillar difference <strong>and</strong> the difference in instruments are<br />
obtained by applying the same method as in the comparison of proton<br />
magnetometers.<br />
8.7 Coil systems <strong>for</strong> testing magnetometers<br />
Serson (1974) describes several types of coils which could be used in geo<strong>magnetic</strong><br />
work. His paper presents suitable coil systems <strong>for</strong> most purposes. Here we only<br />
describe some of them. Note that the more sophisticated the coil system, the more<br />
sensitive it is <strong>for</strong> imperfections.<br />
We have already mentioned (Section 5.4) about the circular <strong>and</strong> square Helmholtz<br />
coil systems, which are probably the most popular due to their simplicity. The<br />
circular Helmholtz coil system consists of a pair of coils with radius <strong>and</strong> separation<br />
equal to r. It is best to wind the wire on a frame so that there is only one layer. The<br />
wire leading the current to the coil system <strong>and</strong> from one coil to the other <strong>and</strong> back has<br />
to be carefully made so that the wires have exactly the same length <strong>and</strong> are twisted.<br />
This way, their <strong>magnetic</strong> effect inside the coil system is nullified. There will be a<br />
short piece of uncompensated wire at both coils unless the winding has been done as<br />
described later in connection with the Alldred <strong>and</strong> Scollar coil system. Also, having<br />
two layers of windings, back <strong>and</strong> <strong>for</strong>th, reduces the uncompensated wire to be<br />
insignificant. In this case, the mean radius of the windings has to be used as the<br />
distance between the coils.<br />
The frame should preferably be made of a material having a small temperature<br />
coefficient. Wood <strong>and</strong> special plastics are good, quartz is excellent but difficult to get<br />
<strong>and</strong> expensive in larger coils. In practice, most frames are made of alurninum or<br />
wood, <strong>and</strong> the temperature is kept stable during the measurement. Wood is sensitive<br />
to humidity.<br />
The square Helmholtz coil system is in principle similar to the circular one. The<br />
coils are square <strong>and</strong> the distance between them is now 0.5445L, where L is the length<br />
of the side of the square.<br />
The <strong>magnetic</strong> field in the middle of the normal Helmholtz coil system (along the<br />
axis of the coils) is<br />
B = 8J1D In/5 . ..g r = 899.18 In/r [nT/A] (8.33)<br />
where I = current in amperes, n = number of turns in one winding. r = radius in<br />
meters. To achieve a spherical volume (r = 5 cm) inside the coil. in which the<br />
homogeneity of the field is 10-4 or better, the radius r has to be 52 cm.<br />
The <strong>magnetic</strong> field of a square Helmholtz coil close to the middle point is
which at the middle point gives<br />
- 174-<br />
(8.34)<br />
B = 1628.7 [niL [nT/A] (8.35)<br />
where [ is in amperes, n is the number of turns of the wire in one square, L is the<br />
length of one side of the square, <strong>and</strong> a is the distance (0.5445 U2) to the middle point.<br />
The homogeneity corresponds to the homogeneity of the normal Helmholtz coil.<br />
Widely used coil systems giving better homogeneity are Braunbeck <strong>and</strong> Fanselau<br />
coils. Both have 4 circular (square have also been made) coils on the same axis. In the<br />
Fanselau system the outer coils are smaller having radius al' The two inner ones have<br />
radius a2' The distance from the middle point to the outer coils is d l <strong>and</strong> the<br />
corresponding distance to the inner coils is d 2 • The ratios are<br />
The same homogeneous space as with a Helmholtz coil can be obtained with a<br />
Fanselau coil having only 1/3 of the radius of the Helmholtz coil. All four coils of the<br />
Fanselau coil system have the same number of turns, <strong>and</strong> the current is the same in all<br />
coils. A current of 0.80852al amperes produces a field of 10 5 nT. A good alternative<br />
is a more compact system by Robinson (1983) in which all windings are wound on a<br />
tube.<br />
As an example of a three-component coil system which is not too difficult to build<br />
we describe a coil system published by Alldred <strong>and</strong> Scollar (1967) <strong>and</strong> built at the<br />
Nurmijarvi <strong>observatory</strong>, with dimensions given in Figure 8.2. Figure 8.3 shows the<br />
coil system in the test house of the <strong>observatory</strong>. A detailed description of such a coil<br />
at the Nurmijarvi <strong>observatory</strong> has been published by Hiikkinen et al. (1990a).<br />
The frame of the Nunnijarvi coil was made of u-shaped aluminum. Special care<br />
was taken in winding. To avoid uncompensated pieces of wire the coils were wound<br />
first in one direction, leaving space <strong>for</strong> winding back to the point where the winding<br />
started. The space was left using extra wire. Only one layer of wire was used.<br />
The sensitivities of the Nunnijarvi coil system having the dimensions given in<br />
Figure 8.2 are, according to careful detennination using a proton magnetometer at a<br />
temperature of 20°C (computed values in brackets)<br />
X: 42.409 (42.404) nT/rnA<br />
Y: 48.252 (48.258)<br />
Z 36965 (36.98n<br />
In the middle of the coil system, the homogeneous area, having a homogeneity of
- 176-<br />
Figure 8.3. Coil system of Alldred <strong>and</strong> Scolar type at the Nurmijiirvi <strong>observatory</strong>.<br />
get Br = 400nISI? [nT]. In a perpendicular direction, the effect is half of the abovementioned<br />
one.<br />
For the cases in between, the sine <strong>and</strong> cosine terms are not equal to 1 <strong>and</strong> both<br />
radial <strong>and</strong> tangential components have to be taken into account.<br />
The field of the square Helmholtz coil on the axis, far from the coil, is roughly<br />
B '" 400 InL2/ ? [nT] (8.39)<br />
<strong>and</strong> half of that in the perpendicular direction. Putting realistic values in the <strong>for</strong>mulas<br />
above it is easy to see that one has to be careful in placing the coil systems, especially<br />
if they are big ones, used <strong>for</strong> adjusting instruments. Even Helmholtz coils used in<br />
proton vector magnetometers have to be placed at least 30 m from the variometers if<br />
an effect of 0.1 nT has to be avoided. An advantage of more compact coils is their<br />
smaller external effect.
9. INFLUENCE OF INDUCTION IN MAGNETIC RECORDINGS<br />
In Wienert's Notes on Geo<strong>magnetic</strong> Observatory <strong>and</strong> Survey Practice the author<br />
writes: "The function of a <strong>magnetic</strong> <strong>observatory</strong> is to record the short <strong>and</strong> long term<br />
variations of the geo<strong>magnetic</strong> field in such a way that the in<strong>for</strong>mation obtained is<br />
representative <strong>for</strong> a large area. This necessitates that at the <strong>observatory</strong> site (a) the<br />
geo<strong>magnetic</strong> elements are "normal", which means that the geo<strong>magnetic</strong> field at the<br />
<strong>observatory</strong> is not distorted by anomalies caused by abnormally magnetized<br />
geological bodies, (b) the subsoil of the surrounding area is fairly homogeneous in<br />
electrical conductivity".<br />
Even <strong>for</strong> old observatories the first condition is usually fulfilled, but as a rule the<br />
second is not. There are two reasons <strong>for</strong> that situation. The first is technical: it is much<br />
easier to map the permanent <strong>magnetic</strong> field than its short-term variations. The other<br />
is associated with the nature of the phenomena: it is not so difficult to find an area<br />
without a distinct <strong>magnetic</strong> anomaly, but as we shall see it is nearly impossible to find<br />
a place <strong>for</strong> an <strong>observatory</strong> with an homogenous distribution of conductivity in the<br />
neighborhood. Even now most observatories do not know what is the effect of local<br />
inhomogeneities of electrical conductivity on the recorded variations. Generally, the<br />
effect of a <strong>magnetic</strong> anomaly at the <strong>observatory</strong> site on <strong>magnetic</strong> variations is much<br />
smaller than the influence of induced currents. It is, however, important to note that<br />
if a <strong>magnetic</strong> <strong>observatory</strong> is on an anomaly, the time variations of D <strong>and</strong> H are not as<br />
representative <strong>for</strong> larger areas as are the time variations of X <strong>and</strong> Y (Eleman, 1966).<br />
The <strong>magnetic</strong> variations recorded at the Earth's surface are caused by two current<br />
systems. The first one, called external, is due to currents flowing in the ionosphere<br />
<strong>and</strong> magnetosphere. The other is induced by the variations of the external currents<br />
<strong>and</strong> is due to currents flowing in the conducting Earth.<br />
The amplitudes of the variations caused by these two current systems have the<br />
same order of magnitude. Generally, the effect of the external current system is a little<br />
bigger, but in some cases the variations due to induced internal currents, especially in<br />
the vertical component, may be larger. The external current system is far away from<br />
the point of observation because the current is flowing at a height not less than 100<br />
km. The internal currents may flow much closer, which is the reason why the internal<br />
part may be more inhomogeneous. Figure 9.1 is an example of such an<br />
inhomogeneity. It shows the recording of H, D <strong>and</strong> Z from nine stations placed 20 km<br />
from each other on a line crossing the Carpathian Arc. The shapes of the recordings<br />
of the horizontal components are rather similar. The amplitude of the H-component<br />
is higher at stations in the middle of the line. But the Z-component shows large<br />
differences from station to station <strong>and</strong> even a reversal in sign in the middle of the line.<br />
Very often a correlation between the H <strong>and</strong> Z variations can be seen, which means
9.1 Practical consequences<br />
- 181 -<br />
As stated above, the records of every <strong>observatory</strong> are influenced by induction<br />
effects <strong>and</strong> it is practically impossible to find a location having a "normal" induction<br />
effect representative <strong>for</strong> a large area. Observatory data are used <strong>for</strong> many kinds of<br />
studies. For some of them the induction part embedded in the data is not disturbing,<br />
<strong>for</strong> some it may be, <strong>and</strong> <strong>for</strong> some the induction part is what one wants to study. Below<br />
we discuss the influence of induction on some specific studies.<br />
1. Geo<strong>magnetic</strong> secular variation. Observatory annual mean values are used <strong>for</strong> the<br />
study of the secular variation. There<strong>for</strong>e, local induction effects are smoothed out <strong>and</strong><br />
the annual mean values are free from the local induction effects.<br />
2. Magnetic disturbances. The majority of these studies are based on correlations<br />
between solar activity, upper atmosphere dynamics, radio wave propagation, etc., <strong>and</strong><br />
<strong>for</strong> all these research areas local induction effects seem unimportant. In the study of<br />
the current systems causing the <strong>magnetic</strong> disturbances, however, the knowledge of<br />
the induced part in the recordings is essential.<br />
3. Magnetic activity indices. The distortion of the horizontal intensity by induction<br />
can influence the index describing <strong>magnetic</strong> activity. However, the most commonly<br />
used index K is supposed to be calculated after adopting a proper range <strong>for</strong> the index.<br />
The range is established so that it statistically agrees with the general pattern of the<br />
activity based on global network. There<strong>for</strong>e, the induction effect is at least partly<br />
taken into account in the choice of the range <strong>and</strong> is not substantially spoiling the<br />
activity index.<br />
4. Long-period variations (Sq <strong>and</strong> L). The effect of local induction decreases with·<br />
growing period. Due to this, the quiet solar (Sq) <strong>and</strong> lunar (L) variations are not<br />
seriously distorted by local induction. We have to realize, however, that they also<br />
have an induction part which is rather large, about one third of the variation, due to<br />
the highly conducting layers deep inside the Earth, but this effect is regular <strong>and</strong><br />
regional. According to model calculations, strong local induction anomalies may<br />
have some effect on the higher harmonics of the Sq, but it is not very pronounced.<br />
5. Reduction of <strong>magnetic</strong> survey data. For the accuracy of the field <strong>measurements</strong>,<br />
the induction effect both at the <strong>observatory</strong> <strong>and</strong> at the measuring point in the field<br />
measurement is harmful. The <strong>observatory</strong> data are used <strong>for</strong> the reduction of the<br />
survey data to epoch. During periods of disturbed <strong>magnetic</strong> field, the error in<br />
reduction due to local induction effects may be large, especially in the vertical<br />
component. As presented in this chapter (e.g., Figure 9.1), it is not possible to tell<br />
generally how far away the measuring area can be from the <strong>observatory</strong> to ensure a<br />
proper reduction. The only way to get good results in field <strong>measurements</strong> is to avoid<br />
<strong>magnetic</strong>ally disturbed times <strong>and</strong> to make long series of observations, thus smoothing<br />
out the induction effects. For <strong>magnetic</strong> surveys, a temporary recording station close
- 182-<br />
to the measuring area is recommended. Detailed in<strong>for</strong>mation on reduction is to be<br />
found in the <strong>Guide</strong> <strong>for</strong> Magnetic Repeat Station Surveys by Newitt et al. (1996).<br />
From all that has been described in this chapter we can conclude that<br />
o The recordings of practically every <strong>observatory</strong> are influenced by induction in the<br />
locally inhomogeneous Earth.<br />
o The vertical component is especially distorted. For some periods its phase can<br />
even be reversed.<br />
o The elongation of an induction anomaly is usually large, often amounting to<br />
hundreds of kilometers, much larger than the geological structure causing it.<br />
o The local induction effect decreases with increasing period of external field<br />
variations.<br />
o Among users of <strong>observatory</strong> data, those who use the data <strong>for</strong> reduction of field<br />
<strong>measurements</strong> should be most careful. Periods of high <strong>magnetic</strong> activity should<br />
be avoided in the <strong>measurements</strong>. A temporary <strong>magnetic</strong> recording station at the<br />
area of <strong>measurements</strong> is recommended.<br />
o Each <strong>magnetic</strong> <strong>observatory</strong> should have knowledge of the homogeneity of the<br />
field in its surroundings. One can per<strong>for</strong>m such studies even with one<br />
transportable <strong>magnetic</strong> recording station, by comparing recordings made some<br />
tens of kilometers from the <strong>observatory</strong> in different directions (see Jankowski et<br />
al., 1984; Kauristie et al., 1990a).
10. USEFUL CONTACTS AND ADDRESSES<br />
The International Council of Scientific Unions (ICSU) is an international<br />
non-governmental body which includes international Scientific Unions in its<br />
membership. The International Union of Geodesy <strong>and</strong> Geophysics (IUGG) is one<br />
such member. The International Association of Geomagnetism <strong>and</strong> Aeronomy,<br />
(<strong>IAGA</strong>) is one of the seven geophysical associations under the IUGG. The other<br />
associations are <strong>for</strong> geodesy (lAG), <strong>for</strong> seismology (IASPEI), <strong>for</strong> volcanology<br />
(IAVCEI), <strong>for</strong> meteorology (lAMAS), <strong>for</strong> hydrology (IAHS) <strong>and</strong> <strong>for</strong> oceanography<br />
(IAPSO).<strong>IAGA</strong> is the main coordinator of the collection of geo<strong>magnetic</strong> data. It has<br />
made many recommendations (resolutions) concerning <strong>magnetic</strong> observatories, the<br />
h<strong>and</strong>ling of the data, <strong>and</strong> making the data available. A collection of <strong>IAGA</strong>resolutions<br />
on <strong>magnetic</strong> observatories is to be found in Appendix Ill. In this chapter we list some<br />
addresses which may be useful in <strong>observatory</strong> practice.<br />
10.1 <strong>IAGA</strong>, the International Association of Geomagnetism <strong>and</strong> Aeronomy<br />
The International Association of Geomagnetism <strong>and</strong> Aeronomy is the best contact<br />
<strong>for</strong> questions concerning geo<strong>magnetic</strong> work. <strong>IAGA</strong> is the largest of the seven<br />
associations of the International Union of Geodesy <strong>and</strong> Geophysics (IUGG), which<br />
organizes a general assembly every four years. <strong>IAGA</strong> also meets in the middle of the<br />
period between the general assemblies of the union.<br />
lAG A has five divisions, namely<br />
o r Internal Magnetic Fields<br />
o II Aeronomic Phenomena<br />
o III Magnetospheric Phenomena<br />
o IV Solar Wind <strong>and</strong> Interplanetary Magnetic Field<br />
o V Observatories, Instruments, Surveys <strong>and</strong> Analyses<br />
<strong>and</strong> two InterDivisional Conunissions<br />
o History<br />
o Developing Countries<br />
Almost all matters discussed in this <strong>Guide</strong> are h<strong>and</strong>led by the <strong>IAGA</strong> Division V,<br />
which is further subdivided in special Working Groups (WG). The number of WG's<br />
is not fixed <strong>and</strong> may vary from <strong>IAGA</strong> meeting to meeting. Also the Chairman of
- 184 -<br />
Division V is usually changed every four years during the General Assemblies. The<br />
best contact <strong>for</strong> all <strong>IAGA</strong> matters is its Secretary General, who in fact is not<br />
permanent either, but usually serves several four-year periods. The names <strong>and</strong><br />
addresses of the Secretary General <strong>and</strong> of the Division Chairmen are to be found in<br />
lAG A News, which is published be<strong>for</strong>e <strong>and</strong> after each <strong>IAGA</strong> assembly <strong>and</strong> sent to<br />
most observatories <strong>and</strong> organizations responsible <strong>for</strong> observatories.<br />
In each member country of IUGG (78 member countries in 1994) there is a<br />
National Committee of IUGG, usually under the Academy of Sciences or its<br />
equivalent. This is a good local contact in <strong>IAGA</strong> matters <strong>and</strong> has the latest knowledge<br />
of <strong>IAGA</strong> officers, its Divisions <strong>and</strong> Working Groups <strong>and</strong> their leaders.<br />
Other good contacts are the World Data Centers (WDq <strong>for</strong> geomagnetism, which<br />
have permanent addresses. They are helpful <strong>and</strong> have specialists in different fields of<br />
<strong>IAGA</strong>. They can also help in finding proper <strong>IAGA</strong> contacts in special matters. The<br />
addresses of WDCs are listed below.<br />
10.2 World Data Centers<br />
The following World Data Centers collect geo<strong>magnetic</strong> data. Their duty is to<br />
protect the incoming data, to copy <strong>and</strong> reproduce data maintaining adequate<br />
st<strong>and</strong>ards of clarity <strong>and</strong> durability, to supply copies of data to other WDC's, to<br />
prepare catalogs of data, <strong>and</strong> to make data available to the scientific community. The<br />
biggest data centers, WDC A <strong>and</strong> WDC B2, collect geo<strong>magnetic</strong> data in all <strong>for</strong>ms:<br />
magneto grams on microfilm or microfiche, yearbooks, tabulations, <strong>and</strong> data in<br />
digital <strong>for</strong>m. The others are more specific in their data collection, as presented below.<br />
For all data:<br />
World Data Center A.<br />
NGDC, NOAA, Code FlGCI<br />
325 Broadway, Boulder, Colorado 80303, USA<br />
Tel: (1-303) 497-6513, (1-303) 497-6826<br />
Telex: 592811 NOAA MASC BDR<br />
Fax: (1-303) 497-6513<br />
Email: info@ngdc.noaa.gov
- 185 -<br />
World Data Center B2<br />
Russian Geophysical Committee, Academy of Sciences of Russia<br />
Molodezhnaya 3, Moscow 117 296, Russia<br />
Tel: (7-D95) 930-0546<br />
Telex: 411 478 SGC SU<br />
Fax: (7-095)930-5509<br />
Email: sgc@adonis.iasnet.com<br />
World Data Center D <strong>for</strong> Geophysics<br />
Institute of Geophysics, Academia Sinica<br />
Beijing, China<br />
Tel: (86--1) 2012497<br />
Telex: 22040 BAOAS CN<br />
For digital data:<br />
World Data Center C 1<br />
Division of Geophysics, Danish Meteorological Institute<br />
Lyngbyvej 100<br />
DK-2100 Copenhagen, Denmark<br />
Tel: (3) 4531291100<br />
Telex: 15835 GEOMI DK<br />
Fax: (3) 4531293400<br />
Email: or@dmi.min.dk<br />
For data needed <strong>for</strong> <strong>magnetic</strong> charts:<br />
World Data Center C 1 <strong>for</strong> Geomagnetism<br />
Geomagnetism Group, British Geological Survey<br />
Murchison House, West Mains Road<br />
Edinburgh EH9 3LA, Scotl<strong>and</strong>, U.K.<br />
Tel: (031) 667-1000<br />
Telex: 727343 WDDC C 1<br />
Fax: (031) 688-4368<br />
Email: d.kerridge@bgs.ac.uk
- 187 -<br />
The INTERMAGNET organization has, as presented in Chapter 7, Geo<strong>magnetic</strong><br />
In<strong>for</strong>mation Nodes (GIN), which collect one-minute <strong>magnetic</strong> data from<br />
observatories <strong>and</strong> distribute the data to customers (free of charge to observatories<br />
which are members of INTERMAGNET). The addresses of the GINs are<br />
USGS-USA:<br />
Donald C. Herzog<br />
U.S. Geological Survey<br />
Box 25046 MS 968<br />
Denver Federal Center, USA<br />
Fax: 1-303-273-8450<br />
Email: gotmanager@gldfs.er.usgs.gov<br />
IPG - France:<br />
Franr;:ois-Xavier Lalanne<br />
Institut de Physique du Globe de Paris, Departement des Observatoires<br />
75252 Paris Cedex 05, FRANCE<br />
Telephone: 33-1-44-27-49-27<br />
Fax: 33-1-44-27-24-01<br />
Email: par_manager@ipgp.jussieu.fr<br />
GSC - Canada:<br />
Gerrit Jansen van Beek<br />
Geological Survey of Canada<br />
National Geomagnetism Program<br />
1 Observatory Crescent<br />
Ottawa, Ontario, CANADA<br />
KIAOY3<br />
Telephone: 1-613-837-1067<br />
Fax: 1-613-824-9803<br />
Email: otLmanager@qnx4a.geolab.ernr.ca<br />
Japan:<br />
Toyohisa Kamei<br />
WDC-C2 <strong>for</strong> Geomagnetism<br />
Faculty of Science<br />
Kyoto University<br />
Kyoto 606, JAPAN<br />
Telephone: 81-75-753-3937<br />
Fax: 81-75-722-7884<br />
Email: toyo@kugi.kyoto-u.ac.jp
- 188 -<br />
BGS - Scotl<strong>and</strong>:<br />
Simon M. Flower<br />
Geomagnetism Group, British Geological Survey<br />
Murchison House, West Mains Road<br />
Edinburgh EH9 3LA, UK<br />
Telephone: 44-131-667-1000<br />
Fax: 44-131-668-4368<br />
Email: e..gin.manager@unixb.nerc-murchison.ac.uk<br />
Complete in<strong>for</strong>mation on INTERMAGNET is to be found in the INTERMAGNET<br />
Technical Reference Manual, which is available from the INTER MAGNET address<br />
above. The Technical Reference Manual also includes <strong>for</strong>ms <strong>for</strong> INTER MAGNET<br />
membership application.
11. MISCELLANEOUS<br />
Magnetic observatories are places where people expect to get infonnation <strong>and</strong><br />
advice on a variety of matters, more or less closely connected to geomagnetism. We<br />
there<strong>for</strong>e discuss below some of the most common items.<br />
11.1 Micro<strong>magnetic</strong>s<br />
Officers at a <strong>magnetic</strong> <strong>observatory</strong> are quite often approached by individuals or by<br />
institutions <strong>and</strong> asked to find buried objects. The proton magnetometer is a good <strong>and</strong><br />
rather sensitive instrument <strong>for</strong> that purpose <strong>and</strong> can detect an anomalous body even<br />
at depths of several meters or deeper, depending on the body <strong>and</strong> its size. its<br />
capabilities should not be overestimated, however. The fonnulas discussed in<br />
Appendix IV can be of some help in answering questions on whether or not the object<br />
is detectable applying the <strong>magnetic</strong> method. The infonnation about a hidden body is<br />
very often scarce, so that be<strong>for</strong>e <strong>measurements</strong> at the site one usually cannot be sure<br />
whether the anomaly can be revealed.<br />
In planning the <strong>measurements</strong> it is necessary to keep in mind that the depth of the<br />
anomalous body is always proportional to the width of the anomaly. In the case, <strong>for</strong><br />
example, when the body is buried only a few meters under the ground, as is typical at<br />
archeological sites, the distance between the measurement points should not be more<br />
than one meter. Because you can expect the anomaly to be small, only a few nT, data<br />
reduction is needed. If there is a <strong>magnetic</strong> <strong>observatory</strong> in the surroundings, its data<br />
may be used <strong>for</strong> the reduction. Another proton magnetometer, preferably a recording<br />
one, is best <strong>for</strong> the reduction. Another solution is to use a <strong>magnetic</strong> gradiometer,<br />
which consists of two sensors <strong>for</strong> the measurement of the vertical gradient.<br />
After concluding <strong>measurements</strong> in an area, it is necessary to draw a map. In the<br />
literature on geophysical prospecting, one can find descriptions on the interpretation<br />
of <strong>magnetic</strong> anomaly maps (e.g., Grant <strong>and</strong> West, 1965). In this connection, we can<br />
only detennine the location of the anomaly. We wish to stress that the maximum of<br />
the anomaly does not correspond exactly to the underground position of the body <strong>and</strong><br />
this is due to the fact that the <strong>magnetic</strong> field is nonnally not vertical.<br />
11.2 Geomagnetism <strong>and</strong> biology<br />
The present knowledge about the influence of the geo<strong>magnetic</strong> field <strong>and</strong> its<br />
variations on animals <strong>and</strong> human beings is very limited. People living in big cities<br />
experience variations of the <strong>magnetic</strong> field with amplitudes comparable to <strong>magnetic</strong><br />
storms all the time. No correlation has been found between human behavior <strong>and</strong> the
- 190-<br />
<strong>magnetic</strong> field. But there are so many modes of electro<strong>magnetic</strong> radiation with<br />
different frequencies that the question is still open.<br />
That some animals like pigeons use the geo<strong>magnetic</strong> field <strong>for</strong> navigation has been<br />
reported in the literature <strong>and</strong> some influence of the <strong>magnetic</strong> field on their navigation<br />
has been proved. Magnetic activity is reported to affect the navigation, <strong>and</strong><br />
observatories have been asked <strong>for</strong> in<strong>for</strong>mation on <strong>magnetic</strong> activity, because pigeons<br />
are claimed to be lost during high <strong>magnetic</strong> activity. Because modern technology<br />
allows continuous monitoring of the <strong>magnetic</strong> field <strong>and</strong> its activity, we recommend<br />
the observatories to be prepared to answer questions concerning <strong>magnetic</strong> activity.<br />
Some in<strong>for</strong>mation on this matter will be presented in a later section.<br />
Turtles have also been shown to utilize the <strong>magnetic</strong> field in finding the way from<br />
their place of birth in the Caribbean area to the Sargasso Sea. They are shown to use<br />
both declination <strong>and</strong> inclination in their navigation. Some bacteria living close to the<br />
bottom of seas seem to use the geo<strong>magnetic</strong> field to find their way to the bottom.<br />
11.3 Influence of <strong>magnetic</strong> activity on radio communications, satellites <strong>and</strong><br />
power lines<br />
The influence of big <strong>magnetic</strong> storms on radio communication has been well<br />
known <strong>for</strong> many decades. Short wave radio communication is in many cases<br />
impossible during <strong>magnetic</strong> storms, <strong>and</strong> the strong inhomogenous ionization of the<br />
low ionosphere in the polar cap area may totally prohibit radio communication<br />
through that area. During <strong>magnetic</strong> storms, auroras are seen in unusually low<br />
latitudes.<br />
Professional organizations have access to continuous ionospheric data, but radio<br />
amateurs often ask <strong>magnetic</strong> observatories about <strong>magnetic</strong> activity when they<br />
experience difficulties in their radio communications. Visual recording of the<br />
<strong>magnetic</strong> field is there<strong>for</strong>e important at the observatories, <strong>for</strong> the real time service if<br />
needed.<br />
The real-time knowledge of the behavior of the <strong>magnetic</strong> field has been needed<br />
sometimes in critical situations, when there has been power failure in large areas.<br />
Induced currents during an unusually strong <strong>magnetic</strong> storm have sometimes been<br />
the reason. To find the reason <strong>for</strong> a power failure the power companies often contact<br />
<strong>magnetic</strong> observatories. The automatic safety systems of rail ways are also shown to<br />
suffer from induced currents during severe <strong>magnetic</strong> storms. Some railway<br />
companies have even installed theit own monitors which give an alarm if the field<br />
shows unusual activity. Observatories could perhaps offer this service more cheaply<br />
<strong>and</strong> more professionally.<br />
Satellites are very important <strong>for</strong> modern society, <strong>and</strong> failures in their operation may
- 191 -<br />
cause trouble in many activities. During <strong>magnetic</strong> stonns, radio communications<br />
between satellites <strong>and</strong> ground stations may suffer. Control of the orientation of the<br />
satellites has in some occasions been lost due to missing instructions from the<br />
ground, <strong>and</strong> the satellites have started uncontrolled movement. During <strong>magnetic</strong><br />
storms also the upper layers of the atmosphere are heated by particle precipitation <strong>and</strong><br />
exp<strong>and</strong>. The exp<strong>and</strong>ed atmosphere increases friction on low-level satellites, thus<br />
shortening their lives <strong>and</strong> changing their orbits. Because of the known effects of the<br />
<strong>magnetic</strong> storms on satellite operations, observatories are the places where the<br />
satellite people expect to get an answer to the question whether the <strong>magnetic</strong> activity<br />
might be the cause of the observed trouble.<br />
Naturally, other conductors like telephone cables <strong>and</strong> gas pipelines also experience<br />
induced voltages during variations of the <strong>magnetic</strong> field, <strong>and</strong> <strong>observatory</strong> staff may<br />
be asked how much voltage can be expected between two earthing points. A very<br />
rough answer is several volts per kilometer in severe stonns, more at high latitudes<br />
<strong>and</strong> less at low latitudes. Lines in the E-W direction are more affected than the N-S<br />
lines, because the inducing currents in the ionosphere are mainly running E-W or vice<br />
versa, especially at high latitudes. In buried pipelines the induced voltage between<br />
the ground <strong>and</strong> the pipe accelerates corrosion. There<strong>for</strong>e, gas pipe-lines are usually<br />
kept at a lower potential than the surrounding ground.<br />
11.4 Prediction of <strong>magnetic</strong> activity<br />
Observatory staff are sometimes asked to predict <strong>magnetic</strong> activity, which is quite<br />
natural due to the many negative consequences of <strong>magnetic</strong> stonns discussed above.<br />
Sometimes predictions are asked <strong>for</strong> positive purposes also: tourists may ask <strong>for</strong> a<br />
suitable time to visit high latitudes to observe auroras.<br />
Un<strong>for</strong>tunately, the prediction of <strong>magnetic</strong> activity is very difficult. There are some<br />
statistical results: <strong>magnetic</strong> stonns are more probable during high solar activity,<br />
which means sunspot maximum time <strong>and</strong> especially the time a couple of years after<br />
the sunspot maximum. But a big <strong>magnetic</strong> storm may happen also during the lowest<br />
sunspot period. The equinoxes are more favorable <strong>for</strong> high <strong>magnetic</strong> activity than<br />
other parts of the year. Big <strong>magnetic</strong> stonns also have some tendency to be repeated<br />
in some fonn after 27 days, which is the time <strong>for</strong> the Sun to rotate so that the same<br />
active area of the Sun points towards the Earth again. Also the day following a stonn<br />
is very often rather active.
- 192-<br />
Table 11.1<br />
The solar activity report of 14 February 1994.<br />
15.02.1994 09 :11 :26 14FEB94]ORECAST. TEXT<br />
JOINT USAF/NOAA REPORT OF SOLAR AND GEOPHYSICAL ACTIVITY<br />
SDF NUMBER 045 ISSUED AT 2200Z ON 14 FEB 1994<br />
IA. ANALYSIS OF SOLAR ACTIVE REGIONS AND ACTIVITY FROM 13/2100Z<br />
TO 14/2100Z: SOLAR ACTIVITY WAS VERY LOW. REGION 7671 (N10E65)<br />
FEATURES A LARGE, DARK, SPOT EXTENDING OVER THREE DEGREES.<br />
lB. SOLAR ACTIVITY FORECAST: SOLAR ACTIVITY IS EXPECTED TO BE<br />
VERY LOW.<br />
IIA. GEOPHYSICAL ACTIVITY SUMMARY FROM 13/2100Z TO 14/2100Z:<br />
THE GEOMAGNETIC FIELD HAS BEEN AT UNSETTLED TO MINOR STORM<br />
LEVELS AT MID-LATITUDES AND MAJOR STORM LEVELS AT HIGH<br />
LATITUDES. THE STORM WHICH BEGAN 05 FEBRUARY CONTINUES AT HIGH<br />
LATITUDES, BUT APPEARS TO HAVE RECEDED AT MID-LATITUDES. THE<br />
ENERGETIC ELECTRON FLUX IS ELEVATED FOR THE SEVENTH DAY<br />
IN A ROW.<br />
lIB. GEOPHYSICAL ACTIVITY FORECAST: THE GEOMAGNETIC FIELD IS<br />
EXPECTED TO RANGE FROM UNSETTLED TO MINOR STORM FOR DAY ONE.<br />
THE FIELD IS EXPECTED TO RELAX TO MOSTLY UNSETTLED LEVELS<br />
FOR DAY TWO. A NEW CORONAL HOLE MAY DISTURB THE MAGNETIC FIELD<br />
ON DAY THREE.<br />
III. EVENT PROBABILITIES 15 FEB-17 FEB<br />
CLASS M 05/05/05<br />
CLASS x 01/01/01<br />
PROTON 01/01/01<br />
PCAF GREEN<br />
IV. PENTICTON 10.7 CM FLUX<br />
OBSERVED 14 FEB 101<br />
PREDICTED 15 FEB-17 FEB 100/105/105<br />
90 DAY MEAN 14 FEB 106<br />
V. GEOMAGNETIC A INDICES<br />
OBSERVED AFR/AP 13 FEB 030/028<br />
ESTIMATED AFR/AP 14 FEB 025/028<br />
PREDICTED AFR/AP 15 FEB-17 FEB 020/020-010/012-015/018<br />
VI. GEOMAGNETIC ACTIVITY PROBABILITIES 15 FEB-17 FEB<br />
A. MIDDLE LATITUDES<br />
ACTIVE<br />
MINOR STORM<br />
MAJOR-SEVERE STORM<br />
B. HIGH LATITUDES<br />
ACTIVE<br />
MINOR STORM<br />
MAJOR-SEVERE STORM<br />
35/25/30<br />
20/15/20<br />
05/05/05<br />
35/25/30<br />
25/15/20<br />
05/05/05
- 193 -<br />
Much work is going on <strong>for</strong> developing predictions of <strong>magnetic</strong> activity. For this<br />
purpose the Sun is monitored continuously by radio methods <strong>and</strong> by observing its<br />
spot areas <strong>and</strong> areas of eruptions. Using this in<strong>for</strong>mation a prediction of effects on<br />
radio communication <strong>and</strong> <strong>magnetic</strong> activity <strong>for</strong> the coming days is made every day in<br />
several countries, including USA, Canada, France, Australia, etc. The <strong>for</strong>ecast from<br />
USA (USAFINOAA) looks as shown in Table 11.1. The <strong>for</strong>ecast can be received<br />
from the Space Environment Center (SEC) in Boulder, Colorado, via electronic mail.<br />
Observatories are advised to get access to this in<strong>for</strong>mation, which may help in<br />
answering some normal requests in <strong>observatory</strong> routine. For <strong>observatory</strong> work itself<br />
this in<strong>for</strong>mation may be helpful, e.g., in planning absolute <strong>measurements</strong> in quiet<br />
field conditions or <strong>measurements</strong> in disturbed conditions <strong>for</strong> special purposes, like<br />
checking base-lines or orientations of the sensors, as presented in Chapter 8.
12. A FORWARD LOOK<br />
Looking back in time, <strong>and</strong> realizing the rapid development of instruments <strong>and</strong><br />
methods in geo<strong>magnetic</strong> work during the last two or three decades, it is unrealistic to<br />
believe that a prediction of the future would be correct. But based on the instruments<br />
of today <strong>and</strong> on the knowledge of requirements <strong>and</strong> possibilities to fulfil them, it is<br />
possible to imagine an ideal situation. We shall try to give such an idealistic view.<br />
12.1 Uses of geo<strong>magnetic</strong> data<br />
The dem<strong>and</strong> <strong>for</strong> <strong>magnetic</strong> data during the next twenty to thirty years looks similar<br />
to that at the time of the writing of this <strong>Guide</strong>. We see no clear change in the uses in<br />
science; the principal problems connected to core motions <strong>and</strong> dynamo theory still<br />
await solutions, as presented in the Introduction, <strong>and</strong> the dem<strong>and</strong> <strong>for</strong> data in<br />
connection with space physics <strong>and</strong> ionospheric studies will be similar or greater than<br />
it is today.<br />
Many scientific studies of ionospheric phenomena will need an up-to-date<br />
geo<strong>magnetic</strong> coordinate system, based essentially on a knowledge of the changes of<br />
the field obtained from <strong>observatory</strong> data.<br />
Future international geo<strong>magnetic</strong> reference fields (IGRF) <strong>and</strong> <strong>magnetic</strong> charts will<br />
need a knowledge of the secular variation, <strong>and</strong> the <strong>magnetic</strong> observatories will<br />
continue to provide that in<strong>for</strong>mation.<br />
In the near future, the main part of large-scale <strong>magnetic</strong> surveys will be probably<br />
made using low-altitude <strong>magnetic</strong> satellites. This requires a properly distributed<br />
network of <strong>magnetic</strong> observatories, <strong>for</strong> checking, calibration, <strong>and</strong> reduction. In the<br />
future, more local <strong>magnetic</strong> charts will also use the knowledge of secular variation<br />
based on <strong>observatory</strong> data <strong>for</strong> updating the charts.<br />
Global indices of <strong>magnetic</strong> activity <strong>and</strong> other parameters describing the <strong>magnetic</strong><br />
field will continue to be needed in the future <strong>for</strong> many applications. Increasingly,<br />
more timely production <strong>and</strong> dissemination of these indices <strong>and</strong> parameters are being<br />
dem<strong>and</strong>ed. Applications include satellite operations <strong>and</strong> experiments, where<br />
<strong>magnetic</strong>ally active periods contribute to enhanced drag, electrostatic charging, <strong>and</strong><br />
problems with radio telemetry. Knowledge of the state of the <strong>magnetic</strong> field is<br />
important <strong>for</strong> studies of induction effects on power systems <strong>and</strong> pipelines, <strong>and</strong> <strong>for</strong><br />
underst<strong>and</strong>ing problems in conventional radio communications.<br />
For navigational purposes, an up-to-date knowledge of the <strong>magnetic</strong> declination<br />
will be also needed in the future, as a safe <strong>and</strong> simple method complementing the<br />
more sophisticated systems.
- 195 -<br />
Observatory data may be used in seismically active areas to help in predicting<br />
earthquakes.<br />
Disturbances of the <strong>magnetic</strong> field seem to have biological effects. As mentioned<br />
in the previous chapter, pigeons seem to be sensitive to <strong>magnetic</strong> disturbances, <strong>and</strong><br />
current knowledge of the <strong>magnetic</strong> activity <strong>and</strong> predictions of the <strong>magnetic</strong> activity<br />
are shown to be valuable <strong>for</strong> the pigeon racers. Other biological specimens seem to<br />
utilize the Earth's <strong>magnetic</strong> field <strong>for</strong> orientation. Probably in the future the study of<br />
biological effects of <strong>magnetic</strong> fields <strong>and</strong> their variations will be intensified.<br />
12.2 Future instrumentation<br />
It is still an open question when a magnetometer <strong>for</strong> absolute <strong>measurements</strong> will be<br />
designed, which can measure <strong>and</strong> record automatically the variations of the field with<br />
a desired sampling rate. We believe that at least the main part if not all of the technical<br />
solution already exists. Some instruments already in use nearly fulfill the<br />
requirements. For the total field it is the proton magnetometer. For the components of<br />
the field, a vector proton magnetometer equipped with tilt recording may be the<br />
solution. Sufficiently fast sampling is possible using Overhauser proton<br />
magnetometers. Another solution might be the recording of D <strong>and</strong> I using the<br />
fluxgate orientations as in the absolute measurement of D <strong>and</strong> I by the fluxgate<br />
theodolite. Here the tilting should also be recorded.<br />
New magnetometers <strong>for</strong> <strong>observatory</strong> use will probably also become available,<br />
based on totally new techniques or techniques already available like cryogenic<br />
magnetometry (squid-magnetometers) or optical fibre.<br />
After the construction of instruments described above, the whole ideology of<br />
operation of <strong>magnetic</strong> observatories will change. More <strong>and</strong> more of them will<br />
probably be unmanned. The absolute <strong>measurements</strong> will be needed less frequently.<br />
The future variometer system is probably a box, not very heavy, which contains the<br />
magnetometers, their electronics, <strong>and</strong> a compensation <strong>for</strong> a possible tilting of the<br />
pillar. It has stable, thermostat-controlled temperature, in addition to good<br />
temperature compensation. The stations will be connected to a global telecommunication<br />
network <strong>and</strong> the data from all stations will be available in real time or in almost<br />
real time; the INTERMAGNET system is a good start in this direction. The global<br />
magnetometer system will have a common control <strong>and</strong> quality check. It will also<br />
have a common time system, so that all data are taken at the same times with an<br />
accuracy of 0.1 s.<br />
The trend of designing unmanned observatories is natural, but the authors of this<br />
<strong>Guide</strong> do not support this solution at present time, be<strong>for</strong>e the new stations are shown<br />
to fulfill the requirements of the scientific <strong>and</strong> other user communities. Up to now, the<br />
data from properly manned observatories are of superior quality compared to the data
- 196-<br />
from the partly manned ones. Additionally, the observatories with staff can be used<br />
<strong>for</strong> other duties, like calibration of <strong>magnetic</strong> instruments <strong>and</strong> training, etc.<br />
Actually we can see that technical solutions already exist <strong>for</strong> taking care of the<br />
problems of today's magnetometers. Most of the problems have been described in<br />
this <strong>Guide</strong>, namely<br />
0 temperature effects<br />
0 tilting of the pillars<br />
0 turning of the pillars<br />
0 changes of sensitivities<br />
0 timing<br />
0 quality control<br />
0 stability of the base-lines<br />
0 greater sampling rates<br />
0 greater dynamic ranges<br />
0 greater resolutions<br />
0 data processing<br />
0 transmission of data,<br />
but no single instruments exist in which all modern solutions have been utilized.<br />
Because of the relatively small number of recording variometer systems needed,<br />
maybe 1000 at most, <strong>and</strong> the continuous progress in technology, commercially-made<br />
complete systems will probably never be available, even in the future. There<strong>for</strong>e,<br />
recommendations by the rAGA will be of uppermost importance, steering the development<br />
of instruments, networks, data <strong>and</strong> the treatment <strong>and</strong> transmission of the data.<br />
In this <strong>Guide</strong>, we have described the instrumentation in use today. Referring to the<br />
list of problems given above, we will comment some of the items.<br />
The temperature effects should not be a problem anymore, because the electronics<br />
can be made insensitive to temperature variations, the coils in the sensors can be<br />
wound on frames having no temperature effect, <strong>and</strong> the whole system can stay in a<br />
stabilized temperature. Naturally, the temperature has to be recorded in spite of all<br />
automatic temperature compensations.
- 197 -<br />
The tilt of pillars can be compensated using suspended sensors, or it can be<br />
recorded <strong>and</strong> taken into account in data processing. Suitable tiltmeters are already<br />
available.<br />
The turning of the pillar can be reduced by the construction presented in this <strong>Guide</strong>.<br />
The turning is also easy to measure, <strong>for</strong> example, by observing a light beam reflected<br />
from a mirror fixed to the pillar. Gyroscopes can also be used; the modem ones are<br />
accurate enough. They are, however, <strong>magnetic</strong>, <strong>and</strong> have to be kept at a safe distance<br />
from the variometers. Absolute <strong>measurements</strong> naturally reveal the turning of the<br />
pillar.<br />
The sensitivities can be made very stable using high-quality parts in the electronics.<br />
This can also be checked automatically, say once a day, by applying an artificial field<br />
to the sensor.<br />
Timing is easy using automatic reception of time signals which are available from<br />
different sources almost all the time, as presented in this <strong>Guide</strong>.<br />
Quality control of data is possible at the <strong>observatory</strong> or from a remote place using<br />
logical tests in data processing, or by comparing to the nearby stations.<br />
The stability of the base-lines can only be checked using absolute <strong>measurements</strong>, if<br />
a really high accuracy is required. The instruments can be made very stable by using<br />
the best components available, leading to a drift of only one or two nT per year. A<br />
measurement with a proton magnetometer, in addition to the three recorded<br />
components, is a good verification, <strong>and</strong> with the view to the fact that the continuously<br />
recording proton magnetometers are becoming more <strong>and</strong> more reliable, they will be<br />
excellent instruments <strong>for</strong> this purpose.<br />
Higher sampling rates are already possible, even <strong>for</strong> digital recording of<br />
pulsations. The capacities of new data storage devices allow <strong>for</strong> the storing of very<br />
dense data, say tens of samples per second. Probably, the observatories should be<br />
prepared <strong>for</strong> this.<br />
The dynamic range should be great enough to record even the largest possible<br />
variations of the field. This is not a problem today.<br />
Achieving greater resolution, such as the value of 0.01 nT required to record<br />
<strong>magnetic</strong> pulsations, is no longer a problem. Although most fluxgates currently in<br />
use cannot achieve such a level, sufficiently sensitive flux gates do exist.<br />
Magnetometers that use other principles often have sufficient sensitivity. These<br />
include Overhauser proton magnetometers, optically pumped instruments (rubidium,<br />
cesium, helium), <strong>and</strong> some variometers that use classical sensors with electronic<br />
feedback. One important feature that some of these magnetometers possess is the
- 198 -<br />
ability to measure at high sensitivity over the whole range of frequencies recorded at<br />
an <strong>observatory</strong>.<br />
Data processing is not a problem, in situ or at a remote location, because all modem<br />
systems utilize microprocessors. Ready made programs may be difficult to flnd.<br />
Naturally, it would be an advantage if st<strong>and</strong>ard data <strong>for</strong>mats were available.<br />
The dissemination of data is already rather easy using electronic data links, <strong>and</strong> it<br />
is becoming easier <strong>and</strong> faster all the time, so that centralized real-time data collection<br />
is in principle already possible, <strong>and</strong> it will probably be normal routine in the near<br />
future.<br />
12.3 Network of observatories<br />
The global network of <strong>magnetic</strong> observatories is based on observatories which<br />
individual countries often set up long ago, to fulflll the local needs. Altogether, there<br />
are about 180 permanent observatories. The distribution of the observatories is not<br />
optimal from the point of view of field variations. Europe, <strong>for</strong> example, has a dense<br />
network, but very few observatories represent the large oceanic areas. The number of<br />
observatories in polar cap areas <strong>and</strong> in the equatorial belt is too scarce to monitor the<br />
variations in those areas where the spatial changes of the field are rapid.<br />
Permanent <strong>magnetic</strong> observatories have decreased in number during recent years.<br />
Increasing numbers of recording stations not supported by regular absolute<br />
<strong>measurements</strong> are in operation. The number of such stations is about four times<br />
higher than the number of permanent observatories (see, <strong>for</strong> example, Green, 1990).<br />
These variation stations are used in magnetospheric <strong>and</strong> ionospheric studies, in<br />
studies of conductivity, <strong>and</strong> in monitoring fleld variations in seismically active areas.<br />
At present, the accuracy of the data from these stations is lower than the accuracy<br />
from the observatories, but in the future the difference will decrease. Among those<br />
fleld stations there are also sea bottom magnetometers. Long term operation of these<br />
stations is difficult, but technically possible. Installation of sea bottom<br />
magnetometers as observatories is probably the most difficult problem to overcome,<br />
but the problems are of an economic rather than a technical nature.<br />
We hope that in the future data from variation stations will be transmitted to the<br />
same nodes as <strong>observatory</strong> data, to be accessible to the whole scientific community.<br />
This would be major progress given that the, number of variation stations is so high<br />
compared to the number of observatories, <strong>and</strong> knowing that <strong>for</strong> many studies the<br />
absolute long term stability of the observatories is not needed. Telecommunications<br />
should no longer be a problem, <strong>and</strong> will improve still further if today's progress<br />
continues.
- 199 -<br />
We also believe that, in the future, by applying the new techniques which make the<br />
observatories less expensive to build <strong>and</strong> run, the number of high quality stations in<br />
the critical areas can be increased. Technically it is already possible to have an ideal<br />
network of <strong>magnetic</strong> recording stations allover the world, equipped with ideal<br />
instruments. In practice, however, such a network may take time to develop,<br />
depending on the needs of, <strong>for</strong> example, satellite operations, <strong>and</strong> on the willingness<br />
of the international scientific community to contribute in the funding of the network.
13. LITERATURE<br />
Textbooks<br />
Bock, R., 1942. Praxis der magnetischen Messungen. Berlin.<br />
Bozorth, R.M., 1951. Ferromagnetism. von Norstad. New York.<br />
Chapman, S. <strong>and</strong> J. Bartels, 1940. Geomagnetism, Vol. I <strong>and</strong> II. Ox<strong>for</strong>d at the<br />
Clarendon Press.<br />
Fanselau, G. (ed.), 1959. Geomagnetismus undAeronomie, Vol. III, Vberdas aus der<br />
Erdinneren stammende MagnetfieLd, Veb Deutscher Verlag der Wissenschaften,<br />
Berlin.<br />
Fanselau, G. (ed.), 1960. Geomagnetismus und Aeronomie, VoL. II, Geomagnetische<br />
Instrumente und Messmethoden, Veb Deutscher Verlag der Wissenschaften,<br />
Berlin.<br />
Forbes, AJ., 1987. GeneraL Instrumentation. In: Ed. 1.A. Jacobs, Geomagnetism,<br />
Vol. I, Academic Press, London, 51-136.<br />
Gauss, C.E, 1839. Allgemeine Teorie des Erdmagnetismus. Leipzig.<br />
Gilbert, W., 1600. De magnete, <strong>magnetic</strong>isque corporibus et de magno magnete<br />
teLlure physioLogia nova, Gilbert Club, 1900. Revised English translation,<br />
Chiswick Press. London.<br />
Grant, ES. <strong>and</strong> G.E West, 1965. Interpretation Theory in Applied Geophysics.<br />
McGraw Hill, New York.<br />
Hazard, D.L., 1947. Directions <strong>for</strong> Magnetic Measurements, Third (1930) Editioncorrected<br />
1957. U.S. Department of Commerce, Coast <strong>and</strong> Geodetic Survey<br />
Serial No. 166.<br />
Jacobs, J.A. (ed.), 1987. Geomagnetism. Academic Press, London.<br />
L<strong>and</strong>au, L. <strong>and</strong> E. Lifshits, 1957. ELectrodynamics of Continuous Media. Moscow (in<br />
Russian; also translated into English <strong>and</strong> other languages).<br />
Laursen, V. <strong>and</strong> J. Olsen, 1971. CLassicaL methods of Geo<strong>magnetic</strong> Observations. In:<br />
Encyclopaedia of Physics. lll. Geophysics, 49/3, Springer Verlag, Berlin -<br />
Heidelberg - New York.<br />
Matsushita, S. <strong>and</strong> WH. Campbell, 1967. Physics of Geo<strong>magnetic</strong> Phenomena.<br />
Academic Press, New York.<br />
Mayaud, P.N., 1980. Derivation <strong>and</strong> Use of Geo<strong>magnetic</strong> Indices. Geophysical<br />
Monograph No. 22, Am. Geophys. Union Publication, Washington, D.C.<br />
McComb, H.E., 1952. Magnetic Observatory Manual. Pub!. U.S. Coast <strong>and</strong> Geodetic<br />
Survey, Spec. Pub!. 283. Washington.<br />
Menke, W., 1992. GeophysicaL Data AnaLysis. Discrete Inverse Theory. International<br />
Geophysical Series, Vol. 45; Academic Press.<br />
Needham, J., 1962. Science <strong>and</strong> Civilisation in China, Vo!. 4, Part I, Cambridge<br />
University Press, Cambridge, U.K.<br />
Newitt, L.R., C.E. Barton <strong>and</strong> 1. Bitterly, 1996. <strong>Guide</strong> <strong>for</strong> Magnetic Repeat Station<br />
Surveys, in press.
- 201 -<br />
Papoulis, A., 1962. Fourier Integral <strong>and</strong> its Applications. McGraw-Hill.<br />
Parkinson, W.D., 1983. Introduction to Geomagnetism. Scottish Academic Press,<br />
Edinburgh <strong>and</strong> London.<br />
Samson, J .e., 1991. Geo<strong>magnetic</strong> Pulsations <strong>and</strong> Plasma Waves in the Earth's<br />
Magnetosphere. In: Ed. J.A. Jacobs, Geomagnetism, Vol. 4, Academic Press,<br />
London, 481-592.<br />
Temple, R.K.G., 1986. China L<strong>and</strong> of Discovery <strong>and</strong> Invention. Multimedia Publications<br />
(UK) Ltd.<br />
Wienert, K.A., 1970. Notes on Geo<strong>magnetic</strong> Observatory <strong>and</strong> Survey Practice. Publ.<br />
UNESCO, Brussels (also in French edition).<br />
Wiese, H., H. Schmidt, 0. Lucke <strong>and</strong> F. Frolich, 1960. Geomagnetische Instrumente<br />
und Messmethoden. In: Ed. G. Fanselau, Geomagnetismus und Aeronomie,<br />
Vol. IT, Veb Deutscher Verlag der Wissenschaften, Berlin.<br />
Yanowskiy, B.M., 1953. Earth Magnetism. Gosizd. Tekh.-Teor. Literatury, Moskva<br />
(in Russian).<br />
Yanowskiy, B.M., 1963-1964. Earth Magnetism, Vol. 1 <strong>and</strong> 2, Izd. Lening. Univ.,<br />
Leningrad (in Russian).<br />
Yanowskiy, B.M., 1978. Earth Magnetism. Izd. Lening. Univ., Leningrad (in Russian).<br />
Papers<br />
AHdred, 1.e. <strong>and</strong> I. Scollar, 1967. Square cross-section coils <strong>for</strong> the production of<br />
uni<strong>for</strong>m <strong>magnetic</strong> fields. 1. Sci. Instrum., 44, 755-760.<br />
Aschenbrenner, H. <strong>and</strong> G. Gaubau, 1936. Eine Anordnung zur Registrierung rascher<br />
magnetischen StOrungen. Hochfreq. Tech. Elektroakust. 47, 177-18l.<br />
Beblo, M., 1990. A digital magnetometer system using conventional variometers <strong>and</strong><br />
opto-electronic converters. Phys. Earth Planet. Int., 59, 1-2,82-88.<br />
Bennett, G.G., 1980. A solar ephemeris <strong>for</strong> use with programmable calculators. The<br />
Australian Surveyor, 30,3.<br />
Biel, H.A. von, 1990. The geo<strong>magnetic</strong> time <strong>and</strong> position of a terrestrial station. 1.<br />
Atmospheric Terrestrial Phys., 52, 9, 687-694.<br />
Bitterly, J., 1.M. Cantin, R. Schlich, J. Folques, <strong>and</strong> D. Gilbert, 1984. Portable<br />
magnetometer theodolite with fluxgate sensor <strong>for</strong> Earth's <strong>magnetic</strong> field component<br />
<strong>measurements</strong>. Geophysical Surveys, 6, 233-239.<br />
Bobrov, Y.N., 1962. Series of quartz <strong>magnetic</strong> variometers. Geomagn. i Aeronom.<br />
2.2, 348-356, (in Russian).<br />
Breiner, S., 1973. Applications manual <strong>for</strong> portable magnetometers. GeoMetrics,<br />
Sunnyvale, Cali<strong>for</strong>nia.<br />
Clarke, 1., 1993. SQUIDs: Theory <strong>and</strong> Practice. In: The New Superconducting<br />
Electronics, Eds. H. Weinstock <strong>and</strong> R.w. Ralston, Kluwer Academic Publishers,<br />
Netherl<strong>and</strong>, 123-180.<br />
Clarke 1., 1994. SQUIDs: Scientific American, 271, 2, 36-43.
- 203-<br />
Jankowski, J., J. Marianiuk, A. Ruta, C. Sucksdorff <strong>and</strong> N. Kivinen, 1984. Long-tenn<br />
stability of a torque balance variometer with photo-electric converters in<br />
practice, Geoph. Surveys, 6, 367-380.<br />
Jankowski, J., R. Pirjola <strong>and</strong> T. Ernst, 1986. Homogeneity of <strong>magnetic</strong> variations<br />
around the Nunnijfuvi Observatory, Geophysica, 22, 45-58.<br />
Kauristie, K., T. Ernst, 1. Jankowski, A. Viljanen, 1. Kultima <strong>and</strong> R. Pirjola, 1990a.<br />
Homogeneity of geo<strong>magnetic</strong> variations at the Sodankyla Observatory, Pub!.<br />
of Sodankyla Observatory, 76.<br />
Kauristie, K., C. Sucksdorff <strong>and</strong> H. Nevanlinna (eds.), 1990b. Proceedings of the<br />
International Workshop on Geo<strong>magnetic</strong> Observatory Data Acquisition <strong>and</strong><br />
Processing. Nurmijarvi Geophysical Observatory, Finl<strong>and</strong>, May 15-25, 1989.<br />
Finnish Meteorological Institute, Geophysical Publications, 15, Helsinki.<br />
Kerridge, D., 1985. An assessment of a portable fluxgate declinometer <strong>and</strong> inclinometer.<br />
Geomagn. Res. Group Report, 84/15. BGS Edinburgh.<br />
Kring Lauridsen, E. , 1977. The QHM. Contributions to the theory <strong>and</strong> practice of the<br />
Quartz Horizontal Magnetometer. Danish Meteorological Institute, Geophysical<br />
Papers, R-50, 1-87.<br />
Kring Lauridsen, E., 1980. Absolute <strong>measurements</strong> with proton magnetometers in<br />
stationary coils. Danish Meteorological Institute, Geophysical Papers, R-57.<br />
Kring Lauridsen, E., 1981. QD: a quarz declinometer of the classical type. Danish<br />
Meteorological Institute, Geophysical Papers, R-65, 1-27.<br />
Kring Lauridsen, E., 1985. Experience with the DI-fluxgate magnetometer inclusive<br />
theory of the instrument <strong>and</strong> comparison with other methods. Danish Meteorological<br />
Institute, Geophysical Papers, R-71.<br />
Langel, R.A., 1991. International Geo<strong>magnetic</strong> Reference Field, 1991 Revision. 1.<br />
Geomag. Geoelectr., 43,1007-1012.<br />
Marianiuk, 1., 1977. Photoelectric converter <strong>for</strong> recording the geo<strong>magnetic</strong> field<br />
elements: construction <strong>and</strong> principle of operation. Pubis. Inst. Geophys.<br />
Polish Acad. Sc., C-4 (114), 57-82.<br />
Marianiuk, J., A. Gnoinski <strong>and</strong> A. Szymanski, 1978. Recording of geo<strong>magnetic</strong> field<br />
elements with a photo-electric magnetometer. Pubis. Inst. Geophys. Polish<br />
Acad. Sc., C-5 (125), 57-76.<br />
Marianiuk, 1.A. <strong>and</strong> P. Oberc, 1976. Measurement of H, Z, F <strong>and</strong> D with proton<br />
magnetometer at the Belsk Geophysical Observatory. Pubis. Inst. Geophys.<br />
Polish Acad. Sc., 88, 59-85.<br />
Meloni, A., F. Molina, P. Palangio, Q. Taccetti <strong>and</strong> Anna de Santis, 1984. Automatic<br />
digital recording of geo<strong>magnetic</strong> elements by means of proton precession<br />
magnetometer. Geophys. Surveys, 6, 339-350.<br />
MenvieIIe, M., N. PapitashviIi, L. Hakklnen <strong>and</strong> C. Sucksdorff, 1995. Computer<br />
production of K-indices: Review <strong>and</strong> comparison of methods. Geophys. 1.<br />
International, 123, 866-886.<br />
Nevanlinna, H., 1. Ryno, G.Y. Haines <strong>and</strong> K. Borg, 1988. Spherical cap harmonic<br />
analysis applied to the Sc<strong>and</strong>inavian geo<strong>magnetic</strong> field 1985.0, Dt. Hydrogr.<br />
2.,41,177-186.
- 204-<br />
Newitt, L.R. <strong>and</strong> C.E. Barton, 1995. The position of the north <strong>magnetic</strong> dip pole in<br />
1994. Submitted to 1. Geomag. Geoelectr.<br />
Nowozynski, K., T. Ernst <strong>and</strong> 1. Jankowski, 1991. Adaptive smoothing method <strong>for</strong><br />
computer derivation of K-indices. Geophys. 1. Int., 104, 85-93.<br />
Overhauser, A.W., 1953. Para<strong>magnetic</strong> relaxation in metals. Phys. Rev., 89, 689-700.<br />
Parkinson, W.D.,1962. The influence of continents <strong>and</strong> oceans on geo<strong>magnetic</strong><br />
variations. Geophys. 1. Roy. Astron. Soc., 6,441-449.<br />
Payne, M.A., 1981. SI <strong>and</strong> Gaussian CGS units, conversions <strong>and</strong> equations <strong>for</strong> use in<br />
geomagnetism. Phys. Earth Planet. Int., 26,10-16.<br />
Pesonen, LJ., H. Nevanlinna, M. Leino <strong>and</strong> 1. Ryno, 1993. The Earth's Magnetic<br />
Field Charts of 1990.0. In: XVI Convention on Geophysics <strong>and</strong> Remote<br />
Sensing. Pub!. Geophys. Soc. of Finl<strong>and</strong>, 175-180.<br />
Primdahl, F., 1979. The Fluxgate Magnetometer. Danish Meteorological Institute,<br />
Geophysical Papers, R-55.<br />
Provisional Atlas of Rapid Variations (1959), Symposium de 1'lAGA sur les variations<br />
rapides geomagnetiques et telluriques. In: Annals of the International<br />
Geophysical Year, Vol. II B, Pergamon Press, London-New York-Paris, 694-<br />
709.<br />
Rasmussen, 0., <strong>and</strong> E. Kring Lauridsen, 1990. Improving baseline drift in fluxgate<br />
magnetometers caused by foundation movements, using b<strong>and</strong> suspended<br />
fluxgate sensors. Phys. Earth Planet. Int., 59, 78-81.<br />
Robinson, P.R., 1983. Improvements to the system of four equiradial coils <strong>for</strong><br />
producing a uni<strong>for</strong>m <strong>magnetic</strong> field. J. Phys., 16, 1, 39-42.<br />
Serson, S.H., 1973. Instrumentation <strong>for</strong> induction studies on l<strong>and</strong>. Phys. Earth Planet<br />
Int., 7,313-322.<br />
Serson, S.H., 1974. Compact bias coil systems <strong>for</strong> geo<strong>magnetic</strong> <strong>measurements</strong>, Publ.<br />
Earth Phys. Branch, 44, 10, Ottawa.<br />
Shtamberger, G .A., 1972. Devices <strong>for</strong> creation of weak <strong>magnetic</strong> fields, Izd.<br />
"Nauka", Sibirskoe Otdelenie, Novosibirsk (in Russian).<br />
Skripov, F.1.,1958. A nuclear <strong>magnetic</strong> resonance generator in the earth's <strong>magnetic</strong><br />
field. Soviet Phys. Doklady, 3, 806-808.<br />
Stuart, w.F., 1972. Earth's field magnetometry, Rep. Prog. Phys., 35, 803-881.<br />
Simonov, G.Y., 1963. Geo<strong>magnetic</strong> Time. Geophys. J. Roy. Astron. Soc., 8,258-267.<br />
Trigg, D.F. <strong>and</strong> R.L. Coles (eds.), 1994. INTERMAGNET Technical Reference<br />
Manual, Ottawa.<br />
Trigg, D.F., 1970. A portable D <strong>and</strong> I magnetometer. Earth Physics Branch, Geo<strong>magnetic</strong><br />
Report, 70-3. Energy Mines <strong>and</strong> Resources, Ottawa, Canada.<br />
Trigg, D.F. <strong>and</strong> D.G. Olson, 1990. Pendulously suspended magnetometer sensors.<br />
Rev. Sci. Instrum., 61 (10),2632-2636.<br />
Wiese, H., 1962. Geomagnetische Tiefentellurik. Geophys. Pura e Appl., 52, 83-<br />
103.<br />
Zyganenko, N.A., 1989. Magnetospheric <strong>magnetic</strong> field model with a warped tail<br />
current sheet. Planet. Space Sci., 37, 5.
APPENDIX I<br />
MAGNETIC OBSERVATORIES<br />
Listed below are <strong>magnetic</strong> observatories in operation at the beginning of 1993,<br />
according to the in<strong>for</strong>mation available at the World Data Center A. The WDC has<br />
also complete lists of addresses of the observatories <strong>and</strong> of organizations running the<br />
observatories. The names of the responsible persons are in most cases available at the<br />
WDC (<strong>for</strong> the address of the WDC see Chapter 10). For the addresses of the<br />
observatories, please contact World Data Center A. The last two colwnns give the<br />
fIrst <strong>and</strong> the last years <strong>for</strong> which values are available from the WDC's. The data from<br />
most observatories are available via Internet.<br />
MNEMONIC NAME q> A<br />
YEAR<br />
.FIRST LAST<br />
ALE ALERT 82 0 30' 297 0 39' 1962.5 1992<br />
HIS<br />
HEISS ISLAND<br />
(DRUZHNAYA)<br />
80 37 58 3 1960.5 1992<br />
NAL NEWALESUND 78 55 11 56 1966.5 1991<br />
CCS CAPE CHELYUSKIN 77 43 104 17 1935.5 1992<br />
THL THULE (QANAQ) 77 28 290 46 1956.5 1993<br />
HRN HORNSUND 77 0 15 33 1979.5 1989<br />
MBC MOULD BAY 76 12 240 36 1963.5 1993<br />
RES RESOLUTE BAY 74 42 265 6 1952.5 1993<br />
BJN2<br />
BEAR ISLAND 2<br />
(BJORNOYA)<br />
74 30 19 0 1951.5 1993<br />
DIK DIKSON ISLAND 73 33 80 34 1933.5 1992<br />
TIK TIKSI 71 35 129 0 1944.5 1992<br />
BRW POINT BARROW 71 18 203 15 1933.2 1992<br />
TRO TROMSO 69 40 18 56 1930.5 1993<br />
GDH2 GODHAVN2 69 15 306 28 1976.5 1993<br />
CBB CAMBRIDGE BAY 69 6 255 0 1972.5 1993<br />
ABK ABISKO 68 22 18 49 1921.5 1991<br />
MMK LOPARSKAYA 68 15 33 5 1961.5 1988<br />
KIR KIRUNA 67 48 20 24 1965.5 1993<br />
SOD SODANKYLA 67 22 26 38 1914.5 1993
- 206-<br />
MNEMONIC NAME qJ<br />
CWE<br />
UELEN<br />
(CAPE WELLEN)<br />
}.,<br />
YEAR<br />
FIRST LAST<br />
66 0 10' 190 0 10' 1933.5 1992<br />
CM02 COLLEGE 2 64 52 212 10 1948.5 1992<br />
ARK ARKHANGEL'SK 64 35 40 30 1985.5 1992<br />
BLC BAKER LAKE 64 20 263 58 1952.5 1993<br />
LRV LEIRVOGUR 64 11 338 18 1958.5 1993<br />
YKC2 YELLOWKNIFE 2 62 28 245 32 1975.5 1993<br />
DOB2 DOMBAS2 62 4 9 7 1952.5 1993<br />
YAK YAKUTSK 62 1 129 43 1931.5 1991<br />
POD<br />
PODKAMENNAYA<br />
TUNGUSKA<br />
61 36 90 0 1969.5 1992<br />
NAQ N ARSSARSSU AQ 61 10 314 34 1968.0 1993<br />
NUR NURMIJARVI 60 31 24 39 1953.5 1993<br />
LER LERWICK 60 8 358 49 1923.5 1993<br />
MGD<br />
LNN<br />
STEKOLNYY<br />
(MAGADAN)<br />
VOEIKOVO<br />
(LENINGRAD)<br />
60 7 151 1 1966.5 1992<br />
59 57 30 42 1948.5 1990<br />
LOV LOVO 59 21 17 50 1930.5 1991<br />
FCC FORT CHURCHILL 58 46 265 55 1964.5 1993<br />
BOX BOROK 58 2 38 58 1977.5 1990<br />
SITI SITKA 2 57 4 224 41 1940.5 1992<br />
ARS ART! 56 26 58 34 1973.5 1992<br />
KZN<br />
ZAYMISHCHE<br />
(RAIFA)<br />
55 50 48 51 1915.5 1992<br />
BFE BRORFELDE 55 38 11 40 1980.5 1993<br />
KRASNAYA<br />
MOS PAKHRA 55 28 37 19 1930.5 1991<br />
(MOSCOW)<br />
ESK ESKDALEMUIR· 55 19 356 48 1908.5 1993<br />
PBQ<br />
NVS<br />
POSTE-DE-LA-<br />
BALEINE<br />
KLYUCHI<br />
(NOVOSIBIRSK)<br />
55 18 282 15 1985.5 1992<br />
55 2 82 54 1967.5 1992
- 207-<br />
MNEMONIC NAME
- 208-<br />
MNEMONIC NAME qJ A<br />
YSS<br />
YUZHNO-<br />
SAKHALINSK<br />
YEAR<br />
FIRST LAST<br />
46 0 57' 142 0 43' 1941.5 1990<br />
THY TIHANY 46 54 17 54 1955.5 1990<br />
ODE STEPANOVKA 46 47 30 53 1936.5 1992<br />
CTS<br />
CASTELLO<br />
TESINO<br />
46 3 11 39 1965.5 1992<br />
NKK NOVOKAZALINSK 45 46 62 7 1974.5 1992<br />
OTT OTTAWA 45 24 284 27 1969.5 1993<br />
SUA SURLARI 44 68 26 25 1949.5 1993<br />
GCK GROCKA 44 38 20 46 1958.5 1993<br />
CNH2<br />
CHANGCHUN2<br />
(HELONG)<br />
44 3 125 12 1979.5 1990<br />
MMB MEMAMBETSU 43 55 144 12 1950.5 1993<br />
WMQ<br />
URUMQI<br />
(WULUMUCHI)<br />
43 49 87 42 1978.5 1990<br />
GORNOTAYOZH-<br />
VLA NAYA 43 41 132 10 1958.5 1992<br />
(VLADIVOSTOK)<br />
AAA ALMA-ATA 43 15 76 55 1965.5 1992<br />
PAG PANAGYURISHTE 42 31 24 11 1948.5 1991<br />
AQU L'AQUILA 42 23 13 19 1960.5 1993<br />
TFS DUSHETI (TBILISI) 42 5 44 42 1938.5 1992<br />
TKT YANGI-BAZAR 41 20 69 37 1964.5 1992<br />
ISK<br />
KANDILLI<br />
(ISTANBUL)<br />
41 4 29 4 1946.5 1992<br />
EBR EBRO (TORTOSA) 40 49 o 30 1905.5 1983<br />
BMT<br />
cor<br />
BEllINGMING<br />
TOMBS<br />
COIMBRA (ALTO<br />
DABALEIA)<br />
40 18 116 12 1991.5 1992<br />
40 13 351 35 1876.5 1993<br />
BOU BOULDER 40 8 254 46 1964.5 1992<br />
BJI PEKING 2 (BEllING) 40 2 116 11 1957.5 1990<br />
ANK ANKARA 39 53 32 46 1986.5 1992
- 209-<br />
MNEMONIC NAME
- 210-<br />
MNEMONIC NAME q> A<br />
YEAR<br />
FIRST LAST<br />
JAI JAIPUR 26° 55' 75° 48' 1976.5 1987<br />
SHL SHILLONG 25 34 91 53 1976.5 1991<br />
LNP LUNPING 25 0 121 10 1966.5 1993<br />
KRC KARACHI 24 57 67 8 1985.5 1993<br />
UJJ UJJAIN 23 11 75 47 1976.5 1990<br />
GZH GUANGZHOU 23 6 113 21 1958.5 1990<br />
HVN3 HAVANA 2 22 59 277 41 1984.5 1984<br />
TAM TAMANRASSET 22 48 5 32 1933.5 1991<br />
CPA CHAPA 22 21 103 50 1955.5 1991<br />
HON3 HONOLULU 3 21 19 202 0 1961.5 1992<br />
TEO TEOLOYUCAN 19 45 260 49 1919.5 1993<br />
ABG ALIBAG 18 38 72 52 1904.5 1992<br />
S102<br />
SAN JUAN 2<br />
(PUERTO RICO)<br />
18 7 293 51 1965.5 1992<br />
HYB HYDERABAD 17 25 78 33 1966.5 1991<br />
MBO M'BOUR 14 24 343 3 1953.5 1991<br />
MDT MUNTINLUPA 14 23 121 1 1951.5 1987<br />
GUA GUAM 13 35 144 52 1957.5 1992<br />
DLT DALAT 11 55 108 25 1978.5 1992<br />
ANN<br />
ANNAMALAINA-<br />
GAR<br />
11 22 79 41 1958.5 1991<br />
CHIRIPA<br />
SNJ (TILARAN, 10 26 275 5 1985.5 1986<br />
COSTA RICA)<br />
KOD KODAlKANAL 10 14 77 28 1902.5 1993<br />
ETT ETAIYAPURAM 9 10 78 1 1980.5 1987<br />
AAE ADDIS ABABA 9 2 38 46 1958.5 1989<br />
TRD2 TRIVANDRUM 2 8 29 76 57 1958.5 1992<br />
FUQ FUQUENE 5 28 286 16 1955.5 1993<br />
BNG BANGUI 4 26 18 34 1955.5 1991<br />
TUN TUNTUNGAN 3 31 98 34 1982.5 1987<br />
TTB2 TATUOCA2 -1 12 311 29 1958.5 1992
- 211 -<br />
MNEMONIC NAME qJ A<br />
YEAR<br />
FIRST LAST<br />
NAI NAIROBI -1 0 20' 36 0 49' 1965.5 1980<br />
TNG TANGERANG -6 \0 106 38 1964.5 1992<br />
ASC<br />
ASCENSION<br />
ISLAND<br />
-7 57 345 37 1993.5 1993<br />
LUA3 LUANDA BELAS -8 55 13\0 1958.5 1993<br />
PMG PORT MORESBY -9 24 147 9 1959.5 1992<br />
ANC ANCON -11 46 282 51 1991.5 1992<br />
API APIA -13 48 188 14 1905.5 1992<br />
NMP NAMPULA -15 5 39 15 1983.5 1984<br />
PTY PATACAMAYA -17 15 292 3 1983.5 1991<br />
PPT<br />
TAN<br />
PAMATAI<br />
(PAPEETE)<br />
TANANARIVE<br />
(ANTANANARIVO)<br />
-17 34 210 25 1968.5 1992<br />
-18 55 47 33 1890.5 1993<br />
TSU TSUMEB -19 12 17 . 35 1965.5 1992<br />
CTA<br />
CHARTERS<br />
TOWERS<br />
-20 5 146 15 1985.5 1993<br />
LQA LAQUlACA -22 6 294 24 1920.5 1992<br />
LRM LEARMONTH -22 13 114 6 1987.5 1993<br />
VSS VASSOURAS -22 24 316 21 1915.5 1993<br />
ASP ALICE SPRINGS -23 46 133 53 1993.5 1993<br />
HBK HARTEBEESTHOEK -25 53 27 42 1973.5 1993<br />
MAPUTO<br />
LMM (LOURENCO -25 55 32 35 1960.5 1986<br />
MARQUES)<br />
PIL PILAR -31 40 296 7 1905.5 1989<br />
GNA GNANGARA -31 47 115 57 1959.5 1993<br />
HER HERMAN US -34 25 19 14 1941.5 1993<br />
LAS LAS ACACIAS -35 0 302 19 1962.5 1992<br />
CNB CANBERRA -35 19 149 22 1979.5 1993<br />
AMSTERDAM<br />
AMS ISLAND (MARTIN -37 50 77 34 1982.5 1993<br />
DE VIVIES)
- 212-<br />
MNEMONIC NAME qJ<br />
A<br />
YEAR<br />
FIRST LAST<br />
TRW2 TRELEW2 _43 0 16' 294 0 37' 1971.5 1991<br />
EYR EYREWELL -43 25 172 21 1979.5 1993<br />
CZT<br />
PAP<br />
MCQ<br />
PORT ALFRED<br />
(CROZET)<br />
PORT-AUX-<br />
FRANCAIS<br />
MACQUARIE<br />
ISLAND<br />
-46 26 51 52 1974.5 1993<br />
-49 21 70 16 1988.5 1993<br />
-54 30 158 57 1950.7 1993<br />
ARC ARCTOWSKI -62 10 301 31 1979.5 1989<br />
ARGENTINE<br />
AlA ISLANDS -65 15 295 44 1958.5 1991<br />
(FARADAY)<br />
MIR MIRNYY -66 33 93 1 1956.5 1992<br />
DRV<br />
DUMONT<br />
D'URVILLE<br />
-66 40 140 1 1958.5 1993<br />
MAW MAWSON -67 36 62 53 1956.5 1993<br />
MOL MOLODYOZHNAYA -67 40 45 51 1965.5 1992<br />
SYO SYOWA STATION -69 0 39 35 1958.5 1994<br />
NVL<br />
NOVOLAZAREV-<br />
SKAYA<br />
-70 46 11 49 1962.5 1987<br />
SBA SCOTT BASE -77 51 166 47 1958.5 1993<br />
VOS VOSTOK -78 27 106 52 1958.5 1991
APPENDIX II<br />
SI AND GAUSSIAN UNITS IN GEOMAGNETIC PRACTICE<br />
Today the recommended system of units in all physics is the so-called SI-system (SI<br />
<strong>for</strong> International System of Units), adopted by <strong>IAGA</strong> at the Kyoto General Assembly<br />
in 1973 <strong>for</strong> use in geomagnetism. The previous CGS-system (CGS <strong>for</strong> centimeter,<br />
gram <strong>and</strong> second) is still used by some authors. In the CGS-system the unit of<br />
<strong>magnetic</strong> induction B is gauss (G) <strong>and</strong> the unit <strong>for</strong> <strong>magnetic</strong> field strength H is<br />
oersted (Oe). In free space the numerical values of these units are the same. For<br />
practical purposes, a smaller unit <strong>for</strong> the <strong>magnetic</strong> field strength, gamma (gamma =<br />
r = 10- 5 Oe), was used <strong>and</strong> is still in some use.<br />
The SI-system is based on meters (m), kilograms (kg), seconds (s) <strong>and</strong> amperes<br />
(A). In the SI-system the unit of <strong>magnetic</strong> induction is tesla (T), <strong>and</strong> that of <strong>magnetic</strong><br />
field strength is AIm (l AIm = 4n 10- 3 Oe "" 1257 y). In vacuum, 1 nanotesla (nT)<br />
corresponds to 1 gamma (y).<br />
At present there seems to be no acceptable agreement on whether B or H is the<br />
fundamental <strong>magnetic</strong> field. The relation between B<strong>and</strong> H can be expressed in the<br />
SI-system as<br />
or<br />
(II. 1 )<br />
(II.2)<br />
where M is magnetization, <strong>and</strong> J is called <strong>magnetic</strong> polarization. In the CGS system<br />
there is no difference between M <strong>and</strong> J (B = H + 4nM, or B = H + 4rrJ); <strong>IAGA</strong><br />
recommends the use of <strong>for</strong>mula (II. 1 ). As a matter of fact, in the majority of modem<br />
physics textbooks only this <strong>for</strong>mula is given, <strong>and</strong> the term <strong>magnetic</strong> polarization is<br />
not used. More detailed comparisons including the fundamental equations in electromagnetism<br />
in the two systems of units have been given by Payne (1981). The tables<br />
below are mainly based on this paper.
Tenn Symbol<br />
Magnetic induction B<br />
Magnetic field strength H<br />
Magnetization M<br />
Magnetic polarization 1<br />
Magnetic dipole moment m<br />
Magnetic flux<br />
cp<br />
Penneability of free space J.4J<br />
SI unit<br />
Table 11.1<br />
Fundamental <strong>magnetic</strong> terms<br />
Gaussian<br />
CGS unit<br />
tesla (T) = kg A-I S-2 gauss<br />
(G)<br />
Am-I oersted<br />
(Oe)<br />
Am-I emu cm- 3 =J G<br />
tesla (T) emu cm- 3 = J G<br />
Am2 emu =JGcm 3<br />
weber (Wb) = kg m 2 A-I S-2 maxwell<br />
(Mx)<br />
H m- I = kg m A2 S-2 I<br />
Description<br />
The field which causes a <strong>for</strong>ce to act on a moving<br />
charged particle<br />
The field which occurs as a result of the vector<br />
subtraction of the magnetization (M) from the<br />
<strong>magnetic</strong> induction divided by the permeability of<br />
free space (BIJ.4J)<br />
Magnetic dipole moment per unit volume<br />
Permeability of free space multiplied by the<br />
magnetization (1 = /1QM)<br />
The structure resulting from putting two oppositely<br />
charged (fictitious) poles infinitesimally close<br />
together<br />
Ameasure of the field lines which pass through<br />
a surface<br />
Constant defined to be 4;rrx 10- 7 in SI units
Penneability<br />
Tenn<br />
Relative penneability<br />
Volume <strong>magnetic</strong><br />
susceptibility<br />
Demagnetizing factor<br />
Symbol SI unit<br />
dimensionless<br />
dimensionless<br />
D,N dimensionless<br />
Table II.I<br />
(continued)<br />
Gaussian<br />
CGS unit<br />
emu = G/Oe<br />
(dimensionless)<br />
dimensionless<br />
dimensionless<br />
dimensionless<br />
Description<br />
A measure of the ability of a material to let a<br />
<strong>magnetic</strong> field B to pass through in the presence of<br />
a <strong>magnetic</strong> field H<br />
Ratio of the penneability of a medium to the<br />
permeability of free space<br />
A measure of the ease with which a material can<br />
become magnetized while in the presence of a<br />
<strong>magnetic</strong> field; the relation between the two<br />
systems is K: (Sn = 41rK: (CGS)<br />
A quality which depends only on the geometry of a<br />
magnetized material
APPENDIX ill<br />
<strong>IAGA</strong> RESOLUTIONS RELEVANT TO OBSERVATORIES<br />
The main contents of <strong>IAGA</strong> resolutions relevant to <strong>magnetic</strong> <strong>observatory</strong> work <strong>and</strong><br />
<strong>magnetic</strong> recording are presented here.<br />
1922 Rome:<br />
o<br />
o<br />
Methods of scale value detenninations are to be given m all <strong>observatory</strong><br />
publications.<br />
National Committees should designate one <strong>observatory</strong> in each country <strong>for</strong><br />
international intercomparisons of <strong>magnetic</strong> instruments.<br />
1927 Prague:<br />
o<br />
o<br />
o<br />
Greenwich Mean Time is to be used <strong>for</strong> all ordinary <strong>magnetic</strong> data.<br />
The annual secular variation is from January 1 to January l. The value of a<br />
<strong>magnetic</strong> element on January 1 is the mean of 24 months comprising the 12<br />
months which precede <strong>and</strong> the 12 months which follow January 1.<br />
Adequate provision should be made <strong>for</strong> securing a complete magnetograph<br />
record on highly disturbed days.<br />
1936 Edinburgh:<br />
o<br />
o<br />
o<br />
o<br />
The <strong>magnetic</strong> instruments should be checked at least every two years, including<br />
the checking of the direction of <strong>magnetic</strong> axes of the magnets in the variometers.<br />
The directions of the electric currents in the Earth are positive when flowing<br />
toward the north or toward the east.<br />
Every <strong>observatory</strong> should provide means to record extreme values during<br />
<strong>magnetic</strong> storms.<br />
The Central Bureau of <strong>IAGA</strong> (Comment: now the World Data Center system)<br />
requests copies of magnetograms on film, or original registrations <strong>for</strong> copying at<br />
the cost of the Bureau. The copies should be supplied with in<strong>for</strong>mation on<br />
base-line values, scale values, time corrections <strong>and</strong> other in<strong>for</strong>mation necessary<br />
<strong>for</strong> the use of the curves.
1939 WasWngton:<br />
- 218 -<br />
o Every institution conducting geo<strong>magnetic</strong> work should have an efficient<br />
quantitative apparatus <strong>for</strong> testing non-<strong>magnetic</strong> material.<br />
1948 Oslo:<br />
o When planning new observatories, care should be taken to choose sites likely to<br />
remain undisturbed electro<strong>magnetic</strong>ally by artificial causes <strong>for</strong> many years: The<br />
distance from electrified railways should be not less than 30 km.<br />
1951 Brussels:<br />
o<br />
o<br />
K-index was adopted as a local measure <strong>for</strong> the intensity of <strong>magnetic</strong> disturbance<br />
during three-hour intervals. Kp was adopted to describe the corresponding level<br />
of <strong>magnetic</strong> activity <strong>for</strong> the Earth as a whole.<br />
The 27-day numeration was adopted: The sequence 1601 began 1950 May 20.<br />
1954 Rome:<br />
o<br />
o<br />
o<br />
For <strong>magnetic</strong> charts the epoch .0 is to be used. The value to be assigned to the<br />
epoch .0 will be the mean of the values <strong>for</strong> the six months preceding <strong>and</strong> the six<br />
months following the adopted date of January 1.<br />
New stations in regions where H < 10,000 renT) should record X <strong>and</strong> Y.<br />
Inhomogeneities of conductivity in the Earth's crust in <strong>observatory</strong> areas should<br />
be examined in order to study the <strong>magnetic</strong> character of the district.<br />
Magnetic observatories are encouraged to publish in the <strong>for</strong>m of yearbooks or<br />
other publications the following data, listed in the order of importance:<br />
I) Hourly values of three elements, with notations regarding interpolated values.<br />
Mean values should be centered upon half-hour.<br />
2) Yearly <strong>and</strong> monthly means, at earliest availability.<br />
3) K-indices.<br />
4) Account of normal equipment, <strong>and</strong> of records available, <strong>and</strong> in<strong>for</strong>mation bearing<br />
on the reliability of the values; this in<strong>for</strong>mation refers, <strong>for</strong> example, to absolute<br />
observations or consequent base-line determinations, scale-value determinations,<br />
per<strong>for</strong>mance of absolute <strong>and</strong> variation instruments, orientation <strong>and</strong><br />
interaction of magnets, temperature coefficients, <strong>and</strong> calibration of the instruments<br />
used <strong>for</strong> absolute observations.
- 219 -<br />
5) Reproduction of magnetograms of all days or, failing this, reproduction of selected<br />
magnetograms.<br />
6) Daily sums <strong>and</strong> means, <strong>and</strong> sums <strong>and</strong> means by hours <strong>for</strong> each whole month,<br />
<strong>and</strong> the corresponding means <strong>for</strong> the selected five quiet <strong>and</strong> five disturbed<br />
days thereof.<br />
7) The times of sudden commencements of <strong>magnetic</strong> disturbance, <strong>and</strong> as far as<br />
practicable, of crochets, pulsations, giant pulsations, <strong>and</strong> of similar changes<br />
<strong>and</strong> other remarkable phenomena, together with magnitude <strong>and</strong> sense in each<br />
<strong>magnetic</strong> element.<br />
Desirable additional data are the following:<br />
a) Composite daily variation or hour-by-hour departures of the general <strong>and</strong> selected-day<br />
means by months, Lloyd's seasons, <strong>and</strong> years.<br />
b) Account of special equipment <strong>and</strong> statement on, <strong>for</strong> example, intervals <strong>for</strong><br />
which rapid run magnetograms exist.<br />
c) Recording of pulsations recommended.<br />
1960 Helsinki:<br />
Gyro<strong>magnetic</strong> ratio of protons to be used in all observatories is : 2.67513 x 10 4<br />
rad/(Gs . s). (Comment: from the beginning of 1992 the best known value is to be<br />
used, being in 1992: 2.6751525 x 10 8 ± 40 rad/(T s). Until 1992 the previous<br />
value had to be used).<br />
1963 Berkeley:<br />
o<br />
o<br />
o<br />
o<br />
Copies of magneto grams with full in<strong>for</strong>mation on base-line values, etc., are to be<br />
sent to the World Data Centers as soon as possible after observation.<br />
Artificial <strong>magnetic</strong> disturbances should be marked on magnetograms.<br />
From 1964 January lon, the Z-component will not be used <strong>for</strong> the measure of the<br />
K-index. Observatories already measuring the K-index separately <strong>for</strong> three<br />
<strong>magnetic</strong> elements should send tables of these data to the Permanent Service.<br />
For new observatories, the lower limit <strong>for</strong> K = 9 should be chosen in consultation<br />
with the Working Group on Magnetic Activity Indices.<br />
o The use of nuclear magnetometers is recommended <strong>for</strong> the measurement of<br />
absolute total intensity <strong>and</strong> components where possible.
- 220-<br />
o Observatories finding corrections in their st<strong>and</strong>ard of intensity should publish full<br />
in<strong>for</strong>mation on these corrections.<br />
o Complete cru.ibration data <strong>for</strong> the records <strong>and</strong> instruments should be published.<br />
0 The classification <strong>for</strong> continuous pUlsations is:<br />
Pc 1 0.2 to 5 seconds<br />
Pc 2 5 to 10<br />
Pc 3 10 to 45<br />
Pc 4 45 to 150<br />
Pc 5 150 to 600<br />
<strong>and</strong> <strong>for</strong> irregular pulsations<br />
Pi 1 1 to 40 seconds<br />
Pi 2 40 to 150<br />
1967 Zurich (St. Gallen <strong>for</strong> <strong>IAGA</strong>):<br />
o Magnetic observatories are encouraged to become modernized to record in digital<br />
<strong>for</strong>m.<br />
o Mean hourly value data should be made available in machine readable <strong>for</strong>m<br />
through World Data Centers.<br />
o Recording of pulsations is recommended as one of the important tasks of<br />
<strong>magnetic</strong> observatories.<br />
1969 Madrid:<br />
o Continued publication of <strong>magnetic</strong> yearbooks is recommended in addition to the<br />
availability of the hourly values on microfilm through World Data Centers.<br />
o Centralized publication of individual K-indices will be discontinued but the<br />
observatories are encouraged to publish the indices in their yearbooks or<br />
bulletins.<br />
1971 Moscow:<br />
o Numerical <strong>magnetic</strong> <strong>observatory</strong> data, past <strong>and</strong> current, should, whenever<br />
practicable, be put into machine readable <strong>for</strong>m <strong>and</strong> transmitted to World Digital<br />
Data Centers.
1973 Kyoto:<br />
o<br />
o<br />
o<br />
o<br />
o<br />
o<br />
o<br />
- 221 -<br />
All countries are encouraged to set aside observations in which man-made<br />
sources of electro<strong>magnetic</strong> energy in the frequency range of interest to 1AGA are<br />
excluded.<br />
The SI-units adopted to be used in geomagnetism are as stated below:<br />
1. a) Values of geo<strong>magnetic</strong> field are to be expressed in tenns of the <strong>magnetic</strong><br />
induction B (SI-unit tesla = weber/metre 2 ).<br />
b) If it is desired to express values in gammas, a note should be added stating<br />
that "one gamma is equal to one nanotesla".<br />
2. a) Values of intensity of magnetization are to be expressed in tenns of<br />
magnetization M (SI-unit = ampere/metre).<br />
b) If it is desired to express values in emu., a note should be added stating<br />
that "one e.m.u. is equal to 10 3 ampere/metre".<br />
3. a) Values of susceptibility are to be expressed as the ratio between<br />
magnetization M <strong>and</strong> the <strong>magnetic</strong> field H.<br />
b) If, during the transitional period, it is desired to use values of susceptibility<br />
in e.m.u., a note should be added stating that "XsI is equal to 41tXemu.".<br />
The recommended nonnal recording speed: 20 mmIh.<br />
Historically important data should be preserVed <strong>and</strong> their existence made known<br />
to the scientific community.<br />
Records <strong>and</strong> data from temporary <strong>magnetic</strong> variation stations should be offered to<br />
the World Data Centers when the records are considered to be of possible value to<br />
other scientists.<br />
The term <strong>magnetic</strong> pulsation or pulsation are to be used instead of<br />
micropulsation.<br />
To the classification of pulsations one should add:<br />
Pc 6 <strong>for</strong> continuous pulsations with periods longer than 600 seconds, <strong>and</strong><br />
Pi 3 <strong>for</strong> irregular pulsations with periods longer than 150 seconds.<br />
1975 Grenoble:<br />
o Any proposal to change the number <strong>and</strong> distribution of <strong>magnetic</strong> observatories<br />
should be discussed with 1AGA.
1977 Seattle:<br />
o<br />
o<br />
o<br />
- 222-<br />
For monitoring accurately the secular change, observatories are encouraged to<br />
continue the production of analog records using the traditional system at least<br />
until the digital system has been proven to be equal in per<strong>for</strong>mance.<br />
Noting the utility of analog records, in particular <strong>for</strong> submission to the World<br />
Data Centers, <strong>IAGA</strong> recommends continued production of analog records,<br />
whether by traditional instruments or from digital data.<br />
Repeat stations should be set up near each <strong>observatory</strong> to preserve the secular<br />
change record in the event of change of the <strong>observatory</strong> base reference. When it<br />
becomes obvious that an <strong>observatory</strong> should be moved, the instruments should be<br />
operated simultaneously at the old <strong>and</strong> at the new sites at least one year.<br />
1979 Canberra:<br />
o<br />
o<br />
o<br />
o<br />
<strong>IAGA</strong>, recognizing the importance of rapid run magnetograms <strong>for</strong> global studies<br />
of ULF pulsations, recommends that observatories operating rapid-run<br />
magnetometers continue to do so, where possible increasing the sensitivity, <strong>and</strong><br />
that other observatories initiate rapid-run recording.<br />
<strong>IAGA</strong> draws attention to the desirability of digital <strong>magnetic</strong> observatories using<br />
sampling rate no slower than once every ten seconds <strong>and</strong> asks these observatories<br />
to send these data to World Data Centers as one-minute means (with clear<br />
identification of the method of averaging). These means should be centered on the<br />
minute (e.g., the first value within an hour is labeled OOhOlm <strong>and</strong> is the mean<br />
calculated from OOhOOm30 s to OOhOl m30 s ).<br />
Observatories basing their st<strong>and</strong>ard of horizontal intensity on QHM-<strong>measurements</strong><br />
are urged to loan <strong>for</strong> comparison st<strong>and</strong>ard QHM's from the Danish<br />
Meteorological Institute.<br />
<strong>IAGA</strong>, recognizing the ever-increasing pressure upon geophysicists to provide<br />
fast returns in the <strong>for</strong>m of practical applications of their research, draws attention<br />
to the fact that basic research motivated by intellectual curiosity is the most<br />
effective breeding ground <strong>for</strong> the long-term development of applications in<br />
resource exploration <strong>and</strong> exploitation, environmental protection, <strong>and</strong> new<br />
technologies; urges its member countries to provide continued strong support to<br />
basic research in the geosciences, <strong>and</strong> encourages them to embark in a concerted<br />
ef<strong>for</strong>t towards establishing an appropriate balance between the current opportunities<br />
offered in basic research <strong>and</strong> the long-term needs in applied fields <strong>and</strong><br />
technology.
1983 Hamburg:<br />
- 223-<br />
o H<strong>and</strong> scaling of K-indices recommended. It is recommended that machine<br />
derived indices be given distinctly different names (Comment: the later<br />
development of machine production of K-indices has shown that the best machine<br />
methods give results which are very close to the results of h<strong>and</strong> scalings made by<br />
experts).<br />
1985 Prague:<br />
o<br />
o<br />
Funding agencies are encouraged to safeguard the monitoring programme of<br />
<strong>magnetic</strong> observatories <strong>and</strong> the archiving <strong>and</strong> dissemination of their results.<br />
Geo<strong>magnetic</strong> observatories are urged to report activity indices <strong>and</strong> to return check<br />
lists without delay, because delays caused by a small number of observatories<br />
have a serious adverse effect on the usefulness of the whole network by delaying<br />
the publication of summary data on rapid geo<strong>magnetic</strong> activity.<br />
1987 Vancouver:<br />
o All member countries are urged to maintain uninterrupted observations.<br />
1989 Exeter:<br />
o<br />
o<br />
o<br />
<strong>IAGA</strong>, recognizing that key developments in the underst<strong>and</strong>ing of the coupled<br />
ionosphere magnetosphere <strong>and</strong> solar wind system will come from the integration<br />
of in situ satellite observations <strong>and</strong> <strong>measurements</strong> from spatially related networks<br />
of ground observatories <strong>and</strong> recognizing that Antarctica provides a unique<br />
plat<strong>for</strong>m upon which to deploy an optimum network of ground observatories<br />
from which to make such <strong>measurements</strong> <strong>and</strong> noting that several nations plan to<br />
deploy unmanned experimental facilities in Antarctica, urges national<br />
administrations through the ICSU Scientific Committee <strong>for</strong> Antarctic Research to<br />
support the development of an optimum international network of observatories.<br />
At each site, at least <strong>measurements</strong> of the geo<strong>magnetic</strong> field <strong>and</strong> absorption of<br />
cosmic noise should be made.<br />
Magnetic observatories providing data to the World Data Center C2 <strong>for</strong> Geomagnetism<br />
<strong>for</strong> the calculation of Dsr <strong>and</strong> AE indices are encouraged to use real-time<br />
data transmission systems such as INTERMAGNET.<br />
The responsible institutes are strongly urged to work with <strong>IAGA</strong> to develop<br />
alternative solutions prior to taking a final decision to close an <strong>observatory</strong>.
1991 Vienna:<br />
- 224-<br />
o Relevant organizations, agencies <strong>and</strong> member countries should review the<br />
services under their control, as well as the deployment of global networks<br />
supporting them, <strong>and</strong> should co-locate as many of these instruments as is<br />
practical, provided that the per<strong>for</strong>mance of all instruments is not compromised.<br />
Organizations in the developed countries that run <strong>magnetic</strong> <strong>observatory</strong> programs<br />
are recommended to adopt one or more observatories facing problems <strong>and</strong><br />
provide the necessary assistance <strong>and</strong> training to ensure continuing operation at a<br />
satisfactory st<strong>and</strong>ard. Government funding agencies should consider this as a<br />
routine part of their international obligation to developing countries.<br />
<strong>IAGA</strong>, recognizing the importance of continued long-term monitoring of the<br />
geo<strong>magnetic</strong> field <strong>for</strong> scientific, industrial <strong>and</strong> other purposes, noting that many<br />
key observatories throughout the world have inadequate support <strong>and</strong> are under<br />
threat of closure, encourages the creation of a federation of those institutes<br />
operating <strong>magnetic</strong> observatories, working closely with <strong>IAGA</strong>, that will<br />
strengthen <strong>and</strong> coordinate their ef<strong>for</strong>ts, by maintaining st<strong>and</strong>ards set by <strong>IAGA</strong>, by<br />
working towards an improved distribution of observatories, by establishing <strong>and</strong><br />
coordinating bilateral or multilateral assistance programs among participating<br />
institutes, by actively pursuing all sources of funding.<br />
1993 Buenos Aires:<br />
o The <strong>IAGA</strong>, noting the contribution made by <strong>magnetic</strong> observatories to long-term<br />
environmental monitoring, to fundamental research <strong>and</strong> to ground-based <strong>and</strong><br />
satellite surveys <strong>and</strong> experiments, <strong>and</strong> noting also the extensive commercial <strong>and</strong><br />
governmental use of geo<strong>magnetic</strong> models <strong>and</strong> indices derived from <strong>magnetic</strong><br />
<strong>observatory</strong> data, urges relevant organizations, agencies, <strong>and</strong> member countries,<br />
to provide the resources to maintain continuity of synoptic <strong>magnetic</strong> observations<br />
<strong>and</strong> to adopt modem digital instruments.<br />
The <strong>IAGA</strong>, noting that a proper underst<strong>and</strong>ing of many aspects of the<br />
geo<strong>magnetic</strong> field requires continuous, high accuracy, high resolution long-term<br />
data of the type provided by the MAGSAT satellite of 197911980, supported by<br />
a well-distributed <strong>and</strong> modem geo<strong>magnetic</strong> <strong>observatory</strong> network, recommends<br />
that the relevant organizations, agencies <strong>and</strong> member countries provide all<br />
possible support to ensure that (1) a continuous sequence of MAGS AT-quality<br />
vector-<strong>magnetic</strong> satellites, such as the proposed UNIMAG, OERSTED, GAMES<br />
<strong>and</strong> DMSPIPOGS satellite series, is operated <strong>for</strong> at least the next solar<br />
cycle [22 years], <strong>and</strong> (2) the current geo<strong>magnetic</strong> <strong>observatory</strong> network be<br />
maintained, <strong>and</strong> upgraded where necessary, <strong>and</strong> its coverage be extended into<br />
ocean areas.
APPENDIX IV<br />
DISTURBING EFFECT OF MAGNETIC MATERIAL<br />
ON MEASUREMENTS<br />
Many observations are spoiled by a <strong>magnetic</strong> object the observer is carrying while<br />
observing or which is kept too close to the site of observation. Dangerous items may<br />
be tools, electronic instruments, cars, bicycles, etc. It is not easy to answer the<br />
question how far away one has to keep a <strong>magnetic</strong> object, but here we shall give some<br />
general background <strong>for</strong> the estimation of the <strong>magnetic</strong> effects <strong>and</strong> finally some<br />
practical advice based on measurement <strong>and</strong> experience.<br />
In textbooks on magnetism, one cannot find ready answers. Exact calculation of<br />
the <strong>magnetic</strong> field of bodies with complicated shapes is difficult, but it is possible to<br />
give guidelines <strong>for</strong> some simple cases. It is important to know the <strong>magnetic</strong> effect of<br />
different objects at a <strong>magnetic</strong> <strong>observatory</strong>, partly because the objects may affect the<br />
absolute <strong>measurements</strong>, <strong>and</strong> partly because a task at a <strong>magnetic</strong> <strong>observatory</strong> may<br />
sometimes be to estimate the <strong>magnetic</strong> field outside a more or less weakly<br />
magnetized body.<br />
o<br />
o<br />
o<br />
o<br />
o<br />
The effect of a <strong>magnetic</strong> object depends on many parameters:<br />
the distance<br />
the <strong>magnetic</strong> parameters <strong>and</strong> volume of the object<br />
the geometric shape of the object<br />
the angle between the component to be measured <strong>and</strong> the direction of magnetization<br />
of the object<br />
the past history of the <strong>magnetic</strong> body<br />
The last point needs some explanation: every <strong>magnetic</strong> material may have two<br />
kinds of magnetism: induced magnetism M/ <strong>and</strong> remanent magnetization MR' The<br />
latter depends on the past history of the <strong>magnetic</strong> object. For an iron body, the MR is<br />
usually the result of a strong <strong>magnetic</strong> field. For rocks, MR is accumulated during<br />
their <strong>for</strong>mation or during subsequent metamorphic or chemical processes.<br />
rv.l Magnetic field of a sphere in an external <strong>magnetic</strong> field<br />
The classical problem of calculating the <strong>magnetic</strong> field in space in the presence of<br />
a spherical body with susceptibility /( can be solved analytically. Let us assume that
- 226-<br />
at the origin of a spherical coordinate system we have a spherical body. The total field<br />
is<br />
(H II M[ inside the sphere) (IV. 1)<br />
outside the sphere (IV.2)<br />
where a = the radius of the sphere, Ho = the external <strong>magnetic</strong> field along the vertical<br />
axis <strong>and</strong> M[ = the induced magnetization. Ois the polar angle. The <strong>for</strong>mulas are given<br />
in the st<strong>and</strong>ard international system (SI) units.<br />
(IV.3)<br />
From <strong>for</strong>mulas (IV.2) we see that the additional field is the field of a <strong>magnetic</strong><br />
dipole with a <strong>magnetic</strong> moment m = (41Tf3)M[ a 3 . Strictly speaking, the<br />
magnetization is homogeneous <strong>and</strong> the <strong>magnetic</strong> field parallel to the external field<br />
only in the case of a sphere, but in many cases we can assume homogeneous<br />
magnetization also in bodies having other shapes.<br />
rv.2 Demagnetization factor<br />
Formula (Iy'3) derived <strong>for</strong> a sphere can be generalized <strong>and</strong> rewritten in the <strong>for</strong>m<br />
(IVA)<br />
where N is the demagnetization factor (<strong>for</strong> a sphere N = 1/3). In the case of a more<br />
complicated shape, N is a tensor.<br />
For an ellipsoid, the magnetization along the main axes is<br />
(IV.5)<br />
In this case, the magnetization is homogeneous but does not have the same<br />
direction as the inducing field . For an ellipsoid of revolution, with axes a = b < c in<br />
the coordinate system x, y, z, the demagnetization factor can be expressed by<br />
elementary functions (L<strong>and</strong>au <strong>and</strong> Lifshits, 1957):<br />
Nzz= [(1 - i)l2e 3 ]ln[(l + e)/(l - e) - 2e]<br />
e = (1 - b2/C2) 112<br />
(IV.6)
- 228-<br />
Correspondingly, <strong>for</strong> an ellipsoid with a = b > c we have<br />
NZ.z = [(1 + i)/e 3 ] (e - arc tan e)<br />
e = (a 2 /c 2 _ 1)112<br />
(IV.7)<br />
The dependence of N on the elongation of the ellipsoid is presented in Figure IV.l,<br />
where the external field Ho is assumed to act in the direction of the z-axis.<br />
IV.3 Induced <strong>and</strong> remanent magnetization of a <strong>magnetic</strong> body<br />
From equation (IVA) we get <strong>for</strong> the induced magnetization M/:<br />
where /d(l + leN) is called the apparent or shape susceptibility.<br />
For 1dV» 1 we have<br />
(IV.8)<br />
(IV.9)<br />
In this case, the magnetization does not depend on the susceptibility, only on the<br />
demagnetization factor N <strong>and</strong> the external field. Formula (IV.9) can be used <strong>for</strong> any<br />
iron body, provided that it is not very elongated.<br />
When KN«I, then<br />
(IV. 10)<br />
This <strong>for</strong>mula is valid <strong>for</strong> the majority of rocks. Using the <strong>for</strong>mulas above it is<br />
possible to estimate the induced magnetism if /(is known. Approximate values of /(<br />
can be found in many textbooks on geomagnetism. Some typical values are collected<br />
in Table IV.2.<br />
Table N.2.<br />
Typical susceptibility values /( <strong>for</strong> various materials.<br />
Different types of rocks<br />
Bricks<br />
/(<br />
10- 1_10-5<br />
10- 2<br />
Magnetite 1-10<br />
Typical iron<br />
Special iron alloys<br />
10+ 2<br />
10+ 6
- 230-<br />
The disturbing effect &I can be expressed in CGS-units, which may be more<br />
common in the literature in this connection<br />
(IV.12b)<br />
where v = volume, w = mass, d = density of the <strong>magnetic</strong> source, <strong>and</strong> m = <strong>magnetic</strong><br />
moment. One should remember that when using tables or <strong>for</strong>mulas <strong>for</strong> demagnetization<br />
factors the values should, in this case, be multiplied by 4n, <strong>and</strong> 1C should be<br />
divided by 4n.<br />
What we measure in practice is the vector sum of MJ <strong>and</strong> Bo (see Fig. IV.2)<br />
B=Bo+MJ. (Iv' 13)<br />
Assuming that &3
- 232-<br />
Making the simplifications mentioned above we have tried to rather overestimate<br />
the value of the disturbing field. In two cases, namely when the permanent<br />
magnetization is much bigger than the induced magnetization, or when the body is<br />
large compared to the distance to the measuring point, the computed value can be<br />
smaller than the real value, however. The best way to determine the disturbance due<br />
to <strong>magnetic</strong> bodies is to check the surroundings of the measurement point with a<br />
proton magnetometer.
SUBJECT<br />
Absolute house, 41-45<br />
Absolute instrument, 51, 167-173<br />
Absolute measurement, 13, 52,<br />
86-124<br />
Accuracy, 52<br />
Aero<strong>magnetic</strong> map, 24<br />
Anomalies<br />
see Magnetic anomalies<br />
Astronomical ephemerides, 124<br />
Azimuth, 118-124<br />
of Sun, 119<br />
of azimuth mark, 46<br />
Base-line value, 52, 87, 142-143<br />
Base value, 52<br />
BMZ (Magnetic Zero Balance), 53<br />
Celestial triangle, 119<br />
Classical variometers, 59-61<br />
Coils, 173-176<br />
Helmholtz, 173-176<br />
square, 173, 175<br />
Comparison of instruments, 171-173<br />
Conductivity, see Electrical conductivity<br />
Continuous proton precession magnetometer,<br />
see Overhauser<br />
magnetometer<br />
D (<strong>magnetic</strong> declination) 7, 8, 15,54,<br />
87-102,111-115<br />
Declination of Sun, 119<br />
Declinometer, 111-115<br />
Demagnetization factor, 226-229<br />
DGRF (Definitive Geo<strong>magnetic</strong><br />
Reference Field), 20<br />
Diameter of Sun, 123<br />
Digital recording, 134-135<br />
Dip, see I (<strong>magnetic</strong> inclination)<br />
Dip-equator, 22<br />
Dipole poles, see Poles<br />
INDEX<br />
Disturbed days, 28<br />
Diurnal variation, 24-26<br />
Dynamic range, 52<br />
Earth inductor, 53<br />
East component, see Y<br />
Electrical conductivity, 38, 177<br />
subsoil, 177<br />
Electron resonant frequency, 75<br />
Equation of time, 34<br />
Equator,<br />
<strong>magnetic</strong>, 22<br />
geo<strong>magnetic</strong>, 19<br />
F(totalintensity), 15, 17,97, 102<br />
Field balance, 53<br />
Filtering data, 138-141<br />
Fluxgate magnetometer, 79-84<br />
Fluxgate theodolite, 87-89<br />
Gaussian filter, 139-141<br />
Geographic meridian, 21<br />
Geo<strong>magnetic</strong> coordinates, 33-34<br />
Geo<strong>magnetic</strong> field, 15-35<br />
Geo<strong>magnetic</strong> poles, see Poles<br />
Geo<strong>magnetic</strong> time, 34<br />
GHA (Greenwich Hour Angle),<br />
121-122<br />
GIN (Geo<strong>magnetic</strong> In<strong>for</strong>mation<br />
Node), 153, 187<br />
Gyro<strong>magnetic</strong> ratio of proton, 65-66<br />
H (horizontal intensity), 15,56-59,<br />
115-118<br />
Helmholtz coil, see Coils<br />
I (<strong>magnetic</strong> inclination), 15, 19,87,<br />
92-96<br />
<strong>IAGA</strong> (International Association of<br />
Geomagnetism <strong>and</strong> Aeronomy),<br />
20,183-184,217
Secular variation, 16-22<br />
Sensitivity, 52<br />
Serson's method, see Vector methods<br />
Sfe (Solar flare effect), 30-31<br />
SI (Sudden Impulse), 30<br />
Solar wind, 28<br />
SQUID (Superconducting Quantum<br />
Interference Device), 84-85<br />
Solar diurnal variations, 24-28<br />
Solar quiet day, see Quiet days<br />
Ssc (Storm sudden commencement),<br />
30<br />
Substorm, 28<br />
Sun observation, 118-124<br />
Sunspot cycle, 28<br />
Superconducting magnetometer,<br />
see SQUID<br />
Suspended magnet variograph, 53,<br />
130-132<br />
Systematic error, 52<br />
Temperature coefficient, 52, 129-130<br />
Time signals, 132-134<br />
Torsion magnetometers, 54, 59-61<br />
Total intensity, see F<br />
- 235 -<br />
Units, 213-216<br />
Variation, 7<br />
diurnal, 24-26<br />
secular, 16-22<br />
Variometer, 53<br />
Variometer house, 40<br />
Vector methods<br />
Nelson's, 105-106<br />
Serson's,106-108<br />
Vertical intensity, see Z<br />
WDC (World Data Centers),<br />
147-150, 184-186<br />
reporting to, 147<br />
Wiese vectors, 179<br />
X (<strong>magnetic</strong> north component),<br />
15,22<br />
Y (<strong>magnetic</strong> east component),<br />
15,22<br />
Z (vertical intensity), 15, 22
This <strong>Guide</strong> provides comprehensive in<strong>for</strong>mation how to organize<br />
<strong>and</strong> run a <strong>magnetic</strong> <strong>observatory</strong> <strong>and</strong> make <strong>magnetic</strong> <strong>measurements</strong>.<br />
The main topics are the following:<br />
o Brief description of the <strong>magnetic</strong> field of the Earth<br />
o Selection of <strong>observatory</strong> site <strong>and</strong> layout of the <strong>observatory</strong><br />
o Magnetometers<br />
o Absolute <strong>magnetic</strong> <strong>measurements</strong><br />
o Recording of <strong>magnetic</strong> variations<br />
o Data processing<br />
o Testing <strong>and</strong> calibrating instruments<br />
Copies available from the Secretary-General of <strong>IAGA</strong>.