Post-Paleozoic activity - Lamont-Doherty Earth Observatory ...
Post-Paleozoic activity - Lamont-Doherty Earth Observatory ...
Post-Paleozoic activity - Lamont-Doherty Earth Observatory ...

You also want an ePaper? Increase the reach of your titles
YUMPU automatically turns print PDFs into web optimized ePapers that Google loves.
ank<br />
0 6<br />
I I<br />
<strong>Post</strong>-<strong>Paleozoic</strong> <strong>activity</strong><br />
Gwynedd power spectrum [time)<br />
40.0 20.0 13.9 10.0 8.0 6.7 5.7 5.0 4.4 4.0<br />
period x 1000 yrs c<br />
period x 1000 yrs<br />
RANK<br />
6<br />
- GWYNEDD<br />
T.O.C.% CARBONATED<br />
EUREKA<br />
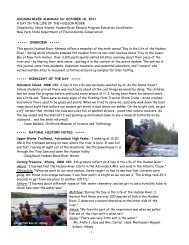
Figure 23. Examples of power spectra of sediment fabrics from the Lockatong Formation of the Newark<br />
basin. Fabrics are ranked from 0, a massive fabric deposited in the shallowest, most ephemeral water, to<br />
6, a microlaminated fabric (Olsen, 1986,1980b) deposited in the deepest lakes. Time is calibrated by the<br />
microlaminated beds, which are assumed to be varved. A. Measured section at Gwynedd,<br />
Pennsylvania, with the rank curve shown to its right. Gray areas represent red beds. B. Single Van<br />
Houten cycle from Gwynedd section. 17. T.O.C. stands for total organic carbon content. C. Power<br />
spectrum in time for entire Gwynedd section showing main periods of cycles; assumed sedimentation<br />
rate 0.24 mm/yr. D. Superimposed power spectra from four different nonoverlapping Lockatong<br />
Formation sections.