Rab Abdur - International Union of Soil Sciences
Rab Abdur - International Union of Soil Sciences
Rab Abdur - International Union of Soil Sciences
You also want an ePaper? Increase the reach of your titles
YUMPU automatically turns print PDFs into web optimized ePapers that Google loves.
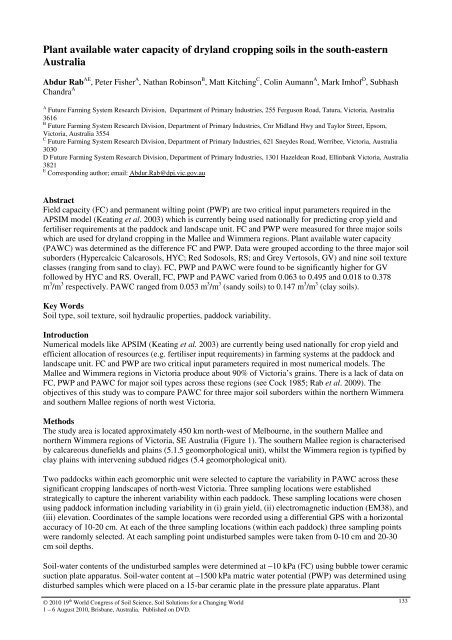
Plant available water capacity <strong>of</strong> dryland cropping soils in the south-eastern<br />
Australia<br />
<strong>Abdur</strong> <strong>Rab</strong> AE , Peter Fisher A , Nathan Robinson B , Matt Kitching C , Colin Aumann A , Mark Imh<strong>of</strong> D , Subhash<br />
Chandra A<br />
A Future Farming System Research Division, Department <strong>of</strong> Primary Industries, 255 Ferguson Road, Tatura, Victoria, Australia<br />
3616<br />
B Future Farming System Research Division, Department <strong>of</strong> Primary Industries, Cnr Midland Hwy and Taylor Street, Epsom,<br />
Victoria, Australia 3554<br />
C Future Farming System Research Division, Department <strong>of</strong> Primary Industries, 621 Sneydes Road, Werribee, Victoria, Australia<br />
3030<br />
D Future Farming System Research Division, Department <strong>of</strong> Primary Industries, 1301 Hazeldean Road, Ellinbank Victoria, Australia<br />
3821<br />
E Corresponding author; email: <strong>Abdur</strong>.<strong>Rab</strong>@dpi.vic.gov.au<br />
Abstract<br />
Field capacity (FC) and permanent wilting point (PWP) are two critical input parameters required in the<br />
APSIM model (Keating et al. 2003) which is currently being used nationally for predicting crop yield and<br />
fertiliser requirements at the paddock and landscape unit. FC and PWP were measured for three major soils<br />
which are used for dryland cropping in the Mallee and Wimmera regions. Plant available water capacity<br />
(PAWC) was determined as the difference FC and PWP. Data were grouped according to the three major soil<br />
suborders (Hypercalcic Calcarosols, HYC; Red Sodosols, RS; and Grey Vertosols, GV) and nine soil texture<br />
classes (ranging from sand to clay). FC, PWP and PAWC were found to be significantly higher for GV<br />
followed by HYC and RS. Overall, FC, PWP and PAWC varied from 0.063 to 0.495 and 0.018 to 0.378<br />
m 3 /m 3 respectively. PAWC ranged from 0.053 m 3 /m 3 (sandy soils) to 0.147 m 3 /m 3 (clay soils).<br />
Key Words<br />
<strong>Soil</strong> type, soil texture, soil hydraulic properties, paddock variability.<br />
Introduction<br />
Numerical models like APSIM (Keating et al. 2003) are currently being used nationally for crop yield and<br />
efficient allocation <strong>of</strong> resources (e.g. fertiliser input requirements) in farming systems at the paddock and<br />
landscape unit. FC and PWP are two critical input parameters required in most numerical models. The<br />
Mallee and Wimmera regions in Victoria produce about 90% <strong>of</strong> Victoria’s grains. There is a lack <strong>of</strong> data on<br />
FC, PWP and PAWC for major soil types across these regions (see Cock 1985; <strong>Rab</strong> et al. 2009). The<br />
objectives <strong>of</strong> this study was to compare PAWC for three major soil suborders within the northern Wimmera<br />
and southern Mallee regions <strong>of</strong> north west Victoria.<br />
Methods<br />
The study area is located approximately 450 km north-west <strong>of</strong> Melbourne, in the southern Mallee and<br />
northern Wimmera regions <strong>of</strong> Victoria, SE Australia (Figure 1). The southern Mallee region is characterised<br />
by calcareous dunefields and plains (5.1.5 geomorphological unit), whilst the Wimmera region is typified by<br />
clay plains with intervening subdued ridges (5.4 geomorphological unit).<br />
Two paddocks within each geomorphic unit were selected to capture the variability in PAWC across these<br />
significant cropping landscapes <strong>of</strong> north-west Victoria. Three sampling locations were established<br />
strategically to capture the inherent variability within each paddock. These sampling locations were chosen<br />
using paddock information including variability in (i) grain yield, (ii) electromagnetic induction (EM38), and<br />
(iii) elevation. Coordinates <strong>of</strong> the sample locations were recorded using a differential GPS with a horizontal<br />
accuracy <strong>of</strong> 10-20 cm. At each <strong>of</strong> the three sampling locations (within each paddock) three sampling points<br />
were randomly selected. At each sampling point undisturbed samples were taken from 0-10 cm and 20-30<br />
cm soil depths.<br />
<strong>Soil</strong>-water contents <strong>of</strong> the undisturbed samples were determined at −10 kPa (FC) using bubble tower ceramic<br />
suction plate apparatus. <strong>Soil</strong>-water content at –1500 kPa matric water potential (PWP) was determined using<br />
disturbed samples which were placed on a 15-bar ceramic plate in the pressure plate apparatus. Plant<br />
© 2010 19 th World Congress <strong>of</strong> <strong>Soil</strong> Science, <strong>Soil</strong> Solutions for a Changing World<br />
1 – 6 August 2010, Brisbane, Australia. Published on DVD.<br />
133
available water capacity (PAWC) was determined as the difference FC and PWP. <strong>Soil</strong>s were classified<br />
according to the Australian <strong>Soil</strong> Classification - ASC (Isbell 2002).<br />
Each soil property was modelled using residual maximum likelihood (ReML) based on a two-factor linear<br />
mixed model. The two factors were soil type (S, three levels) and soil depth (D, two levels). Wald tests were<br />
used to assess the significance <strong>of</strong> differences in soil properties between soil types, soil depths, as well as their<br />
interactions. All statistical analyses were conducted using GenStat 10.2 (Payne et al. 2007). The residuals<br />
reasonably satisfied the ReML assumptions <strong>of</strong> normality and constant residual variance. To study the effect<br />
<strong>of</strong> soil texture group on PAWC, data was analysed using one-way analysis <strong>of</strong> variance (ANOVA).<br />
Figure 1 Location <strong>of</strong> study sites in the southern Mallee and Wimmera regions, SE Australia<br />
Results<br />
Three major ASC soil suborders: Red Sodosols (RS), Hypercalcic Calcarosols (HYC) and Grey Vertosols<br />
(GV) were identified in this study area with nine soil texture classes were represented amongst these. There<br />
was a wide variation in soil texture across the three suborders; the RS dominated by coarse textures in the 0-<br />
10 cm and both coarse and medium textures in the 20-30 cm depth range; the HYC dominated by medium<br />
and fine textured soil in the 0-10 cm and 20-30 cm depth ranges respectively, and the GV dominated by fine<br />
textures.<br />
Mean values <strong>of</strong> FC and PWP for three soil types are presented in Table 1. The effect <strong>of</strong> interaction (soil x<br />
depth) and soil suborder on FC and PWP was significant (p0.05). However, a plot <strong>of</strong> mean values shows that the nature <strong>of</strong> interaction was <strong>of</strong> a noncrossover<br />
type (data not shown) and at both depths, mean values for RS were consistently low compared to<br />
both HYC and GV. The LSD test showed that at 0-10 cm depth, differences in FC and PWP between soil<br />
types were significant while at 20-30 cm depth the difference in FC and PWP between HYC and RS was not<br />
significant. The LSD test also showed that for GV the FC and PWP was not significantly different between<br />
two soil depths while for HYC and RS the differences between depths were significant.<br />
Table 1. FC, PWP and PAWC <strong>of</strong> three soil suborders at two depths in the Mallee and Wimmera<br />
regions <strong>of</strong> north-west Victoria, SE Australia.<br />
Volumetric soilwater<br />
A<br />
<strong>Soil</strong><br />
types (S) B Model<br />
Depth (D, cm) Mean term F Prob SEd<br />
0-10 20-30<br />
FC (% vol) HYC 34 42 38 S
Both FC and PWP were significantly influenced by soil texture class. There were no significant difference in<br />
either FC or PWP found between loamy sand and sandy loam; between loam, sandy clay loam and clay<br />
loam; and between silty clay loam, silty clay and clay soils (Table 2). This suggests for practical purposes,<br />
these nine texture classes can be grouped in to four major texture classes, sandy soils, loamy sand, loams and<br />
clayey soils. The relationship between routinely measured soil properties and FC and PWP are presented in<br />
Table 3.<br />
Table 2. FC, PWP and PAWC classified by soil texture groups in the Mallee and Wimmera regions <strong>of</strong><br />
northwest Victoria, SE Australia.<br />
Volumetric soil water content (%) A<br />
FC PWP PAWC<br />
Texture groups Mean Range Mean Range Mean Range<br />
Sand 8 6-8 2 2-3 5 4-6<br />
Loamy sand 20 17-23 7 7-8 13 11-15<br />
Sandy loam 21 18-23 8 7-9 13 11-16<br />
Loam 29 26-32 16 13-18 14 13-14<br />
Sandy clay loam 33 31-34 19 18-22 14 12-15<br />
Clay loam 35 30-39 21 15-25 14 11-17<br />
Silty clay loam 44 32-49 29 19-35 15 12-17<br />
Silty clay* 44 29 15<br />
Clay 45 40-50 30 25-38 15 10-17<br />
* only one observation<br />
A FC, Field capacity; PWP, permanent wilting point; and PAWC, plant available water capacity, is the difference<br />
between FC and PWP<br />
Table 3. Regression models for predicting FC and PWP<br />
FC PWP<br />
Variables A Models R 2 (%) Models B R 2 (%)<br />
c Y = 14.64 + 0.665(c) 82 Y=4.5+0.557(c) 82<br />
z+c Y = 12.90 + 0.473(z+c) 87 Y=3.11+0.395(z+c) 85<br />
c, x Y = 9.86+0.600(c)+7.67(x) 85 NS<br />
c, c 2 Y=6.17+1.50(c)-0.014(c 2 ) 93 Y=-1.32+1.13(c)-0.009(c) 2 89<br />
c, c 2 , x Y=2.68+1.416(c)-0.0135(c2)+6.12(x) 95 NS<br />
z+c, ( z+c) 2 Y=4.78+1.051(z+c)-0.007(z+c) 2 93 Y=-1.74+0.734(z+c)-0.005(z+c) 2 89<br />
z+c, ( z+c) 2 , b Y=2.15+1.023(z+c)-0.007(z+c) 2 +4.5(x) 94 NS<br />
A z, silt (%); c, clay (%); x, organic carbon (%); b, and bulk density (Mg/m 3 ).<br />
B NS, regression coefficient for the input variable, x is not significant.<br />
Discussion<br />
Knowledge <strong>of</strong> FC and PWP is essential for many plant and soil-water studies, especially those related to<br />
plant growth and deep drainage. The mean FC observed for HYC and GV in this study were lower than those<br />
reported by Murphy and Lodge (2001) for a Brown Vertosol (46 % vol) but higher than for a Red Chromosol<br />
(35 % vol). The PWP <strong>of</strong> the both HYC and GV found in this study were higher than by Murphy and Lodge<br />
(2001) for the Red Chromosol (11 % vol). However, the PAWC found in this study for all three soil<br />
suborders (11 – 15 % vol) were lower than those reported by Murphy and Lodge (2001) for a Brown<br />
Vertosol (23 % vol) and Red Chromosol (24 % vol).<br />
The mean FC and PWP found for each <strong>of</strong> the soil texture class was higher than those reported by Jensen et<br />
al. (1990) for US soils except for sandy soils. For sandy soils, both the FC and PWP were lower than Jensen<br />
et al. (1990). However, PAWC (12 - 15 % vol) compared favourably with Jensen et al. (1990) (13 - 15%<br />
vol) except for sandy soils which were lower. The FC, PWP and PAWC found in this study also compare<br />
favourable with those found for other Australian soils based on field textures, FC (6 - 45 vol%), PWP (2-25<br />
% vol) and PAWC (4 - 20 %vol), (Better <strong>Soil</strong>s 2005). Hochman et al. (2001) found increase in field<br />
measured PAWC with increase in clay content with depth for both Black and Grey Vertosols while Ratliff et<br />
al. (1983) reported no significant increase in PAWC with increase in clay content from silt loam to clay. In<br />
our study, the FC and PWP for the HYC and RS increased with depth. However, it did not result in any<br />
significant increase in PAWC with depth. This was due to an increase in both FC and PWP with increasing<br />
clay content.<br />
© 2010 19 th World Congress <strong>of</strong> <strong>Soil</strong> Science, <strong>Soil</strong> Solutions for a Changing World<br />
1 – 6 August 2010, Brisbane, Australia. Published on DVD.<br />
135
The relationships between clay content and FC and PWP found in this study are consistent with those<br />
reported for other soils (e.g. King and Stark 2005; Minasny et al. 1999; Iqbal et al. 2005). For example, Iqbal<br />
et al. (2005) found greater values <strong>of</strong> volumetric water content at paddock locations where the percentage clay<br />
content was high; an indication <strong>of</strong> the greater water holding capacity <strong>of</strong> soil micropores between clay-sized<br />
particles. Minasny et al. (1999) found a positive non-linear relationship between clay content and FC and<br />
PWP. The equations developed in this study can be used to predict FC and PWP for similar soil types. These<br />
samples used in this study (N=72) cover a wide range in soil textural composition but limited range in<br />
organic carbon content. Therefore, further research, covering wide range <strong>of</strong> landuse systems, soil types and<br />
climatic conditions, is required to improve these predictive equations.<br />
Conclusions<br />
FC, PWP and PAWC were found to be significantly higher for GV followed by HYC and RS. FC was<br />
affected by both clay content and organic carbon (OC) content but PWP was only affected by clay content<br />
but not by OC. The developed equations can be used to predict FC and PWP for similar soils elsewhere.<br />
However, further research is needed to validate/improve the predictive models for a wider range <strong>of</strong> organic<br />
carbon content, soil types, soil texture and climatic conditions.<br />
Acknowledgement<br />
This research was jointly funded the Grains Research and Development Corporation and the Victorian<br />
Department <strong>of</strong> Primary Industries. The authors would like to thank A. Weidemann, I. McLelland, M.<br />
McLelland and R. Dunlop for the use <strong>of</strong> their paddocks.<br />
References<br />
Better <strong>Soil</strong>s (2005) Better <strong>Soil</strong>s. Module 5: Managing soil moisture, 5.1 <strong>Soil</strong> Water Holding Capacity.<br />
http://www.bettersoils.com.au/module5/5_1.htm<br />
Cock GJ (1985) Moisture characteristics <strong>of</strong> irrigated Mallee soils in South Australia. Australian Journal <strong>of</strong><br />
Experimental Agriculture 25, 209-13<br />
Hochman Z, Dalgliesh NP, Bell KL (2001) Contribution <strong>of</strong> soil and crop factors to plant available soil water<br />
capacity <strong>of</strong> annual crops on Black and Grey Vertosols. Australian Journal <strong>of</strong> <strong>Soil</strong> Research 52, 955 -<br />
961.<br />
Iqbal J, Read JJ, Thomasson AJ, Jenkins JN (2005) Relationships between <strong>Soil</strong>–Landscape and Dryland<br />
Cotton Lint Yield. <strong>Soil</strong> Science Society <strong>of</strong> American Journal 69, 872-882.<br />
Isbell RF (2002) ‘The Australian <strong>Soil</strong> Classification.’ (CSRIO Publishing: Collingwood, Vic.)<br />
Jensen ME, Burman RD, Allen RG (1990) Evapotranspiration and Irrigation Water Requirements. ASCE<br />
Manuals and Reports on Engineering Practice No. 70. American Society <strong>of</strong> Civil Engineers, New<br />
York, NY.<br />
Keating BA, Carberry PS, Hammer GL, Probert ME, Robertson MJ, Holzworth D, Huth NI, Hargreaves<br />
JNG, Meinke H, Hochman Z, McLean G, Verburg K, Snow V, Dimes JP, Silburn M, Wang E, Brown<br />
S, Bristow KL, Asseng S, Chapman S, McCown RL, Freebairn DM, Smith CJ (2003) An overview <strong>of</strong><br />
APSIM, a model designed for farming systems simulation. European Journal <strong>of</strong> Agronomy 18, 267-<br />
288.<br />
King BA, Stark JC (2005) Spatial variability considerations in interpreting soil moisture measurements for<br />
irrigation scheduling. http://info.ag.uidaho.edu/pdf/BUL/BUL0837.pdf<br />
Minasny B, McBratney AB, Bristow KL (1999) Comparison <strong>of</strong> different approaches to the development <strong>of</strong><br />
pedotransfer functions for water-retention curves. Geoderma 93, 225–253.<br />
Murphy SR, Lodge GM (2001) <strong>Soil</strong> water characteristics <strong>of</strong> a red chromosol and brown vertosol and pasture<br />
growth. Proceedings <strong>of</strong> the 10th Australian Agronomy Conference, Hobart, 2001.<br />
http://www.regional.org.au/au/asa/2001/2/b/murphy1.htm?print=1<br />
Payne RW, Harding SA, Murray DA, Soutar DM, Baird DB, Welham SJ, Kane AF, Gilmour AR, Thomson<br />
R, Webster R, Wilson GT (2007) ‘The Guide to GenStat, Release 10. Part 2: Statistics.’ (VSN<br />
<strong>International</strong>, Hertfordshire, UK).<br />
<strong>Rab</strong> MA, Fisher PD, Armstrong RD, Abuzar M, Robinson NJ, Chandra S (2009) Advances in precision<br />
agriculture in south-eastern Australia. IV. Spatial variability in plant-available water capacity <strong>of</strong> soil<br />
and its relationship with yield in site-specific management zones. Crops and Pastures 60, 885-900.<br />
Ratliff LF, Ritchie JT, Cassel DK (1983) A survey <strong>of</strong> field-measured limits <strong>of</strong> soil water availability and<br />
related to laboratory-measured properties. <strong>Soil</strong> Science Society <strong>of</strong> America Journal 47, 770–775.<br />
© 2010 19 th World Congress <strong>of</strong> <strong>Soil</strong> Science, <strong>Soil</strong> Solutions for a Changing World<br />
1 – 6 August 2010, Brisbane, Australia. Published on DVD.<br />
136


