A Value Chain Analysis of the Cashew Sector - AGOA Export Toolkit
A Value Chain Analysis of the Cashew Sector - AGOA Export Toolkit
A Value Chain Analysis of the Cashew Sector - AGOA Export Toolkit

You also want an ePaper? Increase the reach of your titles
YUMPU automatically turns print PDFs into web optimized ePapers that Google loves.
20<br />
Table 2.2 Farm Gate Producer Prices and <strong>Export</strong> Prices FOB for Raw <strong>Cashew</strong> Nuts (2003 – 2009)<br />
Year<br />
Quantity <strong>of</strong> RCN<br />
traded (t)<br />
Range <strong>of</strong><br />
producer prices at<br />
<strong>the</strong> farm gate<br />
(Ghana Cedi (GC)/kg)<br />
Range <strong>of</strong> FOB,<br />
Tema (US$ /t)<br />
(<strong>Export</strong> Price)<br />
Average percent age<br />
<strong>of</strong> FOB price obtained<br />
by farmers<br />
2003 31,335 N/A N/A N/A N/A<br />
Source <strong>of</strong> Information<br />
2004 38,181 0.20-0.30 600-700 69.2 CDP Annual Report (2004)<br />
2005 40,992 0.25-0.60 700-800 71.1 CDP Annual Report (2005)<br />
2006 47,962 0.30-0.45 500-600 69.5 CDP Annual Report (2006)<br />
2007 38,298 0.25-0.40 550-600 64.0 CDP Annual Report (2007)<br />
2008 61,590 0.35-0.60 700-900 54.5 CDP Annual Report (2008)<br />
2009 N/A 0.40-0.60 500-600 63.7<br />
no exclusive traders for raw cashew nuts. Often, <strong>the</strong>re are intermediaries<br />
or agents acting between traders, exporters and<br />
processing companies who provide information services and<br />
make deals. Th is has resulted in middlemen playing an important<br />
role in <strong>the</strong> marketing <strong>of</strong> nuts, and <strong>the</strong>reby reduced<br />
<strong>the</strong> margin or dividends accrued by cashew farmers.<br />
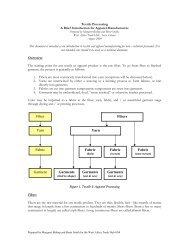
Figure 2.3 Major <strong>Cashew</strong> Production Zones<br />
Regional Boundary <strong>Cashew</strong> Production Zones<br />
<strong>Cashew</strong> Development Project Districts<br />
Table 2.3 Raw <strong>Cashew</strong> Nuts Trade in Ghana<br />
Computed using data available<br />
from <strong>the</strong> CDP (2009)<br />
Prices vary widely from place to place, from season to season,<br />
and even within <strong>the</strong> same season. Table 2.2 above shows<br />
RCN production, producer prices, FOB, Tema export prices<br />
and <strong>the</strong> average percentage <strong>of</strong> FOB prices obtained by farmers.<br />
Th e producer price is a function <strong>of</strong> many factors, <strong>the</strong> most<br />
important <strong>of</strong> which are international cashew supply and demand<br />
dynamics, domestic market conditions, <strong>the</strong> effi cacy <strong>of</strong><br />
<strong>the</strong> regulatory mechanism and <strong>the</strong> tax/levy structure for <strong>the</strong><br />
agricultural sector (personal comments by M. Das, 2009).<br />
It can be noted from Table 2.2 that <strong>the</strong> highest average farm<br />
gate producer price obtained so far was in 2009. During <strong>the</strong><br />
harvesting season, marketing companies liaise with private<br />
sector carting and haulage providers to ensure that <strong>the</strong> RCN<br />
purchased are transported to ports, especially <strong>the</strong> one at Tema.<br />
Presently <strong>the</strong>re are 13 marketing companies in Ghana which<br />
purchase cashews from farmers. Nine <strong>of</strong> <strong>the</strong>se are local companies,<br />
<strong>the</strong> o<strong>the</strong>r four are foreign and mainly <strong>of</strong> Indian origin.<br />
Th e leading marketing companies in <strong>the</strong> country are:<br />
Bet <strong>Export</strong>s Ltd, Olam Ghana Ltd, Blossom <strong>Export</strong>s Ltd,<br />
Mim <strong>Cashew</strong> Products, Rals Commodities Ltd, Ghana<br />
National Procurement Agency and Sri Amanan Ghana Ltd.<br />
Data on <strong>the</strong> volume <strong>of</strong> raw cashew nuts traded from 2003<br />
to 2009 are given in <strong>the</strong> Table 2.3 below:<br />
Year Quantity (t) <strong>Value</strong> (US$ ) Source <strong>of</strong> Information<br />
2003 31,335 15,667,500<br />
2004 38,181 20,999,550<br />
2005 40,992 29,930,000<br />
2006 47,962 23,981,000<br />
2007 38,298 21,064,000<br />
2008 61,590 45,367,000<br />
Source: Adaptation <strong>of</strong> <strong>Cashew</strong> Development Project data<br />
Ghana Ports and<br />
Harbours Authority<br />
Ghana Shippers’<br />
Council