a quarterly report by - Technopak
a quarterly report by - Technopak
a quarterly report by - Technopak

You also want an ePaper? Increase the reach of your titles
YUMPU automatically turns print PDFs into web optimized ePapers that Google loves.
perspective<br />
a <strong>quarterly</strong> <strong>report</strong> <strong>by</strong><br />
May 2009 / Volume 01<br />
a <strong>quarterly</strong> <strong>report</strong> <strong>by</strong> VOLUME 2 / 2009
Editorial Team<br />
Raghav Gupta, President I raghav.gupta@technopak.com I +91-9958522993<br />
Veenu Sharma, Senior Consultant I veenu.sharma@technopak.com I +91-9810562621<br />
Sajani Mrinalini Dutta, Associate Consultant I sajani.dutta@technopak.com I +91-9910502350<br />
Sadhna Sharma, Content Writer I sadhna.sharma@technopak.com I +91-9555930809<br />
Design & Development<br />
Bharat Kaushik, Design Manager I bharat.kaushik@technopak.com I +91-9811661493<br />
Arvind Sundriyal, Senior Designer I arvind.sundriyal@technopak.com I +91-9910493934
In This Perspective<br />
perspective<br />
a quar terly repor t <strong>by</strong><br />
With positive macro-economic news coming in from most quarters within India and from the large developed<br />
economies, the consumer sectors in India are seeing increased activity from Indian firms, international<br />
companies, investors, and real estate developers. In this second edition of the Perspective, we present<br />
updates and analyses across retail, consumer products, fashion (textile & apparel), healthcare, tourism,<br />
and education.<br />
India’s ‘roti, kapda aur makaan’ consumption hierarchy is changing. This has already changed to ‘roti,<br />
mobile, gaadi aur necklace’ and may soon further evolve to ‘roti, mobile, personal transport, and jewelry<br />
& watches’. In this article, we present the drivers of this change and implications this has for consumer<br />
product companies.<br />
Over the last 12-16 months, the Indian media has gone to town over modern retail’s failure to take-off,<br />
grow and attain profitability. However, the reality is very different. In A Financial Deep Dive into India’s<br />
Retail Sector, we present an analysis of how the modern retail landscape is likely to shape up <strong>by</strong> 2014.<br />
We also present opportunities for modern retailers to increase margins and returns. Continuing with retail,<br />
in a piece titled Retail Real Estate Trends, we provide a snapshot of key trends and imperatives for the<br />
industry. These include the importance of collaboration between retailers and developers, and the need for<br />
transparency in occupancy charges.<br />
The upcoming introduction of GST in India presents retailers and manufacturers an opportunity to<br />
optimise their supply chains. We provide details on how they can capitalise on this opportunity in GST: An<br />
Opportunity to Enhance the Supply-chain.<br />
In FDI: A Catalyst for Growth of the Textile & Apparel Industry, we explore how FDI can push the<br />
textile and apparel industry towards a new growth path, and the factors that make investment in this<br />
industry an attractive option.<br />
Building Operational Efficiency in Healthcare Delivery presents how hospitals can reduce costs and<br />
improve efficiencies, the importance of customer relationship management, best practices in hospital<br />
revenue management cycle, and the role of facility planning in improving performance.<br />
We trace the journey of tourism and its growth in India, the factors which gave it a growth push, and the<br />
distinct forms of tourism that have now taken shape. This is covered under Indian Tourism – Managing<br />
Growth <strong>by</strong> Breaking Barriers.<br />
Forecasting the Financial Potential in Education examines the investment scenario for creation of<br />
additional capacity in the education sector and the relevant regulatory developments. It also presents<br />
some investment thumb rules for entrepreneurs and investors.<br />
Lastly, in Social Media: An Emerging Medium for Business Growth, we present the emergence and<br />
significance of social media networks and how companies across the world are leveraging their power for<br />
diverse business and social purposes.<br />
We hope you enjoy reading this Perspective, as much as we did putting it together.<br />
Raghav Gupta, President I raghav.gupta@technopak.com<br />
Volume 02 / 2009<br />
| Volume 02
perspective<br />
a quar terly repor t <strong>by</strong><br />
Volume 02 / 2009<br />
Contents<br />
01<br />
02<br />
08<br />
22<br />
30<br />
40<br />
Roti, Mobile, Gaadi aur Necklace<br />
Arvind Singhal<br />
The consumer spending priorities have shifted much beyond the<br />
basic survival needs of ‘roti, kapda aur makaan’ and may soon<br />
reflect a new set –‘roti, mobile, personal transport, and jewellery &<br />
watches’.<br />
A Financial Deep Dive into India’s Retail Sector<br />
Raghav Gupta, Purnendu Kumar, Rohit Bhatiani<br />
An analysis of how the modern retail landscape would shape up<br />
in 2014 and the opportunities for modern retailers to increase<br />
margins and returns.<br />
Retail Real-estate Trends<br />
Anil Rajpal, Rohit Bhatiani, Preeti Gupta<br />
A snapshot of key trends and imperatives for the industry that is<br />
currently in a state of renewal and covers its journey from being<br />
owner or developer driven to being retailer driven.<br />
GST : Impact on the Supply Chain<br />
Anil Rajpal, Sachin Jagtap<br />
Post the introduction of new GST system in India, it is time for the<br />
manufacturers, retailers and service providers to align their supply<br />
chains <strong>by</strong> basing their logistics and warehousing decisions purely<br />
on efficiency optimisation as opposed to tax optimisation.<br />
FDI : A Catalyst for Growth of the<br />
Textile & Apparel Industry<br />
Prashant Agarwal, Luv Jasuja, Rohit Nasa<br />
Exploring how FDI could catapult the Indian textile and apparel<br />
industry into a different growth trajectory and how well positioned<br />
is this industry to attract the foreign investment.<br />
Building Operational Efficiency in<br />
Healthcare Delivery<br />
Dr. Rana Mehta, Gulshan Baweja, Abhishek Pratap Singh,<br />
Monika Kejriwal, Dr. Aditi Sharan<br />
Corporates in healthcare are continuously evolving and<br />
adopting best practices including ‘Kaizen’, CRM, revenue cycle<br />
management, facility re-design, and electronic medical records to<br />
rationalise costs and bring in efficiencies.
53<br />
56<br />
68<br />
76<br />
84<br />
Reconnecting with Consumers<br />
Arvind Singhal<br />
The Indian consumer has changed fundamentally over the past<br />
a few months. He now looks for lower-priced, acceptable-quality<br />
options and has turned more ‘fickle’, ‘greener’ and socially<br />
connected. What does this mean for manufacturers and marketers<br />
of consumer goods and services?<br />
Indian Tourism : Managing Growth <strong>by</strong><br />
Breaking Barriers<br />
Lokesh Kumar, Rahul Alex Daniel, Nikhil Saigal, Barbara Cebula<br />
A quick look at India’s travel and tourism industry, which backed <strong>by</strong><br />
strong economic growth and a major thrust from the government,<br />
has shown healthy growth and added a bouquet of niche products<br />
like wellness, caravan and helipad tourism.<br />
Forecasting the Financial Potential in Education<br />
Raghav Gupta, Stuti Mody, Kiran Walia<br />
Examining the investment scenario for creation of additional<br />
capacity in the education sector, some regulatory developments<br />
and key thumb rules for interested entrepreneur/investors.<br />
Social Media : An Emerging Medium for<br />
Business Growth<br />
Raghav Gupta, Veenu Sharma, Ashima Anand<br />
Understanding why and how companies across the world are<br />
leveraging the power of social media, a new and growing medium<br />
that has revolutionised the way people communicate with others.<br />
About <strong>Technopak</strong>
1<br />
perspective<br />
a quar terly repor t <strong>by</strong><br />
Volume 02 / 2009<br />
| Roti, Mobile, Gaadi Aur Necklace<br />
| Volume 02<br />
Roti, Mobile, Gaadi Aur Necklace<br />
This article appeared in Business Standard on August 13, 2009<br />
Notwithstanding the current concerns regarding the impact on consumer spending on account of a truant<br />
monsoon, India will see a spending of almost US$ 437 Bn in 2009 (assuming a GDP growth rate of 6%).<br />
Further, factoring in a 5% inflation and assuming that GDP will further grow at 6%, the consumer spending<br />
is likely to cross about US$ 479 Bn in 2010.<br />
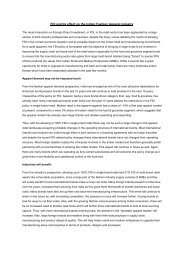
However, a deeper analysis of this gross data on consumer spending throws up some very interesting<br />
insights. For as long as we remember, roti, kapda aur makaan have been the primary needs and drivers of<br />
private consumption. Indeed, it seems that the impact of the sustained economic growth of the last 18 to<br />
20 years is that for a very large part of the population, consumption has moved beyond the basic survival<br />
needs. While food & grocery continue to account for the largest quantum of spending - about US$ 260<br />
Bn in 2009, followed <strong>by</strong> healthcare - about US$ 34 Bn and textiles & clothing the third largest - about US$<br />
31.25 Bn, the surprise numbers 4, 5, and 6 items on the consumer spending list in 2009 are spending on<br />
mobile phones and talk-time - about US$ 25 Bn, jewellery & watches - about US$ 24.58 Bn, and personal<br />
transport comprising two/four-wheelers including spending on fuel and repairs/maintenance - about US$<br />
23.95 Bn.<br />
This data, of course, is at some variation with the official data since this spending includes some through<br />
the parallel economy, but is more reliable since it has been arrived at ‘bottom-up’ sector <strong>by</strong> sector. More<br />
interestingly, the growth rates in spending on non-basic needs are much faster now and therefore, it is<br />
likely that <strong>by</strong> 2012, spending on textiles and clothing could be relegated to the sixth spot and the hierarchy<br />
(excluding healthcare) will be roti, mobile, personal transport, and jewellery & watches.<br />
The shift in consumer spending priorities does not stop here. The total outlay of the government on higher<br />
education is about US$ 2 Bn. The estimated revenue of the higher education coaching market (including<br />
preparation for entrance examinations like JEE, CAT, GRE and GMAT) is about US$ 2.08 Bn. If tutoring and<br />
other self-learning is included, the guesstimated private spending in 2009 is almost US$ 10 Bn! Spending<br />
on domestic leisure (and religious) travel and tourism is expected to cross US$ 12.50 Bn in 2009, while<br />
the spending on consumer durables and consumer electronics is just about US$ 11.45 Bn. Spending on<br />
leisure and entertainment in 2009 is about US$ 11.45 Bn, nearly equaling the entire size of the personal and<br />
home care FMCG industry! Other very fast-growing categories of consumer spending include personal<br />
computing (including internet) where consumers will spend almost US$ 2.08 Bn in 2009, and personal<br />
grooming services where the spending is over US$0.83 Bn already and growing in strong double digits.<br />
There are several implications of these mega-shifts in consumer spending patterns. For the manufacturers<br />
and marketers, some of the imperatives include giving a fresh, much-deeper look into consumer and<br />
shopper behaviour using new age tools that go beyond traditional consumer/market research and then<br />
work the appropriate value proposition and delivery channels for their basket of goods and services. For<br />
entrepreneurs as well as businesses seeking to diversify, the implications are that there are incredibly<br />
large new business opportunities though, perhaps, these opportunities will require new business models<br />
(product, channel, consumer connect, delivery). Students planning their careers now would be well advised<br />
to study these new emerging sectors and plan accordingly. As is clear from the above, the sectors that<br />
are likely to create the most jobs (besides retail since most of this consumption will be facilitated through<br />
modern brick & mortar retail channels) are healthcare, telecom, travel & leisure, education & training,<br />
media & entertainment, personal grooming and fitness etc. The government itself has to get a much<br />
better understanding of these shifts since the implications are not only on its own revenue generation<br />
opportunities through direct and indirect taxation, but also in many other dimensions including vocational<br />
and higher education, and infrastructure (such as retail).<br />
Author<br />
Arvind Singhal, Chairman & Managing Director I arvind.singhal@technopak.com
A Financial<br />
Deep Dive<br />
into India’s<br />
Retail<br />
Sector<br />
Introduction 03<br />
Modern Retail Growth across<br />
Product Categories 03<br />
Financial Returns in Various<br />
Categories 04<br />
Margin Concentration Across<br />
Product Categories 05<br />
Inventory Management: The Key<br />
to Profitability 06<br />
Focus on Same Store<br />
Sales Growth 07<br />
Conclusion 07
3<br />
perspective<br />
a quar terly repor t <strong>by</strong><br />
Volume 02 / 2009<br />
| Volume 02<br />
Introduction<br />
Like any new greenfield industry in the country, modern retail has also seen a flurry of activities with<br />
entrepreneurs and corporates across geographies setting-up their ventures across various categories and<br />
formats in the last 4-5 years. While most of them are still testing waters and figuring out the right retail<br />
model/s, some have taken the early lead based on understanding of the local consumers and investment<br />
in the back-end.<br />
The industry is still in its early stage and has been in the media for wrong reasons in the recent months,<br />
with media writing off the modern retail evolution as a non-starter. While its true that there have been few<br />
instances of store closures due to sub-optimal location or poor execution, we feel that the market is still<br />
open and a significant business opportunity lies ahead for the retailers. The overall market continues to<br />
grow at 5+% and consumer aspiration for a better service environment still remains intact. In this article<br />
we have tried to understand the changes that are happening and the forecast on the retail landscape <strong>by</strong><br />
2014.<br />
While retailers are working on multiple formats across categories trying to identify the right retail model for<br />
themselves, the performance across formats will vary as each retail format has its own unique financial as<br />
well as operating performance metrics such as gross margin, operating cost, space productivity etc. This<br />
article also analyses the retailer inventory levels vis-a-vis those of the international peers, and identifies<br />
potential opportunities for retailers to increase the return on capital.<br />
Modern Retail Growth across Product<br />
Categories<br />
The modern retail in India has been primarily driven<br />
<strong>by</strong> the apparel & footwear category, with players<br />
like Raymonds, Madura Garments, Arvind Brands<br />
etc. setting up their outlets in 80s and 90s. While<br />
the margin offered <strong>by</strong> this category was high,<br />
the back-end too was fairly organized i.e. strong<br />
supplier base. The consumers especially the men<br />
at that time were also graduating from ready-tostitch<br />
to ready-to-wear segment, which helped<br />
these retailers in creating significant differentiation<br />
from the local mom & pop textile stores.<br />
Now with the entry of large corporates, other categories have also started to make their presence felt and<br />
the momentum in modern retail is building across categories, with food & grocery expected to see a lot of<br />
action in the coming years. This growth is due to entry of large Indian corporates like Reliance, Aditya Birla,<br />
TATA, Bharti, regional entrepreneurs and global retailers like Wal-Mart, Tesco, Carrefour, SPAR and others<br />
establishing their presence in the country.<br />
The 2 nd category which will have a significant impact is consumer electronics and mobile phones, where<br />
modernization has gained momentum not only due to retailers like Croma, Reliance Digital, Next and<br />
e-zone, but also due to major investments made <strong>by</strong> giants in consumer products like Sony, Samsung<br />
and LG. Most of these brands have established their own exclusive stores for their expansion strategy as<br />
| A Financial Deep Dive into India’s Retail Sector<br />
Exhibit 1<br />
Organised retail sales participation 2008 and 2014 projected<br />
50%<br />
40%<br />
30%<br />
20%<br />
10%<br />
0%<br />
Growth in Organised Retail Sales<br />
Organised retail sales 2014<br />
projected $ Mn and participation<br />
Organised retail sales 2008<br />
and participation<br />
Apparel<br />
Home<br />
(Furniture, DIY)<br />
Food and<br />
Groceries<br />
Footwear<br />
Phamacy<br />
and Wellness<br />
Consumer<br />
Electronics<br />
Jewellery<br />
and Watches<br />
Organised Retail Sales<br />
Books, Music<br />
and Entertainment<br />
2% 4% 6% 8% 10% 12% 14% 16%<br />
Total Category CAGR 2008 to 2014
perspective<br />
a quar terly repor t <strong>by</strong><br />
it helps them in showcasing their latest and high value products in a very high service environment. As<br />
the current MBO’s in the market are too small and cluttered, they do not provide a great experience to the<br />
consumers. Going forward, the big-box formats like hypermarkets and cash & carry will also contribute<br />
significantly in the growth of modern retail in this category.<br />
Apparel, which currently accounts for a major part of modern retail industry, will continue to modernize<br />
further with major growth coming from the entry of international retailers like Zara, Marks & Spencers, Top<br />
Shop and others. The hypermarkets, which currently get almost 30% to 40% of their revenues from apparel,<br />
will also help the category to modernize across various tiers of towns. We also see the emergence of large<br />
EBO’s of 4,000 - 5,000 sq. ft. targeted at the family audience in the coming days.<br />
Other interesting categories to have a higher contribution in modern retail include footwear (with contribution<br />
from major sportswear brands, domestic footwear brands and hypermarkets), watches (brands as well as<br />
department stores) and impulse driven categories like books & music.<br />
The growth in modern retail will get accelerated with the entry of global players and brands while Indian<br />
players continue to grow and create their own niche in the market on their own or in partnership with major<br />
global players.<br />
Financial Returns in Various<br />
Categories<br />
A study <strong>by</strong> <strong>Technopak</strong> on the financial returns<br />
across product categories and retail formats<br />
shows that in some of the categories like apparel,<br />
watches etc., the margins as well as the return on<br />
capital employed is on the higher side. Hence,<br />
these categories saw the entry of early modern<br />
retailers in the country. Other categories like food<br />
& grocery and consumer electronics rate lower on<br />
these parameters, and hence need higher space<br />
productivity and large business scale to create a<br />
viable long term business proposition.<br />
Exhibit 2<br />
In a category like consumer electronics, although the returns are lower, the retailers need to focus on<br />
additional services like extended warrantee, financing, etc. which helps them in improving their bottom-line<br />
(See GOME example later in the article). They also focus heavily on private labels which helps them earn<br />
the valuable extra margins. Internationally, this category has seen dominance of large players like Best Buy<br />
who have performed better than their industry peers and generated above average returns.<br />
We understand that the financial performance is an important criteria for any player interested in entering<br />
this sector; however, the final decision must be made after taking into account elements like scalability,<br />
ability to differentiate, consumer need gaps and organization’s own strengths. For example, categories<br />
like apparel/ fashion seem financially attractive but their downside is the threat of high markdowns. The<br />
challenge is to keep the brand relevant and fresh year after year. Also, with value retailers like Wal-Mart and<br />
Target focusing on the fashion aspect of their apparel brands in recent times, the apparel retailers across<br />
the globe are coming under pressure.<br />
Volume 02 / 2009<br />
35%<br />
Jewellery and Watches<br />
30%<br />
25%<br />
Apparel<br />
20%<br />
Phamacy and Wellness<br />
15%<br />
10%<br />
Food & Groceries<br />
Books & Music<br />
5%<br />
0%<br />
Footwear<br />
Home<br />
-2% -5% 0% 2% 4% 6%<br />
EBITDA<br />
8% 10% 12% 14%<br />
Size of bubble give sales per sq.ft.<br />
Source: <strong>Technopak</strong> analsis<br />
ROCE<br />
ROCE vs. EBITDA<br />
| Volume 02<br />
A Financial Deep Dive into India’s Retail Sector |<br />
4
5<br />
perspective<br />
a quar terly repor t <strong>by</strong><br />
Volume 02 / 2009<br />
| Volume 02<br />
Margin Concentration Across<br />
Product Categories<br />
<strong>Technopak</strong> undertook a thorough analysis of the supply chain for various retail categories to understand<br />
the spread of margin concentration across various stakeholders like manufacturers and retailers. The study<br />
shows that the categories involving high degree of R&D and marketing acumen tend to have a high margin<br />
concentration towards the manufacturers/brands while retailers enjoy higher margins on others. As shown<br />
in Exhibit 3, in categories like consumer electronics, FMCG, pharma etc., most of the product development<br />
happens at the manufacturer/brand level, hence the margins passed on to the retailers are on the lower<br />
side. In case of food & grocery, since most of the products in India are still consumed in raw form and very<br />
little value addition happens on the product from the farm till it reaches the consumer, the overall margin in<br />
the chain is low and more or less equally distributed between the retailer and the supplier.<br />
Exhibit 3<br />
Manufacturer/<br />
Brand Margin<br />
Retailer Margin<br />
10-12%<br />
Food &<br />
Groceries<br />
20-25%<br />
8-10%<br />
It is very important for a retailer to focus on increasing sales productivity, tighter inventory control, introduction<br />
of private labels and providing value added services in order to improve its financials. A classic example<br />
of the same is consumer electronics category wherein retailers work on private labels, extended warrantee<br />
etc. to increase their bottom-line.<br />
International Case Study in Margin<br />
Enhancement<br />
GOME is the leader in China’s CDIT retail market<br />
with product sales equivalent to US$ 6.6 Bn,<br />
presence in almost every Chinese province<br />
and more than 850 stores. GOME has a strong<br />
adherence to ‘Every Day Low Prices’ (EDLP) as<br />
well as ‘All Under One Roof’ strategies.<br />
CDIT is one of the most difficult categories in terms<br />
of managing higher gross margins. On top of that,<br />
the adoption of EDLP strategy makes business<br />
very difficult for retailers like GOME. Despite that<br />
the company has been able to maintain strong<br />
profitability. Although GOME has not been able to<br />
| A Financial Deep Dive into India’s Retail Sector<br />
Spread of Margin Concentration across Stakeholders<br />
Categories with Manufacturer Margin Concentration<br />
8-10%<br />
20-25% 20-25%<br />
10-12%<br />
12-15%<br />
25-30%<br />
6-8%<br />
Categories with Retailers Margin Concentration<br />
35-40%<br />
30-35%<br />
20-25% 20-25%<br />
25-30%<br />
CDIT FMCG Pharma Mobiles Books &<br />
Music<br />
Exhibit 4<br />
20%<br />
15%<br />
10%<br />
5%<br />
0%<br />
30-35%<br />
35-40% 35-40%<br />
Apparel Home Footwear<br />
GOME -Other Income and<br />
Gross Profit Margin Growth<br />
2005 2006 2007 2008<br />
Other Income as % of Revenue Gross Profit Margin
perspective<br />
a quar terly repor t <strong>by</strong><br />
increase its gross margin from its product sales greatly, it has been able to increase its profitability <strong>by</strong><br />
increasing the share of revenue from other income streams like income from supplier/brands, rental and<br />
display income and services like air conditioner installation. As shown in Exhibit 4, GOME has been able<br />
to increase its gross income significantly which has resulted in gross margin improvement. Typically, most<br />
of the other income elements involve very little expense for the retailer and hence, contribute directly to<br />
the bottom line. Indian retailers would also need to focus on extracting maximum value from their existing<br />
assets in order to grow profitably.<br />
Inventory Management:<br />
The Key to Profitability<br />
Indian modern retail is still in a very nascent stage with most of the retailers in the early stage of growth.<br />
It is very important for the retail CEOs to invest in robust dashboards to monitor the performance of the<br />
company. Till now, most of the retailers in India were focusing on the top-line growth and product margin<br />
improvement; however, the recent slowdown has forced many of them to rethink on the way key operational<br />
parameters in the business are monitored. While top-line growth, sales per square feet, gross margin,<br />
rentals etc. are important, it is equally important to focus on the inventory. An analysis carried out <strong>by</strong><br />
<strong>Technopak</strong> on inventory management in apparel category (see Exhibit 5) shows that Indian retailers are<br />
way behind their international counterparts on inventory management while almost being at par with them<br />
on gross margin. A higher inventory not only leads to greater risk of markdowns but also results in an<br />
increasing need for working capital further leading to lower ROCE. Further analysis shows that just 1%<br />
increase in sales and gross margin would increase the ROCE <strong>by</strong> 5% and 7% respectively whereas a<br />
reduction of 1 month inventory would lead to a 10% increase in ROCE. Given the current inventory levels of<br />
Indian retailers, an improvement in inventory through better forecasting, replenishment and lesser wastage<br />
can easily decrease inventory levels thus freeing up important capital which can be utilized for expansion<br />
plans.<br />
Exhibit 5<br />
Average Indian<br />
Inventory<br />
Inventory Management-A Comparison Between Indian and Internationl Retailers<br />
40% 44%<br />
110<br />
81<br />
260<br />
Days of Inventory/Sales- Indian<br />
Indian Retailers<br />
51%<br />
93<br />
63%<br />
44%<br />
133<br />
160<br />
40%<br />
58%<br />
60<br />
Raymond Apparel<br />
Fab India<br />
Koutons<br />
Trent<br />
Color Plus<br />
Provogue<br />
Kewal Kiran<br />
Gross Margin- Indian<br />
37%<br />
38<br />
Gap<br />
45% 49%<br />
Nike<br />
Quiksilver<br />
International Retailers<br />
48%<br />
67%<br />
3 times more inventory in India<br />
Liz Claiborne<br />
H&M<br />
Urban Qutfitters<br />
39%<br />
48%<br />
48 50 43 30 34 29<br />
Days of Inventory/Sales- International<br />
Ann Taylor Stores<br />
Volume 02 / 2009<br />
Average International<br />
Inventory<br />
Gross Margin- International<br />
| Volume 02<br />
A Financial Deep Dive into India’s Retail Sector |<br />
6
7<br />
perspective<br />
a quar terly repor t <strong>by</strong><br />
Volume 02 / 2009<br />
| Volume 02<br />
Focus on Same Store Sales Growth<br />
Till 2008 Indian retailers were rapidly increasing their same store sales due to increasing consumption,<br />
product price inflation and relatively low maturity of the stores. We saw a lot of pressure on same store<br />
sales growth in the recent months which can be attributed to slowdown in consumption and cannibalization<br />
from the new stores. Since the growth can’t always be in double digits, it becomes important for the retailer<br />
to keep improving its value proposition and continuously work on increasing the same store sales growth<br />
as the operating costs are bound to increase year after year. Also, as most of the retailers are in expansion<br />
mode, lower growth in same store sales may lead to increase in debt requirement to support expansion<br />
plans.<br />
An analysis of the same store sales growth in some of the other markets shows that in food & grocery, the<br />
same store sales growth mirrors ‘Consumer Price Inflation’ in food. In other categories like apparel, the<br />
same store sales growth is more dependent on how various retailers differentiate on merchandise, design<br />
and product development.<br />
As the retail sector in India matures, the high same stores sales growth is expected to come down and<br />
retailers would need to devise strategies to increase consumer ticket value and entice more consumers to<br />
the stores. <strong>Technopak</strong> expects that the ability to achieve high same store sales growth would be the key<br />
driver for success in future.<br />
Conclusion<br />
The modern retail in India is a bit unique since in most of the categories players see competition coming not<br />
from the other modern retailer but from the unorganized sector that works on low price, very high service<br />
standards and convenience proposition.<br />
Retailers in India experienced high growth during the period 2004-07. However, as the slowdown hit the<br />
Indian economy in 2008, modern retail in India too felt its impact to a large extent. Slowdown in consumer<br />
spending and difficulty in finance availability created tremendous difficulties for Indian retailers. At the same<br />
time, the slowdown also made retailers realize the importance of profitable growth rather than top-line<br />
growth. Modern retail will experience significant growth in all categories in the next few years but retailers<br />
would need to focus on improving operations to achieve sustainable growth. With worries on external<br />
factors like low consumer spending and high occupancy cost subsiding to a certain extent, retailers would<br />
need to focus on international issues. While better inventory management is expected to improve the<br />
working capital management, other initiatives like private label development, merchandise improvement<br />
are expected to encourage customers to spend more and increase top-line revenues.<br />
Authors<br />
Raghav Gupta, President I raghav.gupta@technopak.com<br />
Purnendu Kumar, Associate Vice President I purnendu.kumar@technopak.com<br />
Rohit Bhatiani, Principal Consultant | rohit.bhatiani@technopak.com<br />
| A Financial Deep Dive into India’s Retail Sector
Retail<br />
Real-estate<br />
Trends<br />
Introduction 09<br />
Collaborative Efforts Between<br />
Retailers and Developers 10<br />
Increasing Role of<br />
Entertainment Formats in<br />
Mall Development 11<br />
Rising Importance for<br />
Brand Building in Malls 13<br />
Rightsizing of the Mall<br />
Becoming Crucial 14<br />
Renovation and Re-invention<br />
of High-streets 15<br />
Opportunity for Professional<br />
Mall Management Operators<br />
on the Rise 16<br />
Convergence of Leisure,<br />
Hospitality, Office and<br />
Retail Space 17<br />
Increasing Prominence of<br />
Community Markets 18<br />
Need for Greater Transparency<br />
in Occupancy Charges 19<br />
Emerging Opportunities<br />
in Retail Real-estate 20<br />
Conclusion 21
perspective<br />
a quar terly repor t <strong>by</strong><br />
Volume 02 / 2009<br />
9 | Retail Real-estate Trends<br />
| Volume 02<br />
Introduction<br />
Indian retail and real-estate sector underwent numerous changes in 2008. Lower consumer spending,<br />
high real-estate cost and lack of quality real-estate development prompted Indian retailers to revamp<br />
their current operations <strong>by</strong> closing stores at unprofitable locations, renegotiate rentals with developers,<br />
curb spending and reposition themselves to ride through the tough times. All this has resulted in altered<br />
relationships between real-estate developers and retailers.<br />
Currently, the Indian retail industry is experiencing a steep learning curve. The industry is witnessing<br />
expansion, consolidation, acquisition; and retailers are restructuring and re-planning toward robust &<br />
efficient business models for long-term sustainability. The market is taking a ‘U’ turn from being a landlord/<br />
developer driven market to being retailer driven. The current turbulence has been a reality check for<br />
retailers to take stock of their strategy and operations and leaves the industry in a stronger position to take<br />
advantage of the rebound.<br />
The mall space in top-nine cities (Delhi, Mumbai, Kolkata, Chennai, Bangalore, Pune, Hyderabad,<br />
Ahmedabad and Ludhiana) is estimated to be around 37 Mn sq.ft. On a pan-India level, based on the mall<br />
supply estimates for 37 cities spread across the four geographical zones of India, 2009 is expected to see<br />
an addition of around 44 Mn sq.ft. of mall space. According to Cushman & Wakefield(C&W), however, just<br />
about 41% of the supply is likely to get delivered <strong>by</strong> the year-end.<br />
Top cities in India such as NCR, Mumbai, Kolkata, Pune, Bangalore, Chennai and Hyderabad witnessed<br />
on an average 10% vacancy rates in 1Q 2009 for available space in operational malls. NCR recorded the<br />
highest level of vacancy rate of 25% in 1Q 2009 owing to sluggish retail sales and despite the shortfall in<br />
mall supply-rate.<br />
We expect that the modern retail would be back on its growth trajectory in the next two to three quarters.<br />
The demand for quality real-estate is expected to grow exponentially over the next 4 to 5 years fuelled <strong>by</strong><br />
demand from the organized retailers. The success of retail real-estate business depends on the developer’s<br />
ability to recognize and respond to the changing consumer and market trends.<br />
As per <strong>Technopak</strong> and C&W, it is estimated that an additional 65 Mn sq.ft. of mall space would be required<br />
in these top 9 cities <strong>by</strong> 2013-14.<br />
This current slowdown in mall construction, however, is expected to keep the supply low over 2009-11. It<br />
may help in maintaining a healthier demand-supply equation in the retail-estate sector.<br />
India is getting into an interesting phase as far as retail and real-estate is concerned and we will be witnessing<br />
many world-class shopping centers being created <strong>by</strong> developers. Builders backed <strong>by</strong> the global funds and<br />
skill-sets are now well equipped to create center which can be benchmarked against the very best in the<br />
world and take Indian real-estate sector into the next orbit.<br />
Our estimates predict positive signs of growth coming through an increased demand for all segments of<br />
the retail real-estate sector. The challenge for the sector is to create properties though proper planning and<br />
differentiation so that operations can be extended over a period of time.
Collaborative Efforts<br />
Between Retailers and<br />
Developers<br />
perspective<br />
a quar terly repor t <strong>by</strong><br />
Volume 02 / 2009<br />
01<br />
Lower or negative revenue growth over last year on same store basis and high rental cost of the stores<br />
added in 2007-08 have forced brands/retailers to take a re-look at their real-estate portfolio. In the second<br />
half of 2008, malls across the country saw a drop of 25% to 30% in footfalls and 10% to 15% dip in sales.<br />
Retailers are delaying their expansion plans, resizing their existing stores or are closing down stores at<br />
unviable locations.<br />
Corrections of rentals in the range of 25% to 40% across major cities and markets have been witnessed<br />
over the last 2 to 3 quarters. Retailers have become more cautious in their approach and are undertaking<br />
detailed feasibility studies before signing any new deal for taking up space in the malls. They are also<br />
negotiating with developers before closing the deal. Developers are experiencing low occupancy rates and<br />
have low negotiation power for charging high rental rates due to sluggish demand from retailers for new<br />
space booking. Mall operators and builders are looking at various options to increase profits.<br />
Big retail companies are forging revenue share arrangements and minimum-guarantee opportunities with<br />
mall owners and developers. This is expected to be the model of business relationships between organized<br />
retail and property owners in the future. The use of the revenue-share model is expected to gain momentum<br />
in the future as more and more Indian developers become corporatized. Retailers are looking at building<br />
long-term and success based relationships with mall developers.<br />
Developers are also offering greater incentives in the form of longer rent-free period, reducing fixed<br />
occupancy cost, sharing capex with retailers, concessions in rentals to prevent exit of existing tenants.<br />
Furthermore, innovative marketing initiatives such as free gift vouchers to customers with every purchase<br />
and free parking are being adopted to draw customers in the malls .<br />
Retailers are also helping developers with their operational expertise to devise strategies best fitted with<br />
the overall mall positioning and concept such as devising good tenant mix and assistance in overall mall<br />
management. It is expected that such initiatives and tie-ups would be key to success in the future with the<br />
growing realization between retailers and developers to devise models that are best suited to their financial<br />
interests.<br />
Exhibit 1<br />
Prominent Tie-ups<br />
Phoenix tie-up with Entertainment World Developers Pvt. Ltd. and Big Apple Real Estate Pvt. Ltd.<br />
Entry of Kshitij Retail Destinations in mall management space<br />
Provogue’s tie-up with Liberty International<br />
| Volume 02<br />
Retail Real-estate Trends | 10
perspective<br />
a quar terly repor t <strong>by</strong><br />
Volume 02 / 2009<br />
11 | Retail Real-estate Trends<br />
| Volume 02<br />
Increasing Role of<br />
Entertainment Formats in<br />
Mall Development<br />
02<br />
Entertainment is an increasingly vital component in the development of new malls. One of the key<br />
developments that has happened over the past few years is the addition of entertainment element as part<br />
of the shopping center.<br />
In a bid to offer a complete shopping-andentertainment<br />
experience for the entire family, mall<br />
developers in India are also placing an enhanced<br />
emphasis on entertainment-oriented components<br />
such as multi-plexes, video-game arcades, playing<br />
area for children etc.<br />
New age shopping centers have started including<br />
elements such as sports facilities, theatres,<br />
children’s activities, gardens and restaurants to<br />
provide customers with multiple options on where<br />
to shop, what to do. It makes the entire mall<br />
environment much more vibrant as well as provides<br />
an element of differentiation.<br />
Entertainment Examples - India Planned Components<br />
DB Realty Orchid Ozone mall<br />
spread over 2.5 Mn sq.ft. expected<br />
to open <strong>by</strong> 2009 end.<br />
Ambuja Housing Development in<br />
Kolkata.<br />
A mystifying water themed<br />
atrium, a 20-screen mega-plex, a<br />
kids 'play & care' zone and food<br />
courts offering world cuisine<br />
overlooking the water themed<br />
atriums.<br />
A 1,000 sq.ft. butterfly park on<br />
the second level housing 40<br />
species of butterflies.<br />
There is a growing need for more such developments in the future to create differentiation between various<br />
malls. Developers need to realize that their shopping centers need to be entertaining, and that shoppers<br />
want their malls and town centers to blend with and reflect on their own communities. This shopping and<br />
entertainment concept that includes interactive retailing, state-of-the-art movie theatre complexes, minimotor<br />
speedways, natural rock climbing walls, cycling, ice rinks, lakes etc. has done very well globally<br />
and gained popularity as a mall format. A large number of major malls in the US & other countries have<br />
repositioned themselves over the years and included entertainment as a key element to attract higher and<br />
wider footfalls. Much of that adaptation has been centered on becoming a one-stop entertainment, dining<br />
and shopping destination with broader appeal than that offered <strong>by</strong> simple food courts.<br />
Exhibit 3<br />
Entertainment Examples Planned Components<br />
Exhibit 2<br />
Key Developments with Entertainment<br />
Element-India<br />
The Dubai Mall World's largest aquariums featuring 33,000 living animals; an olympic-size ice rink; an<br />
entertainment section including the region's first SEGA indoor theme park; and KidZania® - a<br />
children's 'edu-tainment' center.<br />
Mills Corporation, an American mall developer<br />
(malls ranging from 1.2 Mn sq. ft. to 1.9 Mn<br />
sq.ft.<br />
Key Developments with Entertainment Element - International<br />
With an average occupancy rate of 96%, offers ‘Shopper-tainment’ –interactive retailing, stateof-the-art<br />
movie theater complexes, mini motor speedways, natural rock climbing walls, ice<br />
rinks, laser tags and more.<br />
In the Indian context, multiplexes have already emerged as the most significant entertainment option in the<br />
malls. The need of the hour is to look at more innovative entertainment elements as a key to differentiate<br />
malls.
Exhibit 4<br />
Phase 1<br />
(1920-1950)<br />
Development of<br />
Shopping Center<br />
Phase 2<br />
(1950-2000)<br />
Era of Modern<br />
Shopping Mall<br />
Evolution of Shopping Centers in the US<br />
Garden City<br />
Retail Development<br />
Customer Dissonance<br />
Theme / Festival<br />
Centers<br />
Cost<br />
Focus on<br />
Entertainment<br />
Lifestyle<br />
Centers<br />
perspective<br />
a quar terly repor t <strong>by</strong><br />
Shopping Center<br />
Development of Operational Process<br />
Regional Center<br />
Factory Outlets<br />
Differentiation<br />
Bigger Malls<br />
Competition from Discounters & Super Centers<br />
Community<br />
Participation<br />
The retail center of the future — whether it is enclosed or open-air, big or small, theme-based or general<br />
- will also be designed to resemble a community, not just a place to shop. This implies an environment<br />
that forges links with the communities <strong>by</strong> opening wellness centers, libraries, city halls and play area for<br />
children.<br />
Volume 02 / 2009<br />
| Volume 02<br />
Retail Real-estate Trends | 12
perspective<br />
a quar terly repor t <strong>by</strong><br />
Volume 02 / 2009<br />
13 | Retail Real-estate Trends<br />
| Volume 02<br />
Rising Importance for<br />
Brand Building in Malls<br />
03<br />
Established developers are trying to move towards a national footprint of malls. This is based on the belief<br />
that a multi-city presence gives better access to funds and global expertise. Also, it helps in attracting the<br />
retailers <strong>by</strong> leveraging the brand value gained in one city.<br />
The developers are using the power of an existing brand name to support company expansion plans same<br />
as well as new cities.<br />
Exhibit 5<br />
Major Developers Brand Leverage<br />
K Raheja Group promoted Inorbit Mall<br />
Prestige Group<br />
JP Infrastructure Pvt. Ltd.<br />
Phoenix Mills<br />
Examples of Brand Building in Malls<br />
After a successful stint in Malad, it has opened 4 malls in Vashi, Pune, Bangalore<br />
and Hyderabad. They have plans to open 4 more malls <strong>by</strong> 2010 under the ‘Inorbit’<br />
brand.<br />
Planning to open 5 to 6 malls in South India under the brand ‘Forum’ after the<br />
success of Forum Mall in Bangalore.<br />
Based on the reputation gained <strong>by</strong> ISCON Mega mall, it has opened 4 malls under<br />
the same umbrella in Gujarat and plans to expand further in other cities of Gujarat.<br />
Replicate the success gained <strong>by</strong> its ‘High Street Phoenix Mall’ in other cities<br />
and plans to expand further under the brand names – ‘High Street Phoenix’ and<br />
‘Phoenix Market City‘.<br />
Strong brand equity and early mover advantage can lead to quick returns and early break-even. Strong<br />
planning and operational capabilities expand the developers’ experience and ability to launch successful<br />
retail spaces across different locations. Brand image and identity spreads across various locations, thus<br />
leading to negligible advertisement and marketing costs for future projects. Consumers are more willing<br />
to try the new mall as they perceive it to have the same quality and service level and other attributes as in<br />
their original favorite.<br />
A chain of malls brings an image of consistency and attracts brand loyalty. However, it is very important for<br />
the developer to maintain the same quality and service standards of the brand across different cities. This<br />
strategy of leveraging on the brand can be extremely successful and profitable if it is correctly implemented<br />
and can create the right image for the new mall even before it starts functioning in the city.
Rightsizing of the Mall<br />
Becoming Crucial<br />
perspective<br />
a quar terly repor t <strong>by</strong><br />
Volume 02 / 2009<br />
04<br />
Mall developers in India joined their peers across the globe in developing large malls and launched many<br />
ambitious projects with size greater than 1 Mn sq.ft. Size gradually became important for Indian mall<br />
developers. Many developers got in the race to build the biggest mall in a city/town more as an ego fulfilment<br />
exercise overlooking the importance of catchment needs, demand-supply scenario and sustainability<br />
aspects. This trend was not restricted to just mega malls in metropolitan cities and was soon seen in<br />
other cities like Ahmedabad, Nagpur etc. too. In some cases, the sheer size of these projects along with<br />
the supply of other upcoming retail real-estate developments didn’t fit very well with the catchment’s retail<br />
appetite resulting in an oversupply scenario. Also, with the change in economic scenario, low consumer<br />
sentiment and lack of footfalls, many retailers became cautious about their expansion plans. Retailers are<br />
either walking out of malls or rightsizing their portfolios to overcome their challenges.<br />
In face of the oversupply of retail space and resulting difficulties in getting tenants on board even during the<br />
construction phase of such large projects, the developers are now making necessary changes <strong>by</strong> tweaking<br />
the size of the mall to suit the demand-supply scenario. Mall developers now are becoming increasingly<br />
aware of the importance of getting the size of the mall right. The perception of what the right size of a retail<br />
real-estate development should be, is undergoing a significant shift.<br />
There have been different views on mall sizes. A large mall would bring all the required components under<br />
one roof however, it would be difficult to lease a very large mall and get multiple anchor tenants. On the<br />
other hand, a small mall may not be able to have the right retail anchors and entertainment mix. We feel the<br />
right strategy is to base the size of the mall on the size of its catchment area, its purchasing capacity, need<br />
gaps and existing and potential supply of retail space in the catchment.<br />
Right sizing would start from the planning stage involving a thorough study of the needs of the catchment,<br />
existing supply and potential competition. This would also benefit the developers with regards to completion<br />
on time, lower spend on attracting retailers and lower capital requirement. In addition to right sizing the<br />
mall, developers also need to differentiate their malls through elements like entertainment, handicrafts<br />
etc.<br />
| Volume 02<br />
Retail Real-estate Trends | 14
perspective<br />
a quar terly repor t <strong>by</strong><br />
Volume 02 / 2009<br />
15 | Retail Real-estate Trends<br />
| Volume 02<br />
Renovation and<br />
Re-invention of<br />
High-streets<br />
05<br />
High-streets which till sometime back were the key customer interaction point for most of the product<br />
brands, are undergoing changes to compete with the onslaught of malls. Most of the new brands in<br />
recent times have preferred opening their stores in malls rather than high-streets as it guaranteed higher<br />
footfalls and better marketing & promotional activities for retailers and hassle free shopping environment<br />
for shoppers.<br />
High-street locations in India lack appropriate planning and are fraught with problems such as lack of<br />
maintenance of common areas, encumbrances on property, absence of single ownership and management,<br />
parking hassles etc. Despite these issues, retailers are now favoring high-streets as they feel locating the<br />
outlet in a high-street can act as a quasi-advertising medium and help them reduce their ad budgets. New<br />
brands tend to look at a high-street location to boost visibility. The trend of locating stores on the highstreets<br />
has picked up in the last one year as retailers experienced higher space productivity in stores on a<br />
high-street compared to those in a regular mall. Another reason for this could be the completion of fewer<br />
malls on time or lack of availability of quality retail real-estate space. Also, due to space limitation inside<br />
the city, most of the shopping malls are being developed outside the city limits, and the preference for<br />
shopping locations near home or within the city is driving consumers more towards the high-streets.<br />
In order to meet the expectations of consumers and retailers, high-streets are undergoing re-invention<br />
and renovation through up-gradation in overall appearance, facilities, tenant-mix and infrastructure. Local<br />
municipalities along with market associations are also playing active role in upgrading the high-streets. Key<br />
initiatives include up-gradation of Khan Market, Connaught Place and promotional events and festivals.<br />
We also expect these initiatives to spread to other high-streets in coming years. To make high-streets a<br />
sustainable business proposition for retailers, there is a need to focus on proper planning and regulations<br />
that can make high-streets more attractive and competitive in terms of tenant-mix, shopping environment<br />
and rentals especially in the wake of rising competition from new age malls.<br />
We also expect that with increasing focus on up-gradation of high-streets, professional high-street<br />
management companies in line with mall management companies would emerge. These companies<br />
would be responsible for entire upkeep, marketing and leasing of the high-street markets.
Opportunity for Professional<br />
Mall Management Operators<br />
on the Rise<br />
perspective<br />
a quar terly repor t <strong>by</strong><br />
Volume 02 / 2009<br />
06<br />
Professional mall management is emerging as a critical factor for the success of malls and the retail<br />
industry across the world owing to increasing competitiveness in the industry and the need to achieve<br />
greater differentiation among malls in order to lure more retailers and consumers. Mall management<br />
basically takes care of issues such as positioning, zoning, tenant-mix, promotions/ marketing, facility &<br />
finance management (infrastructure, footfalls and ambience) etc.<br />
Mall management in India is expected to gain significance now. With a growing demand-supply mismatch<br />
in retail real-estate in most cities, there would be greater need for mall developers to plan and run their<br />
malls more professionally.<br />
Lack of mall management along with inappropriate tenant-mix would lead to poor mall traffic and closure<br />
of individual stores in malls. Professional third-party mall management service providers are hence likely<br />
to come to the fore. These third-party players not only understand the business challenges, but also have<br />
the ability to help the retailers deal with them effectively. Professional operators help the developers in<br />
conducting rigorous feasibility studies or market research, defining mall positioning, tenant-mix, layout<br />
of components in the mall, managing all operational, financial and administrative aspects and providing<br />
leasing assistance. Thus, managing all the stages of mall development including mall planning, construction<br />
and even post-development mall activities, an aspect that is considered very crucial for continued mall<br />
viability.<br />
In developed markets, mall management is an established and independent service line with more focus<br />
on professional mall management. With increasing competition, customer and retailer’s needs would<br />
become even more important. All this will require continuous effort and professional approach. We feel that<br />
mall management companies are expected to fill this need-gap in the near future.<br />
Currently, India has few end-to-end mall management companies and we expect that initially, the mall<br />
management efforts will happen through a consortium of firms from various backgrounds such as<br />
management consulting, real-estate and marketing & advertising.<br />
| Volume 02<br />
Retail Real-estate Trends | 16
perspective<br />
a quar terly repor t <strong>by</strong><br />
Volume 02 / 2009<br />
17 | Retail Real-estate Trends<br />
| Volume 02<br />
Convergence of Leisure,<br />
Hospitality, Office and<br />
Retail Space<br />
07<br />
Consumer’s expectations in terms of product and services have undergone a sea change. Today, value<br />
for the consumers comprises quality, comfort, and convenience on one side and product price, effort and<br />
shopping hassle on the other. This has led to an actual “reduction” of distance that consumers are willing<br />
to travel from their homes for a non-work related activity.<br />
A number of malls are being developed as a part of a large residential development, driven <strong>by</strong> the concept<br />
of providing a total quality lifestyle with residential, retail, entertainment, office & hospitality space - all part<br />
of an integrated development center. Developers of hybrid center are essentially creating streetscape-type<br />
shopping experiences with the convenience of everything at the doorstep.<br />
Exhibit 6 Integrated Development Initiatives<br />
India International<br />
Phoenix Mills Ltd. – 8 to 10 market cities Dubai Mall in Dubai<br />
Nirmal Lifestyle Mall – 20 lifestyle cities varying from 4 Mn to 44 Mn sq.ft. <strong>by</strong> 2020 River Center Mall on the River Walk in Texas<br />
City Center in Kolkata Caesar's Palace in Las Vegas<br />
Ambience Mall in Gurgaon<br />
Internationally, retail led mixed usage model has been quite successfully adopted <strong>by</strong> most of the popular<br />
malls including the River Center Mall on the River Walk in downtown San Antonio, Texas, and the incredibly<br />
successful mall at Caesar’s Palace in Las Vegas and Dubai Mall.<br />
In India, developers are trying to replicate this model and have planned their future projects as integrated<br />
townships. Malls are now shedding their status as single-use development and have started to incorporate<br />
space for office, hotel, entertainment, civic and cultural activities. The above measures have helped in<br />
transforming shopping centers into “community” centers with events and experiences that the entire family<br />
can enjoy.<br />
The growing popularity of mixed-usage developments over time is expected to upkeep the trend in the<br />
future with a lot of developments slated to come up on the similar lines. However, developers need to<br />
ensure with proper planning that the individual components planned are as per the catchment area, city<br />
profiling and correct execution of the same.
Increasing Prominence of<br />
Community Markets<br />
perspective<br />
a quar terly repor t <strong>by</strong><br />
Today’s consumer needs a place where he can relax and meet friends apart from a just a shopping<br />
environment. This need is met <strong>by</strong> a community center that creates an environment that forges links to their<br />
communities <strong>by</strong> opening wellness center, libraries, city halls and children’s play areas along with some<br />
services such as supermarket, pharmacy, bakery, sweet-shops, gift-shops, dry-cleaners etc. to cater to the<br />
near<strong>by</strong> residential areas apart from regular shoppers.<br />
Exhibit 7 Community Center Activities<br />
Karate/ dance classes on weekdays and painting competitions for children on weekends to attract wider footfalls.<br />
Organizing kitty parties/ card rooms for housewives on weekdays.<br />
Sponsorships or marketing events on a regular basis.<br />
Organizing fashion shows to draw more crowd.<br />
Quiz competitions or craft fairs.<br />
Shoppers look for places where they can interact comfortably and spend time with their friends and<br />
colleagues in an environment that is neither work nor home. The malls & community markets have a great<br />
opportunity to fill this gap. It brings in more customers, helps in keeping higher footfalls even on weekdays<br />
and it keeps them at the mall for longer periods of time.<br />
Exhibit 8<br />
International Examples Components<br />
Community Center - Examples<br />
Southdale Mall, USA A school, an auditorium, an ice-skating rink and even a zoo.<br />
Creating a sense of place and a feeling of community is a multi-dimensional task that requires a deeper<br />
understanding of human behavior, needs, and expectations. Shopping center developers need to respond<br />
to consumer interest in places that differentiate themselves, feel ‘authentic’ and provide not just a shopping<br />
experience but also one that reflects their lifestyles. They need to create a feeling wherein shoppers<br />
recognize that they can do a lot more than merely shopping.<br />
Volume 02 / 2009<br />
08<br />
Mall of America , USA An aquarium, a mini-golf course, an amusement park, a wedding chapel, an assembly hall, a school,<br />
a bank, and a medical clinic apart from regular components. Allows senior citizens to do ‘mall-walking’<br />
between 7:00 a.m. and 10:00 a.m. before the mall opens.<br />
Bluewater, London Facilities like Crèche, telephones, guest lockers, post boxes & postal services, concierge desks, car<br />
cleaning, pick up and loading services, parent/child rooms, ba<strong>by</strong> care rooms, bottle warming & mother’s<br />
feeding area.<br />
| Volume 02<br />
Retail Real-estate Trends | 18
perspective<br />
a quar terly repor t <strong>by</strong><br />
Volume 02 / 2009<br />
19 | Retail Real-estate Trends<br />
| Volume 02<br />
Need for Greater<br />
Transparency in<br />
Occupancy Charges<br />
09<br />
In addition to the high occupancy cost, retailers are also facing issues related to high loading (super to<br />
carpet area ratio) and high Common Area Maintenance (CAM) charges. The key concerns of most of the<br />
retailers include lack of standardization of CAM and loading charges leading to wide variation across malls<br />
even in same cities. Retailers feel there is a lack of clarity and transparency on establishing CAM and<br />
loading charges and on what constitutes the same.<br />
In some of the cases, retailer CAM charges as high as 30%-40% of the rental charges thus impacting overall<br />
store financials. Mall developers often have the tendency to make CAM charges as a profit centre however,<br />
in order to create a win-win situation it is very important for mall developers to understand that CAM<br />
should be cost-neutral. Mall developers can levy a small service charge for managing the maintenance<br />
and upkeep of mall<br />
Transparency in CAM charges would go a long way in establishing better trust amongst the retailers and<br />
mall developers. Internationally, a number of mall developers have shifted to fixed CAM charges which<br />
are negotiated with the retailer. The developers are also providing complete transparency on the charges<br />
incurred as a part of CAM through independent audits from retailers.<br />
Loading is another contentious issue between mall developers and retailers. As in case of CAM, loading<br />
also varies from 40%-50% across various malls. It is not only the high amount of loading but also what<br />
constitutes additional area, is also not very clear to retailers. It is very important for mall developers to<br />
create a standardized definition for loading. Retailers and mall developers should collaborate and arrive at<br />
a consensus on the constituents of loading factor in a mall.<br />
A greater transparency in CAM and loading would help create a sustainable long-term relationship between<br />
the mall developers and the retailers.
Emerging Opportunities<br />
in Retail Real-estate<br />
perspective<br />
a quar terly repor t <strong>by</strong><br />
Volume 02 / 2009<br />
10<br />
Various opportunities are emerging in retail real-estate sector which could be tapped for fuelling the growth<br />
in this sector. Certain concepts that have been tried and tested in international markets and are doing<br />
wonderful business, can be introduced in India to create elements of differentiation for a mall.<br />
Some of key emerging opportunities include:<br />
| Volume 02<br />
Outlet Center<br />
An outlet center offers discounted merchandise for Exhibit 10<br />
slow-moving items and non-seasonal merchandise<br />
International Outlet Centers<br />
for various categories. Dominating categories Outlet Center Country Mall Size (Mn sq.ft.)<br />
include apparel & footwear, consumer durables,<br />
furniture, furnishings and electronics. It basically<br />
appeals to brand-conscious and bargain-oriented<br />
customer who also wants to be a fashion leader.<br />
Chelsea Premium Outlets<br />
Atrium Furniture Mall<br />
Sungei Wang Plaza<br />
US<br />
US<br />
Kuala Lumpur<br />
0.2<br />
0.3<br />
1.2<br />
Outlet centers have progressed quickly from nofrills<br />
warehouses to well designated buildings with<br />
Bicester Village UK -<br />
landscaping, gardens and food courts and are competing with other mall formats internationally. This<br />
sort of a concept, leveraging first-mover advantage, does not exist in India. Customers typically tend to<br />
spend more time in such center as compared to other malls. This is mainly due to the availability of deep<br />
assortment of brands at economical prices. There can also be a scope and need for introducing better<br />
elements of entertainment and a food court to ensure a wholesome shopping experience.<br />
Lifestyle Center<br />
A lifestyle center is essentially a premium<br />
shopping destination designed for the entire<br />
family. It combines the traditional retail functions<br />
of a shopping mall with leisure amenities for upscale<br />
consumers. Typically, a lifestyle center has<br />
an open-air and up-scale design. The elements<br />
of architecture and landscaping are carefully<br />
combined to attract wider footfalls converting<br />
shopping from a chore to a fun activity for shoppers.<br />
It combines the carefully selected tenant-mix to<br />
ensure long-term sustainability and unique food<br />
and entertainment options.<br />
Exhibit 11<br />
International Lifestyle Centers<br />
Lifestyle Center Country Size of Mall (Mn sq.ft.)<br />
Deira City Center Dubai 1.2<br />
Ngee Ann City Singapore 2.0<br />
Suria KLCC Kuala Lumpur 1.4<br />
Times Square Kuala Lumpur 3.5<br />
Pacific Place Hong Kong 0.7<br />
Lifestyle centers have emerged as the most successful way to differentiate and create space in the already<br />
established retail malls in the US. There is a scope to introduce this unique concept in India to provide an<br />
all-in-one shopping and entertainment experience to shoppers.<br />
Retail Real-estate Trends | 20
perspective<br />
a quar terly repor t <strong>by</strong><br />
Volume 02 / 2009<br />
21 | Retail Real-estate Trends<br />
| Volume 02<br />
Conclusion<br />
Indian retail and retail real-estate industries are currently going through a difficult phase due to sluggish<br />
demand from the consumers. Since these industries are in their nascent stage currently, the formats and<br />
business practices are still evolving and the standards are yet to evolve. With greater learning, increasing<br />
consolidation and entry of international players, we expect that the Indian retail real-estate space would be<br />
benchmarked against the very best in the world.<br />
The outlook for Indian retail looks quite promising in the near future and the current turmoil should be<br />
over in 2 to 3 quarters. Mall developers would be required to undertake greater planning and restructuring<br />
at the right time and differentiate their projects from others in the market to keep pace with the market<br />
demand expected from the retail & other segments. Future strategies for mall developers would entail<br />
the development of market-specific solutions for different demographics, psychographics, regions and<br />
locations. Extensive market research and professional services for each aspect of mall operation is likely<br />
to gain more importance to ensure project sustainability.<br />
Exhibit 12<br />
Liquidity Crunch<br />
Organised Retail’s<br />
Lower than<br />
Anticipated Growth<br />
Uneven Distribution<br />
of Mall Space<br />
Slowdown in<br />
Consumer Spending<br />
High Opr. Costs largely<br />
due to High Rentals<br />
Poor Mall Management<br />
Commoditisation of<br />
Mall Space<br />
Changing Dynamics of Retail Real-Estate Business<br />
Shortfall in Supply<br />
of Mall Space<br />
Retailers’ Vacancy<br />
Retailers’ Lowering<br />
Profitability<br />
Unsatisfactory<br />
Performance of Mall Space<br />
Correction in Rentals<br />
Growing Trend towards<br />
Revenue Sharing<br />
Careful Planning,<br />
Positioning &<br />
Management of Mall<br />
Space - Yet to Happen!<br />
The market is witnessing consolidation on both sides - developers and retailers. The market would witness<br />
some developments of international scale and quality. The retail center of the future- whether it is enclosed<br />
or open-air, big or small, themed or general-would also be designed to resemble a community, not just a<br />
place to shop and entertainment would emerge as a vital component in the development of new malls.<br />
The present crisis may be taken up in a positive spirit - a learning experience for the sector to grow stronger,<br />
more disciplined and organized at the end of the day. The real-estate industry needs to gear up well to<br />
respond to the changing demands and growing competition.<br />
In India, there is still a significant gap between the demand and supply of quality real-estate space.<br />
Therefore, projects with good mall management practices in place will command a premium in the future.<br />
There is no shortage of customers if the developer has the right product-mix, location and track record.<br />
Authors<br />
Anil Rajpal, Vice President I anil.rajpal@technopak.com<br />
Rohit Bhatiani, Principal Consultant I rohit.bhatiani@technopak.com<br />
Preeti Gupta, Consultant I preeti.gupta@technopak.com
GST :<br />
Impact on<br />
the Supply<br />
Chain<br />
Introduction to GST 23<br />
Impact of GST 24<br />
Detailed Impact of Removed<br />
Tax Barriers on Cross-border<br />
Sales 25<br />
Network Re-engineering<br />
for GST 26<br />
Our Approach 28
perspective<br />
a quar terly repor t <strong>by</strong><br />
Volume 02 / 2009<br />
23 | GST : Impact on the Supply Chain<br />
| Volume 02<br />
Introduction to GST<br />
GST is the biggest indirect tax reform undertaken in India since independence. Indirect taxes in India can<br />
be classified into 3 categories based on the entities that collect it - Central Taxes, State Taxes & Local Taxes.<br />
Some of the examples include:<br />
•Central<br />
Indirect Taxes: Customs Duty, Central Excise Duty, Central Service Tax etc.<br />
•State<br />
Indirect Taxes : Sales Tax (Sales VAT), State Entry Tax, Central Sales Tax, etc.<br />
•Local<br />
Indirect Taxes : Octroi, Entertainment Tax etc.<br />
It is important to note that while Central State Tax (CST) falls under the purview of the central government, the<br />
tax goes into the kitty of the state government where the sale originates. In the pre-reforms era of taxation,<br />
indirect taxes were largely charged at different stages of the goods and services value chain with no regard<br />
to taxes paid earlier or later in the chain. Thus, the taxes were cascading in nature resulting in several<br />
disadvantages which were addressed <strong>by</strong> the introduction of a Value Added Taxation (VAT) system.<br />
Thus, the fundamental indirect tax reform that we have seen in the past 23 years is the shift to VAT. It means<br />
that the tax is levied at each stage only on the value added in that stage. In other words,<br />
Value Added = Market Price of Outputs – Market Price of Inputs<br />
Therefore, VAT = % Tax Rate * Value Added<br />
Exhibit 1 Key Reforms in Indirect Taxation through VAT<br />
Disadvantages of Pre-reforms System VAT Reforms<br />
Different tax rates for different products within a category and at<br />
different stages of the supply chain created complexity in manufacturing<br />
and trading decisions.<br />
Due to the high rates charged in a cascading manner, evasion of taxes<br />
was encouraged. There was a lack of a tax chain where the subsequent<br />
stages in the supply chain were not inter-linked from a tax perspective.<br />
This meant that creation of an audit trail and policing of tax compliance<br />
was difficult.<br />
Overall taxes in the entire system were high due to extensive evasion<br />
and a relatively smaller tax net.<br />
As tracking the tax paid in the supply chain is not easy, it was difficult<br />
to extend tax benefits or fully extend tax benefits based on end use. The<br />
Government might want to give end-use tax breaks such as on exports,<br />
disaster relief supplies etc.<br />
Discouraged anciliarisation as there is no tax if inputs are manufactured<br />
within the company. Anything bought from outside was taxed with a<br />
cascading effect.<br />
CST became the additional tax burden that companies had to bear on<br />
inter-state sales besides the sales tax paid on intra-state sales. As a<br />
result, organisations either incurred the tax incidence or used stocktransfer<br />
to avoid cross-border sales and tax. This often meant having<br />
stocking points in destination states and hence, networks designed on<br />
tax considerations rather than supply chain considerations.<br />
Aim at applying as few rates as possible across products and across<br />
the supply chain of a product making supply chain decisions simpler.<br />
The self policing mechanism of VAT ensures higher compliance as VAT<br />
is inter-linked throughout the supply chain or sections of the supply<br />
chain. In such a scenario it is difficult to evade taxes as that would<br />
require collusion from multiple parties.<br />
VAT has resulted in higher compliance and a wider tax net. Hence, the<br />
tax authorities are amenable to lower rates.<br />
Due to the series of input credits in the supply chain, VAT is<br />
implemented as consumption based tax. This means that the ultimate<br />
burden is borne <strong>by</strong> & at the point of final consumption. Thus, it is easier<br />
to provide end-use benefits.<br />
As tax is only on value addition, the impact is the same whether value is<br />
added within or outside the organisation<br />
CST is being removed to allow organisations to design networks, purely<br />
on supply chain considerations.<br />
We could regard the evolution of GST as a gradual transformation of a disbursed, complex and cascading<br />
structure into a largely unified value added system of taxation. Exhibit 2 depicts this in more detail.<br />
The country was first introduced to the VAT system through the introduction of MODVAT in lieu of central<br />
excise duties in 1986. MODVAT was further reformed into the CENVAT regime in 2000. VAT in lieu of Sales<br />
Tax, was introduced in 2005 and CST was reduced from 4% to 2% during 2007-08. Finally, GST is slated to<br />
be introduced in 2010 which will encompass Sales VAT, CENVAT and possibly subsume some of the local<br />
taxes such as Octroi.
Exhibit 2<br />
GST Introduction GST<br />
2nd Level Reforms<br />
Introductory Reforms<br />
Evolution of Key Indirect Tax Reforms<br />
perspective<br />
a quar terly repor t <strong>by</strong><br />
CST Reduction CENVAT<br />
Sales VAT MODVAT<br />
Impact of GST on the Supply Chain<br />
We have all seen and are aware of the impact that VAT has had on the supply chain so far. There are 4 key<br />
characteristics of the GST regime that will impact the supply chain further:-<br />
•It<br />
is expected that we will have a dual GST structure - State GST and Central GST. Central GST chain may<br />
extend right upto the last transaction at the retail level.<br />
» State GST would comprise of VAT/Sales tax, State cesses and surcharges on goods and services,<br />
Octroi, Entry tax, taxes on lotteries, betting, gambling and purchase tax as the main components.<br />
» Central GST would incorporate Central excise duties, additional customs duty (Countervailing Duty -<br />
CVD), surcharges, allied levies and service tax as the key taxes.<br />
•Octroi<br />
and Entry tax are expected to be disbanded but the likelihood of the contrary cannot be ruled<br />
out.<br />
•Inventory<br />
during transition will be impacted as post GST, inventory will carry Central GST and new GST<br />
rates credit.<br />
•The<br />
tax disincentive of cross-border sales and supplies which is currently there because of CST will<br />
hopefully go.<br />
Exhibit 3<br />
Impact of GST on the Supply Chain<br />
GST Characteristic Impact on Supply Chain<br />
• At present, service tax on logistics services consumed during distribution and<br />
retail are not off-settable against CENVAT<br />
Implication<br />
Extended Central GST<br />
Chain<br />
• Extended Central GST chain will allow the offset in post manufacturing<br />
networks<br />
• This will lower the cost of logistics outsourcing as the 10.3% service tax<br />
charged <strong>by</strong> logistics companies can be largely offset against the Central GST<br />
liability<br />
• Post GST, inventory will also carry Central GST & inter-state GST input credit,<br />
This will boost outsourcing in supply chains<br />
and provide greater impetus to 3PL’s<br />
Affected Inventory<br />
the tax rates may also get changed for many products<br />
• Unless the GST rates go up for its products, the firms would be encouraged<br />
to minimise pre-GST inventory which has less input credits<br />
• As the GST implementation date approaches closer, one could expect<br />
uncertainty and panic regarding pre-GST inventory as was seen during VAT<br />
introduction<br />
• Octroi and entry tax are not in line with the spirit of GST although in some<br />
Organisations need to study GST’s final<br />
mechanisms and plan inventory transition<br />
very carefully for themselves, suppliers and<br />
customers<br />
Subsuming Octroi &<br />
Entry Tax<br />
cases entry taxes are VATable<br />
• Once these taxes are paid reverse flow of goods becomes difficult , hence<br />
companies prefer postponed and uni-directional flow of goods across entry<br />
tax and Octroi borders<br />
• There are two possible scenarios through which tax barriers would be<br />
Organisations will be encouraged to locate<br />
warehouses and hubs in entry tax and Octroi<br />
zones and stock more inventory there<br />
Organisations will be removed:<br />
encouraged to locate<br />
warehouses and hubs<br />
in entry tax and Octroi<br />
zones and stock more<br />
» Scenario 1: CST rates would reduce to zero with no carry-over of input<br />
credit across states<br />
» Scenario 2: Stock-transfers are disallowed/taxed and inter-state sales are<br />
taxed with carry-over allowed<br />
Organisations can and should design<br />
their networks purely on supply chain<br />
considerations and not tax considerations<br />
inventory there • In both cases, companies would no longer be required to have a warehouse<br />
in every state just to facilitate stock transfers and avoid CST<br />
Volume 02 / 2009<br />
| Volume 02<br />
GST : Impact on the Supply Chain |<br />
24
perspective<br />
a quar terly repor t <strong>by</strong><br />
Volume 02 / 2009<br />
25 | GST : Impact on the Supply Chain<br />
| Volume 02<br />
While the implication of the first three characteristics is straightforward, the impact of removed tax barriers<br />
on network design needs to be understood in much greater detail.<br />
Detailed Impact of Removed<br />
Tax Barriers on Cross-border Sales<br />
Previously we mentioned that whether CST is reduced to zero or cross-border sales are taxed with offset<br />
allowed, the implication remains the same. Exhibit 4 shows an illustrative example that proves this point.<br />
For the sake of simplicity, we are ignoring logistics costs in the landed-cost component and also ignoring<br />
any input credit available at the ‘source’ location.<br />
Exhibit 4<br />
Table1: Current - Stock Trasfer Sale<br />
Stock<br />
Transfer Sale<br />
Landed<br />
Cost<br />
Margin<br />
Input VAT<br />
Credit<br />
Commercial Impact of GST<br />
Price<br />
Before Tax<br />
VAT CST Tax Net Tax Final Price<br />
Source 100.0 24.2 - 124.2 0% 0% - - 12.4<br />
Depot 124.2 - - 124.2 12% 4% 5.0 5.0 129.2<br />
Distributor 129.2 6.5 5.0 130.6 12% 4% 5.2 0.3 135.9<br />
Retail 135.9 13.6 5.2 144.2 12% 4% 5.8 0.5<br />
5.8<br />
150.0<br />
Table2: Current - 2% CST Sale<br />
Stock<br />
Transfer Sale<br />
Landed<br />
Cost<br />
Margin<br />
Input VAT<br />
Credit<br />
Price<br />
Before Tax<br />
VAT CST Tax Net Tax Final Price<br />
Source 100.0 21.8 - 121.8 0% 2% 2.4 2.4 12.4<br />
Depot - - - - - - - - -<br />
Distributor 124.2 - - 124.2 4% 0% 5.0 5.0 129.2<br />
Retail 12.9.2 6.5 5.0 130.6 4% 0% 5.2 0.3<br />
7.7<br />
135.9<br />
Table3: GST-Zero CST Sale<br />
Stock<br />
Transfer Sale<br />
Landed<br />
Cost<br />
Margin<br />
Input VAT<br />
Credit<br />
Price<br />
Before Tax<br />
VAT CST Tax Net Tax Final Price<br />
Source 100.0 24.2 - 124.2 0% 0% - - 124.2<br />
Depot - - - - - - - - -<br />
Distributor 124.2 6.5 - 130.6 4% 0% 5.2 5.2 135.9<br />
Retail 135.9 13.6 5.2 144.2 4% 0% 5.8 0.5<br />
5.8<br />
150.0<br />
Table4: GST - Inter State Sale Taxed with Offset Allowed<br />
Stock<br />
Transfer Sale<br />
Landed<br />
Cost<br />
Margin<br />
Input VAT<br />
Credit<br />
Price<br />
Before Tax<br />
(All figures except VAT and CST are in US$/unit)<br />
VAT CST Tax Net Tax Final Price<br />
Source 100.0 24.2 - 124.2 4% - - 5.0 129.2<br />
Depot - - - - - - - - -<br />
Distributor 129.2 6.5 5.0 130.6 4% - 5.2 0.3 135.9<br />
Retail 135.9 13.6 5.2 144.2 4% - 5.8 0.5<br />
5.8<br />
150.0<br />
Source: <strong>Technopak</strong> analysis
perspective<br />
a quar terly repor t <strong>by</strong><br />
Volume 02 / 2009<br />
| Volume 02<br />
• Table 1: Suppose a firm currently does a stock transfer from State A to State B, before selling in State<br />
B to avoid paying CST. It thus gets a margin of US$ 0.50 per unit and incurs local VAT only when it sells<br />
in State B to its distributor through its depot. The distributor charges a margin of US$ 0.14 per unit and<br />
charges the final price <strong>by</strong> adjusting the input credit (which is available since the sale from depot was<br />
intra-state). In this case,<br />
Price to Retailer = (Distributor Landed Cost + Distributor Margin – Distributor Input Credit) * (1 + VAT<br />
Rate).<br />
Similarly the MRP comes out to US$ 3.13/unit after accounting for input credit at retail level as well as<br />
retailers’ US$ 0.28 /unit margin.<br />
• Table 2: In today’s 2% CST scenario, the firm incurs US$ 0.08/unit loss in margin if it were to do a crossborder<br />
sale to the distributor, without going through a stock transfer at the depot. The calculations are<br />
based on the premise that the US$/unit retailer margin, distributor margin and MRP are maintained at the<br />
same level.<br />
•Table 3: If CST rates were to become zero then the firm can do cross-border sale (at 0% rate) directly to<br />
the distributor without any loss of margin to itself, the distributor or the retailer and yet charge the same<br />
MRP to the consumer.<br />
•Table 4: If CST is abolished and inter-state sales or stock transfers are taxed with input credit allowed at<br />
the destination, then also the margins and MRP remain intact for everyone.<br />
Thus, we see that when tax barriers on cross-border<br />
sales are removed whether through the route shown<br />
in Table 3 or 4, it becomes unnecessary to have<br />
a depot in the destination state. The supply chain<br />
can then be designed not on tax considerations<br />
but purely on logistics cost and customer service<br />
considerations.<br />
Exhibit 5<br />
Approximate Number of Warehouses Needed<br />
in the GST Scenario<br />
Delivery Lead Time for 80% Urban<br />
Customers<br />
Annual Turnover (US$ Mn ) 24 Hrs 48 Hrs<br />
< 600 24 - 28 20 - 24<br />
600 - 1500 22 - 26 18 - 22<br />
Hence, a key feature of post GST supply chain<br />
networks would be fewer warehouses or distribution > 1500 20 - 24 16 - 20<br />
centres than before. This means simpler and leaner<br />
Source: <strong>Technopak</strong> analysis<br />
networks which could incur lower costs of operation as explained below. Exhibit 5 provides an approximate<br />
guide on the number of warehouses for a distribution company dealing in fast moving goods can have in<br />
a GST scenario. The specific business realities of the company will also have a great bearing on the actual<br />
number of warehouses required.<br />
Network Re-engineering for GST<br />
We have already established that an optimum network design post GST would be different from an optimum<br />
network design in today’s taxation scenario. The re-organised network will in fact be significantly different.<br />
•The<br />
move towards fewer warehouses would require many warehouses to combine, close and re-locate.<br />
•Required<br />
capacity of many warehouses will undergo changes. With fewer warehouses, the average size<br />
of the warehouse will go up.<br />
•Hubs<br />
are not directly impacted <strong>by</strong> CST considerations. However, fewer & larger warehouses may make<br />
it feasible to route plant production directly to warehouses rather than through hubs, due to larger<br />
throughputs. Thus, the size and number of hubs could get affected.<br />
•The<br />
linkages between factories-hubs-warehouses-customers for various products will get re-aligned.<br />
GST : Impact on the Supply Chain |<br />
26
perspective<br />
a quar terly repor t <strong>by</strong><br />
Volume 02 / 2009<br />
27 | GST : Impact on the Supply Chain<br />
| Volume 02<br />
Exhibit 6 lists all the pros and cons of doing a network<br />
re-engineering exercise for GST. Clearly, the benefits<br />
outweigh the disadvantages. Besides providing a simpler<br />
and more manageable network, <strong>Technopak</strong> estimates<br />
between 5% to 10% net savings in logistics + inventory<br />
carrying costs of an organisation through this exercise.<br />
Fewer warehouses would mean a straight saving on<br />
warehousing costs. The inverse root law states that:-<br />
Safety Inventory a 1/sqrt (Number of Stocking<br />
Points)<br />
Exhibit 6<br />
Pros & Cons of Network Re-engineering for GST<br />
Pros Cons<br />
Reduced fixed<br />
warehousing costs<br />
Reduced inventory<br />
(inverse square<br />
root law)<br />
Simplified planning<br />
and reduced<br />
warehouse and<br />
C&FA management<br />
Higher lead times<br />
to customers<br />
Possibly higher<br />
freight cost<br />
especially<br />
secondary freight<br />
This means that the safety stock requirement would<br />
also go down. Prima-facie, it would appear that some<br />
of these savings would be offset <strong>by</strong> the increased<br />
cost of freight. With fewer intermediate stocking points<br />
(warehouses) between sources and customers, the average freight legs should get longer. However, this<br />
might not necessarily always be true as the network linkages of source-warehouse-customer could actually<br />
get shorter <strong>by</strong> removal of inter-state sale barriers. Exhibit 7 explains this in greater detail.<br />
In Case I, the source is in State A (left) and the customer is in State B (right). Due to CST barriers, the<br />
customer can only be served from a warehouse in State B but <strong>by</strong> back-tracking in the direction of the<br />
source. In Case 2, after the introduction of GST, the network linkage is re-defined and the back-tracking is<br />
saved substantially <strong>by</strong> serving the customer directly from the factory, or a warehouse “on the way” in State<br />
A itself. The freight distance saving translates directly into freight cost saving.<br />
Exhibit 7<br />
Case 1: CST at 2%<br />
Plant<br />
Case 2: GST<br />
Plant<br />
500 kms<br />
1000 kms<br />
Freight Savings Due to GST<br />
1000 kms<br />
State Boader<br />
State Boader<br />
200 kms<br />
Customer 1<br />
Illustrative freight distance (and hence cost) saving of 400 kms for customers1<br />
New Warehouse<br />
Old Warehouse<br />
Customer 2<br />
Old Warehouse<br />
Customer 1 Customer 1
Impact on Warehousing<br />
perspective<br />
a quar terly repor t <strong>by</strong><br />
Volume 02 / 2009<br />
| Volume 02<br />
New or enlarged warehouses will have to be designed/re-designed. <strong>Technopak</strong> estimates that for most<br />
organisations, 6-8 locations will have mega warehouses with complex operations in the near future. Thus,<br />
modernisation of key warehouses is strongly recommended on account of:<br />
•Large<br />
sizes, high throughputs and more complex operations<br />
•Increasing<br />
level and variety of service required <strong>by</strong> customers, especially organised retailers<br />
•Increasing<br />
scarcity of skilled labour and real estate requiring vertical and mechanised warehouses<br />
Impact on Service Level<br />
The key fallout of GST aligned networks is fewer warehouses but this also has two implications on customer<br />
service:<br />
•Longer Lead-times to Customers: This would not be an issue as long as the network redesign exercise<br />
puts a minimum lead time/distance constraint while serving customers in the new network.<br />
• Improved Assortment: Often SKUs needed <strong>by</strong> customers are not available at the warehouse meant<br />
to serve them although they may be idling at another warehouse. This is especially true for slow moving<br />
items. With stock aggregated at fewer warehouses, the planning and assortment availability improves for<br />
slow moving SKUs.<br />
Thus, service to customers could be maintained or even improved in a network re-engineering exercise.<br />
The key here is to undertake a professional scientific exercise as opposed to manual experience based<br />
methods that many firms have used for designing their legacy networks.<br />
Our Approach<br />
A scientific tool-based redesigning of the distribution network would be helpful in delivering optimal logistics<br />
and inventory carrying costs without compromising on service levels to customers. Exhibit 8 illustrates this<br />
scientific tool-based approach in greater detail.<br />
Exhibit 8<br />
Inputs<br />
Model Design<br />
& Creation<br />
Output<br />
Network Re-engineering Approach<br />
• Collate demand pattern and existing supply chain costs of manufacturing, freight, handling, fixed warehousing, variable<br />
warehousing and taxes (VAT / CST / Excise)<br />
• Understand existing service levels and logistics constraints<br />
• List the external business environment factors affecting network design and performance<br />
• Identify candidate locations for warehouses & hubs based on <strong>Technopak</strong>’s understanding of the Indian logistics sector<br />
• Design a Mixed Integer Linear Program (MILP) model based on a firm’s internal and external business environment<br />
translating into appropriate variables, constraints & assumptions<br />
• Pre-processing of input data to improve model performance and ensure accuracy of results<br />
• Scenario building & sensitivity analysis<br />
• Number, size & location of hubs & warehouses<br />
• Network linkages between various supply chain entities<br />
• Optimal transport modes and mix<br />
GST : Impact on the Supply Chain |<br />
28
perspective<br />
a quar terly repor t <strong>by</strong><br />
Volume 02 / 2009<br />
29 | GST : Impact on the Supply Chain<br />
| Volume 02<br />
Exhibit 9 depicts our methodology that helps organisations meet the GST deadline in the most optimal state.<br />
We deliver an end-to-end solution which includes the first four design stages as well as implementation<br />
hand-holding.<br />
Exhibit 9<br />
Impact Analysis<br />
•Audit of current setup<br />
•Future scenario impact<br />
2 Weeks 4 Weeks 6 Weeks<br />
2 Weeks 6 Months - 1 Year<br />
Distribution Setup Design<br />
•Network modelling based on MILP Programming<br />
•Minimise cost subject to service level & other constraints<br />
Benefits Beyond Zero GST<br />
Our Methodology for GST Solutions<br />
Model Warehouse Engineering<br />
• Design & layout<br />
• Modernisation<br />
Change Management Planning<br />
•CST transition planning<br />
•Vendors<br />
•Employees, systems & processes<br />
A network re-engineering exercise with us has many more benefits than just the ones arising from the GST<br />
opportunity. Some of the other benefits are:<br />
•Robust<br />
design to support growth over next 3-5 years<br />
•Optimal<br />
realisation of back-haulage and direct despatch opportunities<br />
•Savings<br />
from optimisation of legacy network<br />
•Transport<br />
mode optimisation in the re-designed networks<br />
•Evaluation<br />
and factoring of opportunities arising from GST and entry tax rationalisations<br />
•Improved<br />
service levels to all or key customers<br />
•Optimal<br />
network flow paths for goods, hub-spoke connections and feeder depot concepts<br />
Authors<br />
Anil Rajpal, Vice President I anil.rajpal@technopak.com<br />
Sachin Jagtap, Principal Consultant I sachin.jagtap@technopak.com<br />
Implementation<br />
• New network rollout<br />
• Change management
FDI :<br />
A Catalyst<br />
for Growth<br />
of the<br />
Textile &<br />
Apparel<br />
Industry<br />
Background 31<br />
Indian Textile and Apparel<br />
Industry-Current Size 31<br />
Growth Prospects 32<br />
Importance of FDI 33<br />
FDI in India: Current Scenario 34<br />
An Attractive Destination for<br />
Investment 35<br />
Key Imperatives for Future 37
perspective<br />
a quar terly repor t <strong>by</strong><br />
Volume 02 / 2009<br />
| Volume 02<br />
Background<br />
The Indian textile and apparel industry is one of the oldest and most significant industries in the country<br />
and one of the largest in the world. Apart from China, no other country can match the size, spread, depth,<br />
and competitiveness of the Indian textile and apparel industry. Moreover, the global elimination of quotas<br />
at the end of 2004 has greatly enhanced the opportunities for India to showcase its inherent strength and<br />
become a top sourcing and investment destination.<br />
Today the industry contributes around 14% to industrial production in the country, 4% to the GDP, is estimated<br />
to directly employ approximately 35 Mn people apart from the indirect employment in allied sectors, thus<br />
making it the second largest employer after agriculture. It accounts for about 15% to the country’s exports,<br />
and is, in sum, an important economic engine for the nation.<br />
In part, the very diversity, scale and spread of the industry which has been its strength, has also been its<br />
weakness. However, in the past 10 years, the industry’s actions, government policies as well as market<br />
events have begun to converge, providing several growth opportunities for the sector domestically as well<br />
as in the global market.<br />
Indian Textile and Apparel Industry:<br />
Current Size<br />
The present size of Indian textile and apparel market is US$ 62 Bn of which US$ 22 Bn is exports while the<br />
rest US$ 40 Bn is the domestic market.<br />
Exhibit 1<br />
Textiles<br />
US$ 10 Bn<br />
Domestic Market<br />
US$ 40 Bn<br />
The Indian domestic textiles and apparel market is one of the fastest growing market in the world. It is<br />
expected to become one of the major consumption bases in near future. Out of the total market size of<br />
US$ 40 Bn, clothing contributes US$ 30 Bn, while the remaining US$10 Bn is contributed <strong>by</strong> textiles (home<br />
textiles, technical textiles and other textiles end-uses).<br />
The domestic market has shown a significant growth in past few years registering a CAGR of ~18%.<br />
Though men’s wear is the largest category with a value of US$ 10.3 Bn, kid’s wear and women’s wear are<br />
the fastest growing categories.<br />
The textile industry plays a significant role in getting the foreign exchange reserves into the country as it<br />
contributes to approximately 15% of the total exports from the country. Exports in textiles and apparel have<br />
registered a strong growth in last few years – 11% CAGR from 2004-05 to 2007-08.<br />
31 | FDI : A Catalyst for Growth of the Textile & Apparel Industry<br />
Current Size : Indian Textile and Apparel Market<br />
Clothing<br />
US$ 30 Bn<br />
Indian Textile and Apparel Market<br />
US$ 62 Bn<br />
Textiles<br />
US$ 12 Bn<br />
Exports<br />
US$ 22 Bn<br />
Clothing<br />
US$ 10 Bn
perspective<br />
a quar terly repor t <strong>by</strong><br />
The single largest category is woven apparel followed <strong>by</strong> knitted apparel, made-ups and cotton based<br />
textiles.<br />
Growth Prospects<br />
India’s current domestic consumption of US$<br />
40 Bn is expected to grow to ~US$ 200 Bn over<br />
the next 25 years (growing at over 7% per year).<br />
India’s exports are expected to grow to ~US$ 125<br />
Bn from the current level of US$ 22 Bn <strong>by</strong> 2035.<br />
Volume 02 / 2009<br />
Exhibit 2<br />
Investment in Textile and Apparel Manufacturing<br />
Sector Investment Required (US$ Mn)<br />
1. Spinning 55,000<br />
2. Weaving 25,000<br />
3. Knitting 10,000<br />
| Volume 02<br />
However, the visible bottleneck to the above 4. Fabric Processing 40,000<br />
growth is the shortfall in the supply to meet 5. Home textiles 4,200<br />
the aforementioned demand. The current<br />
manufacturing capacities cannot meet the unprecedented growth in the demand and therefore, we<br />
would need mega investments to the tune of US$ 130 - 135 Bn over next 25 years in textile and apparel<br />
manufacturing.<br />
If the required demand is not met <strong>by</strong> indigenous manufacturing then it would be met <strong>by</strong> imports from Asian<br />
countries like China, Bangladesh, Vietnam, Korea etc.; Eastern European countries like Romania, Bulgaria,<br />
Tunisia etc.; and African countries like Kenya, Nigeria, Egypt etc.<br />
One of the biggest questions to be answered here is - who will invest? We firmly believe that FDI can act as<br />
a catalyst to trigger this investment. One of the most commonly known benefits of FDI is the “Crowding-in”<br />
effect. With entry of foreign firms in the sector, the confidence level of investing in the sector increases and<br />
it has been usually seen that more and more domestic manufacturers follow suite.<br />
Considering the above logic, we believe that approximately 75% to 80% of the investment would still be<br />
done <strong>by</strong> the domestic business houses, but the balance 20% to 25% investment required as FDI will give<br />
the required confidence to invest in the sector.<br />
A prime example of the same would be what US auto sector underwent in the 1980s.<br />
•Companies<br />
invest in the US because it is single largest economy in the world and its labor pool is one<br />
of the best educated, most productive and innovative, and it provides world class infrastructure.<br />
•The<br />
US auto sector in the 1980s had several features that made it an attractive setting for FDI. Both<br />
the end-product automobile sector, where there were only ‘The Big Three’ US assemblers (General<br />
Motors, Ford, and Chrysler), and the large number of firms in the auto component supply sector<br />
provided such an opportunity.<br />
•There<br />
was substantial inward FDI that originated predominantly from a single country, Japan. This<br />
investment likely increased the competition that then led to productivity changes. In addition, the<br />
Japanese entrants possessed superior production techniques and management practices, which<br />
created the potential for technology transfer.<br />
•They<br />
began to produce vehicles in North America and began to purchase inputs from US autocomponent<br />
manufacturers.<br />
•The<br />
results suggest that increased competitive pressure in the auto sector was the main cause of<br />
overall productivity improvement, at least during the initial stages of foreign direct investment of<br />
the 1980s.<br />
FDI : A Catalyst for Growth of the Textile & Apparel Industry |<br />
32
perspective<br />
a quar terly repor t <strong>by</strong><br />
Volume 02 / 2009<br />
| Volume 02<br />
Importance of FDI<br />
FDI is becoming one of the most discussed topics in the drive for economic globalization. On one hand,<br />
multi-national companies consider FDI as an important means to reorganize their production facilities<br />
globally while on the other it is regarded as an important vehicle for economic development particularly for<br />
developing economies.<br />
FDI plays a pivotal role in the development of an economy. The key advantages that FDI and foreign<br />
corporations bring with it are listed as under:<br />
•FDI<br />
provides capital which is usually missing in the target country<br />
•FDI<br />
brings new technologies that are usually not available in the target country<br />
•Foreign<br />
investors are able to finance their investments projects better and often cheaper<br />
•Foreign<br />
corporations create new workplaces<br />
•Foreign<br />
corporations bring new know-how and managerial skills into the target country<br />
•Foreign<br />
corporations provide better access to foreign markets<br />
•Foreign<br />
corporations can help to change the economic structure of the target country<br />
•“Crowding<br />
in” effect; The foreign corporations often bring additional investors into the target country<br />
(example, their usual subcontractors)<br />
•Foreign<br />
corporations improve the business environment of the target country<br />
•Foreign<br />
corporations bring new “clean” technologies that help to improve the environmental conditions<br />
•Foreign<br />
corporations usually help increase the level of wages in the target economy<br />
•Foreign<br />
corporations usually have a positive effects on the trade balance<br />
One of the biggest challenges in Indian textile and apparel industry is that 95% of the industry is unorganized<br />
– small fragmented units. The advent of FDI will bring in latest technology and marketing techniques that<br />
will add fuel to the organized growth of this sector. Investing companies will bring over the latest knowhow<br />
and manufacturing techniques, resulting in higher efficiencies and low cost of manufacturing. These<br />
advantages can be passed on to the consumer creating higher consumption; consumption at the right<br />
price will increase.<br />
Multinationals and transnational companies conduct extensive due diligence and risk analysis before<br />
investing in a country. At the same time, they are investing for the long term. This is a confidence booster<br />
for other companies – both international and domestic.<br />
FDI is favored for two main reasons – growth of the organization <strong>by</strong> tapping into new markets, and/or<br />
reducing costs <strong>by</strong> accessing low cost production countries. Leading examples of these two scenarios are<br />
China and Bangladesh.<br />
China Offers Both-Domestic Market and Low Cost Production<br />
•China<br />
has been the most favored FDI destination in recent years; cumulative FDI from 1991 to 2008<br />
amounts to ~US$ 840 Bn<br />
•In<br />
2007, China attracted ~US$ 92 Bn FDI; 2% of global FDI<br />
•More<br />
than 50% of FDI is in the manufacturing sector (including textile & apparel)<br />
•China<br />
has a complete ‘Open Door Policy’ and has developed state-of-the-art infrastructure<br />
33 | FDI : A Catalyst for Growth of the Textile & Apparel Industry
Bangladesh Offers Low Cost Production.<br />
•The<br />
cumulative FDI in Bangladesh from 1998 to 2008 amounts to UD$ 6.5 Bn<br />
•16%<br />
of FDI is in the textile sector, amounting to ~US$ 1 Bn<br />
•75%<br />
of the country’s export earnings come from textiles and apparel<br />
perspective<br />
a quar terly repor t <strong>by</strong><br />
•Readymade<br />
garment exports increased from US$ 643 Mn in 1990, to US$ 12 Bn in 2008<br />
•This<br />
has been possible due to the proactive role of the government and trade associations<br />
India’s case is similar to that of China. India is in a unique position to offer both a substantial and fast<br />
growing domestic market and a country rich of resources required for low cost production. In sum, investing<br />
companies have been motivated to enter into collaborations with host country firms due to increasing gains<br />
that can be made <strong>by</strong> producing brands in the host country and selling them into the host country market.<br />
Host country companies have been motivated <strong>by</strong> the scope for gaining technical and marketing expertise<br />
from foreign partners.<br />
FDI in India: Current Scenario<br />
Due to India’s recent liberalization of its foreign investment regulations, the country has become one of the<br />
fastest growing destinations for FDI inflows. India offers many advantages for foreign investors like strong<br />
economic growth leading to increased buying power <strong>by</strong> the middle class, low wages, and an educated<br />
work force. India’s Special Economic Zones (SEZs) attract foreign investment <strong>by</strong> providing tax incentives,<br />
assistance with bureaucratic and administrative problems, and access to reliable infrastructure.<br />
Indian economy is growing at the rate of in excess of 6% per annum since last 10 years. Even in times<br />
of recession / slowdown in most of the developed economies, India is expected to maintain this level of<br />
growth. From 1990 to 2007, India’s GDP has grown at an annualized rate of 8% which is second only to<br />
China among present trillion dollar economies.<br />
Exhibit 3<br />
US$ Mn<br />
30000<br />
25000<br />
20000<br />
15000<br />
10000<br />
5000<br />
0<br />
1991-1992<br />
(Aug-March)<br />
1992-1993<br />
1993-1994<br />
1994-1995<br />
1995-1996<br />
FDI Inflows in India (1991 to present)<br />
1996-1997<br />
1997-1998<br />
1998-1999<br />
1999-2000<br />
From August 1991 to March 2009, India has attracted a total FDI of US$ 106 Bn, of which approximately<br />
US$ 90 Bn was invested during Apr ’00 to Mar ’09.<br />
Extending its liberalization policies to other industries, India also raised the level of foreign equity ownership<br />
permitted in civil aviation, refineries, some mineral mining, construction, industrial parks and commodity<br />
exchanges in January 2008.<br />
In the textile and apparel sector, 100% FDI is allowed under the automatic route. FDI in sectors to the extent<br />
permitted under automatic route does not require any prior approval either <strong>by</strong> the Government of India<br />
2000-2001<br />
2001-2002<br />
2002-2003<br />
2003-2004<br />
2004-2005<br />
2005-2006<br />
2006-2007<br />
2007-2008<br />
Volume 02 / 2009<br />
2008-2009<br />
| Volume 02<br />
FDI : A Catalyst for Growth of the Textile & Apparel Industry |<br />
34
perspective<br />
a quar terly repor t <strong>by</strong><br />
Volume 02 / 2009<br />
| Volume 02<br />
or Reserve Bank of India (RBI). FDI inflows for this<br />
sector account for about 1% of the total FDI inflows<br />
to the country.<br />
Though the textile and apparel sector is considered<br />
as the sunshine sector of India, till date only 1% of<br />
total FDI inflow has come in this sector.<br />
However, given the advantages that India offers as<br />
an FDI destination, specific to textile and apparel<br />
sector, it is a matter of time that major Textile<br />
and Apparel Transnational Corporations (TNCs)<br />
recognize the real potential of India in this sector<br />
and significant investment follows. After China,<br />
India is the second most attractive destination for FDI in textile and apparel sector, other than South Asian<br />
countries of Bangladesh and Vietnam. These are the countries where the FDI and textile and apparel<br />
exports have seen a major growth. The primary reason for major investment in other countries has been<br />
duty free access to major markets, a parameter on which India ranks way behind. In order to achieve the<br />
projected growth of textile and apparel sector, it becomes still more important to make efforts to educate<br />
the international investing community about the merits of investment in India.<br />
An Attractive Destination for<br />
Investment<br />
There are many factors that make India an attractive destination for foreign investment in textile and apparel<br />
industry. These are listed below.<br />
Exhibit 5<br />
• Vertically Integrated: To begin with, the Indian<br />
Indian Textile Industry Supply Chain<br />
industry is amongst the very few in the world that<br />
is truly vertically integrated from raw material to<br />
Cotton Other Natural Fibres MMF<br />
finished products (from fiber to retail).<br />
•Broad Range of Products: Although cotton<br />
Ginning Spinning Extrusion<br />
has the largest share (around 58% of mill Small Players<br />
Small Players<br />
consumption), Indian industry has over the<br />
Garment<br />
years steadily diversified its raw material base<br />
Weaving/Knitting Prosessing<br />
to include man-made fibers such as polyester,<br />
viscose, acrylic, polypropylene etc. (accounting<br />
Distribution Channel<br />
Big Players constitute mainly<br />
for around 39% of raw material consumed), as<br />
the composite units or<br />
garment exporters<br />
well as other natural fibers (including silk, wool,<br />
Domestic Retail / Export Buyers<br />
linen etc.).<br />
• Production Capacity: India has one of the largest textile production capacities in the world which<br />
continues to grow and modernize. The capacity in spindles in the mill sector increased from 35.9 Mn<br />
in 2007 to 38.4 Mn in 2008. The number of shuttle-less looms rose to ~20,000 in 2008 from 16,600 in<br />
2007.<br />
• Fabrics: The Indian weaving and knitting base today includes products as diverse as fine dress fabrics,<br />
shirting, worsted suiting, denim, fleece, jersey, flat / woolen knits, technical fabrics etc. Much of this<br />
diversification of fabric product base has occurred in the last 10 to 20 years as domestic consumption<br />
patterns have changed as well.<br />
• Value Addition: In apparel, far beyond the embroidered, beaded or sequined dresses in women’s wear<br />
and bleeding madras shirts in menswear that so typified India’s image in the past, India produces active<br />
35 | FDI : A Catalyst for Growth of the Textile & Apparel Industry<br />
Exhibit 4<br />
US$ Mn<br />
FDI Inflow in Textile and Apparel Industry in India<br />
300<br />
250<br />
200<br />
150<br />
100<br />
50<br />
0<br />
Aug’ 91 to<br />
Dec’ 99<br />
2000<br />
2001<br />
2002<br />
2003<br />
2004<br />
2005<br />
2006<br />
2007<br />
2008
perspective<br />
a quar terly repor t <strong>by</strong><br />
Volume 02 / 2009<br />
| Volume 02<br />
sportswear, weather-proof outerwear, foundation garments, suits, socks, infant wear and a whole host of<br />
other products for all ages. Production of made-ups includes a wide variety of bed, bath and table linen,<br />
kitchen accessories, etc.<br />
• Flexibility: In addition to this, the industry has consistently remained flexible in terms of production quantity<br />
and lead time. While typical production runs are governed <strong>by</strong> fabric color minimums, India presents the<br />
possibility of producing quantities as low as a few hundred pieces. This capability is especially critical<br />
in an unpredictable market where retailers and brands are looking to source ever-smaller quantities of<br />
product, increasingly closer to the season.<br />
•Cost Advantage: Certainly, an abundant low cost base of labor has been one of the Indian industry’s<br />
advantages. Research works <strong>by</strong> organizations like Kurt Salmon Associates, Werner among others have<br />
highlighted India’s cost advantage, as well as the long-term sustainability of this advantage.<br />
What is more important is that, among this abundant workforce, the fabric or garment-making skill is very<br />
high as entire communities have participated in the trade and sustained and refined workmanship. It is<br />
Exhibit 6<br />
50<br />
40<br />
30<br />
20<br />
10<br />
0<br />
12 11<br />
Mexico<br />
Bulgaria<br />
27 27 25 28 26<br />
Estonia<br />
Latvia<br />
Lithuania<br />
Poland<br />
Slowakia<br />
Europe Middle East<br />
& Africa<br />
Labor Cost: Percent of US Labor Cost (2008)<br />
6<br />
Egypt<br />
17 15 12<br />
Morocco<br />
S. Africa<br />
Tunsia<br />
35<br />
Turkey<br />
2<br />
Bangladesh<br />
11<br />
China Costal<br />
Asia & Oceania A. America<br />
this existing base of needlecraft that has enabled the Indian industry to retain its position as one of the<br />
key suppliers of apparel and textiles, and also add new products to its portfolio <strong>by</strong> rapidly learning the<br />
techniques.<br />
•Specialists: Also, building on top of the textile engineering base which began in the 1950s, the 1990s<br />
have seen growth of “fashion management” studies, including marketing and merchandising, garment<br />
manufacturing technology, design management, fashion communications management etc. Simultaneous<br />
growth of the organized branded market within India, as well as the entry of larger companies sourcing<br />
from India, has given these fashion management graduates the playing field on which to further hone<br />
their skills, and provide a pool of management talent to Indian as well as global companies like Gap,<br />
Target, JC Penney, Nike, Reebok, Tesco, Next, Asda, Wal-Mart etc.<br />
In addition to the advantages offered <strong>by</strong> the Indian textile and apparel sector, the government has been<br />
very proactive in developing investor friendly policies and several other initiatives:<br />
• Foreign Investment Policy: Foreign investment is permitted in virtually every sector, except those of<br />
strategic concern such as defense and transport. Foreign companies are permitted to set up 100%<br />
subsidiaries in India. No prior approval from exchange control authorities RBI is required, except for<br />
certain specified activities. Under current policy, FDI can come into India in two ways:<br />
» Automatic Route: FDI in sectors/activities to the extent permitted under the automatic route does not<br />
require any prior approval either <strong>by</strong> the Government or RBI. The investors are only required to notify<br />
the proper regional office of the RBI within 30 days of the receipt of inward remittances and file the<br />
required documents with that office within 30 days of the issue of shares to foreign investors.<br />
8<br />
China Inland<br />
5 5<br />
Inidia<br />
Indonesia<br />
9<br />
Malaysia<br />
3<br />
Pakistan<br />
36<br />
S. Korea<br />
45<br />
Taiwan<br />
10<br />
Thailand<br />
3<br />
Vietnam<br />
26<br />
Argentina<br />
20<br />
Brazil<br />
14 12<br />
Colombia<br />
Peru<br />
FDI : A Catalyst for Growth of the Textile & Apparel Industry |<br />
36<br />
Uruguay<br />
36
perspective<br />
a quar terly repor t <strong>by</strong><br />
Volume 02 / 2009<br />
| Volume 02<br />
» Prior Government Approval Route (for both foreign investment and foreign technical collaboration):<br />
In the limited category of sectors requiring prior government approval, proposals are considered in a<br />
time-bound and transparent manner <strong>by</strong> the Foreign Investment Promotion Board (FIPB).<br />
• FDI in Special Economic Zones (SEZ)/Export Oriented Units (EOU)/Industrial Parks: FDI up to<br />
100% is permitted under the automatic route for the establishment of SEZ. Proposals not covered under<br />
the automatic route require approval <strong>by</strong> FIPB. FDI up to 100% is permitted under the automatic route for<br />
setting up 100% EOU, subject to sectoral policies. FDI up to 100% is permitted under the automatic route<br />
for the establishment of industrial parks.<br />
• Repatriation of Investment Capital and Profits: All foreign investments are freely repatriable except<br />
for cases where NRIs choose to invest specifically under non-repatriable schemes.<br />
•Important Labor Rules/Regulations Applicable in India: Under the Constitution of India, labor is a<br />
subject in the “concurrent list”, under which both the central and state governments are competent to<br />
enact legislation subject to certain matters being reserved for the centre. There are several important<br />
Labor Acts since 1952, which are highly protective of labor.<br />
• Policy on Intellectual Property Rights: India is a signatory to the agreement concluding the Uruguay<br />
Round of GATT negotiations and establishing the World Trade Organization.<br />
• Taxation Policy in India and Tax Incentives: India is moving towards a reform of its tax policies and<br />
systems to facilitate the globalization of economic activities. Tax holidays are available in SEZs set up<br />
to make industry globally competitive. Infrastructure sector projects enjoy special tax treatment and<br />
holidays. Since 31st March, 2004, a user-friendly tax administration has been introduced with round-theclock<br />
electronic filing of customs documents. Foreign nationals working in India are generally taxed only<br />
on their Indian income. Income received from sources outside India is not taxable unless it is received in<br />
India. Further, foreign nationals have the option of being taxed under the tax treaties that India may have<br />
signed with their country of residence. India has entered into Double Taxation Avoidance Agreements<br />
with 65 countries including the U.S., U.K., Japan, Germany, and Mauritius. Though the Indian government<br />
gives different kinds of investment incentives, major incentives are given in the form of tax exemptions on<br />
profit from the development and operation of infrastructure projects including power.<br />
Overall, FDI in India is allowed in all sectors except the following four: retail trading (except for single<br />
brand product retailing), atomic energy, lotteries, gambling and betting. In all other sectors, it is allowed<br />
with different equity limits ranging from 26% to 100%. The FDI environment in India has undergone a sea<br />
change since the inception of economic reforms in 1991. India’s strengths as an investment destination<br />
rest on strong fundamentals, including a large and growing market; world-class scientific, technical and<br />
managerial manpower, cost-effective and highly skilled labor, an abundance of natural resources, a large<br />
English-speaking population and an independent judiciary.<br />
Key Imperatives for Future<br />
India is well placed in the global map, right behind China which undoubtedly is the best destination for FDI<br />
as of today. However, there are still a lot of measures which can be undertaken <strong>by</strong> the Government of India<br />
to improve its’ position even further. Some of these measures are:<br />
• Improved Marketing: India needs to approach investors with better marketing plans in terms of projecting<br />
India as a major hub for investment. Road shows/conferences should be held in various countries to<br />
highlight India’s strengths and investment attractiveness. Emphasis on the fast growing and evolving<br />
domestic market, industrial growth and key benefits for textile and apparel industry in India need to be<br />
communicated clearly as part of marketing efforts. Considering that the western markets are maturing,<br />
India is still one of the very few countries with untapped potential for entry and expansion of leading global<br />
brands and retailers.<br />
37 | FDI : A Catalyst for Growth of the Textile & Apparel Industry
perspective<br />
a quar terly repor t <strong>by</strong><br />
Volume 02 / 2009<br />
| Volume 02<br />
• Increased Scale: India should develop large scale industrial zones (area > 100-200 sq. kms.) with all<br />
the facilities and business friendly environment in place. Although many SEZ’s and Integrated Textile<br />
Parks (ITPs) have been planned on similar line, there needs to be faster development on these areas<br />
and scale needs to be increased for these zones so as to establish entire supply chain for various textile<br />
activities.<br />
• Ready Made Infrastructure: Industrial zones in India should approach foreign investors only after<br />
establishment of all support infrastructures and with proper homework in terms of incentives / benefits,<br />
well laid out and definite plans and offerings to the investors.<br />
• Single Window Clearance: At the implementation level, the government needs to devise a mechanism<br />
to have single window clearance and single approval for all aspects of starting a business. This would<br />
go a long way in reducing the time taken for starting business in India and encourage investors to look at<br />
India as a favorable investment destination.<br />
• Clearance of Applications: Application clearance under the Incentive schemes like Technology Upgradation<br />
Fund Scheme and speeding up the process of establishing Free Trade Agreements with<br />
European Union would also help in attracting European investors to invest in India.<br />
• Investor Friendly Environment: There needs to be a major drive undertaken to reduce red-tape and<br />
bureaucracy in the system. A more investor friendly environment needs to be built to add to all the existing<br />
inherent strengths of the Indian textile industry. On the annual Corruption Perception Index, India’s score<br />
has remained the same for two consecutive years at 2.7. In the same period Pakistan improved from 2.3<br />
to 2.6 and China from 3.1 to 3.5. The higher the score, the less corrupt is the country.<br />
Conclusion<br />
India is poised to become an even bigger participant on the global front, both as a consumer and as<br />
a producer. The large domestic market is very attractive and as a base for the low cost production is a<br />
combination not offered <strong>by</strong> many nations at this point of time. However, in order to become a leading FDI<br />
destination in the textile and apparel sector, a lot needs to be done. The Government needs to work on a<br />
focused ‘Pull Strategy’. The way ahead is to identify and highlight the key strengths, the available resources<br />
and the large growing domestic market through focused marketing efforts.<br />
Authors<br />
Prashant Agarwal, Vice President I prashant.agarwal@technopak.com<br />
Luv Jasuja, Principal Consultant I luv.jasuja@technopak.com<br />
Rohit Nasa, Senior Consultant I rohit.nasa@technopak.com<br />
FDI : A Catalyst for Growth of the Textile & Apparel Industry |<br />
38
Building<br />
Operational<br />
Efficiency<br />
in<br />
Healthcare<br />
Delivery<br />
Overview 41<br />
Changing Healthcare:<br />
‘The Toyota Way’ 42<br />
Customer Relationship<br />
Management 44<br />
Hospital Revenue Cycle<br />
Management 46<br />
Electronic Medical Records 48<br />
Facility Planning 50<br />
40
perspective<br />
a quar terly repor t <strong>by</strong><br />
Volume 02 / 2009<br />
| Volume 02<br />
Overview<br />
With the turn of the century, the dynamics of work, health and life have undergone a sea change. Every<br />
sphere has seen growth and opportunities in leaps and bounds with newer and better ways of doing things<br />
and also doing altogether newer things. The emphasis is shifting towards improving efficiency, precision<br />
and reducing time and cost.<br />
Although this wave of change has swept across every industry, such dynamism and corporatization has<br />
completely changed the face of the healthcare industry. While there are an increasing number of patients,<br />
there is also an ever-increasing disease profile and burden. The disease pathway has become much<br />
more complex and not just limited to diagnosis and treatment. On the other hand, the implementation<br />
of information management systems has made the operation and administration of a hospital more<br />
professional and business-like.<br />
Over the last decade input costs have gradually increased, however due to increased competition<br />
Heathcare Providers are unable to pass this burden onto patients in the same proportion. This presents<br />
Hospital Administrators with a complex task of not only streamlining existing operations but also providing<br />
flexiblity for future changes in the business model. Hence, now more than ever, with rising demand and<br />
unprecedented growth of the sector, there is a growing need to come up with newer models to improve<br />
operational efficiency and make processes, infrastructure and our outlook to management more lean and<br />
specific.<br />
From the softer skills of Customer Relationship Management (CRM) to the core activities of Revenue Cycle<br />
Management (RCM), hospitals are undergoing a complete overhaul of how they do business and more<br />
importantly focussing on ‘who they do business for’.<br />
Exhibit 1<br />
Documentation<br />
Paper Records<br />
Electronic Medical<br />
Records<br />
Mode of payment<br />
Out of Pocket<br />
Third-Party<br />
41 | Building Operational Efficiency in Healthcare Delivery<br />
The Ongoing Transformation in Hospitals<br />
Public Relations<br />
Doctor - Patient<br />
relationship<br />
Marketing / CRM<br />
Quality<br />
Sporadic quality<br />
checks<br />
Accreditation<br />
Hospital Financial<br />
Operations<br />
Accounting<br />
Revenue Cycle<br />
Management<br />
Human Resources<br />
Low Employee<br />
Participation<br />
Active Employee<br />
Engagement<br />
Customization<br />
Mass Approach<br />
Personalised<br />
Care
Changing Healthcare:<br />
‘The Toyota Way’<br />
perspective<br />
a quar terly repor t <strong>by</strong><br />
Volume 02 / 2009<br />
01<br />
| Volume 02<br />
Changing market dynamics and consumer attitudes are forcing companies to redefine their business<br />
models. With growing competitive pressures and rising input costs, they recognize the need to restructure,<br />
redefine, redevelop and constantly improvise.<br />
While there is no standard formula to do the same,<br />
hospitals have improvised and developed their<br />
own USP models. However, over the years the<br />
challenge that still remains is to reduce the cost<br />
of care or keep it constant for the patient while<br />
progressively increasing the parameters of quality,<br />
accessibility and affordability.<br />
Some innovative practices adopted <strong>by</strong> hospitals to reduce the costs and improve on the throughput:<br />
•A<br />
popular ‘for-masses’ Indian hospital charges different fees for diagnostic services at different times of<br />
the day. They have been able to increase patient volumes <strong>by</strong> differential pricing. Therefore, while an MRI/<br />
CT scan may cost up to US$ 100 (~INR 5000) for a person choosing to get it done in the day, a poor<br />
person can get the same for US$ 10 (~INR 500) at 2 a.m. in the night. More and more hospitals are<br />
making an attempt to bridge the socio- economic gap in healthcare delivery through such practices.<br />
•To<br />
streamline operations, use of ‘Case Process Maps’, wherein the activities of all the staff involved in a<br />
procedure are mapped and time plotted allowing the variations to be studied and corrected. This helps<br />
to cut out redundancy and errors while improving accuracy and efficiency.<br />
Exhibit 3<br />
Surgeon<br />
Assistant<br />
Machine Support<br />
OT Nurse<br />
Anaesthesiologist<br />
Avoid ‘Muri’:<br />
Standardization<br />
Start Patient Entry Patient Prep Incision Procedure End Closure Patient Exit Room Cleaning<br />
Eliminate ‘Muda’ : Waste Reduction<br />
Minimize ‘Mura’:<br />
Promote Consistency<br />
Muda: Waste Mura: Inconsistency Muri: Randomness<br />
Exhibit 2 Changes in Cost of Care<br />
Case Process Maps<br />
Cost Year 2000 Year 2009<br />
Technology x 2x<br />
Manpower x 2.5x<br />
Consumables x 2x<br />
Land & Building x 2x<br />
Cost to Patient<br />
Source: Surgical Management Improvement Group<br />
Many hospitals are adopting the classic<br />
Japanese Process Improvement Triad as<br />
shown. Activities such as re-organization, value<br />
mapping and best practices are designed to<br />
help implement these principles.<br />
Building Operational Efficiency in Healthcare Delivery | 42
perspective<br />
a quar terly repor t <strong>by</strong><br />
Volume 02 / 2009<br />
| Volume 02<br />
Another example is the innovative restructuring and transformation brought about on these very<br />
principles <strong>by</strong> the Virginia Mason Medical Center (VM) in Seattle.<br />
Virginia Mason, a 336 bed hospital present in 9 locations and employing over 400 physicians<br />
and 5000 employees in 2000, was undergoing a period of organizational lethargy. In a bid to<br />
bring greater efficiency and vitality to their institution’s operations, the senior administration<br />
designed a hospital-wide program called the Virginia Mason Production System and successfully<br />
‘leaned’ various arms of the hospital. At the heart of the system were Rapid Process Improvement<br />
Workshops (RPIWs) with VM having inculcated over 500 of them. These workshops essentially<br />
redesigned the job descriptions of physicians and front-line staff as described below:<br />
The system aims to go to the root cause of a problem involving all the levels of hierarchy concerned. Each<br />
task is graphically represented through boxes showing the process flow and time allocated. A copy of this<br />
is displayed on the wall and observed from time to time to identify the missing links and areas requiring<br />
improvement through Rapid Process Improvement Workshops (RPIWs).<br />
These workshops are conducted over five working days and change is implemented the following<br />
Monday.<br />
Also there are monthly, bi-monthly and 90-day audits to further improve and regulate work-flow. This<br />
approach helps in identifying and correcting problems in real-time.<br />
Exhibit 4<br />
An example of a RPIW Chart tracing movement or footsteps of staff while on duty. The colored<br />
lines represent different nursing and paramedical staff movements.<br />
The system also promotes the concept of ‘kaizen’<br />
which is continuous incremental improvement.<br />
By going the Toyota Way, Virginia Mason Hospital<br />
showed how work-flow optimization techniques<br />
were appropriate for universal application. Some of<br />
the improvements they observed in just two years<br />
are illustrated in the Exhibit 5.<br />
Most of these radical overhaul methods do not<br />
require huge investments or manpower. These<br />
learnings can be replicated in Indian hospitals to<br />
result in significant savings and quality healthcare<br />
for all.<br />
43 | Building Operational Efficiency in Healthcare Delivery<br />
Before RPW After RPW<br />
Exhibit 5<br />
Results:<br />
Source:Team Medicine- Virginia Mason<br />
Results Achieved<br />
In two years<br />
(‘02-‘04)<br />
Savings in budgeted capital US$ 12 Mn to US$ 15 Mn<br />
Reduction in staff walking distance 38%<br />
Reduction in travel distance of supplies 77%<br />
Saving in inventory 50%<br />
Reduction in lead time 53%<br />
Gain in productivity 44%
Customer Relationship<br />
Management<br />
perspective<br />
a quar terly repor t <strong>by</strong><br />
Volume 02 / 2009<br />
02<br />
Customer Relationship Management (CRM) is a method for an organization to track, maintain and organize<br />
a database of its current and prospective customers. In the healthcare sector, there is a wide difference<br />
between the customer and the consumer. While an ill patient is the consumer, a doctor prescribing medicines<br />
is an essential customer. Hence, there is a series of relationships that need to be nurtured and managed<br />
to enhance patient retention.<br />
Exhibit 6<br />
Application of CRM<br />
CRM has now evolved into a science which has been used very effectively and productively to enhance<br />
the efficiency of various sectors such as the banking industry.<br />
Multi-channel<br />
Integration<br />
Customer<br />
Marketing<br />
Customer<br />
Analysis<br />
Customer<br />
Care<br />
Credit Cards,<br />
Insurance Schemes<br />
Customer profitability,<br />
Propensity to buy,<br />
Attrition behaviors<br />
CRM is increasingly being applied in the healthcare industry in the following ways:<br />
Collection<br />
&<br />
Integration of<br />
Customer<br />
data<br />
Customer<br />
Delight<br />
&<br />
Retention<br />
Analysis<br />
&<br />
Application<br />
of this data to<br />
provide quality<br />
service to<br />
customers<br />
•The<br />
consumer or patient in healthcare is not one, essentially <strong>by</strong> choice. Apart from the illness, the consumer<br />
finds himself dealing with financial burdens, anguish of medical procedures along with the ongoing<br />
mental agony. Here the intervention of an active CRM goes a long way in building patient confidence and<br />
goodwill. It eventually becomes a deciding factor for the patient while choosing a hospital again.<br />
Customer satisfaction is one of the major drivers of repeat business.<br />
•Another<br />
important consideration is that in a hospital, the patient comes in contact with the entire series of<br />
touch points, right from the receptionists, doctors, nurses, paramedics, to the administrative personnel.<br />
So in an active CRM programme it is necessary to train every member of the hospital in providing quality<br />
care and service to the patient. It also plays an important role in retaining a patient.<br />
•The<br />
adage that the cost of efforts undertaken to retain a customer is ten times lesser than that of acquiring a<br />
new one, still holds true. The mathematical parameter of Customer Lifetime Value (CLV), where financial<br />
| Volume 02<br />
Building Operational Efficiency in Healthcare Delivery | 44
perspective<br />
a quar terly repor t <strong>by</strong><br />
Volume 02 / 2009<br />
| Volume 02<br />
•gains<br />
are defined in terms of customer relationship, is of great significance here with service being the<br />
key differentiator.<br />
•Medical<br />
Tourism: Today healthcare has become global. India has a growing number of international<br />
patients and more and more hospitals are rushing to upgrade their services, infrastructure and most of<br />
all their technologies. The service they provide and the follow- up, all contribute to a growing number of<br />
patients returning for new treatments.<br />
As depicted in Exhibit 7, even if CRM<br />
fills 50% of its cancelled appointments<br />
i.e. 30 appointments, it is equal to<br />
US$ 93,750 in savings.CRM program<br />
also promotes optimal utilization of<br />
the deployed resources.<br />
•Savings<br />
in mass advertising and marketing: The promotional efforts of hospitals have now changed<br />
directions. One of the major changes has been the central position given to the patients. Also from<br />
unfocussed widespread media targeting the approach is now more specific.<br />
A new method making use of database marketing is proving to be very profitable and insightful wherein<br />
a specific customer is targeted for advertising on the basis of previous consumption and usage trends. A<br />
comprehensive database of all present customers, possible suspects and prospects is maintained. This<br />
method gives direction, flow and individualism to marketing which in turn results in huge cost savings<br />
and increased footfalls as the mode and message of advertising for women in child bearing age group is<br />
drastically different from, say, a sixty- year- old retired man.<br />
Some Industry Illustrations<br />
Perhaps the most important application of CRM is in disease prevention. It has been estimated that if<br />
patients are recommended preventive health check- ups on the basis of their past medical history, 90% of<br />
them are likely to come in for a check-up.<br />
Tenet Healthcare Corporation (hospital chain in the United States)<br />
analyzed their US$ 60 Mn marketing expenditure for a particular<br />
division and realized that they were spending 75% of it on nondirectional<br />
media advertising.<br />
Although CRM has been adopted <strong>by</strong> numerous industries across India to yield dramatic results, the<br />
Healthcare sector is yet to realise its full potential and use it as a powerful tool to aid patient retention.<br />
45 | Building Operational Efficiency in Healthcare Delivery<br />
Exhibit 7<br />
Number of appointments / day 400*<br />
Total number of working days 300<br />
Average consultation charge ~ US$ 10 (INR 500)<br />
No- shows 15 % = (60).<br />
Revenue lost =60 app * 300 working days *<br />
US$ 10 (INR 500)<br />
= US$ 0.18 Mn (INR 9 Mn)<br />
* For a 200 bedded Specialty hospital<br />
Customer Potential Management Corp. (CPM), a healthcare marketing firm,<br />
uses Neural Network Technology (an artificial intelligence tool) to sort<br />
prospects <strong>by</strong> service line, e.g. cardiology, oncology. They also use several<br />
insightful indices such as Consumer Healthcare Utilization Index (CHUI) and<br />
Patient Disease Index (PDI) which help them to identify which customer is most<br />
likely to need which service and when.
Hospital Revenue Cycle<br />
Management<br />
Exhibit 8<br />
• Collection and recording of<br />
cash received<br />
• Contractual allowances<br />
Back- end<br />
• Follow up for outstanding<br />
payments/accounts receivable<br />
• Denial management<br />
Standard Revenue Cycle with Activity Analysis<br />
Appointments Scheduling<br />
• Registration<br />
• Patient information collection<br />
• Information verification<br />
• Insurance validation<br />
Front - end<br />
•Billing and collection<br />
•Claims review, approval and<br />
denial along with insurance<br />
company<br />
Registration<br />
•Computing the deductibles<br />
and co-payments<br />
•Public health insurance<br />
program counselling<br />
perspective<br />
a quar terly repor t <strong>by</strong><br />
Less than 10% of the Indians are estimated to be covered under some sort of health insurance. Most<br />
patients pay for their hospital expenses directly. Today, in most hospitals in metro cities, over 50% of<br />
patients have some form of third-party reimbursement plan. Failure to realise this could seriously affect the<br />
working capital of a hospital.<br />
For this purpose hospitals worldwide are looking at options to optimize as well as maximize the amount<br />
and speed of patient revenue collection.<br />
The hospital revenue cycle has 3 major components:<br />
• Front-end: From the time the patient comes in first contact with the hospital to registration<br />
•Core: Provision of actual healthcare services<br />
•Back-end: Billing and discharge of the patient<br />
Improvement in Hospital Revenue Cycle Management cannot be achieved instantly <strong>by</strong> merely installing new<br />
technology. It involves a careful blend, integration and organization of the necessary people, processes<br />
and technologies.<br />
Some of the drivers of an efficient and effective revenue cycle include:<br />
•Strict<br />
accountability<br />
• Standardization<br />
• Monitoring & measurement<br />
• IT implementation<br />
• Integration of processes<br />
• Charge capture into Hospital<br />
Information System (HIS)<br />
• Diagnosis and procedure<br />
coding<br />
Volume 02 / 2009<br />
03<br />
•Clinical documentation(used<br />
in the billing process and<br />
communicated to third-party<br />
payer)<br />
Core<br />
| Volume 02<br />
Building Operational Efficiency in Healthcare Delivery | 46
perspective<br />
a quar terly repor t <strong>by</strong><br />
Volume 02 / 2009<br />
| Volume 02<br />
While managing a hospital revenue cycle, the following ought to be kept in mind:<br />
•Payment<br />
collection: Hospitals can optimize revenues <strong>by</strong> putting in place a defined process for collecting<br />
payments from patients either at registration or at day end<br />
•Third-party<br />
payers: Absence of standard protocols leads to ambiguity which causes complexity in the<br />
matter and delays<br />
•Follow-up:<br />
Hospitals need to have an agile follow- up system to ensure timely payments<br />
•Denial<br />
management: This involves sorting out circumstances which led to claim denial. They can vary<br />
from failure on part of patient to adhere to standard procedures or clinician confusion with respect to<br />
treatment<br />
•Healthcare<br />
is witnessing a transition from Out-of-pocket spending towards Corporate and Third-party<br />
Payments. As a result, Hospital Revenue Cycle Management will become a critical factor in determining<br />
the financial health of the providers<br />
•Outstanding revenues that exceed<br />
the industry average<br />
•Receivables inexcess of 30%<br />
of revenue<br />
•Increase in bad debts as % of<br />
revenue<br />
•Lack of Working Capital<br />
47 | Building Operational Efficiency in Healthcare Delivery<br />
Average collection period = (Net amount receivable * 365) ÷ Net patient revenues<br />
(Measured as days in net accounts receivable)<br />
A shorter average collection period implies that the hospital receives faster payments from the insurer)<br />
Exhibit 9 Exhibit 10<br />
What to look out for: Some of the Best Practices<br />
Registration<br />
•Collection of all neccesary<br />
demographic data for<br />
scheduled patients<br />
•Defined prerequisites<br />
•On-line alert indicators<br />
•Regular tracking and<br />
monitoring<br />
Payment collections Denial Management<br />
•Standardized policies,<br />
procedures and employee<br />
training<br />
•Optimal utilization of IT<br />
•Electronic claimssubmission<br />
•Denial tracking<br />
•Case reviews<br />
•Documentation of all<br />
interactions
Electronic Medical Records<br />
perspective<br />
a quar terly repor t <strong>by</strong><br />
In India, barring a few private hospitals, all records are maintained in physical form. Each patient has a<br />
unique clinical history and their own sets of tests and records which are necessary to be recorded and<br />
filed for future reference. Such a scenario poses a daunting challenge for every member of the healthcare<br />
delivery team. Even if storage is possible, the crux of the problem is fast retrieval of patient’s medical data<br />
at vital times.<br />
Also if a patient’s records are filed in one hospital, for a cross referral check or an opinion at a second<br />
hospital, the patient has to go through the entire process of documentation and testing again adding to his<br />
financial distress.<br />
Electronic Medical Records (EMRs) eliminate the burden of tedious paperwork occupying much of the<br />
physician’s quality time. They serve as a comprehensive database of the patient’s entire history, but they<br />
are also very user-friendly as they help to locate relevant data instantly when needed across multiple<br />
locations and point of times. Providing instant portability they also prove useful in other supplementary<br />
fields such as liaisoning with the insurer, tracking public health as well as administrative roles of auditing.<br />
Exhibit 11<br />
Continuity in<br />
treatment<br />
Safe with<br />
authorised viewership<br />
Vital information<br />
at vital times<br />
Advantages of EMR<br />
Accessible at all times,<br />
continually upgraded<br />
Cost efficient<br />
Search and sorting<br />
made easy<br />
Volume 02 / 2009<br />
04<br />
| Volume 02<br />
National Health Service (NHS)<br />
UK’s public healthcare system is a pioneer in<br />
implementing electronic records. Apart from the<br />
obvious benefits,confidentiality is maintained at every<br />
level <strong>by</strong> providing Smart Cards to physicians limiting<br />
their access to only relevant areas of the record.<br />
In the United States, the Department of Veterans Affairs (VA)<br />
has the largest enterprise-wide HIS that includes an EMR<br />
system, known as the Veterans Health Information Systems<br />
and Technology Architecture (VistA). VistA imbibes<br />
an Imaging System which provides comprehensive database<br />
including specialties such as cardiology, radiology and orthopedics.<br />
A graphical user interface known as the Computerized<br />
Patient Record System (CPRS) allows physicians to review and<br />
update a patient’s EMR at any of the VA’s facilities. CPRS allows<br />
the providers to place orders, indent medications, special<br />
procedures, X-rays, patient care nursing orders, diets, and<br />
laboratory tests.<br />
Building Operational Efficiency in Healthcare Delivery | 48
perspective<br />
a quar terly repor t <strong>by</strong><br />
Exhibit 12<br />
Exhibit 13<br />
Google<br />
Maps Earth<br />
Medical<br />
consultation<br />
online<br />
Volume 02 / 2009<br />
Customisation<br />
Flexiblity<br />
| Volume 02<br />
While on first glance the benefits and ease make the system of digital records seems like a complete<br />
winning proposition there are however some roadblocks to its implementation such as:<br />
•Heavy<br />
initial investment<br />
•Low<br />
acceptability<br />
•Confidentiality<br />
& privacy concerns<br />
•Lack<br />
of global uniformity<br />
•Low<br />
adoption rate: It is estimated that less than 30% of U.S hospitals have adopted electronic records<br />
EMRs, though requiring significant investment, represent the way forward to create a much needed<br />
centralised database. While most corporate hospitals in India have started implemented EMR, the smaller<br />
hospitals would require significant assistance and financial support.<br />
49 | Building Operational Efficiency in Healthcare Delivery<br />
Case Study: An Indian 650-bed multi-specialty state -of -the- art hospital deployed an advanced<br />
web-based HIS.<br />
Innovation @ Google<br />
Google<br />
Health<br />
Manage<br />
Health records<br />
•Better inventory and medical package control<br />
•Rapid access to laboratory results<br />
•Improved continuity of medical records<br />
GH on<br />
iPhone<br />
Mobile phone<br />
health access<br />
Pharmaceutical<br />
substitution<br />
Speed<br />
Google<br />
flu trends<br />
Digital Outbreak<br />
detection<br />
Automated patient billing<br />
With over 400,000 outpatient visits per year, the hospital<br />
reduced its outpatient processing time <strong>by</strong> 40% to increase<br />
patient throughoput.<br />
Security assurance<br />
with control<br />
Scalability and<br />
interoperability<br />
Many companies like Google, have<br />
innovated and taken technology a step<br />
further <strong>by</strong> coming up with a whole range<br />
of medical technological applications<br />
such as predicting epidemic trends and<br />
also making healthcare advice available<br />
on cell phones.
Facility Planning: Role in<br />
Performance Enhancement<br />
perspective<br />
a quar terly repor t <strong>by</strong><br />
Volume 02 / 2009<br />
05<br />
In recent times, patient expectations and demand for quality healthcare facilities in India have undergone<br />
a transformational shift. However, hospitals of yesteryears were neither planned to accommodate future<br />
growth nor to provide the care and service standards that are expected today.<br />
| Volume 02<br />
Over time as demand grew, so did hospitals. However, this growth was accretive in nature and the ad hoc<br />
additions or extensions resulted in various trade-offs, leading to operational inefficiencies and compromised<br />
functionality.<br />
In today’s changing environment, as hospitals look<br />
to improve their performance, they should take into<br />
account various design parameters that can result<br />
in direct or indirect economic benefits. Some of the<br />
parameters that can lead to operational efficiencies<br />
and there<strong>by</strong>, cost savings are:<br />
•Patient<br />
monitoring<br />
•Patient<br />
flow<br />
•Nurse<br />
travel distances<br />
•Standardization<br />
A large part of a patient’s ‘length of stay’ is spent under critical or post surgical care, where constant patient<br />
observation and monitoring is essential. In this stage, patients are extremely vulnerable and response<br />
times become very important. For smooth recovery of patients, it is essential that staff be able to respond<br />
to the clinical need of the hour. For this, patients should be under direct nurse observation at all times.<br />
This can be achieved in many ways, one of them<br />
through an appropriate layout that allows staff to<br />
observe, manage and attend to patients constantly.<br />
A C-shaped patient care unit with 8 to 10 bed<br />
management unit size is considered good.<br />
A large percentage of patients follow a well<br />
established and clear patient pathway during a<br />
hospital visit.<br />
Good alignment of a patient’s physical journey<br />
with his or her clinical journey can lead to better<br />
and quicker delivery of care. Patient flows should<br />
Exhibit 14<br />
Imperatives for Redesign:<br />
• Capacity constraints<br />
• Streamlining growth<br />
• Enhancing revenue streams through efficient design<br />
• Addition/expansion of service lines<br />
• Patient expectations<br />
• Existing life of building<br />
• Accommodation of new Technology<br />
• Reengineering to respond to advancements in medicine<br />
• Change in ownership<br />
• Branding<br />
Exhibit 15 Patient Monitoring<br />
Ideal Unit Configuration for Critical Care<br />
Building Operational Efficiency in Healthcare Delivery | 50
perspective<br />
a quar terly repor t <strong>by</strong><br />
Volume 02 / 2009<br />
| Volume 02<br />
therefore be streamlined to avoid constant<br />
backtracking and cross-overs. These not only lead<br />
to confusion and chaos, but also issues of infection.<br />
At the same time, high volume traffic, restricted<br />
traffic and after hours departmental needs should<br />
be kept in mind.<br />
Given the complexity of healthcare environments,<br />
overlaps in patient movement cannot be completely<br />
avoided. However, all efforts should be made to<br />
minimize them.<br />
Nursing care forms one of the most important<br />
components of patient care during hospital stay.<br />
Nurses spend an unbelievably large part of their time<br />
walking from room to room, attending to patients.<br />
Long corridors and inefficient planning contribute<br />
to making travel time for nurses significant.<br />
Pharmacy<br />
Good travel distance planning leads to better<br />
operational efficiency as nurses are able to respond<br />
to patient’s clinical needs and any emergency calls<br />
in a timely manner. In addition, it results in less staff fatigue and more staff satisfaction.<br />
One of the design strategies to address the issue of travel time is decentralized nursing stations. However,<br />
it is important to strike the right balance between centralization versus decentralization. To what extent<br />
should nurses’ work area be decentralized? What should be the overall patient unit layout in order to<br />
optimize resources as well as minimize travel distances for staff?<br />
While there is no universal answer as different<br />
organizations have different models of care, the<br />
thumb rule of an 8 to 10 patient bed management<br />
unit is a good starting point.<br />
New construction for healthcare is increasingly<br />
looking at standardization as a means to achieve<br />
operational efficiency.<br />
Standardization helps in optimizing use. If various<br />
rooms are equipped to handle multiple types of<br />
procedures, the overall utilization is more efficient.<br />
In case demand outweighs planned capacity for<br />
different procedures, standardized rooms can<br />
help in accommodating the additional patient/<br />
case volumes.<br />
51 | Building Operational Efficiency in Healthcare Delivery<br />
Exhibit 16<br />
Exhibit 17<br />
Patient Flow<br />
Typical Patient Flow for Outpatient Services<br />
Patient Arrival<br />
Registration<br />
Waiting<br />
OPD<br />
Consultation<br />
Nurse Travel Distances<br />
Billing<br />
Diagnostics<br />
Layout of a Typical Patient Care Unit Nurse Travel Distances
In addition, standardization also helps in reducing<br />
medical errors. For instance, in same handed<br />
patient rooms, familiarity with layout and location of<br />
equipment and drugs allows staff to respond faster<br />
and better and work more efficiently.<br />
A little intervention and thought at the planning<br />
stage can lead to long- term tangible and intangible<br />
benefits for an institution. With better planning,<br />
more efficiency can be achieved with the same<br />
doctors, the same service and the same staff.<br />
Exhibit 18<br />
perspective<br />
a quar terly repor t <strong>by</strong><br />
Standardization<br />
Authors<br />
Dr. Rana Mehta, Vice President I rana.mehta@technopak.com<br />
Gulshan Baweja, Associate Director I gulshan.baweja@technopak.com<br />
Abhishek Pratap Singh, Principal Consultant I abhishek.singh@technopak.com<br />
Monika Kejriwal, Principal Consultant I monika.kejriwal@technopak.com<br />
Dr. Aditi Sharan, Associate Consultant I aditi.sharan@technopak.com<br />
Volume 02 / 2009<br />
Typical patient room: Same handed configuration<br />
Typical patient room: Mirrored configuration<br />
| Volume 02<br />
Building Operational Efficiency in Healthcare Delivery | 52
53<br />
perspective<br />
a quar terly repor t <strong>by</strong><br />
Volume 02 / 2009<br />
| Re-connecting with the Consumer<br />
| Volume 02<br />
Re-connecting with the Consumer<br />
This article appeared in Business Standard on July 30, 2009<br />
Financial results for the most recent quarter seem to confirm that the worst is behind for most companies<br />
including those that are engaged in consumer interfacing businesses. The recovery in consumer spending<br />
is visible across almost all the sectors including automobiles, consumer electronics and durables,<br />
information technology and communication, apparel and footwear, and leisure and entertainment. Major<br />
organised retailers too, even though collectively modern retail still accounts for no more than 5% of total<br />
consumer spending in India, are <strong>report</strong>ing a rise in same-store sales data. There are laggards and poor<br />
performers in each of these sectors, of course, but that is always to be expected in good times as well as<br />
not so good times.<br />
With the scare of deficient monsoons somewhat mitigated in recent weeks, and with an early festive season<br />
this year, the prospects for growth in consumer spending look promising for the coming quarters. Does<br />
this imply that it would be back to the heady days of the recent past when the Indian consumers’ optimism<br />
about spending was at an all-time high and just about every manufacturer and marketer could expand their<br />
capacity very aggressively? The answer is no.<br />
While India’s own gross economic data may not reflect a serious impact of the recent global economic<br />
meltdown on India, the ripples have affected India and Indian consumers very perceptibly and it is quite<br />
likely that the Indian consumers’ behaviour would have undergone a subtle but fundamental change<br />
in just these few quarters. There are several global consumer trends that seem to be applicable to the<br />
Indian consumers too, notwithstanding their very different demographic profile compared to the rest of<br />
the world. The first key trend is the ‘shift to thrift’ and a redefinition of what constitutes “value” in the mind<br />
of the consumers. While consumption in terms of volume is still steadily increasing, consumers want to<br />
save money everywhere and hence, are seeking lower-priced, acceptable-quality options all around, be it<br />
apparel and footwear, travel & leisure, food & grocery, or eating out. This trend is applicable to all income<br />
strata barring the minuscule one at the very top.<br />
The recent economic crisis (and the fear it has invoked in India) has brought to the fore the importance<br />
of family ties. Hence, Indian consumers are already spending more time on family and home-oriented<br />
activities and thus, there are more opportunities for products and services that can be offered to the whole<br />
family such as value-priced travel and vacation packages, home entertainment, and home décor and<br />
furnishing.<br />
In times of stress, consumers are increasingly looking for ‘small wonders’ - essentially small (low ticket size)<br />
products to perk themselves up more frequently. These need not only be related to small packs of juices<br />
and chocolates and other food products but also a host of other items including skin and body care, gifts<br />
for self, apparel, books and music etc.<br />
Indian consumers were never really brand-loyal to begin with. They are becoming even more fickle and<br />
this trend will be one of the more enduring ones for years to come, as they seek more options both for the<br />
products and for the retail channel they buy from.<br />
Indian consumers, like their counterparts in more advanced societies, are also exhibiting light shades of<br />
‘green’. The trend towards becoming more conscious to the ecology and environment is going to gather<br />
momentum.<br />
And finally, while Indian consumers were already highly socially networked, technology (mobile and internet)<br />
is making this social networking even more pervasive and powerful.
perspective<br />
a quar terly repor t <strong>by</strong><br />
What does this mean for manufacturers and marketers of consumer goods and services? The most<br />
important message is that they must ‘re-connect’ with their consumers even if such marketers have been<br />
in business for decades. This implies investing more in understanding the consumer, accelerating product<br />
innovation and speeding up new product launches, re-engineering product attributes and the retail channel<br />
to offer more value to each consumer segment, creating better interactivity with the consumers extending<br />
beyond traditional advertising and point-of-purchase touch points, and reaching out to them/listening to<br />
them through their social networks.<br />
Author<br />
Arvind Singhal, Chairman & Managing Director I arvind.singhal@technopak.com<br />
Volume 02 / 2009<br />
| Volume 02<br />
Re-connecting with the Consumer |<br />
54
Indian<br />
Tourism :<br />
Managing<br />
Growth <strong>by</strong><br />
Breaking<br />
Barriers<br />
Tourism - Growth Drivers 57<br />
Government Recognizing<br />
Tourism as a Top Priority 59<br />
Opportunities for Investment 64<br />
Looking Forward Together 66
perspective<br />
a quar terly repor t <strong>by</strong><br />
Volume 02 / 2009<br />
| Volume 02<br />
Background<br />
Travel and Tourism is an inseparable part of the world in which we live making a significant contribution to<br />
the country’s economy, as well as to the quality of life of its citizen’s.<br />
Globally, travel and tourism, accounts for 10% of the GDP, 8% of jobs and 12% of investment annually. It<br />
also has the highest potential for growth with the industry, currently growing at more than 4% per annum<br />
with an average of 3% in developed economies and more than 7% in emerging markets. In India, travel &<br />
tourism is currently contributing 2.2% directly to the GDP and is expected to grow at 6.6% as compared to<br />
the retail industry, which despite its high contribution of 35% to the GDP, is expected to witness a growth,<br />
which is marginally higher than the hospitality sector, at 8%.<br />
Travel makes a positive contribution to the planet and its people, assuring human contact, providing<br />
pleasure, expanding business opportunities, easing diplomatic relations and opening eyes to new horizons<br />
and perspectives. The resilience of tourism – with demand repeatedly bouncing back despite successive<br />
high profile challenges ranging from terrorism to disease – shows how keenly and widely it is appreciated<br />
<strong>by</strong> its customers. Tourism is appreciated <strong>by</strong> all – so much so that they compete for the benefits it can bring,<br />
economically, socially, and environmentally. It is helping build economies emerging from poverty, conflict<br />
and confusion. It stimulates infrastructure development, secondary economic activity and gives value to<br />
natural and built heritage that would otherwise be under threat.<br />
Tourism – Growth Drivers<br />
Tourism acts as a unifying force as people travelling can witness the dynamism of their own country at work<br />
and learn about their own nation. This experience helps in fostering goodwill and understanding between<br />
various linguistic, religious and communal groups living in different parts of the country.<br />
Development of the tourism industry provides employment for many and has helped build stronger<br />
economic structures which in turn have helped in attracting international tourists and the foreign exchange<br />
they bring in. Tourism also contributes to the development of the local handicrafts and cottage industries.<br />
It is said that with every 40 Km drive from a state premise, one witnesses vast changes in the topography,<br />
the dialect, the food habit and the attire in a united Exhibit 1<br />
and diverse India, which presents a multi-faceted<br />
tourism product ranging from 27 world heritage<br />
Indian Tourism Industry - Market Size<br />
sites, mountains, beaches and deserts intermingled<br />
with an opportunity to experience diverse cultures<br />
and religions.<br />
250<br />
200 79%<br />
46<br />
78%<br />
85<br />
81<br />
With both Indians and foreign nationals travelling<br />
within the country, the tourism industry is estimated<br />
to be worth US$ 43 Bn in 2008 with close to 612 Mn<br />
tourist visits during the year. Currently, the industry<br />
experiences a healthy growth of 17% in value terms<br />
and 14% in volume terms. Approximately 75%<br />
of the tourism spend in the country is fuelled <strong>by</strong><br />
domestic travelers (shown in Exhibit 1).<br />
Traditionally, mankind has been extremely inquisitive and very travel friendly, the quest for knowledge and<br />
to walk the unknown has encouraged travelers from far and wide to experience the wonderful and diverse<br />
nature of the country. Although the industry and the government have taken strong measures to boost<br />
the inflow of foreign travelers in India <strong>by</strong> effective marketing strategies, it is the domestic traveler who has<br />
contributed to the overall growth of tourism as a sector in India. The growth rates in both international and<br />
domestic travel are extremely encouraging.<br />
57 | Indian Tourism : Managing Growth <strong>by</strong> Breaking Barriers<br />
Market Size ( US$ Bn)<br />
150<br />
100<br />
50<br />
0<br />
4<br />
15<br />
2003<br />
74%<br />
77%<br />
22<br />
164<br />
11<br />
32<br />
73<br />
2008E 2013F 2018F<br />
Domestic Tourist Spends International Tourist Spends % Domestic<br />
Source: Euromonitor, Tourism Statistics 2007, Ministry of Tourism–Government of India, <strong>Technopak</strong> analysis<br />
77<br />
73<br />
69<br />
65
perspective<br />
a quar terly repor t <strong>by</strong><br />
The number of domestic tourists has almost doubled from 309 Mn in 2003 to 612 Mn in 2008. Similarly, the<br />
number of foreign tourist visits has doubled between 2003 and 2008.<br />
Close to 90% of the above visits are fuelled <strong>by</strong> domestic travelers and the dependence on the foreign<br />
travelers is miniscule (only 2%) as shown in Exhibit 2.<br />
Exhibit 2 Exhibit 3<br />
2500<br />
2000<br />
1500<br />
1000<br />
500<br />
0<br />
6.7<br />
309<br />
2003<br />
Tourist Visits In India<br />
97.87% 97.63% 97.96% 98.24%<br />
14.5<br />
598<br />
23.5<br />
1,127<br />
38.0<br />
2,124<br />
2008E 2013F 2013F<br />
Domestic Tourist Visits International Tourist Visits % Domestic<br />
Source: Euromonitor, Tourism Statistics 2007, Ministry of Tourism– Government of India, <strong>Technopak</strong> analysis<br />
100<br />
96<br />
92<br />
88<br />
84<br />
80<br />
The most important growth driver is the robust economic growth that has been witnessed in the country.<br />
India’s GDP has been growing at a rate of 6% since the liberalization of economy in 1991 and has grown<br />
over 8% in the past a few years. At 8% CAGR, India’s GDP would almost triple from US$ 1200 Bn to US$<br />
3500 Bn <strong>by</strong> 2023.<br />
Currently, India is the 12th largest economy in the world in absolute terms and is expected to overtake most<br />
of the European nations in the next 15 to 20 years. It will eventually become the world’s 3rd or 4th largest<br />
economy <strong>by</strong> 2050. Despite the recent economic downturn, various industry sources still peg the economic<br />
growth at over 6%.<br />
India’s strong economic growth has caused the GDP per capita to increase rapidly over the past 5 to 10<br />
years. At the current rate, the GDP per capita in 2013 would be double of what it was in 2003.<br />
More and more families are expected to leave the deprived or aspirers category (annual household income<br />
less than US$ 4200) and join India’s burgeoning middle class. By 2025, the Indian middle class is<br />
expected to constitute 46% of the Indian population. Subsequently, discretionary spends would be<br />
going up and this bodes well for the tourism sector.<br />
In 2005, the Indian middle class was approximately 6% of the population, but is expected to constitute 46%<br />
of the population <strong>by</strong> 2025.<br />
4000<br />
3200<br />
2400<br />
1600<br />
Exhibit 4 Exhibit 5<br />
GDP Per Capita (US$)<br />
1000<br />
800<br />
600<br />
400<br />
200<br />
0<br />
Growth In GDP Per Capita<br />
1998 2003 2008 2013<br />
Source: <strong>Technopak</strong> analysis, Indian Economic Survey 2007-08, Lehman Brothers<br />
GDP Per Capita (US$)<br />
800<br />
India's GDP Growth<br />
2008 2013 2018 2023<br />
Volume 02 / 2009<br />
Germany (2%), 3,800<br />
India (8%), 3,500<br />
UK (2%), 3,300<br />
France (2%), 3,200<br />
Brazil (5%), 2,400<br />
Russia (5%), 2,200<br />
Country (estimated CAGR 2008-23),<br />
GDP in 2023 in US$ billion<br />
Source: Euromonitor, Tourism Statistics 2007, Ministry of Tourism– Government of India, <strong>Technopak</strong> analysis<br />
100<br />
80<br />
60<br />
40<br />
20<br />
0<br />
Distribution of Households Across<br />
Income Brackets<br />
1%<br />
3%<br />
1%<br />
1%<br />
5% 2%<br />
12%<br />
23%<br />
44%<br />
49%<br />
2005<br />
43%<br />
30%<br />
34%<br />
33%<br />
18%<br />
2015 2025<br />
Globals (>208)<br />
Strivers (104-208)<br />
Seekers (42-104)<br />
Aspirers (19-42)<br />
Deprived (
perspective<br />
a quar terly repor t <strong>by</strong><br />
Volume 02 / 2009<br />
| Volume 02<br />
The tourism industry has been supported <strong>by</strong> the advent of Low-Cost Carriers (LCC) in the airline space.<br />
These low-cost carriers have brought down the cost of travel and boosted the growth of domestic air travel<br />
immensely. The advent of low-cost airlines which cut down on expensive customary in-flight passenger<br />
services has opened-up air travel for the middle class.<br />
Exhibit 6 clearly indicates the increasing share of LCC from 33% to 47% between 2006 and 2008.<br />
The advent of LCC has spurred domestic air travel to grow from 11 Mn travelers to close to 36 Mn travelers<br />
in the last decade.<br />
Operational airports in the country have gone up from close to 40 airports in 2004 to 81 airports at present.<br />
Exhibit 6 Exhibit 7<br />
Share in %<br />
80<br />
70<br />
60<br />
50<br />
40<br />
30<br />
20<br />
10<br />
0<br />
Share of LCCs in Airlines<br />
2006 Q1 2006 Q2 2006 Q3 2006 Q4 2007 Q1 2007 Q2 2007 Q3 2007 Q4 2008 Q1<br />
FSC: Full Service Carriers<br />
The airports of several metros are undergoing renovation and re-positioning.<br />
Airline tickets, tour packages are all set to go cheaper with the 2% reduction in service tax.<br />
State-run oil companies have slashed Aviation Turbine Fuel (ATF) prices <strong>by</strong> 7%, the 11th reduction since<br />
Sep last year.<br />
The government is drawing up a whopping bailout package - to the tune of US$ 1 Bn for Air India. The<br />
salient features of this package would be to cut airport charges for a limited period <strong>by</strong> 50 %, to remove<br />
the 8% excise duty on ATF and to reduce the charges which the airport operator charges from the oil<br />
companies, leading to enhanced performance.<br />
With the Airports Authority of India (AAI) installing systems like Standard Instrument Departure (SID) and<br />
Star Terminal Arrival Routes (STAR) for the first time in India at the Mumbai airport, air travel within the<br />
country is likely to become faster and more convenient. In addition, the new installation is expected to help<br />
airlines save on fuel.<br />
Government Recognizing Tourism as a<br />
Top Priority<br />
Till 2002, Indian tourism was promoted through delegates at the Indian tourist offices located globally.<br />
These promotional campaigns were not very effective as their approach was unorganized, varied, and<br />
limited <strong>by</strong> the skills and capabilities of the delegates. Realizing the need for a consistent approach, the<br />
Tourism Department of India appointed Ogilvy & Mather (O&M), Delhi, to develop a print campaign and<br />
59 | Indian Tourism : Managing Growth <strong>by</strong> Breaking Barriers<br />
53%<br />
47%<br />
LCC: Low Cost Carriers<br />
Source: Directorate General of Civil Aviation<br />
Air Travellers ( Mn)<br />
50<br />
40<br />
30<br />
20<br />
10<br />
0<br />
Air Travel in India<br />
1996-97 1997-98 1998-99 1999-00 2000-01 2001-02 2002-03 2003-04 2004-05 2005-06<br />
International Domestic Total<br />
43.35<br />
35.79<br />
7.56<br />
Source: Directorate General of Civil Aviation
perspective<br />
a quar terly repor t <strong>by</strong><br />
Enterprise Nexus, Mumbai, to create a television commercial.<br />
In September 2002, the tourism department unveiled a new campaign called ‘Incredible India’ to promote<br />
Indian tourism globally. The first phase of the campaign, for a period of three months, was jointly funded<br />
<strong>by</strong> the Government of India and Experience India Society, an association of travel agents in India. The<br />
campaign that focused on the himalayas, wildlife, yoga, and ayurveda, was widely promoted in the print<br />
media, television, and the internet. The television campaign was telecasted on CNN, BBC, and other<br />
popular channels across the world.<br />
The government has identified 37 destinations for tourism development and over the last two years, over<br />
600 projects in 300 tourist destinations have been developed with an investment of US$ 20 Mn. Central<br />
financial assistance of US$ 1 Mn and US$ 2 Mn has been raised to US$ 5 Mn and US$ 10 Mn respectively<br />
for major destinations depending on tourist traffic.<br />
Through many innovative branding exercises, the government has been trying to promote tourism and<br />
build awareness about India as a tourist destination – both in the domestic market and abroad. International<br />
events such as Commonwealth Games in 2010 are also expected to increase arrivals in India. It is expected<br />
that the inbound traffic is set to double to 10 Mn visitors in the wake of the Commonwealth Games in<br />
2010.<br />
To motivate travel agents to promote India and to familiarize them with new tourism products, the Ministry<br />
of Tourism would provide financial assistance for participation in travel marts or annual conventions.<br />
Through the India Tourism Initiative, the government plans to lease out heritage monuments which would<br />
attract tourists from all across the globe.<br />
The government has introduced a Capital Subsidy Program for budget hotels, a 5 year income tax holiday<br />
for 2 to 4 star hotels and an exemption of fringe benefit tax for guest house facilities. Development of the<br />
‘Home Stay’ concept and small capital subsidy for the development of budget hotels to encourage travel<br />
stay options are being made popular.<br />
In the 9th Five Year Plan, assistance has been provided for the construction of budget accommodation,<br />
tourist complexes, wayside amenities, tourist reception centers, adventure & sports facilities, sound &<br />
light shows, illumination and refurbishment of monuments. These schemes have been merged into two<br />
schemes in the 10th Five Year Plan– integrated development of tourist circuits and product/infrastructure<br />
and destination development.<br />
The central government has introduced a scheme for assisting large revenue generating projects: Projects<br />
like tourist trains, cruise vessels, cruise terminals, convention centers, golf courses etc. would qualify for<br />
assistance. While considering projects for grant-in-aid under this scheme, priority will be given to projects<br />
promoted <strong>by</strong> private sector and the projects with public private partnership (PPP).<br />
A scheme of capacity building for service providers has been introduced and under this scheme the<br />
institutions are conducting training at the Institutes of Hotel Management (IHMs) for the faculty and<br />
students.<br />
Uttarakhand State Government has announced 100% tax exemption for a period of 3 years to multiplex<br />
projects in the state and for 5 years to all new amusement parks and ropeways. Similarly, Rajasthan<br />
Government has reduced luxury tax from 10% to 8% for all hotels. Other states like Kerala, Gujarat, Madhya<br />
Pradesh and Orissa are promoting themselves through the introduction of destination promotion coupled<br />
with PPP.<br />
The government is investing heavily on the infrastructure in the country. In the 11th Five Year Plan,<br />
investment towards modernization of highways, development of civil aviation, irrigation systems, ports,<br />
railways, telecom and power will be to the tune of US$ 472 Bn. In addition to the above, investments to<br />
the tune of US$ 91 Bn have been planned in other infrastructure sectors like tourism infrastructure, urban<br />
Volume 02 / 2009<br />
| Volume 02<br />
Indian Tourism : Managing Growth <strong>by</strong> Breaking Barriers |<br />
60
perspective<br />
a quar terly repor t <strong>by</strong><br />
Volume 02 / 2009<br />
| Volume 02<br />
infrastructure, rural infrastructure, SEZs, and water sanitation infrastructure, thus making a total of US$ 563<br />
Bn worth of infrastructure investments in the 11th Five Year Plan period . This investment in infrastructure<br />
will boost tourism potential over the next decade.<br />
<strong>Technopak</strong> conducted a survey to understand and identify the key recommendations to the government<br />
and the industry, where the key priority areas for domestic and international tourists were identified. The<br />
findings of the survey over the random sample are quite in line with some of the government initiatives<br />
being taken.<br />
As per the suvery, the following were the responses towards the most important motivator for visiting a<br />
tourist destination:<br />
•For<br />
59% of the respondents, it is the infrastructure (roads, public utilities, bus stand, taxi services, railway<br />
stations and airports)<br />
•For<br />
40% of the respondents, it is the overall hygiene conditions at a location<br />
•For<br />
31% of the respondents, it is the availability of information, booking and services (guides, tourist<br />
information)<br />
•For<br />
29% of the respondents, it is the easy connectivity to the city (frequency of flights/trains/buses)<br />
•For<br />
28% of the respondents, it is the hotel stay (room availability, budget category hotels and quality)<br />
When interviewed, most Indian travelers mentioned the infrastructure within the city and overall hygiene as<br />
the biggest need gaps for tourism within India.<br />
Niche Tourism Products<br />
The growing concern worldwide over global warming and climate change combined with rising oil prices,<br />
the energy crisis and the economic slowdown has led to dramatic changes in consumer attitudes, travel<br />
seasonality and other travel patterns and trends. It is influencing individual choices regarding travel<br />
destinations, the length of trips and other factors such as the availability of environment-friendly modes of<br />
transport and environmentally-responsible service providers.<br />
World travellers are also increasingly looking for quality products and experiences that offer value for<br />
money, especially environment-friendly travel and tourism related products and services as well as those<br />
that enable them to take part in local community activities.<br />
The Ministry of Tourism recognizes the significance of these shifts in lifestyle preferences and travel trends.<br />
By keeping pace with the latest trends in global travel, this strengthens India’s global image as a dynamic<br />
and relevant ‘brand.’<br />
Initiatives at State-level with Involvement of Locals:<br />
States are taking initiatives in teaming with locals to provide a flavor of their culture and traditions. Some of<br />
the key initiatives are mentioned below:<br />
Himachal Pradesh: The Himachal Government has introduced a scheme - ‘Himachal Pradesh Home<br />
Stay Scheme 2008’ under which tourists are given the opportunity see the rural areas of Himachal and<br />
enjoy their stay in comfortable home-stay accommodations.<br />
Gujarat: Through the ‘Vibrant Gujarat’ programme, the Gujarat Government plans to actively market the<br />
tourism sector. With a 1,650-km coastline, the state has plans of developing beaches in regions like Kutch<br />
and Mandvi.<br />
Madhya Pradesh: The Government of Madhya Pradesh is keen to initiate the development of an artificial<br />
beach in the state. The concept is based on ‘Ocean Dome’ artificial beach in Japan. The total investment<br />
for the project is estimated around US$ 440 Mn.<br />
61 | Indian Tourism : Managing Growth <strong>by</strong> Breaking Barriers
perspective<br />
a quar terly repor t <strong>by</strong><br />
Kerala: Kerala has introduced innovative tourism initiatives. Two of its villages, Aranmula and Kumbalangi,<br />
are being promoted as tourist destinations in a big way as part of the ‘Endogenous Tourism Project’ of<br />
the United Nations Development Programme and Government of India. Another concept called ‘Home<br />
Stays’, plans to promote rural tourism. The ‘Dream Season’, is another scheme wherein the Kerala Tourism<br />
Development Corporation has coordinated with most hotels to offer economical packages. Besides this,<br />
the Kerala Travel Mart which is a bi-annual event showcasing the best of Kerala is the only tourism mart in<br />
the subcontinent that brings together the business fraternity and entrepreneurs behind the tourism products<br />
and services of the state.<br />
Rajasthan: Rajasthan has a developed tourism infrastructure, with close to 6,000 hotel rooms spread over<br />
more than 150 hotels. Of these, over 1,400 rooms (54 hotels) belong to the heritage category. Tourism<br />
Department has estimated that investment of over US$ 600 Mn is required in the tourism industry in<br />
Rajasthan over the next 10 years. It is estimated that the private sector’s share of investment can be up to<br />
US$ 200 Mn.<br />
Andhra Pradesh: Andhra Pradesh has about 18 projects lined up under various categories such as temple<br />
circuit development, eco-tourism projects, adventure tourism and rural tourism projects with a significant<br />
investment <strong>by</strong> the central and state government. The tourism department is developing the temple circuit<br />
of Tirupati and surrounding regions with an investment of US$ 9.5 Mn.<br />
The Ministry of Tourism is also officially promoting the following tourism circuits and looking forward to<br />
develop more with the private sector. Exhibit 8 represents key tourist circuits in India.<br />
Exhibit 8<br />
The Golden Triangle<br />
Delhi, Agra & Jaipur<br />
The Great Pilgrimage<br />
Prayag, Varanasi, Puri & Konark<br />
Religion in Stone<br />
Belur, Halebid, Mysore & Hassan<br />
The Desert Adventure<br />
Jodhpur, Jaisalmer, Bikaner &<br />
Barmer<br />
The Beaches of India<br />
Goa, Diu, Kovalam,<br />
Mamallapuram & Gapalpuron-Sea<br />
Backwater of Kerala<br />
Alappuzha & Kumarakam<br />
Tourist Circuits in India<br />
The North East<br />
Gangtok, Guwahati, Shillong<br />
& Kohima<br />
The Heart of Heritage<br />
Gwalior, Shivpuri, orchha &<br />
Khajurahio<br />
Adventure Sports<br />
Srinagar, Manali, Kulu, Thar<br />
Desert, Sariska, Mount Abu,<br />
Pune, Gangtok, Darjeeling,<br />
Shillong & Ooty<br />
Island Holidays Andaman,<br />
Nicobar & Lakshadweep<br />
All forms of tourism coupled with their respective circuits are divided into the following niche products of<br />
tourism.<br />
Culture, Heritage and Ethno- Tourism<br />
Chhattisgarh, amongst other states has identified and is developing ethnic villages. The private sector is<br />
also being encouraged for proper maintenance and professional site management of important heritage<br />
sites/monuments.<br />
Traditional festivals like Dusshera at Bastar, Madai at Dantewada and Narainpur are to be marketed for<br />
domestic and global exposure.<br />
The number of domestic tourists visiting heritage sites has increased from 19 Mn in 2005 to 21 Mn in 2007<br />
representing a growth of 5%.<br />
Volume 02 / 2009<br />
The Buddhist Circuit<br />
Sarnath, Kushinagar, Bodhgaya,<br />
Nalanda, Rajgir, Vaishali, Sanchi,<br />
Amaravati & Nagarjunakonda<br />
The Temple Trail<br />
Kanchipuram, Madurai,<br />
Tiruchirapalli, Kanniyakumari,<br />
Bhubaneswar, Puri & Konark<br />
The Lure of the Jungle<br />
Corbett, Kanha, bandhavgarh,<br />
Sariska, Rnathmbhor, Bharatpur,<br />
Periyar, Bandipur, Sasan Gir,<br />
Kaziranga & Manas<br />
| Volume 02<br />
Indian Tourism : Managing Growth <strong>by</strong> Breaking Barriers |<br />
62
perspective<br />
a quar terly repor t <strong>by</strong><br />
Volume 02 / 2009<br />
| Volume 02<br />
Adventure Tourism<br />
Adventure sports such as water sports, trekking, rock-climbing, para-sailing and bungee-jumping are<br />
popular with the younger travelers and working executives. The development of adventure tourism is a part<br />
of the policy for the diversification of tourism products in India.<br />
The government is providing incentives in states like Himachal Pradesh and Goa to invest in adventure<br />
gear to promote this form of tourism.<br />
Eco-Tourism<br />
India’s forests, national parks and wildlife sanctuaries are a major attraction for a whole lot of tourists from<br />
around the world. Each state today is taking several steps for their preservation. Natural attractions are<br />
being promoted with increased local participation. The mystique of aboriginal tribal ethno-medicine which<br />
can be found in Ayurveda is marketed in order to attract tourists.<br />
The cultural initiative titled ‘Utsavam’ won an award at Pacific Asia Travel Association 2008 for being<br />
instrumental in reviving the cultural heritage of Kerala as well as for the enrichment of the local community.<br />
Envisaged as an annual event, the objective of this initiative is to revitalize the unsung artistes who have<br />
dedicated themselves to perfecting their vocation.<br />
Avian Tourism<br />
Adding another dimension to the Kerala’s backwater and health tourism is the avian tourism to attract<br />
birdwatchers from all over the world.<br />
Medical Tourism & Spas<br />
India has originated as one of the most important hubs for medical tourism. Many people from the developed<br />
countries come to India for the rejuvenation promised <strong>by</strong> yoga and ayurvedic massage therapy as well<br />
as for high-end surgeries like cardiac <strong>by</strong>pass surgery or knee/hip replacement. Residents are equally<br />
patronizing alternative medicine therapies and undertaking travel to specialist facilities across the country.<br />
Highway Tourism<br />
Besides catalyzing diversification of tourist traffic and revenue from the urban centres, planned development<br />
of highway tourism opens opportunities for enhancing local employment and uplifting rural economy through<br />
local feeder enterprises, which will find scope to grow in the vicinity of such highway tourist complexes.<br />
Haryana serves as a great example for highway tourism<br />
The National Highway Development Program envisaged 4-6 laning of the existing high-density highway<br />
corridors linking the four mega-cities of Delhi, Mumbai, Chennai and Calcutta. It also aimed at the creation<br />
of north-south and east-west corridors.<br />
In addition, bonds floated <strong>by</strong> the National Highways Authority of India, which is charged with the execution<br />
of the project, have been exempted from capital gains.<br />
Rail Tourism<br />
The Indian Railways has introduced several new services to promote rail tourism - luxury tourist trains,<br />
exclusive steam & hill charters, tour packages, ‘Bharat Darshan’ – special tourist trains for the budget travel<br />
segment, budget hotels – near important railway stations all over India, car rentals and a special package<br />
for Buddhist passengers.<br />
The Indian Railway Catering and Tourism Corporation Limited, a public sector enterprise under the<br />
Government of India, introduces a range of new tourism products from luxury tourist trains to exclusive<br />
steam and hill charters, ‘Bharat Darshan’ trains and budget hotels near railway stations.<br />
The ‘Kalka Shimla Toy Train’ has about 7 coaches that can accommodate around 200 passengers in a<br />
single trip. The train acquires a moderate average speed of 25-30 km throughout its journey enabling its<br />
travelers to soak in the beauty of the picturesque valley.<br />
63 | Indian Tourism : Managing Growth <strong>by</strong> Breaking Barriers
perspective<br />
a quar terly repor t <strong>by</strong><br />
The Buddhist special package in its eight day trip covers Delhi, Gaya, Rajgir, Nalanda, Varanasi, Gorakhpur,<br />
Lumbini and Gonda.<br />
Caravan Tourism<br />
A new policy guideline to promote ‘Caravan Tourism’ in India and facilitate the infrastructure required for the<br />
same would be announced. Private players will be able to ply their vehicles on selected routes, and tourists<br />
can stay on board. There would be no need for hotels.<br />
Wellness Tourism<br />
A new policy guideline for promoting ‘Wellness Tourism’ in India would be announced. The policy would<br />
aim to leverage India’s potential in traditional systems of wellness and medicines like Ayurveda, Siddha<br />
and Yoga and to project India as a unique destination for spiritual healing. Wellness Tourism Road Shows<br />
would also be organized in overseas markets starting with Scandinavian countries in the first phase.<br />
Heliport Tourism<br />
With a view to promote tourism in hilly and remote areas, guidelines would be framed to provide central<br />
financial assistance to States and Union Territories for construction of helipads/heliports at selected<br />
destinations which have tourism potential but lack good connectivity.<br />
Opportunities for Investment<br />
Hotels<br />
India currently has around 115,000 hotel rooms spread across all the categories and is facing a shortfall of<br />
155,000 rooms. The hospitality sector is expected to see an estimated investment of US$ 12 Bn in the next<br />
2 years, and various new international hotel brands will break ground.<br />
Given the current growth, demand-supply gap and investment norms (100% FDI allowed), the country<br />
provides opportunities for International brands to enter India with a long term commitment.<br />
For the Commonwealth Games in 2010, the government is expected to provide 10,000 budget rooms as<br />
compared to the requirement for 40,000 to 50,000 of such rooms.<br />
A five-star hotel room requires and investment of US$ 125,000 to US$ 210,000 compared with only US$<br />
62,000 – US$ 83,000 for a 3 or 4-star hotel room. The further down budget hotels can have the hotel up and<br />
running on limited services platform with an investment of US$ 31,000 for a room. The gestation period for<br />
a 5-star property is 3 years or more, whereas a budget hotel can be up and running in well under 2 years.<br />
The land cost should ideally <strong>by</strong> 20% to 30% of the project cost, but the trend has seen this figure touching<br />
the new heights of 50% to 60% as well.<br />
Tour Operators<br />
The inbound MICE (meetings, incentives, conventions and events) segment is growing at 15% to 20%<br />
annually.<br />
The government is taking active measures to create world class convention facilities to attract large- scale<br />
meetings in India. Currently, India has only 0.3 % of the world’s MICE business and there is great potential<br />
in showcasing India as a business as well as a leisure locale. Tour operators with an increase in the number<br />
of tourists and destinations have more opportunities to promote places of interests within country.<br />
Volume 02 / 2009<br />
| Volume 02<br />
Indian Tourism : Managing Growth <strong>by</strong> Breaking Barriers |<br />
64
perspective<br />
a quar terly repor t <strong>by</strong><br />
Volume 02 / 2009<br />
| Volume 02<br />
Education and Employment<br />
The industry with current employment at the level of 140,000 and 53,000 graduates, will generate 235,000<br />
positions in the next 5 years. However, there would still remain a gap of 42,000 graduates and qualified<br />
personnel.<br />
There are only 25 IHM’s and there are approximately 180 institutions (150 colleges in the private sector)<br />
granting certificate/diploma/degree courses in specialized areas like Food & Beverage (F&B) Production,<br />
Food & Beverage (F&B) Service, Housekeeping etc.<br />
Opportunities for Foreign Tourism Bodies<br />
The number of Indians travelling abroad has increased sharply in the past 10 years and in 2008 reached a<br />
level of 11 Mn outbound travelers. This number is expected to grow to 29 Mn <strong>by</strong> 2018.<br />
Exhibit 9<br />
Number of Travellers (Mn)<br />
30<br />
25<br />
20<br />
15<br />
10<br />
5<br />
0<br />
From the above chart, we can see that the number<br />
of outbound tourists from India has been seeing a<br />
steady growth and has almost tripled from 4 Mn<br />
travelers in 1998 to 11 Mn travelers in 2008. This<br />
number is expected to further increase to 18 Mn in<br />
2013 and 29 Mn in 2018.<br />
West Asia and South East Asia are the most popular<br />
destinations for Indians travelling abroad. Together<br />
these 2 regions constitute almost 48% of the total<br />
outbound traffic from India.<br />
The phenomenally high number of Indians travelling<br />
to places in the West and South East Asian<br />
countries opens up a host of opportunities for the<br />
other countries in this vicinity to attract travelers<br />
and tourists.<br />
Some key takeaways for foreign tourism boards include the following:<br />
•Extensive<br />
destination marketing and promotions in conjunction with the Ministry of Tourism<br />
•Showcase<br />
destination to focus groups and participate in domestic travel fairs<br />
•Conduct<br />
a familiarization visit for the top outbound travel companies<br />
65 | Indian Tourism : Managing Growth <strong>by</strong> Breaking Barriers<br />
4<br />
5<br />
Number of Outbound Indian Travellers<br />
6<br />
7<br />
8<br />
1998 2003 2004 2005 2006 2007 2008 2013 2018<br />
Source – Ministry of Tourism<br />
Exhibit 10<br />
10<br />
11<br />
N. America, 9%<br />
E. Europe, 2%<br />
E. Asia, 16%<br />
C & S America, 0%<br />
Australia, 2%<br />
S. Asia, 7%<br />
18<br />
Share of Outbound Travellers, 2006-08<br />
Africa, 5%<br />
W. Europe, 12%<br />
29<br />
SE Asia, 28%<br />
W. Asia, 20%<br />
Source – Ministry of Tourism
•Offer<br />
incentives like visa on arrival or free transit visa<br />
perspective<br />
a quar terly repor t <strong>by</strong><br />
•Organize<br />
culinary fairs in collaboration with the top 5-star hotels in the country in order to showcase<br />
culinary styles across cultures<br />
Looking Forward Together<br />
Each day, the tourism industry meets the aspirations of millions of people who want to travel to share<br />
experiences, to encounter different cultures. It has grown in response to increasing demand and it has<br />
been at the forefront of innovation, adapting its services and harnessing the best new technologies to<br />
deliver consistent quality and value for money.<br />
The results are evident in more jobs and greater prosperity, enhanced customer choice and experience,<br />
and widened understanding around the world. The tourism industry is uniquely well placed to play a crucial<br />
role in how the world meets new challenges of this century.<br />
The prospect of solutions to today’s and tomorrow’s world problems is brought closer when enlightened<br />
governments and engaged local communities choose to work together with the industry. The common<br />
determination to co-operate more closely has raised the possibilities for ensuring that growth is managed<br />
to stimulate economic activity around the world, that communities are respected, that the worlds resources<br />
are protected and the barriers of distance, inequality of opportunity or lack of imagination are overcome.<br />
The tourism industry is eager to harness its imagination and energy to this open ended challenge and it<br />
looks forward to sharing the common task with government and industry.<br />
Challenges Before the Industry<br />
The tourism industry in India is faced with certain challenges of regulatory as well as external nature. These<br />
are highlighted below.<br />
Regulatory Challenges<br />
•Complex<br />
Tax Structure: The hospitality industry faces multiple tax structures at the central and state level.<br />
This makes payment of taxes quite cumbersome.<br />
•High<br />
Taxes: The taxes charged are compounded <strong>by</strong> the luxury taxes which push up the average room<br />
cost.<br />
Volume 02 / 2009<br />
| Volume 02<br />
External Challenges<br />
•Economic<br />
Slowdown: The hospitality industry has been hit <strong>by</strong> the global economic meltdown. Foreign<br />
tourist arrivals have been badly hit and occupancy levels across the country have fallen.<br />
•Impact<br />
of Terrorism: The recent terrorist attacks in Mumbai have shaken the confidence of MNCs and<br />
business travelers. Many have been forced to re-consider their travel plans and subsequently, the winter<br />
season which implies brisk business for the hospitality industry has seen far lower occupancies.<br />
•Cost<br />
of Land: When compared to other markets across the globe, in India, the cost of the land constitutes<br />
a very large chunk, especially in case of large infrastructure projects. This delays the breakeven of these<br />
projects and discourages further investments.<br />
•Cost<br />
of Debt: The cost of debt in India is higher than the cost of debt in other countries. This again<br />
discourages further investments.<br />
•Skilled<br />
Manpower Shortage: The industry is facing a manpower shortage which pushes up the cost of<br />
acquiring quality talent.<br />
Indian Tourism : Managing Growth <strong>by</strong> Breaking Barriers |<br />
66
perspective<br />
a quar terly repor t <strong>by</strong><br />
Volume 02 / 2009<br />
| Volume 02<br />
Our Recommendations<br />
Recommendations for the Government<br />
•Take<br />
a close look at ways and means of improving the existing infrastructure and hygiene conditions at<br />
places of tourist interest and public places<br />
•Conduct<br />
a joint promotional campaign for various states in India and allocate budgets for marketing at<br />
international travel fairs to boost tourist inflow in the country<br />
•Play<br />
a significant role in rationalizing the cost of land auctioned for hotel development. This would assist<br />
the industry in creating value <strong>by</strong> adding substantial inventory of hotel rooms required to diminish the<br />
demand-supply gap<br />
•Assist<br />
in building and developing educational institutions to fulfill the emerging demand for skilled<br />
manpower in the tourism sector<br />
•Grant<br />
‘Infrastructure’ status to the hotel industry under SEC 80-IA of IT Act and increase depreciation on<br />
hotels from 10% to 20%<br />
•Rationalise<br />
Floor Space Index (FSI) /Floor Area Regulation (FAR). This would allow hotels to build<br />
more rooms on the same property eventually leading to more affordable room rates. Subsequently, the<br />
government can reduce development charges for adding more rooms in existing hotels<br />
•Further<br />
incentives will boost investments in the sector such as offering a tax holiday to the industry<br />
•Abolition<br />
of 12.5% service tax on tour packages<br />
•Implement<br />
uniform luxury tax code<br />
•Extend<br />
the 5 year tax holiday scheme which currently covers only 2, 3 and 4-star hotels and convention<br />
centers with a capacity greater than 3,000 to include 5-star hotels too<br />
Recommendations for the Industry<br />
•Promote<br />
Public Private Participation<br />
•Deliver<br />
on scheduled timelines and share accountability with the government on public private partnership<br />
projects to reduce the cost involved in development<br />
•Develop<br />
an academic think-tank to trigger off the right kind of training in hotel management institutes in<br />
India<br />
•Establish<br />
commendable Master’s and PhD programs in hospitality<br />
•Undertake<br />
measures towards employee retention<br />
•Coaching,<br />
development and training of employees for their long-term carrier development and retention<br />
process<br />
Authors<br />
Lokesh Kumar, Associate Vice President I lokesh.kumar@technopak.com<br />
Rahul Alex Daniel, Consultant I rahul.daniel@technopak.com<br />
Nikhil Saigal, Research Associate I nikhil.saigal@technopak.com<br />
Barbara Cebula, International Trainee I barbara.cebula@technopak.com<br />
67 | Indian Tourism : Managing Growth <strong>by</strong> Breaking Barriers
Forecasting<br />
the<br />
Financial<br />
Potential in<br />
Education<br />
Unique Dynamics and Growth<br />
Drivers of the Indian<br />
Education Sector 69<br />
Sizeable Investment Needed<br />
to Create Additional Capacity 69<br />
Cost per Seat Estimations<br />
in the Private Higher Education<br />
Segment 71<br />
Thumb Rules for Investments<br />
in Private Education 71<br />
New Developments in<br />
Regulation in Indian Education 72
perspective<br />
a quar terly repor t <strong>by</strong><br />
Volume 02 / 2009<br />
| Volume 02<br />
Unique Dynamics and Growth Drivers<br />
of the Indian Education Sector<br />
Education is the key to unlocking and building lasting value in a robust economy. For any country to grow<br />
and prosper, a well positioned educated young population is the fundamental requirement to meet the<br />
demands of an increasingly global economy and productive value creation. Over 50% of India’s Education<br />
sector is private (in the US, the private sector’s share is 32% and in China it is 25%) and in 2008 this stood<br />
at US$ 40 Bn. This is projected to grow to US$ 70 Bn <strong>by</strong> 2013 and US$ 115 Bn <strong>by</strong> 2018 (from a demand<br />
growth perspective, if supply keeps pace). We have a large demand-supply gap, and on average poor to<br />
middling quality. There is clearly an opportunity for more private players to enter the education space.<br />
Few unique drivers of the education sector in India are interesting to examine. Historically, education has<br />
been delivered in the country <strong>by</strong> the government or through “Non- profit” charitable trusts. The number of<br />
quality institutes imparting higher education are limited, inducing tremendous competition for the limited<br />
number of seats available in the IITs, IIMs and other quality institutions. Higher education in the private<br />
sector is not generally perceived as a quality alternative. The Indian mindset is culturally geared towards<br />
choosing limited study streams such as engineering, medicine and management. There is a need to link<br />
the employment needs in India to the enrollments in higher education, in order to create a pool of productive<br />
employable workforce.<br />
Exhibit 1<br />
More than 55 % of the Indian population will be under the age of 25 <strong>by</strong> 2010, This would<br />
Demographic Advantage<br />
lead to increased demand for quality higher education and a skilled workforce.<br />
High income households (income more than US$ 10,410) expected to increase from 5<br />
Increasing Affordability<br />
Mn to 14 Mn <strong>by</strong> 2018 resulting in higher affordability. This will propel awareness towards<br />
consumption of education as a priority and an essential tool for career growth.<br />
India, once considered an agrarian economy is now dominated <strong>by</strong> the services sector.<br />
The share of services has increased from 31% in 1991 to 55% in 2007. This increase<br />
Knowledge Led Economy<br />
in the services sector has led to a steady increase in the demand for an educated skilled<br />
workforce.<br />
A large young working population with a median age of 24 years, nuclear families in urban<br />
areas, along with emerging job opportunities in the services sector driven economy has<br />
Increased Participation of Women in the Workforce<br />
led to increase in working women in India. The population of working women is estimated<br />
to touch more than 25% <strong>by</strong> 2015.<br />
Technology Aided Delivery Increasing penetration of technology will aid virtual learning and education delivery.<br />
Globalization has led to the increase of newer employment avenues. Industries such as<br />
outsourcing (KPO, LPO), legal, retail, aviation, animation, healthcare, supply chain &<br />
New Employment Avenues<br />
logistics, have increased employment opportunities, and the demand for highly skilled<br />
manpower<br />
Sizeable Investment Needed to Create<br />
Additional Capacity<br />
The financial potential in all segments of education in India is huge. The demand-supply scenario as per the<br />
current and projected enrollment ratios at the K-12, higher education and vocational education segments<br />
indicate the need for huge capacity creation. The investments required to build this capacity have been<br />
estimated below at very conservative assumptions.<br />
69 | Forecasting the Financial Potential in Education<br />
The Growth Drivers of the Indian Education Sector<br />
Source: <strong>Technopak</strong> analysis & industry <strong>report</strong>s
Currently, the total number of students enrolled<br />
in K-12 schools in the country is ~317 Mn, which<br />
comprises of 147 Mn in the age bracket of 6 -11<br />
years, 72 Mn in the age bracket of 11-14 years<br />
and 97 Mn in the age bracket of 14-18 years.<br />
The number of students eligible for enrollment is<br />
expected to grow to 328 Mn <strong>by</strong> 2013 and further to<br />
351 Mn <strong>by</strong> year 2018. Clearly, India will need to add<br />
at least 34 Mn additional seats in K-12 segment in<br />
the next ten years to cater to the education needs<br />
of its continuously growing population, as shown<br />
in Exhibit 2.<br />
The cost per additional seat, at a conservative<br />
estimate is~ US$ 2400 (cost of land included<br />
at ~US$ 1 Mn per acre ). This translates into a<br />
minimum investment requirement of US$ 80 Bn<br />
of investment over the next 10 years to establish<br />
these 34 Mn seats.<br />
The enrollment in higher education is currently at<br />
17 Mn at a Gross Enrollment Ratio (GER) of 13%.<br />
Enrollments are projected to grow at a CAGR of<br />
5.6%, reaching 22 Mn <strong>by</strong> the year 2013 and 29<br />
Mn <strong>by</strong> the year 2018.As per these estimates, 12<br />
Mn additional seats in the higher education would<br />
perspective<br />
a quar terly repor t <strong>by</strong><br />
need to be created <strong>by</strong> the year 2018 as shown in Exhibit 3. The cost per seat in a regular higher education<br />
institution is ~US$ 8300. Therefore, the total investment that India needs for creating the projected additional<br />
capacity in higher education alone would require an investment of ~US$ 100 Bn.<br />
The vocational education and training landscape of India is extremely underdeveloped. India currently<br />
has 5,500 industrial training institutes and 1,745 polytechnics as compared to 500,000 similar institutes in<br />
China. This infrastructure caters to only ~2.5 Mn people annually. There are 175 trade training programs<br />
in India compared to 1,500 in the USA. Clearly there is a pronounced skill gap in terms of both quality and<br />
quantity in the country.<br />
As estimated 85-90 Mn people with vocational skills would be required in various sectors between 2008-<br />
2013. According to industry sources, the split of people intake sector-wise over the next 5 years will be 44.8%<br />
from the services sector, 31.2% from agriculture<br />
and 12.6% from manufacturing.<br />
Cost per seat will vary significantly in this segment<br />
depending on the location, scale, positioning of<br />
training service and investment <strong>by</strong> private players<br />
vs. the government. Indicative costs per seat in the<br />
private sector are outlined for a few representative<br />
short term vocational streams as shown in<br />
Exhibit 4.<br />
Exhibit 2<br />
400<br />
300<br />
200<br />
100<br />
0<br />
Exhibit 3<br />
Parameters<br />
Total Current and Projected Growth in<br />
K-12 Enrollment (Mn)<br />
97<br />
72<br />
147<br />
2008<br />
97<br />
74<br />
158<br />
Health &<br />
Beauty<br />
100<br />
171<br />
2013 2018<br />
Counseling<br />
Volume 02 / 2009<br />
6-11<br />
11-14<br />
14-18<br />
Source: <strong>Technopak</strong> analysis<br />
Exhibit 4<br />
Cost per Seat Estimation in Few Vocational<br />
Streams of Education<br />
English<br />
Speaking<br />
No. of Students 1380 560 1180<br />
Capex- 1 Centre (US$) 195,800 133,333 100,000<br />
Cost Per Seat (US$) * 145 240 84<br />
80<br />
Total Current and Projected Growth in<br />
Higher Education Enrollment (Mn)<br />
GER<br />
13%<br />
17<br />
GER<br />
17%<br />
22<br />
2008 2013<br />
GER<br />
21%<br />
29<br />
Age Groups<br />
Enrollments<br />
in Higher Education<br />
2018<br />
Source: <strong>Technopak</strong> analysis<br />
Source: <strong>Technopak</strong> analysis<br />
| Volume 02<br />
Forecasting the Financial Potential in Education | 70
perspective<br />
a quar terly repor t <strong>by</strong><br />
Volume 02 / 2009<br />
| Volume 02<br />
Cost per Seat Estimations in the Private<br />
Higher Education Segment<br />
Cost per seat estimations in higher education would vary depending on the scale of the project and the<br />
cost of land. Enclosed are few parameters on which we have calculated that a medical seat would cost<br />
~ US$ 104,166 and a non-medical seat would cost ~US$ 14,580 to be created <strong>by</strong> a private player. The<br />
assumptions backing these estimates are outlined below. In these calculations we have assumed that<br />
100% students would be residing in the hostel and the cost per acre of land is ~ US$ 520,800.<br />
Exhibit 6<br />
Thumb Rules for Investments in Private<br />
Education<br />
It has become evident in the last decade or so that government alone cannot bear the cost of the education<br />
sector and this sector particularly lacks proper investments, which is a constraint in coping with growing<br />
market demand and global competition. To bridge the gap, the private sector has stepped in. Education<br />
as an investment sector is often viewed as safe <strong>by</strong> the investors. With the attractive rates of return and<br />
the growth potential, it is one of the hot favorite sectors for the private players and private equity funds in<br />
India.<br />
A few thumb rules for entrepreneurs and companies wanting to invest in education are listed below.<br />
‘Market’ Assessment<br />
A pragmatic assessment of the “catchment” in each segment of education is important, from the standpoint<br />
of achieving required student enrollment, before planning an investment. The catchment (travel time from<br />
institute) for a pre-school would be 30 minutes, for a K-12 day school would be 60 minutes, and for a<br />
residential school this would be 5 hours. Demand for a vocational training institute originates from within<br />
its city premises, with few students travelling across cities for enrollment. A university or a higher education<br />
institute would attract students from all parts of India (as well as South Asia, the Middle East and Africa), the<br />
catchment being dictated <strong>by</strong> the quality of education on offer and the reputation of the institute.<br />
Key Financials<br />
A regular day K-12 school, built over 2 acres of land with a capacity of 2,100 students, would require an<br />
investment of ~US$ 3.1 Mn, and so would an MBA Institute with a capacity of 240 students enrolled in a 2<br />
year course spread over 1.5 acres of land. An engineering college with a capacity of 1,600 students spread<br />
over 10 acres of land would require an investment of ~US$ 21 Mn. The project cost for setting up a private<br />
71 | Forecasting the Financial Potential in Education<br />
Cost Per Seat Estimations in Different Streams of Higher Education<br />
Engineering MBA MCA Architecture Medical<br />
Max No of Students Enrolled 1680 240 360 200 500<br />
Course Duration 4 2 3 5 5<br />
Capex (US$ Mn) 16-26 3-4 4-5 3-4 46-52<br />
Cost per Seat (US$) 12,500 14,580 12,500 18,750 104,166<br />
Cost Per Seat Excluding Land (US$) 9,380 11,460 9,790 13,542 66,666<br />
Area of Land 10 acres 1.4 acres 2acres 1.4 acres 25 acres<br />
Hostel Development Cost (US$) 4.6 Mn 750,000 1.1Mn 625,000 1.5 Mn<br />
Source: <strong>Technopak</strong> analysis
perspective<br />
a quar terly repor t <strong>by</strong><br />
Volume 02 / 2009<br />
| Volume 02<br />
university over 300 acres of land, with a capacity of 40,000 students is estimated at ~US$ 312 Mn. For the<br />
MBA and engineering institutes, the land value is assumed at ~US$ 520 Bn per acre and for the university<br />
at US$ ~291 Bn per acre. In these ventures, financial returns are attractive, with EBITDA levels of 30% plus<br />
and project IRRs ranging from 25% to 35% levels.<br />
Regulation<br />
Shortage of quality education institutions is a product of India’s tightly controlled regulatory structure.<br />
Education is regulated at both the central and state government levels. Higher education has several<br />
regulatory bodies, including AICTE and UGC, but there is no umbrella regulation for K-12 schools, nor a<br />
uniform law for schools. There are considerable entry barriers and regulations that need to be met, and a<br />
thorough understanding of these is advised.<br />
New Developments in Regulation<br />
in Indian Education<br />
Right to Education Bill Adopted <strong>by</strong> Parliament<br />
The Indian Parliament has adopted ‘The Right of Children to Free and Compulsory Education Bill, on 4th<br />
August 2009,’ which envisages free and compulsory education to children in the 6-14 years age group.<br />
As per this bill, every school will have to earmark at least 25% seats in class-1 for free and compulsory<br />
elementary education. The bill seeks to do away with the practice of schools taking capitation fees before<br />
admission and subjecting the child or parents to any screening procedure. The bill also seeks to ban private<br />
tuition <strong>by</strong> teachers and ensure that no child is subjected to physical punishment or mental harassment. It<br />
shall be the duty of every parent or guardian to admit the child to a neighbourhood school for elementary<br />
education and no child should be denied admission for lack of age proof. Seeking to carry out radical<br />
changes in the primary education pattern, the bill states that no child shall be required to pass any board<br />
examination till completion of elementary education.<br />
Stressing the need for a big boost to children’s education, HRD Minister Mr. Kapil Sibal said that out of<br />
every 100 children attending elementary school only 12 reached the graduation level; in Europe it was 50 to<br />
70 (students reaching college from the elementary level) and the global average is 27. The Centre wanted<br />
to increase India’s average to 15 <strong>by</strong> 2012 and to 30-35 <strong>by</strong> 2020, he said.<br />
Proposed Reforms in Higher Education<br />
The three-fold objective of expansion, inclusion and excellence has been adopted <strong>by</strong> the 11th Five Year<br />
Plan, to deal with multiple problems related to access, quality, curriculum and faculty shortage in higher<br />
education. The 11th Plan expects to deal with the problem of access to higher education through expansion.<br />
However, since access is only a part of the problem, simultaneous efforts have to be undertaken not only<br />
to improve the quality of all elements in higher education, but also to address the obvious demand-supply<br />
differences and establish national & international quality standards in all Higher Education Institutions(HEI).<br />
The proposed liberalization in higher education and allowing FDI in the sector, makes the issue of a single<br />
window regulatory body for HEIs even more imperative to facilitate quality expansion.<br />
Mr. Kapil Sibal has stated that the Ministry would reform the current regulatory structure and would push<br />
for a SEBI like regulatory body for the education sector, as well as campaign for FDI to be invested in<br />
education sector. In his words, “We need to create an authority like SEBI in the education sector, which<br />
actually deals with regulation and we need to have an independent credit rating agency that accredits at<br />
the entry point <strong>by</strong> giving a provisional certificate and when the institution is built, to give a final certificate so<br />
that the intake can take place and we need to get the government out of this and give it to an independent<br />
Forecasting the Financial Potential in Education | 72
perspective<br />
a quar terly repor t <strong>by</strong><br />
Volume 02 / 2009<br />
| Volume 02<br />
regulator. But all this needs a lot of work and a lot of consensus across the board and I think that once we<br />
do that, then anybody should be able to enter. I will give you an example. Except for the central government<br />
or the state government, nobody can set up a university and then you have the whole deemed university<br />
concept. Why should this happen? Anybody should be able to set up a university and he should be able to<br />
compete in a market for the quality of that degree and as long as you put a system in place it is very easy<br />
to work it out. Once you talk about expansion and inclusiveness, it means opening up the sector, bringing<br />
equity into the sector and not diluting quality.”<br />
Setting up of the National Commission for Higher Education<br />
It is been proposed to set up National Commission for Higher Education and Research, a constitutional<br />
body like Election Commission. The Prime Minister, Leader of Opposition and Chief Justice of India will<br />
select the chairman and the members. Regulatory bodies such as the University Grants Commission,<br />
All India Council of Technical Education and Medical Council of India will cease to exist. The thrust is to<br />
give full autonomy to universities which will function as self regulatory bodies and will be vested with all<br />
academic responsibilities. They will design the function and structure of programmes, including medical<br />
and engineering courses. The Commission will oversee the functioning of the universities and act as a<br />
facilitator for proper growth of higher education and research.<br />
Objectives of the National Commission for Higher Education and Research would include the following:<br />
•Be<br />
responsible for comprehensive, holistic evolution of higher education sector<br />
•Strategize<br />
and steer the expansion of higher education<br />
•Ensure<br />
autonomy of the universities and shield them from interference <strong>by</strong> external agencies<br />
•Acts<br />
as a catalyst and also as a conduit to encourage joint/cross-disciplinary programs between and<br />
amongst universities and institutes<br />
•Spearhead<br />
continuous reforms and renovation in the area of higher education<br />
•Establish<br />
robust global connectivity and make it globally competitive while creating our own world class<br />
standards<br />
•Promote<br />
greater engagement and enhance resources to state universities with an aim to bridge the divide<br />
between the state and central universities<br />
•Ensure<br />
good governance, transparency and quality in higher education<br />
•Connect<br />
with industry and other economic sectors to promote innovations<br />
•Devise<br />
mechanisms for social audit processes and public feedback on its performance and its<br />
achievements<br />
•Devise<br />
mechanisms for social audit processes and public feedback on its performance and<br />
achievements<br />
Emergence of 14 World Class Universities<br />
The Ministry of Human Resource Development has also announced the setting up of 14 world class<br />
universities, of which 9 are expected to be constituted under public private partnership, with an initial<br />
budget of US$ 208 Mn. The Government commits to provide funding for all infrastructure and resources<br />
including library, laboratory and electronic resources of world class standards on a continuing basis to<br />
enable knowledge growth and germination of new ideas. For this initiative, a research endowment fund of<br />
an adequate amount not less than US$48 Mn per university shall be provided <strong>by</strong> the government.<br />
The university shall also have the freedom to source funding from all other non-governmental sources<br />
subject to the board limitations such that funding shall not be from unverified or dubious sources or from<br />
sources with a biased outlook. These national universities shall be kept out of the purview of the regulatory<br />
73 | Forecasting the Financial Potential in Education
perspective<br />
a quar terly repor t <strong>by</strong><br />
oversight of the existing regulatory bodies in higher education in academic matters as well as regulations<br />
on maintenance of standards or minimum qualification requirements for appointment to academic posts.<br />
Considering the fact that quality education is the backbone for any robust economy, education is now top<br />
priority of the government. Though India currently has over 400 universities and more than 20,000 colleges,<br />
it is not sufficient to cater to the education needs of India. It has been proved from the examples of many<br />
developed countries that low levels of regulation have been a catalyst in creation of quality education. The<br />
stringent regulatory framework governing the Indian education system is limiting its growth. Hence, there<br />
is an inevitable and immediate need for the liberalization of the education system to bring in private sector<br />
investment and incentives for quality creation.<br />
Authors<br />
Raghav Gupta, President I raghav.gupta@technopak.com<br />
Stuti Mody, Associate Director I stuti.mody@technopak.com<br />
Kiran Walia, Consultant I kiran.walia@technopak.com<br />
Volume 02 / 2009<br />
| Volume 02<br />
Forecasting the Financial Potential in Education | 74
Social<br />
Media:<br />
An<br />
Emerging<br />
Medium for<br />
Business<br />
Growth<br />
Background 77<br />
Understanding the<br />
New Communication Platform 77<br />
Transforming the Business<br />
Landscape 78<br />
Planning for Social Media 81<br />
Key Success Factors 83<br />
Conclusion 83
perspective<br />
a quar terly repor t <strong>by</strong><br />
Volume 02 / 2009<br />
| Volume 02<br />
Background<br />
Social media or web 2.0 technologies is an evolution in the development of social connectivity and is the<br />
new buzzword amongst corporates today. From international friendships to regional conversations, the<br />
web is moving from a static collection of pages to a more social communications platform where word of<br />
mouth counts. Social media is allowing connections between people in a way that has never happened<br />
before. News is spreading faster, trends are gathering pace, and plethora of information is available – to<br />
all-on an unprecedented level. The key enablers to this phenomenon are:<br />
•SPEED-<br />
The ability to connect faster<br />
•COST-<br />
Ability to participate, create and generate content at very low cost<br />
•SCALE-<br />
Ability to reach to a large number of people<br />
Social media has become an integral part of the online world. Around 66% of the world’s internet population<br />
visits social networks and blogs and 1 out of every 11 minutes spent online is on a social networking site 1 .<br />
This has significant implications for corporates as the consumers to whom they market their brands and<br />
sell their products and services, are evolving with social media and the tools it offers.<br />
Understanding the<br />
New Communication Platform<br />
What is social media? It is a combination of channels, platforms, communities, content and tools that<br />
powers peer to peer communication or ‘word of mouth’. The social media landscape as shown in Exhibit 1<br />
broadly covers 6 categories depicting various levels of participation in social activities.<br />
Exhibit 1<br />
A study conducted <strong>by</strong> ‘Universal McCann 2 ’ on a sample of 17,000 internet users across 29 countries in<br />
March 2008 measured consumer usage, attitudes and interests in adopting social media platforms. As<br />
shown in Exhibit 2, it clearly indicates that a huge chunk of the world’s internet population uses social<br />
networking and blogging sites.<br />
Exhibit 2<br />
Social Networking<br />
Orkut, Facebook,<br />
MySpace, Hi5,<br />
LinkedIn<br />
Active internet<br />
users in 16-54<br />
years age group<br />
475 Mn<br />
Social Bookmarking<br />
Platforms<br />
Wikis, Digg,<br />
Yahoo! Answers<br />
Watch video<br />
clips online<br />
394 Mn<br />
Increasing Popularity<br />
Social network and blogging sites are now the 4 th most popular activity centres on internet as per one of<br />
the studies <strong>by</strong> Nielson. The increasing popularity of social networks and blogging sites can be understood<br />
with the following growth numbers :<br />
1. Nielsen Online<br />
2. This company has been monitoring numbers for the 3 years now<br />
77 | Social Media : An Emerging Medium for Business Growth<br />
Social Media Landscape<br />
Content Applications<br />
& Media<br />
YouTube, Slide,<br />
Flickr<br />
Tools: IM, Chat, e-mail, SMS, RSS<br />
Social Media 2008: Global Universe Estimates<br />
Read blogs<br />
346 MN<br />
Blogging Platforms Social Gaming<br />
Blogger, Blogspot,<br />
Twitter<br />
Joined a social<br />
network<br />
270 Mn<br />
Bloggers<br />
184 Mn<br />
Social Connectivity<br />
Tools<br />
World of Warcraft RSS Feeds, Live Chat<br />
Subscribe<br />
to RSS feed<br />
160 Mn<br />
Source : Universal McCann International
perspective<br />
a quar terly repor t <strong>by</strong><br />
•Twitter<br />
and LinkedIn observed a growth of 2,681% and 90% respectively in numbers between May’08-<br />
May’09<br />
•YouTube<br />
adds 25 Mn visitors a month on an average<br />
•Facebook<br />
is growing with an average of 5 Mn users every week<br />
Increase in Time Spent<br />
The rise of social media is not about how people can collaborate on wikis or join in social networks. All of<br />
these are just pieces of the story. The bigger point is that it has become a part and parcel of their daily lives.<br />
The time spent on social network and blogging sites is growing at over 3 times the rate of overall internet<br />
growth which increased <strong>by</strong> 18% between Dec’07 and Dec’08. In the same period, however, the amount of<br />
time spent on ‘Member Community’ sites rose <strong>by</strong> 63% and on Facebook <strong>by</strong> a massive 566%.<br />
The numbers indicate the shift from the offline to the digital world; where<strong>by</strong> social media has become a<br />
global phenomenon. The prevalence of networking sites is increasing with rising numbers of internet users<br />
as shown in Exhibit 3.<br />
Exhibit 3<br />
Internet Users 1.6 Bn users currently to grow to 2.2 Bn <strong>by</strong> 2013<br />
Social Media Users<br />
Facebook: 250 Mn<br />
MySpace : 127 Mn<br />
Twitter : 25 Mn<br />
LinkedIn: 45 Mn<br />
GLOBAL INDIA<br />
While the number of internet users is expected to reach 2.2 Bn <strong>by</strong> 2013, according to a study <strong>by</strong> Forrestor<br />
India is projected to have the 3 rd largest internet population growing at an average annual rate of 10%<br />
to 20% 3 . This surge in internet population will further push social media to newer heights in the Indian<br />
market.<br />
Transforming the Business Landscape<br />
The increase in penetration and usage of internet in developing countries has led to the emergence of a<br />
new trend - the growth of social media. Today, people are spending a significant part of their internet time<br />
on social networking/ blogging sites. They use social media to communicate with others, express, gather<br />
information and share their opinion and even rate products and services. Before buying a refrigerator, one<br />
first tends to find information on the product through the internet and understand what others are saying<br />
about a perticular brand. Peer opinion is considered more ‘genuine’ compared to what the marketer says;<br />
and purchases are made based on the testimony of other consumers.<br />
Not only this, the consumers are not mere ‘listeners’ any more. They are now engaging in a two-way<br />
communication with the brands, marketers and companies - creating a huge repository of brand related<br />
content. The balance of power is shifting towards the consumer with their voice becoming more powerful<br />
than marketers. J&J experienced the power of this media when it’s marketing campaign for the launch of<br />
‘Motrin’ brand (pain relief product) failed miserably; due to the public outrage of mothers on Twitter and<br />
Facebook – two very popular social media platforms.<br />
As a result of the ever increasing popularity of the medium, the nature of consumer-business relationship<br />
is getting redefined. It offers unparalleled access to unfiltered customer opinion and creates opportunities<br />
for businesses to leverage user-generated content in innovative ways. Many companies, especially in the<br />
developed economies (where the social media originated and became a phenomenon much before), have<br />
recognized the value of consumer generated content and built their presence on social media, where the<br />
3. Global Online Population Forecast<br />
A Snapshot of User Levels<br />
Volume 02 / 2009<br />
52 Mn users projected to grow to 80 Mn <strong>by</strong> 2010 & 100 Mn <strong>by</strong><br />
2012<br />
Orkut: 17.1 Mn<br />
Facebook: 4 Mn<br />
LinkedIn: 2 Mn<br />
| Volume 02<br />
Social Media : An Emerging Medium for Business Growth | 78
perspective<br />
a quar terly repor t <strong>by</strong><br />
Volume 02 / 2009<br />
| Volume 02<br />
consumer is more active and is spending more and more time. They have progressively adopted multiple<br />
platforms to reach their audience, converse with key influencers and target consumers to build brands,<br />
market their product and services, generate new leads and much more.<br />
A Shift in Marketing<br />
The ongoing bustle in the social media space has led marketers to re-align their marketing budgets favoring<br />
the new medium. According to Aberdeen Group, 63% of the best-in-class companies surveyed across the<br />
world plan to increase their social media marketing budgets in 2009, despite the weak economy. As per<br />
Forrester Research, in the US alone (where the share of social media spend is merely 3% currently), the<br />
social media spend is expected to increase from US$ 716 Mn in 2009 to US$ 3113 Mn in 2013.<br />
Quite in line with other countries like the US,<br />
advertising on internet has started gaining<br />
momentum in India, as shown in Exhibit 4. Although<br />
the current estimated spend in absolute terms is<br />
just US$ 146 Mn which is not even 1% of the total<br />
internet spend in US (US$ 25 Bn), it is expected<br />
to witness an exponential growth year on year due<br />
to sudden burst in the internet population 2009<br />
onwards.<br />
According to a survey <strong>by</strong> Web Chutney, one of the leading digital agencies in India, around 82% of the top<br />
500 marketers in India spend close to 5% of their total advertising budget online. About 26% of this online<br />
spend is targeted towards development and maintenance of brand specific web-sites and another 13%<br />
goes on newly launched or planned social media initiatives.<br />
The crux lies in the fact that the frenzy of this new phenomenon has pushed companies to explore various<br />
tools and techniques offered <strong>by</strong> social media to reach out to consumers and provide a more connected and<br />
meaningful experience. Corporates in India too are slowly waking up to the new media and its potential.<br />
Unleashing the Power of Social Media<br />
The increasing conduciveness of people to social networks has led to fast adoption of the medium <strong>by</strong><br />
companies. Marketers (e.g. Volkswagen) are getting on board the social media trend with their own<br />
networking sites for brand aficionados. These branded web-sites complement the other social media sites.<br />
Companies are creating a dialogue and engaging with the right targets, spreading the word around thus,<br />
creating a multiplier effect. Many have embraced social technologies to drive business results <strong>by</strong> making<br />
it an integral part of their market intelligence, strategic delivery, development cycle, customer support,<br />
marketing and sales. Exhibit 5 highlights key areas where companies have adopted social media.<br />
Exhibit 5<br />
79 | Social Media : An Emerging Medium for Business Growth<br />
Exhibit 4<br />
Year<br />
The Multiplier Effect - Usage across Business Areas<br />
Brand Awareness<br />
Customer Understanding<br />
Promotion of Social Causes<br />
Internet Advertising Spends in India<br />
Total Ad<br />
Spend<br />
(US$ Mn)<br />
Internet<br />
Ad Spend<br />
(US$ Mn)<br />
Product &<br />
Service Promotion<br />
Product Development<br />
Knowledge Sharing<br />
Internet Ad<br />
Growth %<br />
% Share<br />
of Total Ad<br />
Spend<br />
2007 4,013 52 - 1.3%<br />
2008 4,643 94 80% 2.0%<br />
2009 5,106 146 56% 2.9%<br />
2010 5,675 204 40% 3.6%<br />
Source: Lintas Media Group & Mint<br />
Customer Service<br />
Employee Engagement<br />
Brand Building
perspective<br />
a quar terly repor t <strong>by</strong><br />
Volume 02 / 2009<br />
| Volume 02<br />
One remarkable example of a ‘revolutionary’ in social media space is Dell. Social media is the core to<br />
the company’s marketing strategy with multiple groups on various social media sites to cater to different<br />
customer segments. These include:<br />
•Dell Forum: To interact, ask questions, and give suggestions about computer & electronics technology<br />
• StudioDell: An interactive helpdesk for consumers, SMEs & IT professionals<br />
• Direct2Dell: Dell’s official corporate blog to enable sharing of thoughts<br />
• Dell@DellOutlet: A twitter account that tweets out major discounts for Dell computers and products<br />
• Dell Ideastorm: A website <strong>by</strong> the company to post, vote for and see ideas becoming a reality<br />
Dell has used all these platforms not just to reach out to its existing and future customers but also to<br />
generate new product ideas and even revenue <strong>by</strong> achieving sales worth millions.<br />
HP has achieved remarkable success in branding its products <strong>by</strong> engaging the consumer - enabling<br />
people to express themselves in a creative manner. Apart from connecting with consumers, companies<br />
like IBM and Best Buy have taken social media to a different level. While IBM uses social media to foster<br />
collaboration with stakeholders as well as to connect with its employees across the globe, bridge the<br />
geographic boundaries and bring in transparency, Best Buy uses it to bring in a cultural shift in the<br />
organization, make staff more customer-oriented and foster innovation. Hyatt Hotels use social media<br />
(Twitter – the microblogging platform) to provide customer support through their online concierge service.<br />
Companies across variety of industries such as hospitality, travel and tourism, banking and financial services,<br />
life sciences, retail and consumer products, airlines, automobiles , fashion, education and many more are<br />
exploring social media to tap opportunities in market research, brand building , product promotion, product<br />
development, customer service, collaboration with stakeholders, employee engagement, and recruitment<br />
etc. Exhibit 6 highlights some successful cases where social media has been leveraged effectively for<br />
business benefits.<br />
Exhibit 6<br />
Successful Use of Social Media<br />
Area Company Activity Undertaken Impact<br />
Increasing Brand<br />
Awareness<br />
Adobe<br />
Product Promotion MTV India<br />
Product Development Dell<br />
Employee<br />
Engagement<br />
IBM<br />
Taking Social Media beyond Business Use<br />
Actively holding consumer interest through<br />
engagement ads on social networks – Set up of an<br />
Online Game<br />
Capitalizing on social media to keep the show buzz<br />
alive -Creation of an online and highly interactive<br />
model of the real game show<br />
Partnering with customers to contribute to, and<br />
integrated into, Dell’s product development<br />
Multiple in- house versions of web 2.0 with the<br />
intention of bringing employees, alumni, partners,<br />
vendors, and customers together<br />
• The game was played more than 14,000 times<br />
during the 1 month campaign<br />
• Rise in page view <strong>by</strong> over 48,000 a week<br />
• Over 40,000 fans on Facebook<br />
• 12,511 ideas contributed to community, with<br />
86,255 comments<br />
• 366 ideas implemented leading to launch of<br />
‘Latitute’ Laptop.<br />
• 60,000 blog users, 17,000 different blogs, 1 Mn<br />
page views per day on internal wikis<br />
• Launch of corporate social networking<br />
visualisation and analysis tools like ‘Atlas’<br />
The usage of social media has not been limited to just B2C or B2B areas. Rather, the emerging media has<br />
had far reaching effects on a multitude of other sectors like politics, social service, defense services etc.<br />
Many of us are not aware of the role that social media (besides the internet and mobile devices) played in<br />
building the brand ‘Obama’ and in turning the tide in Obama’s favor in the recent US presidential elections.<br />
An effective strategy was adopted to build the campaign leveraging on the strengths of the social media<br />
network. The campaign’s reach across social networking was enormous in scope, with a presence on<br />
Social Media : An Emerging Medium for Business Growth | 80
perspective<br />
a quar terly repor t <strong>by</strong><br />
Volume 02 / 2009<br />
| Volume 02<br />
every conceivable social network, from Twitter to Facebook, and MySpace to LinkedIn. Even virtual world<br />
SecondLife had a concerted effort from the campaign, with news updates piped in from major news sites<br />
throughout the campaign. The campaign had realized from the outset that <strong>by</strong> giving supporters all the<br />
tools, they could harness the power of volunteers willing to campaign online, as well as fundraise for their<br />
candidate.<br />
The response generated <strong>by</strong> the campaign was so huge that marketing gurus can use it as a case study<br />
while crafting marketing strategies for their own brands.<br />
Exhibit 7<br />
Twitter 291,000<br />
Followers<br />
The campaign helped build a political database of millions of supporters that grew organically and enabled<br />
Obama raise over US$ 600 Mn of campaign funds at a relatively low cost. The era of the socio-political<br />
campaign has begun!!! Going forward, we will certainly see a much stronger focus on social media from<br />
political candidates in other countries too.<br />
Besides politics, social media tools are being profitably used for promotion of social issues and bringing<br />
about a social change. These tools can help build awareness and increase the reach of actions towards<br />
social causes. WWF created history with its ‘Earth Hour’ campaign on social networking sites such as<br />
Facebook etc. The popularity of the campaign created a powerful social movement <strong>by</strong> reaching out to<br />
millions of community users and creating awareness about the importance of collective global action to<br />
combat global warming.<br />
One of the other successful social campaign ‘Charity: Water‘ has generated funds worth US$ 250,000 for<br />
55 water projects in Ethiopia, Uganda and India, through social media sites all in a matter of just 2 weeks.<br />
The Social Media Wave in India<br />
Having impacted the West, this wave of change has percolated to India as well and is fast gaining edge.<br />
Though it all started long back with the advent of<br />
corporate blogging, the use of social media is now<br />
gaining popularity in India. Leading companies are<br />
leapfrogging in the social media space with their<br />
own social networking sites and spreading multiple<br />
legs across various social media platforms. They<br />
are leveraging the medium for multiple purposes - to<br />
engage people, pacify customers, strengthen brands<br />
and even recruit prospective employees.<br />
Although Infosys, TCS, Rediff, HCL, Cleartrip, FritoLay and Naukri and Indian arms of MNCs like Microsoft,<br />
IBM, and Hindustan Unilever are few names that launched their social media presence with corporate<br />
blogging, it is the technology sector that has been far ahead in its adoption beyond blogging and is<br />
followed <strong>by</strong> travel companies, financial services firms and consumer product companies. Some of the<br />
leading examples of firms using social media are indicated in Exhibit 8.<br />
Planning for Social Media<br />
Looking at the impact of social media on business areas and benefits realised <strong>by</strong> the ‘revolutionaries’ in<br />
this space, many companies tend to just jump to the icing of the cake before having decided what is going<br />
to be baked. In other words, they just want to establish presence on social networks without much thought<br />
81 | Social Media : An Emerging Medium for Business Growth<br />
Obama – Success through Social Media<br />
MySpace Page<br />
1.26 Mn Friends<br />
Exhibit 8<br />
Facebook page<br />
32,000 active<br />
application users<br />
Seeking<br />
Feedback – Titan<br />
Brand<br />
Awareness<br />
Apollo Hospitals<br />
YouTube 100m+<br />
video view, 164K<br />
subscribers<br />
Indian Co’s on Social Media<br />
Hiring New<br />
Talent – E&Y<br />
Brand Promotion-<br />
Tata’s Nano<br />
Customer Support-<br />
Kingfisher Airlines,<br />
PVR Cinemas<br />
Brand Promotion-<br />
MTV India
perspective<br />
a quar terly repor t <strong>by</strong><br />
or planning. They go ahead saying ‘we should start a blog’ or ‘we should create a page on a social network’<br />
or ‘we should create a community’, which actually is the final step in social media planning.<br />
It is essential for a company to adopt a systematic<br />
approach towards social media – the mantra is<br />
- Listen, Understand and Engage. Even before<br />
embarking on a social media journey, it is important<br />
for companies to explore the medium and listen to<br />
the company or brand specific ‘conversations’ on<br />
the web - understand what consumers are thinking<br />
and saying about their brand. They should identify<br />
and segment the consumers as shown in social<br />
media influencer model in Exhibit 9.<br />
The key to success lies in focusing on ‘Influencers’, laying emphasis on identifying the characteristics of the<br />
right sort of anchor influencers for the brand and exploring innovative ways to find and engage them. These<br />
are the consumers that are most likely to influence others, create the multiplier effect and thus, spread the<br />
word about the company or brand.<br />
Companies should consider understanding the medium first, and then plan on its adoption with a social<br />
media strategy. A focused approach for companies to adopt social media is centered around the four key<br />
elements – the target, the objectives, the plan and the technology and involves the following key steps:<br />
Volume 02 / 2009<br />
| Volume 02<br />
• Identify the Target Consumer: Examine the ‘socio-technographic’ profile of target customers.<br />
• Set Objectives: Decide what the company wants to accomplish with social media and how the results<br />
would be measured.<br />
• Make a Plan: Plan for how relationships with customers will change and build a strategy around changing<br />
relationship with customers.<br />
• Adopt Technology: Pick the appropriate platforms, tools and technologies to implement.<br />
As companies mature in the social media space, the value generated <strong>by</strong> their social media initiatives also<br />
improves. As shown in Exhibit 10, the impact and value generated clearly depends on the objective of the<br />
social media initiative and the level of customer involvement.<br />
Exhibit 10<br />
Type of Social Media Initative<br />
Customer Involment<br />
Impact<br />
Value Generated<br />
Customer Reach<br />
Low<br />
Establishing Presence<br />
Consideration<br />
Companies face many challenges such as technical complexity, management resistance, lack of budget,<br />
inability to measure ROI and lack of knowledgeable staff in utilising the social media to its fullest potential.<br />
However, the factors that play a great role in determining the success or failure of any social media initiative<br />
include the long term vision, focus, initiative and commitment.<br />
Exhibit 9<br />
Social Media Maturity Spectrum<br />
Maturity Index<br />
Customer Engagement<br />
Medium<br />
Building Connections<br />
Sales<br />
The Social Media Influencer Model<br />
Influencers<br />
Active Engagers<br />
Active Listeners<br />
Passive Listeners<br />
Customer Empowerment<br />
High<br />
Building Relationships<br />
Loyalty<br />
Social Media : An Emerging Medium for Business Growth | 82
perspective<br />
a quar terly repor t <strong>by</strong><br />
Volume 02 / 2009<br />
| Volume 02<br />
The leaders in social media space -Dell, IBM and J&J, all have met these challenges head on and learnt<br />
from their mistakes. These firms treat their customers as contributors and stakeholders in their business<br />
and reward, promote and empower them. They are far ahead in the social media maturity spectrum.<br />
Key Success Factors<br />
As ‘complex’ or ‘fickle’ as the social web may appear, there are, in fact, a handful of basic tenets that<br />
separate success from failure.<br />
•Listen,<br />
understand and engage with consumers. Engaging the right people is what makes businesses<br />
tick.<br />
•Success<br />
cannot be achieved <strong>by</strong> merely having a presence on a social media site, the key lies in constant<br />
engagement of customers.<br />
•Involve<br />
top management right from the beginning else with no visibility of serious returns in the initial a<br />
few weeks or months, the initiative would fall flat. Top management would ensure long term focus and<br />
commitment.<br />
•Social<br />
media can cause a huge stink, be prepared to handle the negative conversation and feedback.<br />
Companies should have a reputation management strategy in place.<br />
•Success<br />
and benefits will not appear overnight. Like Dell, companies need to have a long term focus on<br />
social media to reap the real benefits. Plan for a comprehensive presence on the web and evolve with<br />
social media over a long term.<br />
•Just<br />
being present on one or two social media platforms may not be enough. The phenomenon is evolving<br />
fast and the sites that are very popular today may not remain so in future. Therefore, captivate consumers<br />
<strong>by</strong> having multiple legs across the wide spectrum of social media channels.<br />
•Integrate<br />
the social media strategy with the company’s corporate strategy as well as its marketing strategy.<br />
Non-aligned strategies are bound to fail sooner or later.<br />
•Do<br />
not jump on measuring or quantifying the benefits or impact. Social media is a ‘journey’, a means/<br />
vehicle to reach the desired ‘end’. The success should be measured <strong>by</strong> the ability to reach, identify<br />
and convert influencers as well as the effectiveness of the ‘influencer’ to spread the word to the desired<br />
consumers.<br />
•Social<br />
media success is not measured <strong>by</strong> how broad one’s reach is, but <strong>by</strong> how deep one’s network is!<br />
Conclusion<br />
The social media is a new phenomenon that is often compared with the ‘internet revolution’ seeing its growth<br />
and scale. It has already touched our lives in many ways – from connecting with friends and colleagues,<br />
providing feedback on products and services, participating in events, to even experiencing the joy of<br />
farming on ‘Farmville’ while sitting in our homes and offices. A few years down the lane, we would even be<br />
buying products and services through social media.<br />
The medium is growing very fast and holds huge potential but is still in its nascent stage. Therefore, the<br />
time is ripe for companies to embrace the media, capitalize on the opportunity presented and become the<br />
‘revolutionaries’ of tomorrow. Those who engage all the stakeholders from employees to consumers to<br />
business partners would be the real winners!<br />
Authors<br />
Raghav Gupta, President I raghav.gupta@technopak.com<br />
Veenu Sharma, Senior Consultant I veenu.sharma@technopak.com<br />
Ashima Anand, Consultant I ashima.anand@technopak.com<br />
83 | Social Media : An Emerging Medium for Business Growth
Authors<br />
About <strong>Technopak</strong><br />
We are a management consulting firm with a difference. Founded in 1991 on the principle of “concept” to<br />
“commissioning”, we are in the top 5 consulting firms in India <strong>by</strong> revenues. We are strategic advisors to<br />
our clients during the ideation phase, implementation guides through start-up phase, and trusted advisors<br />
overall. The industries we serve include Retail, Consumer Products, Fashion (Textiles & Apparel),<br />
Healthcare, Hospitality & Tourism, Leisure & Entertainment, Food & Agriculture and Education.<br />
Our clients are leading Indian and international businesses, entrepreneurs, investment houses, multilateral<br />
development bodies and governments. Our 600+ clients include Aditya Birla Group, Apollo Hospitals,<br />
Arvind Limited, Asian Development Bank, Asian Paints, Temasek Holdings, Essar, GMR Group, Godrej<br />
Group, Gujarat Government, Hospital Corporation of America, ICICI Limited, Hindustan Unilever Limited,<br />
International Finance Corporation, Lenovo International, Mahindra Group, Marks & Spencer, Mother Dairy<br />
Foods, Ministries of Food Processing, Textiles & Commerce, Raymond, Reliance Industries, Samsung,<br />
Sequoia Capital, Starwood (Sheraton), Tata Group, United Nations Development Program, Walt Disney,<br />
Warburg Pincus and many other Indian and international leaders.<br />
Services we offer in Management Consulting<br />
At <strong>Technopak</strong>, we foster innovation and creativity which challenge conventional thinking and generate<br />
practical and far reaching solutions for our clients. In 2008, we worked with over 130 clients across 180+<br />
projects, in 20 countries besides India, across 5 continents.<br />
Our key services are:<br />
Business Strategy. Assistance in developing value creating strategies based on consumer insights,<br />
competition mapping, international benchmarking and client capabilities.<br />
Start-Up Assistance. Leveraging operations and industry expertise to ‘commission the concept’ on<br />
turnkey basis.<br />
Performance Enhancement. Operations, industry & management of change expertise to enhance the<br />
performance and value of client operations and businesses.<br />
Capital Advisory. Supporting business strategy and execution with comprehensive capital advisory in our<br />
industries of focus.<br />
Consumer Insights. Holistic consumer & shopper understanding applied to offer implementable business<br />
solutions.<br />
84
85<br />
Services we offer through our Group Companies<br />
Insights and innovation led product, packaging, space and strategic design, including design research,<br />
concepts, engineering and prototyping. A blend of unique, contemporary and relevant concepts and<br />
solutions.<br />
www.foleydesigns.com<br />
Holistic consumer understanding applied to offer implementable business solutions revolving around<br />
shopper insights, trend insights, design and innovation insights, marketing communication and measuring<br />
customer delight.<br />
www.indiamindscape.com<br />
Strategizing, planning and managing creation, development and growth of brands through a scientific,<br />
transparent and process-driven methodology.<br />
www.vertebrand.com<br />
Engineering<br />
Planning, implementation and project management of plants, warehouses and entertainment centers with a<br />
focus on modernization, process improvement, technical valuation, power & water audit and environmental<br />
engineering.<br />
www.technopak.com/engineering<br />
Services we offer through our Strategic Partnerships<br />
World’s largest privately held real estate services firm. We offer, through them, comprehensive retail real estate<br />
solutions to our clients.<br />
www.cushwake.com<br />
UK’s leading design consultancy for developing brand environments. We offer, through them, design solution<br />
for retail environments.<br />
www.dalziel-pow.co.uk<br />
Global research and consulting firm specializing in the study of human behavior in retail, service, home, and online<br />
environments. We offer consumer and shopper insights.<br />
www.envirosell.com<br />
DEVEREUX<br />
ARCHITECTS<br />
Partners with <strong>Technopak</strong> for delivering Projects in India. They are one of the top architectural practices in the UK<br />
with extensive experience in architectural and urban design projects in UK and internationally. The practice has<br />
major specialism’s in Healthcare Architecture<br />
www.devereuxarchitects.com
www.technopak.com<br />
Gurgaon<br />
4th Floor, Tower A, Building 8<br />
DLF Cyber City, Phase II,<br />
Gurgaon 122 002<br />
(National Capital Region of Delhi)<br />
T: +91-124-454 1111<br />
F: +91-124-454 1198<br />
Bangalore<br />
Prestige Solitaire, Ground Floor,<br />
6 Brunton Road, Off MG Road,<br />
Bangalore 560 025<br />
India<br />
T: +91-80-4034 8600<br />
F: +91-80-4034 8699<br />
Concept <strong>by</strong> <strong>Technopak</strong> Advisors Pvt. Ltd. ©<strong>Technopak</strong> Advisors Pvt. Ltd.<br />
<strong>Technopak</strong> Advisors Pvt. Ltd.<br />
Mumbai<br />
101-105, 2nd Floor, Sunjana Tower<br />
Sun Magnetica Service Road,<br />
Luis Wadi, Thane West,<br />
Mumbai 400 602<br />
T: +91-22-2583 2222<br />
F: +91-22-2583 8408