ESV.Eleventh.Int.Conf.SECTION.FOUR.Session.Six
ESV.Eleventh.Int.Conf.SECTION.FOUR.Session.Six
ESV.Eleventh.Int.Conf.SECTION.FOUR.Session.Six
- TAGS
- 129.10.155.92

You also want an ePaper? Increase the reach of your titles
YUMPU automatically turns print PDFs into web optimized ePapers that Google loves.
Technical <strong>Session</strong> <strong>Six</strong><br />
Heavy Duty Vehicle Safety<br />
Chairman; Dr. Lennart Strandberg, Sweden<br />
Large Truck Accident Exposure in the U.S.<br />
Hank Seiff,<br />
Motor Vehicle Manufacturers Association,<br />
United States<br />
Abstract<br />
In order to assess large truck safety, information is<br />
needed on vchicle exposure to accidents (travel) as<br />
well as on invo/vement in accidents. Since 1979, the<br />
University of Michigan Transportation Research Institute<br />
has collected detailed data on every fatal large<br />
truck accident in the U.S., about 5,000 cases a year.<br />
With the completion of the first comprehensive large<br />
truck exposure data survey, by UMTRI, we will be<br />
able to go beyond past analyses of large truck<br />
accidents. The National Truck Trip lnformation Survey<br />
(NTTIS) was initiated in late 1985. Data collection<br />
was completed in February 1987. For this survey the<br />
owners of over 4,000 large trucks were contacted tbur<br />
times over a twelve-month period (16,000 survey days)<br />
to obtain detailed information on the use of the truck<br />
on a randomly-selected survey date. The information<br />
collected includes the configuration, catgo, actual<br />
weight, and the route the truck followed. The combination<br />
of accident data with miles traveled from<br />
NTTIS will enable the calculation of fatal accident<br />
involvement rates by vehicle type, road class, etc.<br />
Background<br />
As the U.S. economy came out of the recession of<br />
1974 and '75, truck mileage increased. With the<br />
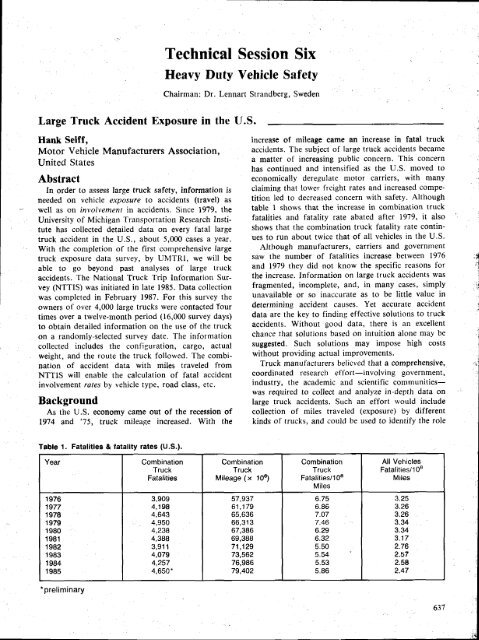
Table 1. Fatalitles & latality rates (u.S.).<br />
Year Combination<br />
Truck<br />
Fatalities<br />
1976<br />
1977<br />
1 978<br />
1979<br />
1980<br />
1 981<br />
1 98?<br />
1 983<br />
1 984<br />
1 985<br />
*preliminary<br />
3,909<br />
4,198<br />
4,643<br />
4,950<br />
4,238<br />
4,388<br />
3,911<br />
4,079<br />
4,257<br />
4,650.<br />
Combination<br />
Truck<br />
Mileage (x 108)<br />
57,937<br />
61,179<br />
65,636<br />
66,313<br />
67,386<br />
69,388<br />
71,129<br />
73,562<br />
76,986<br />
79,40?<br />
increase of mileage came an increase in fatal truck<br />
accidcnts. The subject of large truck accidents became<br />
a matter of increasing public concern. This concern<br />
has continued and intensified as the U.S. moved to<br />
economically deregulate motor carriers, with many<br />
claiming that lower frcight rates and increased competition<br />
led to decreased concerll with safety. Although<br />
table 1 shows that the increase in combination truck<br />
fatalities and fatality rate abated after 1979, it also<br />
shows that the combitration truck fatality rate continues<br />
to run about twice that of all vehicles in the U.S.<br />
Although manufacturers, carriers and governlnent<br />
saw the number of fatalities increase between 1976<br />
and 1979 they did not know the specific rcasons for<br />
the increase. Information on large truck accidents was<br />
fragmented, incomplete, and, in many cases, simply<br />
unavailable or so inaccurate as to be little value in<br />
determining accident causes. Yet accurate accident<br />
data are the key to finding effective solutions to truck<br />
accidents. Without goocl data, there is atr excellent<br />
chance that solutiolts based on intuition alone may be<br />
suggested. Such solutions may impose high costs<br />
without providing actual improvements.<br />
Truck manulacturers belicved that a comprehensive,<br />
coordinated research effort-involving government,<br />
industry, the academic and scientific communitieswas<br />
required to collect and attalyze in-depth data on<br />
large truck accidents. Such an effort would include<br />
collection of miles traveled (exposure) by different<br />
kinds of trucks, and could be used to identify the role<br />
Combination<br />
Truck<br />
Fatalities/108<br />
Miles<br />
6.75<br />
6.86<br />
7.07<br />
7.46<br />
6.29<br />
6.32<br />
5.50<br />
5.54<br />
5.53<br />
5.86<br />
All Vehicles<br />
Fatalities/108<br />
Miles<br />
3.25<br />
3_26<br />
3.26<br />
3.34<br />
3.34<br />
3.17<br />
2.76<br />
2.57<br />
2.58<br />
2.47<br />
;f<br />
'J
of vehicle designs, the effects of speed differentials,<br />
and other factors that had not been investigated in a<br />
systematic manner.<br />
The Motor Vehicle Manufacturers Association and<br />
the Westem Highway lnstitute took the initiative by<br />
sponsoring a comprehensive study of large truck<br />
accidents in 1979. The American Trucking Associations<br />
joined later. They spon$ored the University of<br />
Michigan Transportation Research Institute (UMTRI)<br />
in conducting this pioneering study and set the following<br />
goals:<br />
'<br />
r Determine the accident, injury and fatality<br />
rates (in terms of events per vehicle-rnile,<br />
ton-mile and/or cube-mile) lor a broad range<br />
of heavy trucks operating on U.S. highways.<br />
These should include at least comparisons<br />
among straight trucks, tractor-trailers, doubles,<br />
and triples; cabover vs. conventional<br />
designs; and, combinations of various<br />
lengths.<br />
r Determine the causes of accidents involving<br />
heavy trucks.<br />
r Achieve an understanding of the possible<br />
countermeasures which are likely to prevent<br />
or reduce the frequency of such accidents.<br />
The study is called "Acquisition/Analysis of Truck<br />
Accident and Exposure Inforrnation." Phase I (completed<br />
in 1979) assessed thc status of available data<br />
and determined what was needed to conduct a comprehensive<br />
analysis o[ medium and heavy truck accidents<br />
on a national scale. lt recognized the need for<br />
both accurate accident counts and mileage at comparable<br />
levels of detail if accident rflI€s were to be<br />
determined. lt pointed out the fallacy of comparisons<br />
which used simply "vehicle miles" but failed to<br />
recognize that, for example, a far greater percentage<br />
of truck miles than pa$senger car miles were accumulated<br />
on rural roads and at night. UMTRI concluded<br />
that "The availability and the nature of present<br />
. . . accident and exposure information . . . in much<br />
detail is rather limited." and outlined a program<br />
which would provide information to fill these gaps.<br />
Accident Data<br />
Phase Il of the UMTRI study evaluates all large<br />
(over 10,0fi) pounds gross vehicle weight rating) truck<br />
fatal accidents. lnitial information is taken from the<br />
National Highway Traffic Safety Administration's<br />
Fatal Accident Reporting System (FARS), and augmented<br />
with police reports and information from the<br />
Federal Highway Administration's detailed files on<br />
accidents in interstate commerce. When Federal Highway<br />
Administration accident reports are not available<br />
researchers go directly to vehicle owners, motor carriers,<br />
and drivers. This permits researchers to determine<br />
factors such as kind of road, weather, cargo, trip,<br />
638<br />
EXPERIMENTAL SAFETY VEHICLES<br />
weight, Iength, ownership, time of day and vehicle<br />
configuration. UMTRI publishes these analyses on an<br />
annual basis in the form of a factbook entitled<br />
"Trucks<br />
Involved in Fatal Accidents."<br />
These yearly factbooks, providing data on fatal<br />
accidents beginning in 1980, and special studies have<br />
already yielded insights, for cxample:<br />
Rollover is involved in almost 6090 of accrdents<br />
fatal to courbination vehicle drivers,<br />
ejection in 34V0. Extrication is involvecl in<br />
2290 (these are accidents in which the victim<br />
must be physically removed from the damaged<br />
vehicle; in some of these cases, the<br />
victim was crushed within the truck cab) and<br />
fire in 1690 (these figures do not add to<br />
10090 since more than one may be involved<br />
in a single fatal accident).<br />
The greatest number of fatal accidents take<br />
place on non-lnterstate rural roads (5490 of<br />
the total). Five-sixths of these are on twolane<br />
rural roads. Only 2590 of the fatal<br />
accidents take place on <strong>Int</strong>erstate Highways,<br />
both urban and rural, yet combination trucks<br />
operate 4390 of their miles on the <strong>Int</strong>erstates.<br />
A tractor-semitrailer is about three times as<br />
likely to have a fatal accident on a rural<br />
2-lane road as on an <strong>Int</strong>erstate. Because<br />
vehicles are traveling at high speeds in opposite<br />
directions on two-lane rural roads. accidents<br />
can be more frequent and more serious<br />
than on <strong>Int</strong>erstates or other divided multilane<br />
highways.<br />
Tractor-semitrailer combinations are involved<br />
in 72o/o of heavy truck fatal accidents, single<br />
unit vehicles in 2190, doubles or triples in<br />
390 and bobtailed tractors in 2Vo.<br />
Tractor-semitrailers have as many fatal accidents<br />
at dawn, dusk and night combined as<br />
they do in daylight.<br />
r Tank trailer combinations are about twice as<br />
prone to rollover as are van trailer combinations,<br />
r Rollovers are almost 5090 more likely in<br />
fatal accidents on dry than on wet pavements<br />
while jackknives are almost twice as likely on<br />
wet pavements.<br />
Data on all medium and heavy truck fatal accidents<br />
in the United States from 1980 through 1984 are now<br />
on the University of Michigitn's computer system<br />
undergoing analysis. Published data code books provide<br />
tabulations such as those illustrated in table 2<br />
below from "Trucks lnvolved in Fatal Accidents,<br />
1983":<br />
Data in the form shown provide basic information<br />
which can be analyzed to answer specific safety<br />
questions, for example the seriousness of the drunken
Table 2. Sample code book deta tabuletlone:<br />
"Trucks<br />
Involved ln Fatal Accldents, 1983"-<br />
variable ?07<br />
FREQ Prcnt<br />
4716 95.'l<br />
228 4.6<br />
0 0.0<br />
variable 2I0<br />
FREQ Prcnt,<br />
0 0.0<br />
132 2,7<br />
4477 90.5<br />
92 I.9<br />
r7 0,3<br />
19 0. 'l<br />
I 0.0<br />
2 0.0<br />
I 0.0<br />
203 4.r<br />
variable 1028<br />
FREQ Prcnt<br />
z62a 53.2<br />
2I95 44.4<br />
l2r 2.4<br />
DR,IVER DRINKIHG<br />
DRIVER DRINKING<br />
0. No drinking reported<br />
l. Drinking rePorLed<br />
9. UnknoHn<br />
LICENSE STATUS<br />
LICENSE STATUS<br />
0. None required<br />
l. Non6<br />
?, valid<br />
3, Suspended<br />
4. Revoked<br />
5. Expired<br />
6. Cancelled or denietl<br />
7. Learner's perrnrt<br />
8. Temporary<br />
9. unknovril<br />
CAB STYLE<br />
CAB STYLE<br />
<strong>SECTION</strong> 4. TECHNICAL SESSIONS<br />
I. conv6ntional<br />
2. Cabover or cab-forward<br />
9. Unknown<br />
driving problem among truck drivers, compared to the<br />
general driving population.<br />
In a study of truck crashworthiness now underway,<br />
UMTRI is examining the role of cab deformation in<br />
truck occupant fatalities and identifying specific ways<br />
in which occupants are injured in the cab. The<br />
discovery that 169o of truck occupant fatality accidents<br />
involved fire in somc way has led to in-depth<br />
investigations of accidents involving fire or fuel spillage<br />
to determine the role the truck fuel system plays<br />
in these accidents.<br />
It will be necessary to continue the accident data<br />
collection which has now been underway since 1980'<br />
so that both long ancl short term safety trends can be<br />
identified. This will also allow us to see the long term<br />
results of actions taken to improve the truck safety<br />
picture.<br />
Exposure<br />
Only a limited amount can be learned by studying<br />
fatal accidents alone. One needs to know something<br />
about accident frequency; how often do accidents of a<br />
certain type happcn in relation to vehicle miles travelerl;<br />
on what type of highways; and at what time of<br />
day or year. If accidents of a certain type are frequent<br />
there is a greater benefit to investigating them and<br />
finding a solution. And if a certain type of accident is<br />
found far more frequently on one type of road or<br />
during a particular time of day, a clue toward its<br />
cause may already exist'<br />
Phase Ill of UMTRI's overall study, called the<br />
National Truck Trip Information Survey (NTTIS) is<br />
providing information which allows accident frequency<br />
to be calculated. The truck trip survey provides<br />
information on truck population and exposure<br />
(miles travcled with detail comparable to that collected<br />
on fatal accidents).<br />
In the past students of truck accident exposure in<br />
the United States have gone to the Truck Inventory<br />
and Use Survey (TIUS), conducted every five years by<br />
the Bureau of the Census. Data for this survey are<br />
obtained by requiring a sampling of truck owners to<br />
fill out a form providing annual mileage and typical<br />
use of the vehicle. When the owner notes on the form<br />
that the truck is "typically" used in over-the-road<br />
service, other uses, such as mileage acsumulated in<br />
city dclivery, are not included.<br />
The NTTIS focuses on all mileage during a single<br />
day's use in order to get more accurate and detailed<br />
mileage data. The day's mileage is categorized according<br />
to road class (interstate, major artery, or other),<br />
rural versus urban, and day versus night' Urban areas<br />
are identified according to the FHWA definition. Two<br />
sizes of urban area are distinguished; areas with<br />
50,000 population or more' and areas with 5,000 to<br />
49,999 population. The NTTIS also categorizes milege<br />
by carrier operating authority, vehicle configuration<br />
(cab style, number of axles, trailer type and body)'<br />
length, cargo, cargo weight, and gross cornbination<br />
weight. This will provide information on truck use at<br />
a level of detail previously unavailable in the U'S.<br />
To provide a proper $ample of trucks for the<br />
survey, the University of Michigan worked with the<br />
R.L. Polk company, the only organization in the U'Swhich<br />
collects information on vehicle registrations<br />
ctirectly from the individual states. A stratified random<br />
sample of trucks registered as of July I' 1983'<br />
was chosen. The Bureau of the Census also uses R'L.<br />
Polk in setting up its sample for the Truck luventory<br />
and Use Survey. Based on both tunds available and a<br />
statistical evaluation of the level of data accuracy<br />
which might be expected a target sample size wa$<br />
chosen. Owners of 2,000 tractors and 2,000 straight<br />
trucks were telephoned four times within the last year,<br />
providing 16,000 survey-days of truck exposure information.<br />
Since the operation of double trailer combinations<br />
is of concern, but still relatively rare in the<br />
U.S. the states of California and Michigan, where the<br />
majority of current doubles operation can be found,<br />
wefe oversamPled.<br />
It is recognized that the National Truck Trip<br />
Information Survey will leave many qucstions unanswered.<br />
There is the obvious statistical error in a<br />
sample of the size being used. UMTRI has calculated<br />
that we can expect almost a 990 error in average<br />
annual mileage for a category of vehicles comprising<br />
639
640<br />
EXPERIMENTAL SAFETY VEHICLES<br />
one-fourth of our total, and a 20a/o error for a<br />
category comprising 590 of our total. For example<br />
since sales of low-bed trailers run about 590 of total<br />
Table 3. Estimates of the U.S. large truck (over 10,000<br />
lbs. GVWR) population*.<br />
trailer sales, we could expect to find a 200/o error in<br />
Sou!qq<br />
our calculation of their annual mileage.<br />
Truck type<br />
Beyond statistical error, the study is restricted to<br />
vehicles registered in 1983 while the survey of owners<br />
took place in 1985 and 1986. This was necessary<br />
Straight<br />
TractorE<br />
Truck<br />
2, 608, 100<br />
876,700<br />
2,068, {95<br />
886,643<br />
because good vehicle registration data runs that far<br />
TotaI<br />
3,505,00o ?,955.138<br />
behind the current year. So most 1984, 1985, and<br />
1986 model year vehicles are excluded from the<br />
rExcludlng Ala6ke, Hawaii and Oklahom!<br />
survey. Since later model vehicles are more likcly to<br />
be used for longer mileage, over-the-road operation,<br />
Table 4. Truck-trectors in use.<br />
and move to shorter mileage and local operation as<br />
they age, the survey should show lower annual mileages<br />
and a higher percentage of local and shorthaul<br />
in use I<br />
weekday<br />
49. rt<br />
I<br />
I<br />
t{eekend<br />
tO, Ar<br />
operation than is actually the case in the total U.S.<br />
fleet.<br />
not in uee I 50.9r | 89,?t<br />
Finally, and perhaps most importantly, as soon as<br />
the collected data is analyzed, many questions are sure<br />
Table 5. Stralght truck$ in use.<br />
to be found which these data do not answer. Already<br />
the questionnaire was modified to provide more<br />
information on rural versus urban operation of vehicles<br />
and the type of engines and fuel-saving equipment<br />
in use to answer questions raised by new U.S.<br />
ln use<br />
dot in us6<br />
I<br />
I<br />
weekday<br />
37,9r<br />
62. ft<br />
I<br />
I<br />
I<br />
Weekend<br />
B, lt<br />
rr. rt<br />
emission regulations. One must be reconciled to this<br />
sort of problem, knowing that good research ofterr<br />
asks more questions than could be expected when the<br />
project was begun.<br />
Although UMTRI has completed the clata collecrion<br />
phase of the National Truck Trip lnformation Survey,<br />
substantial time will be needed to complete the<br />
analysis of the data before it can begin to provide<br />
answers to many questions which will help us under,<br />
stand the nature of the U.S. truck fleet and pinpoint<br />
areas where safety improvements might be made.<br />
One of the earliest answers which ftas come from<br />
NTTIS is an accurate estimate of the actual population<br />
of large trucks (over 10,000 pounds gross vehicle<br />
The Future<br />
The combination of accident data with miles traveled<br />
from the NTTIS will enable the calculation of<br />
accident involvement rates by vehicle type, road class,<br />
etc. New and important insights into the causes, and<br />
hopefully, therefore the solutions to many large truck<br />
saf'ety problems, will be found. Yet it is easy to see<br />
there is much left to be completed. The various<br />
segments of the trucking industry, labor, insurance<br />
and government can all capitalize on the investment<br />
already made by providing sustained financial support<br />
for a comprehensive plan of action. Such a plan<br />
would include:<br />
weight rating) in the United States in the year 1982.<br />
Earlier population data, based on the 1977 TIUS and<br />
the Federal Highway Administration had been at<br />
variance*no one actually knew how many large<br />
trucks there were in the U.S.! Change$ were made in<br />
the TIUS calculation procedure between 1977 and<br />
I982 so there should be reasonable agreement between<br />
the NTTIS and TIUS numbers on nationwide truck<br />
population, since they came from surveys drawn from<br />
First The University of Michigan's fatal aoci.<br />
dent data collection program would be<br />
continued on an annual basis. lf it can<br />
be more closely allied with the Federal<br />
Highway Admini$ttation's accident reports<br />
and data collection than it is now.<br />
it can provide both the government and<br />
industry with information of better quality<br />
and completeness than it now has<br />
for analysis purposes.<br />
similar R.L. Polk samples. Table 3 shows the results.<br />
The NTTIS telephone survey has shown a relatively<br />
low proportion of trucks actually in use on any given<br />
day. This information must be tempered by remembering<br />
that the three latesr model year trucks (1984-<br />
86), those most likely to be in service more days and<br />
more miles, are not included in NTTIS as noted<br />
above. Survey data are shown in Tables 4 and S.<br />
Second The National Truck Trip Information<br />
Survey exposure study is collecting<br />
data for only one year. To meel future<br />
accident data needs, the survey should<br />
be continued on an annual basis.<br />
Again, such a program would supplement<br />
both governm6nt and industry<br />
knowledge and avoid duplication ol effort.
Third<br />
Fourth<br />
Fifth<br />
While the truck accident files created at<br />
the University of Michigan are the best<br />
available, they are limited to fatal accidents<br />
only. But fatal accidents represent<br />
just over one percent of all large<br />
truck accidents. The ovenvhelming majority<br />
of truck accident don't kill people,<br />
but they do injure people, damage property,<br />
snad traffic and sometimes, release<br />
hazardou$ materials. These accidents<br />
are probably as much responsible<br />
for the industry's poor safety reputation<br />
as are those in which people are killed.<br />
So it makes sense to collect and analyze<br />
data on the 99 percent of truck<br />
accidents that are non-fatal. Although<br />
NHTSA's National Accident Sampting<br />
System was originally conceived to provide<br />
this kind of data (for autos and<br />
trucks), it is being cut back substantially<br />
and will not provide the information<br />
needed on heavy truck safety.<br />
Analysis of the data already collected<br />
and of that which will be acouired in the<br />
future must be performed if the information<br />
is to be of use to decision-makers,<br />
safety officials, designers and operators.<br />
To date, very limited analyses<br />
have been made of these data. A great<br />
deal more can be done, because the<br />
information is now available, particularly<br />
for fatal truck accidents, in sufficient<br />
detail to isolate patterns of high frequency<br />
occurrences.<br />
The final element of the plan is the<br />
performance of special, in-depth, studies.<br />
One example of a special study<br />
which should be done concerns the<br />
accident experience of longer combination<br />
vehicles. The need for this study<br />
was pointed out in two Federal Highway<br />
Administration Studies of the benefits<br />
and problems of such vehicles.<br />
In-depth studies, such as those mentioned<br />
above on truck crashworthiness<br />
and fire and tuel spillage, can be used<br />
to pinpoint problems that are already<br />
identlfied, or those which show uo in<br />
accident studies.<br />
<strong>SECTION</strong> 4. TECHNICAL SESSIONS<br />
Having come this far, U.S. industry and government<br />
should now be prepared to takc the next $tep.<br />
The trucking industry is on the threshold of having a<br />
great resource at its disposal to help find solutions to<br />
truck accidents. But it will be wasted if we fail to<br />
continue to underwrite the costs necessary to continue<br />
collecting and analyzing accident data and making<br />
truck exposure surveys.<br />
It will take more than just one or two organizations<br />
to do the job. Government, insurance and academic<br />
interests should be involved in forming a coalition<br />
with manufacturers, suppliers, motor carriers, and<br />
other interested groups to provide sustained financing<br />
for this program.<br />
As I see it, the benefits are many. We shall have<br />
fact$ to counter growing criticism of the industry's<br />
safety record; the industry will have a solid basis for<br />
arguing for greater productivity in equipment and<br />
operations; and, it makes good sense to prepare now<br />
for truck safety issues that may become the subject of<br />
regulations in the future.<br />
Perhaps the greatest benefit-the one the public is<br />
most concerned about-is that we will finally have the<br />
information needcd to learn how to decrease the<br />
number of collisions between large trucks and passenger<br />
car$. That alone will make the whole effort<br />
worthwhile.
EXPERIMENTAL SAFETY VEHICLES<br />
Vehicle Factors in Accidents Involving Medium and Heavy Trucks<br />
Robert M. Clarke and<br />
William A. Leasure Jr.,<br />
National Highway Traffic Safety<br />
Administration,<br />
United States<br />
Abstract<br />
Among the many interrelated causes of truck accidents,<br />
vehicle-related topics play a critical, if sornewhat<br />
unrecognized and underreported role. ln many<br />
cases, these factors, if they do not directly cause an<br />
accident to occur, make it more difficult-or in some<br />
cases, impossible-for a driver to recover from an<br />
error or avoid an unforeseen conflict. Once a crash<br />
occurs, the way trucks are designed can affect the<br />
severity of the trauma sustained by the occupants of<br />
all the vehicles involved.<br />
This paper hiehlishts the fact that efforts to prevent<br />
truck accidents could be substantially aided by working<br />
to upgrade the performance of the truck brake<br />
sy$tems as well as truck handling and stability properties-especially<br />
as it relates to their tendency to<br />
rollover. Truck occupant crash protection could be<br />
enhanced by improving truck occupant restraint systems,<br />
providing a reasonable amount of protection<br />
from post-crash fires, making cab interiors free of<br />
sharp, hard objects that can cause injury during<br />
impact-especially steering wheel rims and hubs, and<br />
by improving cab designs to provide occupant survival<br />
space in a crash. Finally, an opportunity also existsby<br />
working on the designs of the front ends of trucks<br />
-to reduce the number of fatalities among occupants<br />
of other vehicles killed in collisions with medium and<br />
heavy trucks.<br />
<strong>Int</strong>roduction<br />
This paper summarizes two recently completed Congressional<br />
reports (Sections 216 and 217 of the Motor<br />
Carrier Safety Act ot 1984, P.L. 98-554, October 30,<br />
1984)tlll21 on the general topic of medium/heavy<br />
truck safety. The two reports focus primarily on<br />
vehicle-related issues that influence the safety performance<br />
of medium and heavy trucks. These include:<br />
braking, handling and stability, crashworthiness, and<br />
truck occupant crash protection.<br />
Each report identifies the key issues related to each<br />
of these topics, summarizes what is known aborrt<br />
each, describes what might be done in the near terrn<br />
to make improvements, and lays out research agendas<br />
for the remaining longer term issues.<br />
The reports were developed with the assistance and<br />
participation of the complete range of interests associ-<br />
*Bracketed numbers indicate references given at the end of the papet.<br />
642<br />
ated with trucking, including: truck and trailer manufacturers;<br />
truck operators; driver groups; state, federal<br />
and foreign government research and regulatory<br />
organizations; representatives from the vehicle inspection<br />
ancl traffic law enforcement community; and,<br />
representatives of safety advocacy organizations. The<br />
Society of Automotive Engineers sponsored, in cooperation<br />
with the National Highway Traffic Safety<br />
Administration, a public symposium at which draft<br />
versions of the reports and the research plans were<br />
discussed and critiqued by all these interests' Consensu$<br />
was reached that the reports had identified the key<br />
vehicle-related safety issues facing the trucking industry<br />
and that the research proposals contained in the<br />
reports reflect the best way of addressing those issues.<br />
Priorities for addressing these subject areas should<br />
be dictated by the size of the accident problem<br />
affected by each and the availability of achievable<br />
solutions. For this reason, efforts to improve truck<br />
brake systems should receive the highest priority since<br />
improvements achieved there are likely to be significant.<br />
Regardless of efforts to prioritize these topics,<br />
each plan represents a technically sound, consensus<br />
approach as to how each of the topics could be<br />
pursued, given that priorities and resources are allocated<br />
to that subject.<br />
The plans that are presented are not an exclusive<br />
agenda for government. Rather, it is hoped that they<br />
will serve as a blueprint that government and industry<br />
can use to address the topics discussed.<br />
U.S. Medium and Heavy Truck<br />
Accident Patterns*<br />
Heavy truck accident$ are complex, often lethal<br />
events that have many interrelated underlying causes.<br />
They include factors related to driver performance/behavior,<br />
vehicle pcrformance capability and condition,<br />
operating environment, and the amount and quality<br />
of safety management exercised by the motor carrier<br />
responsible for the driver and vehicle. Accidents occur<br />
when the "margin of safety" is reduced because the<br />
performance of one or more of these factors is low<br />
and compensation by the driver and,/or the vehicle<br />
cannot be or is not made. A balanced heavy truck<br />
safety improvement program, if it is to be effective,<br />
needs to be cognizant of the relationships among all<br />
these factors and must incorporate elements that<br />
simultaneously address all of them in some reasonable<br />
fashion.<br />
*lJnlcss otherwise noted, the accident statistics cited throughout this paper<br />
uere derived from: NHTSATS Fatal Accident Reporting System (FARS) and<br />
the National Accident Sampling Systcfi (NASS) for 1984, and tiom the<br />
States of Wa$hiilgl.on and Texas tbr l98l-1983.
<strong>SECTION</strong> 4. TECHNICAL SESSIONS<br />
Viewed comparatively, medium and heavy trucks<br />
are involved in a relatively small proportion of the<br />
Table 2. Occupatlonal fatelitiss-l984.<br />
overall number of motor vehicle accidents which<br />
occur each year (382,736 trucks were involved in<br />
lndustly CrauP Uorkers<br />
(x1000)<br />
Deaths* Deatha PEr<br />
100,000 Uork+r+<br />
accidents in 1984-3.8 percent of the total). On the<br />
other hand, because of their size and a number of<br />
other factors, when they do become involved in<br />
AIl lndurtrlcr<br />
Trade<br />
Hirrufacturtnt<br />
servlc:+<br />
covernnent<br />
Transportatlon 6<br />
104,300<br />
24,000<br />
IS,000<br />
28,900<br />
15 ,90o<br />
1r, 5oo<br />
1.200<br />
1,100<br />
1,200<br />
I, t00<br />
II<br />
5<br />
6<br />
9<br />
accidents, they are often severe.<br />
Pul,llc Utllltlss<br />
Constructlon<br />
5,500<br />
5,700<br />
1,500<br />
?,2OO<br />
2l<br />
As a result, their proportional involvement in fatal<br />
Asrlculrure 3,q00 1,600<br />
46<br />
accidents is higher (5,188 trucks were involved in fatal<br />
Tl{ucK DRrvERs I,876** I,087*+*<br />
58<br />
accidents in 1984-8.9 percent of the total). Normaliz-<br />
Htntn6. QusrrylnB l,0oo 600<br />
60<br />
ing for exposure, heavy trucks experience less non-<br />
SOURCES: *Ac.: I dent FFeG-l-gg-E, Nst ional Saf e ty counc rl<br />
**Edul.lv,nerrt snd Xffitbrp* JsnuuJ-I9-8-l, U. S . Deparimcni df:<br />
fatal accidents per lfi) million miles of travel than do<br />
passenger cars (288 versus 614, in 1984), but experience<br />
more fatal accident involvements per 100 million<br />
Labor<br />
miles of travel (4.0 versus 2.8, in 1984) than passenger<br />
cars.<br />
side fixed objects) than are passenger cars and light<br />
One way of gauging the relative importance of trucks/vans.<br />
medium and heavy truck safety is to assess the Medium and heavy trucks, like most other vehicles,<br />
consequences of these vehicles' accidents in terms of experience most of their accidents on the roadway<br />
the total number of fatalities and injuries that result.<br />
Viewed in this way, medium and heavy truck acci-<br />
itself (79 percent)-as opposed to off-road, in daylight<br />
(76 percent), on straight (79 percent), dry (66 percent),<br />
dents result in 12.8 percent (5,657) of all highway and level (69 percent) roads. All vehicle types have<br />
related fatalities and 4.8 percent (171,232) of the<br />
injuries that occur in highway related accidents each<br />
similar patterns. Observed variations from $tate to<br />
$tate are more indicative of geographic or weather<br />
year. The majority of these (118,835 of the injuries pattern differences than they are of differences in<br />
and 4,019 of the fataliti€s) were sustained by occu- truck accident involvement propensity.<br />
pants of other vehicles involved in collisions with<br />
medium and heavy trucks (see Table l).<br />
Truck drivers are involved in one of the nation's<br />
most hazardous occupations. They sustain 9'3 percent<br />
of all work-related fatalities, yet comprise only l'8<br />
percent of the employed work force. Truck driving<br />
rank$ second only to mining and quarrying in terms<br />
of occupatiottal fatalities that are sustained per<br />
100,000 workers per year (see Table 2).<br />
If a medium or heavy truck is involved in an<br />
accident it is most likely to be a collision with another<br />
motor vehicle. This pattern is typical for most other<br />
vehicles as well. Trucks are, however, proportionally<br />
more involved in single-vehicle accidents (rollover,<br />
loss-of-control/jackknifes, and collisions with road-<br />
Combination-unit trucks experience a large proportion<br />
(59 percent, Washington l98l-83) of their accidents<br />
on roadway types likely to be used in over-the'<br />
road operations (i.e., lnterstates, U.S. and State<br />
routes), This conttasts with the accident experiences<br />
of single-unit heavy trucks which reflect travel patterns<br />
in urban/suburban settings (68 percent of singleunit<br />
truck accidents occut on city streets or county<br />
roads). The speed involved with travel on the former<br />
types of roads, has a direct effect on accident severity<br />
outcomes.<br />
A large portion of combination-unit truck accidents<br />
(55.8 percent in Washington) occur on undivided<br />
highways. Travel on undivided highways provides an<br />
increased opportunity for the truck to be in conflict<br />
with other vehicles. Also, the occurrence of an acci-<br />
Table 1. Gonaequenceg of medlum gnd haaw truck<br />
accldents in 1984.<br />
dent on this type of road increases the likelihood of it<br />
being serious, since head-on collisions are possible'<br />
As previously discussed, there are typically numer-<br />
ttedih and Hr.5, Truck Occupsntr<br />
OccupsntE of other VehtcIBs<br />
Involved in cal.ll!tlons with<br />
Hedlun ilnd Hesw Tru.kE<br />
Pedesrrlans/cycl I sts InvoIv€d<br />
Hl I Ied<br />
1,087<br />
1,019<br />
rr8,815<br />
ous overlapping factors which combine to ultimately<br />
"cause" an accident to occur. Some of these are<br />
documented in accident data collection systems'<br />
Driver-related errors, infractions, or misjudgments are<br />
ln Accidenrs sirh<br />
H+svy Trucks<br />
flsdlM Bnd<br />
5sl 9,398 among the frequently cited factors contributing to the<br />
TotsI<br />
s,657 171.21? cause of truck, as well as other types of vehicles',<br />
loral (all htSlp.y frhr.d<br />
44.24t 3 . 573 ,2 Io accidents. In Washington, for example, in 54 percent<br />
12.8r of All FatalirtsE<br />
of all accidents in which combination-unit trucks were<br />
SoUBCES: Fes 1984 tnd tlAss 1984<br />
involved, the truck driver was cited for some type of<br />
error or infraction.<br />
643
While significant reductions have been made in<br />
recent years, alcohol is still involved in 43.3 percent of<br />
all fatal accidents. Alcohol is not involved proportionally<br />
in as many medium and heavy truck accidents,<br />
however. either in terms of the truck drivers or the<br />
other vehicle drivers involved. Based on a 15 state<br />
sample of fatal accidents where blood alcohol concentration<br />
(BAC) levels of fatal accident involved drivers<br />
are routinely gathered, it was found that 2.9 percent<br />
of all truck drivers, and 16.6 percent of the drivers of<br />
other vehicles involved in accidents with heavy trucks,<br />
had BAC's greater than 0.1.<br />
Factors related to the mechanical condition of the<br />
truck are sometimes noted as having contributed to<br />
the cause of an accident. Problems of this type are<br />
typically coded in most accident reporting systems<br />
only when equipment is obviously broken or worn<br />
out, as determined by visual inspection. Equipment<br />
that is degraded, but still intact, such as brakes that<br />
are out of adjustment is usually not reported. For<br />
example, in Washington in 1981-1983, only 8.9 percent<br />
of all the combination-unit truck accidents were<br />
cited as being attributable to vehicle component part<br />
deficiencies. Brake system deficiencics are the most<br />
prevalent. This contrasts with roadside vehicle inspection<br />
findings[3] where, routinely, 20 percent or more<br />
of the vehicles inspected are placed out-ol'-scrvice for<br />
vehicle component part deficiencies, most of these<br />
being related to brake system deficiencies.<br />
ln summary, medium and heavy truck accidents are<br />
not particularly numerous nor are they ovcrrepresented<br />
among all motor vehicle accidents. They are,<br />
however, unusually lethal and more often than not, it<br />
is other highway users, with whom trucks share the<br />
highways, that are the victims in these accidents.<br />
Among the most significant reasons why this pattern<br />
of fatal accidents occurs are: the large disparity in size<br />
and weight between trucks and other vehicles, the<br />
typically high travel speeds at which trucks are operated<br />
and, travel patterns that, in many cases, place<br />
them on undivided highways where the likelihood of<br />
collisions with other vehicles increases.<br />
Medium and Heavy Truck Dynamic<br />
Performance<br />
As with all motor vehicles, driver control of medium/heavy<br />
trucks is limited to braking, acceleration<br />
and steering inputs. Any or all of these control<br />
applications are utilized to operate the vehicle under<br />
routine conditions or in the attempt of non-routine,<br />
often severe, avoidance maneuvers when the driver is<br />
confronted with a potential crash threat. ln the case<br />
of most four-wheel vehicles, comparatively severe<br />
levels of either steering or braking must be made to<br />
induce dynamic instabilities in the vehicle. This is not<br />
the case with medium,/hcavv trucks. These vehicles are<br />
644<br />
EXPERIMENTAL SAFETY VEHICLES<br />
susceptible to rollover, spin-out and jackknife in<br />
much less severe steering maneuvers.<br />
The ultimate criteria for judging the stability and<br />
control performance of a motor vehicle is whether or<br />
not the vehicle's driver can maintain stable control<br />
under all intended and foreseeable conditions of<br />
operation. In this regard, one can consider that the<br />
expectation of good dynamic behavior is fulfilled<br />
when the vehicle:<br />
I Attains a desired deceleration level during<br />
braking,<br />
I Follows a desired path in response to steer-<br />
I Remains upright (i.e., does not roll over),<br />
I Maintains a limited swept path, and<br />
I Does not oscillate from side to side<br />
uncontrollable manner.<br />
an<br />
In practice, niediunrlheavy vehicles often fail to<br />
meet these desired criteria for a variety of reasons.<br />
For example, they have the following performance<br />
limitations:<br />
Poor wheels-unlocked stopping performance.<br />
This results primarily from the general mismatch<br />
between the brake torques developed<br />
at each wheel and the prevailing wheel loads.<br />
This mismatch occurs due to the trernendous<br />
changes in wheel loading (both static and<br />
dynamic) that take place as a result of<br />
payload weight and placement. In addition,<br />
truck brakes often fail to deliver their designed<br />
torque output because they are not<br />
properly adjusted.<br />
Poor retention of braking capacity during<br />
desrcnt o.f long and/or sleep grades. The<br />
braking horsepower necessary for a fullyloaded<br />
vehicle to safely descend a substantial<br />
grade at highway speed places a large demand<br />
on the capacity of most truck brake<br />
systems. Parasitic losses which would normally<br />
aid in slowing the vehicle are low<br />
relative to the total vehicle weight. The<br />
search for improved fuel economy continues<br />
to reduce these parasitic losses even furthcr,<br />
Loss o! directional conlrol. Exceeding the<br />
vehicle's yaw stability lirnit results in vehicle<br />
spin-out (single-unit trucks), and jackknifing<br />
or trailer swing (combination-unit trucks)<br />
conditions. The primary cause oF these phenornena<br />
is the rearward bias of braking<br />
forces typical in the brake system designs of<br />
U.S. medium,/heavy trucks. This increases<br />
the probability of rear lvheel lockup. When<br />
lockup occurs, tires lose their ability to<br />
generate side force and the vehicle becomes<br />
unstable in yaw. Unstable yaw response in a
medium/heavy truck is likely to generate<br />
turning respon$es which exceed the vehicle's<br />
roll stability limit, thus precipitating a rollover,<br />
"Crack-the<br />
whip" response of multiplyarticuluted<br />
vehicles (doubles, triples and certain<br />
tntck-full-trailer trailer combinations).<br />
Multiple-articulated vehicles, have a tendency<br />
for the rearmost unit of the vehicle to show<br />
exaggerated or amplified response relative to<br />
the towing unit in certain types of severe<br />
obstacle avoidance maneuvers,<br />
"Rearward<br />
amplification" has important safety consequences<br />
when, during such maneuvers, the<br />
rearmost trailing unit exceeds its own roll<br />
stability threshold and rolls over.<br />
Straightforwurd vehicle rollover. Attempting<br />
turning maneuvers at too high a speed results<br />
in the vehicle's roll stability limits being<br />
exceeded.<br />
The stability and control characteristics of medium/<br />
heavy trucks are direct indicators of their safety<br />
performance. A driver's ability to control his vehicle<br />
is ultimately limited by the response of the vehicle to<br />
steering and braking inputs. Limitations on the dynamic<br />
control capabilities of the vehicle reduce the<br />
viable options which are open to a driver in maneuvering<br />
to avoid traffic conflicts produced by other<br />
vehicles and also reduce the tolerance which is avail-<br />
able to compensate for any inappropriate control<br />
inputs made by the driver. In effect, the vehicle<br />
becomes less forgiving of control errors.<br />
The Performflnce Characteristics of<br />
Medium and Heavy Trucks in<br />
Maneuvers Involving Braking<br />
The Size Of The Brake System Related<br />
Safety Problem<br />
There are basically four different types of truck<br />
accidents that could be related to braking system<br />
performance: accidents due to failed or inoperative<br />
brakes; runaways on down grades; accidents where<br />
the vehicle was unable to $top in time (brakes did not<br />
fail nor were they ineffective due to heat but they<br />
simply did not provide the stopping force necessary to<br />
avoid the accident), and; skidding or loss-of-control<br />
accidents where wheels locked during braking.<br />
Collectively, the performance of truck brake systems<br />
could be a contributing factor in as many as<br />
one-third of all truck accidentsIl].<br />
Truck Brake System Limitations<br />
Truck brake systerns have a number of critical<br />
limitations, namely:<br />
<strong>SECTION</strong> 4. TECHNICAL SESSIONS<br />
Inadequate Capacity in Continuous or Repeated<br />
Braking Situations-The adequate sizing<br />
of truck brake systems in terms of<br />
braking torque and thermal capacity is dictated<br />
by more than just the mass of the<br />
vehicle. For example, a tractor-trailer typically<br />
weighs approximately 30 times as lnuch<br />
as a passengcr car but needs 167 times as<br />
much braking power to maintain a steady<br />
speed on a 6 percent grade[4J. In addition,<br />
the capacity of truck brake systems has not<br />
increased to match the increasing demand<br />
placed on thcm as a result of fuel ecorlomy<br />
enhancement efforts to decrease parasitic<br />
drag. As a result truck drivers must compensate<br />
even rnorc than in the past, especially<br />
when descending grades. Lower descent<br />
speeds (and lower transmission gear ranges)<br />
must be used to prevent runaways.<br />
Poor Brake Distribution-U.S. trucks and<br />
combination-units typically have a strong<br />
rearward bias in the application of braking<br />
force. Front wheel/steering axle braking is<br />
usually low. This results in stopping distances<br />
which are longer than those of other<br />
vehicles, especially under emergency conditions.<br />
Additionally, combination-unit trucks<br />
can easily become unstable due to locked<br />
wheels under many brake application conditions.<br />
lncompatibility of Tractor and Trailer Brake<br />
Systcms-Many tractor and trailer brake systems<br />
are not compatible-i.e., they do not<br />
function well together to provide desirable<br />
overall combination-unit vehicle braking performance.<br />
Often, the atnount of braking<br />
force being applied by the tractor's axles<br />
greatly exceeds that of the trailer's, or vice<br />
versa. Similarly, the brakes may apply or<br />
"come<br />
on" quicker on the tractor than on<br />
the trailer. lncompatibility cornpromises both<br />
vehicle stability and brake effectiveness<br />
which can result in uneven brake wear problems<br />
and brake fade on downhill descents. In<br />
addition, brakes on trailers often apply and<br />
release slowly compared to those on the<br />
tractor. This is due to the distance between<br />
the brake control valve (treadle) and the<br />
trailer brake valve(s). Slow brake application<br />
times increase $topping distance and slow<br />
release times make it difficult to recover<br />
quickly from trailer wheel lock-up should<br />
this occur. This problern is more pronounced<br />
with longer combinations.<br />
Sensitivity to Brake Maintenance*Because<br />
truck brake systems are more complex and<br />
645
experience comparatively more severe service<br />
conditions than passenger car brake systems,<br />
they require a great deal more maintenance.<br />
Frequent inspections and repairs must be<br />
made to assure that systems are operating<br />
and are properly adjusted (since, unlike passenger<br />
car brake system$r most truck systems<br />
do not self-adjust with wear). Roadside in-<br />
' spections have, for many years, indicated<br />
that many operators do not adequately maintain<br />
their vehicles. This is compounded by<br />
the absence of consensus measurement standards,<br />
performance criteria and marking,/labeling<br />
schemes for components within the<br />
brake system. This makes it difficult, if not<br />
impossible, for truck operators to obtain<br />
replacement parts such as valves and linings<br />
which exhibit comparable performance to the<br />
parts that were originally installed on the<br />
vehicle. Because of this, compatibility prob-<br />
, lems are often created or worsened when<br />
repairs are made.<br />
In order to address these problems, a three phase<br />
program of research is suggested. It would deal: first,<br />
with compatibility and brake maintenance problems;<br />
secondly, with controllability problcms associated with<br />
braking maneuvers, especially while operating liehtly<br />
loaded or empty on slippery road surfaces, and;<br />
thirdly, with eftorts to optimize the brake system to<br />
improve stopping performance.<br />
Research Program To Address Brake<br />
Compatibility, Brake Adjustment, And<br />
Component Performance Problems<br />
There exists a need to ensure that today's brake<br />
systems function as well as possible. In any discussion<br />
of heavy truck braking systems-especially among<br />
truck users-the subjects of compatibility, component<br />
Ievel performance, and brake adjustment always surface<br />
as priority concerns. The reason for this is that<br />
poor compatibility becomes obvious very quickly in<br />
terms of excessive brake lining and drum wear, brake<br />
drum cracking, the need to adjust brakes con$tantly,<br />
etc., on the "over-braked" unit of the combination.<br />
The safety implications of operating a truck with<br />
incompatible brakes are subtle and difficult to i$olate<br />
in accident statistics. Marginal stopping perlbrmance<br />
would not, of itself, precipitate an ascident. lt only<br />
becomes a problem il a crash avoidance braking<br />
maneuver is attempted, and these are nol cvcryday<br />
occurrences. In addition, if a crash does occur under<br />
these circumstances, other more apparent factors are<br />
likely to draw attention away from the fact that poor<br />
braking performance was a contributing factor.<br />
The overall research and implementation program<br />
needed to address brake system incompatibility and<br />
646<br />
EXPERIMENTAL SAFETY VEHICLES<br />
brake maintenance issues is shown in Figure l.<br />
Industry, government and professional standards setting<br />
organizations are currently actively involved in<br />
programs to address the issues of pneumatic timing,<br />
brake force balance, performance and labeling of<br />
valves and linings and improved means for ensuring<br />
proper brake adjustment.<br />
These activities need to be actively supported and<br />
continued, and, where possible, accelerated. Compatibility<br />
and maintenance issues are the everyday concerns<br />
of conscientious motor carriers. They must be<br />
satisfactorily addressed before motor carriers will<br />
become more receptive to the new technology that<br />
must be incorporated in trucks in order to make<br />
significant improvements in truck controllability and<br />
stopping capability when braking.<br />
Research Program To Address<br />
Braking-Induced Instability Problems<br />
Even if substantial improvement can be achieved<br />
with regard to tractor-trailer compatibility and maintenancc<br />
issues, truck brake system performance would<br />
still be deficient at limit conditions, i.e., when making<br />
an emergency stop or when making a brake application<br />
that is too "hard"<br />
for conditions. An example of<br />
the latter case would be when the driver has misjudged<br />
the amount of brake pressure he can sal'ely<br />
apply when operating an empty or lightly loaded<br />
vehicle on a slippery roadway. Without load proportioning<br />
systems and/or antilock braking systems, compatibility<br />
can only be achieved lor a single design<br />
loading condition, typically the fully loaded condition.<br />
Many truchs operate lightly loaded or empry a significant<br />
portion of the time.<br />
The most promising technology that is currently<br />
available for significantly improving braking performance<br />
at these limit conditions is the antilock brake<br />
system (ABS). These systems are the only solution to<br />
the wheel lock and resultant loss-of-control tendency<br />
typical with currently designed U.S. vehicles. Almost<br />
everyone in the trucking industry agrees that antilock<br />
has the potential to significantly improve the braking<br />
performance of heavy trucks by eliminating the directional<br />
instabilities which occur when wheels lock.<br />
Many, however, question the reliability and maintainability<br />
of the $ystems in actual use a$ well as the<br />
ability of the systems to fail safe (i.e., in the event of<br />
a malfunction the $ystem reverts back to a normal<br />
brake systcm without antilock). Lack of reliability was<br />
the major reason for the C
tr.cr0r/tr.ll.r coilt.l'blr'it<br />
t D.rrloF l.rl prec.dur...nd<br />
p.rlornrnr.'.n'd0p.'<br />
a F..6iv. cafiiltnla lo<br />
a r.r!. lrn.l rul.<br />
<strong>SECTION</strong> 4. TECHNICAL SESSIONS<br />
Cpilpoornl L.v.l F.rlot-.4t<br />
I D.v.loO fi.r.vr.hr^l<br />
Er 0(.4!r.. .id F.rlornrnc.<br />
I En.ur. cone.rbllilr ol<br />
P.tr. tlti lh.l<br />
,i'Eh ll r.or.cr.<br />
a E.r.bll.n ao.lr ror Inl{rlrt<br />
Prad!.1<br />
lr.l. Y.lr..<br />
a Ar..rr p.rlorfi.ficr ol<br />
r.pr.r.nr.t'r. rrlrrr<br />
-Crr.r prarrsrr<br />
-irlr.r.<br />
Dr.r.s.rr<br />
d.r.locrrnl<br />
a P!!rrcrrrDn ol t..t/<br />
I Inlor4.r'on/.rt.rlr.c.<br />
0rrl. Ltfrtfitr<br />
I F...{rr iqrqs. rr I<br />
-Fr.ror6.n€. rattnl<br />
O.Yrroq Fr,ror6.ncr Crrtrrlr ro<br />
E..ur. Optriluh Frrlqrr.nc. ot<br />
Curr..r ft.r.8tttan.<br />
l{elpil.rt/Qortofi..l Flt,<br />
Co...n.ur 9tr6d.rdt/<br />
F..oFir6{.d Fr.cilcrr<br />
a F.lo.6rnt. r.rl<br />
t E.rr tnj tt.b.t ..nt t^a<br />
}rl. Adtrthtrl<br />
I Drvrtop pr.lorr.ncr t..t<br />
a Erl.bll.fi rcr.pr.ot.<br />
t.rlorfi.n.. rrilri.<br />
a ldr.tllr rr.0.rr lor lidlttrt<br />
d.r.lqFi.nr ol rp9..d.d<br />
Figure 1. Truck brake performance improvement program-brake compatibility and malntenance<br />
closely monitored fleet study, in cooperation with<br />
antilock suppliers, truck manufacturers and motor<br />
carriers is suggested. This study would yield sufficient<br />
performance, reliability, maintainability and cost data<br />
to support intelligent decision-making on the part of<br />
motor carriers and governrnent relative to the suitability<br />
of this technology for widespread application in<br />
trucking, Initiating such a study now would result in<br />
the data being available in the early 1990's. Thus, it is<br />
imperative that this portion of the brake rcsearch<br />
program be conducted in parallel with the cotnpatibility<br />
research project discussed previously. The project<br />
is outlined in Figure 2.<br />
Research Program To Improve Truck<br />
Stopping Performance<br />
The objective of this part of the program would be<br />
to achieve the maximum practical limit braking performance<br />
possible. It would build on the improvements<br />
expected to result from the first two portions of<br />
the program<br />
Ultimately, a vehicle's stopping performance is<br />
limited by the overall amount of brake force capacity<br />
that foundation brakes can generate and by the<br />
traction properties of the vehicle's tires. Truck brake<br />
Ost-Or-.dlvrt'..r<br />
r.drc.ro.r<br />
a Erl.btr.n il.lhad. cl<br />
I qetlrct rhnrri rrDftG.t.<br />
Pfoltlrt. Oroducr.<br />
I Flrll.rrlr.l.<br />
force capacity on domestic vehicles is already at its<br />
limit with the exception of front wheel brakes. The<br />
power of this part of the system could be increased as<br />
could tire longitudinal traction. Research is nece$sary<br />
to understand the trade-offs involved in achieving<br />
these objectives and to establish reasonable goals for<br />
product development by the industry.<br />
This part of the overall program would, in general,<br />
follow the previously discussed research. It is shown<br />
diagrammatically in Figurc 3.<br />
The Performance Characteristics of<br />
Medium and Heavy Trucks in<br />
Maneuvers Involving Steering<br />
The steering responsc characteristics of a vehicle are<br />
one of the principal descriptors of its safety performance<br />
capabilities. In addition to braking capabilities,<br />
these properties define the inherent limits of safe<br />
vehicle operation.<br />
As a result of extensive research conducted since the<br />
early 1970's, considerable progress has been made in<br />
identifying the factors which affect the dilectional<br />
control and stability of medium/heavy trucks. The<br />
current state-of-knowledge indicates that some trucks<br />
64'l
Lr.g.-Scrl. ln-$.rvlcr Ou{nllllcrllon<br />
of Accldifrt Roduqllon B.n.llt<br />
F.d€.il vohlcli/Eqqlgmonl sl.ndirdr<br />
i ForlorFtnca sDeclllcallq4r for n{*<br />
Yohlcla ryatamr<br />
Urer/Oo.rdlqr Slrndrrd.,<br />
Rrcomnrnd.d Prrdllcol<br />
I Comprrlbtllty ('mrrlng') sdldrllnar fol<br />
lrrctorr and lrrlloaa vir-r-ylr rntllocl<br />
rnd/o. lord p/oForllqnlng lyrlrml<br />
I Dflv..rncchsnlc ar.lnlng.ldt<br />
t DrlY.r tt.rlogy llqld.llnr.<br />
EXPERIMENTAL SAFETY VEHICLES<br />
Anltlorh lftlllrltYi<br />
I Tott t.ACk oYsludllonr<br />
-Perlornrnca of cuarenl rnlllocl<br />
dealgnE<br />
-Trsdoofls b.trdsn control rl.ttoglal<br />
trnd pcalo.monco<br />
-Enelneerlno anqlyflg ol dur.blllly<br />
-Cohp.tlblllly<br />
ol combldrllqnr<br />
(q{rlorFanca slth rnd wllhqul<br />
rfrlllooh )<br />
l^-$ervlc. Fl.et Tdtll<br />
r F'llrblllty/du.rblllly<br />
t Faltura fiodg arrerafrint<br />
a ll.lnl.nanc. r.mlf lcrllonl<br />
r Paafornrnc. FtrlqrmancarRelliblllty D.ll<br />
Orclrlon on N.id rqr Srfoly Po.lorilrnE.<br />
Flict Evrlq.llon.<br />
F.d.nl Slrli Iniprcllon/M4lnltnrnc.<br />
Slrndrrdr<br />
I CompllFcntrry lo n.s yihlqlr rid.<br />
ll lrrsrd<br />
a EUTOOO/ Aqrtr.llr<br />
aU.S. motor ca.rl.. ivtlutllonl<br />
I Publlcti{on sf trnt rcrsllt .nd proortrl<br />
. D.mOqtlrrtlont/f llmr<br />
a Fubllc dlrcurrlon of .itqlla<br />
a Drtvrr lr.lnlog .ldl, drlvl. ltalliqt<br />
O{ld.llm.<br />
Figure 2. Truck brake performance improvement program-braking-lnduced Instability<br />
have safety-related response tendencies that limit the<br />
range of performance over which they can be operated.<br />
Heavy trucks cannot be steered around corners,<br />
change lanes, or avoid unexpected obstacles as quickly<br />
as a car can, nor are they able to make right-angle<br />
turns the same way cars can without experiencing<br />
difficultics. They are more prone than cars to rolling<br />
over in turns or, in the case of some multiplyarticulated<br />
combination-unit trucks, when attempting<br />
quick lane change accident avoidance type maneuvers.<br />
Multiply-articulated vehicles also may exhibit oscillatory<br />
behavior whetr simply travelling in a straight line.<br />
Of the topics previously discussed, rollover has<br />
direct and significant safety consequences and is in<br />
need of additional work to translate previous research<br />
findings into implementable solutions. Accordingly, a<br />
program for further re$earch in this area is proposed.<br />
Rearward amplification is a problem unique to a<br />
special class of vehicles (multiply-articulated, larger<br />
combination unit vehicles (LCV's)). Some vehicle<br />
design-related changes could be made that would help<br />
reduce the likelihood of this occurring. These are<br />
close to being implementable. Other factors also<br />
64E<br />
Eqolpmrnl/Cohponrnl Llg, Conr.nru.<br />
StdrrHaco|rlsrf, drd Procrdutrr<br />
I Cofr$onint tnd lull tyrlem levtl<br />
psrlornrnci lill frorturomtnl<br />
Drociduail<br />
-Mi.ilnO/lrb.llng gsldrllnar<br />
affect this tendency, and, in many cases, to a greater<br />
degree than do vehicle-related factors. These include<br />
operational use practices and legislative choices relating<br />
to vehicle size, weight, and configuration allowances.<br />
Problems associated with low speed off-tracking are<br />
certainly a concern from a traffic cngineering and<br />
operations viewpoint, but are not significant from an<br />
highway safety viewpoint. Few traffic ascidents are<br />
likely to be associated with this characteristic of<br />
trucks. Those that do occur are likely to be low<br />
severity, property-damage-only events. Accordingly,<br />
no additional work on this subject is proposed.<br />
High-speed yaw instability, while demonstrable<br />
from an engineering viewpoint, is not evident a$ an<br />
accident causal factor. lt is not likely to ever be<br />
evident in mass accident data files. since when it does<br />
occur, it is likely to rcsult in the vehicle rolling over.<br />
This topic is best addressed in conjunction with<br />
efforts to improve truck roll stability.<br />
The oscillatory behavior of multiply-articulated vehicles<br />
is also not likely to be a signilicant highway<br />
safety problem. It is of concefn, howevet, in that<br />
trailing units may encroach on other travel lanes or
Alt€thstrvo,rldnorEtivs B.Eko 068ign<br />
Evalvrtiona (TrEt frdck)<br />
a Eydluot6 aoloty psrlo.manc. grlfif ol:<br />
-Lord-senrilivt Dtlta Prooorliontng<br />
-W{dOa/dirc<br />
-Elactronlc<br />
rctlyrllon<br />
-Olha,. na* tyttamt In loffrt ol:<br />
--rblllly<br />
lo mrlnrrln adjuEimenl<br />
-'unllo.m torqua output ovrr taaylca<br />
il10<br />
Frdatrl Eoulpm.ftl Slrndirdt<br />
a Upgrrd. sy.lafi Darlormancl<br />
rrqglrrmtnla rr lpproprltli<br />
<strong>SECTION</strong> 4. TECHNICAL SESSIONS<br />
lftcroasod Flont Whoel Brsho Forcr<br />
Cagrcily (T.Et TrEck)<br />
aABtaBt po.lo.manc. grrn tttoclrlod filh<br />
biO0e. b.rkes<br />
aEYaluato aamltldttlons odi<br />
Slaorlno Ind rurp€nsion tyttimr Ind<br />
dtlvor rccaplrblllty<br />
allrarure rteaalng .itDonta chalacttllallcl<br />
Ol Yrhlclrt wilh:<br />
-lncrttalnq ailounla ol b.rke lorqur<br />
*vrri6ul lygat ol tlsg,ing rldf (e.0otf..t<br />
klnOpin ry.teor, pswtt rlFringl<br />
atletina teri morauasfront oaocgdqao lot<br />
t!ttbllthlng ateering reNpOore<br />
chrarclarlallcr<br />
Flrol Eyrlsallon ol Paomlrlno lrcnnology<br />
,<br />
a Patlotmtnci<br />
rF.il.btilfy<br />
aM.tnt.tnrbilttt<br />
lCort<br />
Equlpm.nirCompdnanl MIO- Conrintur<br />
Sltddsrdr<br />
t Dav.log tlr. trrctlqn otttu.iminl<br />
Daoctduae<br />
a DaYrlop tractlotr ratlnO .cheD.<br />
I Erirbllrh perforfitnr6 goslt loi<br />
product devolopmanl by lha lndualty<br />
Figure 3. Truck brake performance lmprovement program-stopping performance<br />
intimidate other motorists and thereby cause erratic<br />
maneuvering<br />
actions.<br />
The Prevalence And Characteristies Of<br />
Rollover Accidents<br />
Rollovers constitute a vefy visible and serious type<br />
of comrnercial vehicle craslr. Although vehicle rollover<br />
is involved in l'rom 4 to g percent of all medium/<br />
heavy truck crashes, it accounts for approximately<br />
one third of the single-vehicle accidents. Rollover<br />
occurs in approximately l5 percent of the f atal<br />
crashes and is a contributory factor in nearly 60<br />
percent of the medium/heavy truck occupant fatalities.<br />
Research Plan For Improving Truck<br />
Handling And Stahility Performance<br />
Rollover is given the highest priority among handling<br />
and stability related issues because it is well<br />
undcrstood and has an obvious direct link to safety.<br />
The program to improve the roll stability properties<br />
of trucks follows three parallel paths.<br />
Tire Traction (T€si Track/L.b)<br />
aAEs€aa frnga ol tonOitudinrt ind<br />
l6l6rdl lr6ction crOrbrilty of<br />
lodty'a il.et<br />
aEvrlurta tlrdiollr baiwaan<br />
-Trrctlon<br />
-tryaar<br />
-Cort<br />
-Ou..blllly<br />
a Pdrrmotrlc liEia<br />
-EEltblisi porlormtnca trhga<br />
tt t luncllon ol:<br />
-Comgoundlno/brrnd<br />
- wia.<br />
-Trrrd Drilirn, atc.<br />
-Divolop oerr0ramaftl<br />
melhodolo0y<br />
lnlo.mrtlon Dlrdemination<br />
I Publlrh t.tt llndlngr<br />
a F.brlcrle r hybtld<br />
rlrlo-ol-the-ral Yahlclc tnd<br />
demonrtrrl. lli caPibllllY<br />
a PsbllBh rrlltrgr<br />
One of the paths would be directed towards developing<br />
the best methods of gauging the relative roll<br />
stability perforrnance of trucks. It would take into<br />
account static and dynamic considerations.<br />
A second path would attempt to establish what<br />
motion and visual cues drivers sense (or possibly fail<br />
to sense) prior to a rollover. This information could<br />
help driver training efforts and could possibly result<br />
in more of the "good" cues being built into future<br />
trucks.<br />
Another path would study in-service trucks to a$sess<br />
how many of them are typically being operated close<br />
to their stability limits. This would include studies of<br />
truck tires to determine the degree to which their<br />
performance propertie s affect vehicle stability and<br />
control. A determination would also be nrade as to<br />
which properties of in-service trucks are most responsible<br />
for stability limits being approached. Finally, an<br />
assessment would be made of the impacts that would<br />
result l'rom design-related cltanges that might be<br />
contemplated to enhance roll stability of future<br />
trucks.<br />
649
The overall roll stability enhancement research program<br />
is shown in Figure 4.<br />
Medium and Heavy Truck Crash<br />
Performance-Truck Aggressivity<br />
When any two vehicles of dissimilar size collide<br />
with each other, the larger of the two vehicles<br />
typically inflicts much more damage and injury<br />
trauma than it sustains. In this case, the larger vehicle<br />
is said to be more *'aggressive" relative to the smaller<br />
vehicle.<br />
In medium and heavy truck collisions with other<br />
vehicle types, the truck's "aggressivity" occurs for<br />
two principal reasons: geometric mismatch (the fact<br />
that the physical shapes of the two vehicles, particularly<br />
the front end of trucks, do not match each<br />
other), and mass mismatch (the difference in weight<br />
between the two vehicles).<br />
Many believe that little can be done about truck<br />
aggressivity short of segregating trucks from other<br />
vehicles. This may not be totally true since a significant<br />
portion of the problem arises from geometric<br />
rather than mass differentials. Practical improvements<br />
may be possible for at least this part of the problem.<br />
Extent Of The Aggressivity Issue<br />
Two-vehicle collisions are the largest single category<br />
of fatality producing motor vehicle,/highway related<br />
EXPERIMENTAL SAFETY VEHICLES<br />
Flgure 4. Truclr roll stability enhancement research program<br />
650<br />
Tarl Procadurt OQY6lopfienl<br />
aDtlrrmlnr tlrllc mtllurimanl<br />
Irchnlquar' rDllllY lo ritoir<br />
dynrmlc aflecrt<br />
tTrrl Prlcadura DtY!loPfttnt<br />
-PowGr Unltl<br />
*Trrlllng unita<br />
Strndr.dr DeveloPmont<br />
aHew Y.hiclc<br />
-Corhpontnt Ind rYitril l.Yrl<br />
rln-rrrvlcr Ychlcle<br />
-Lofdlng rnd opfrillonrl utl<br />
-ContlCuratlon cholctr<br />
OrlYrr Eludlri<br />
t Srmple drlvcrt' rbllltlar lo<br />
trntE rollovor onial<br />
f O.t.rGlne roll 16lilsd Yihlclt<br />
barad cuts<br />
aArrerr illact ol vrrylng<br />
vahlcl6 cues on drlYiri'<br />
conlrol rttponr6 Piltafnl<br />
accidents. In 1984. two-vehicle collisions accounted<br />
for 37.7 percent (16,668) of all highway related<br />
fatalities. Collisions between medium,/heavy trucks<br />
and other vehicles resulted in 2l percent (3,423) of all<br />
the fatalities sustained by occupants of other smaller<br />
vehicles involved in two-vehicle collisions. The majority<br />
of these victims (71.9 percent, 2,461) were passenger<br />
car occupants. In all, these 3,423 fatalities represented<br />
7.7 percent of all the highway related fatalities<br />
occurring in 1984.<br />
Research Plan For Reducing Heavy Truck<br />
Aggressivity-Frontal Impact<br />
Attenuation/Override Prevention<br />
The extent to which the effects of collisions between<br />
medium./heavy trucks and other smaller vehicles can<br />
be ameliorated is not clear. Readily achievable solutions<br />
are not apparent, however, given the appreciable<br />
number of occupants of other smaller vehicles (3,423)<br />
who are killed in collisions of this type, it appears<br />
worthwhile to study the possibility that even small<br />
incremental improvements can be achieved.<br />
<strong>Six</strong>ty-eight percent of the fatal carlcombinationunit<br />
truck collisions involve the fronts of trucks.<br />
Logically, then, work would begin on this portion of<br />
the vehicle. The program to explore the feasibility of<br />
practically modifying truck front end designs is shown<br />
in Figure 5.<br />
lntormillon Dlriemlnlllon<br />
aD.lYfr tirlnlng rlds<br />
Vrhlclr gtudlrr<br />
alnYanlory In-rrfvlce fl6ol fot<br />
grrvtlanca of unrlible<br />
'Oullllrt,<br />
tDrtrrrnlnr ptevalonct of<br />
mrniuvart whlch crrito n€er<br />
llmlt D.rlofsinct d6hrnda<br />
aDatermln6 tlre p6rtormencE<br />
EonlrlDutory ettdclr on<br />
rlrbl lllY<br />
-Combtn6d longlludlnrl ind<br />
lrlfrtl trecilon crprblllllss<br />
-Elfacti ol werr on l.Nclion<br />
.Arr6it trtd6-offt tltoclsl€d<br />
wlth vihlclGl tpcc'd lot<br />
oplln'rurh rtablllty p6rf orlhrnco<br />
a Prrf ormanca mariuTrminl/rrtlng/<br />
.apoftlng guld.llner<br />
rSt.bltlty rrftlflclllofis of rlr. rnd<br />
rrlghtr rrqulrcmrnla Ghrng€3
As s i C e r$_!_!y.qs.tlc_all o!]:[]n.6_!a_t ! q_An C[_slf<br />
' Establish Upper Bound ol Car Crashworrhiness Capability<br />
. Establish Flanga of lmpact Velocities and Closing Anglos in<br />
Car/Ttuck Collisions<br />
r Estdblish HNng6 ol Kinetic Energy That Truck would Hav6<br />
to Absorb<br />
Oec i-s-ion<br />
. WhEi Kindtic Energy Absorbtion Lsv6ls Can 8e Hrndled?<br />
. Countcrbalancs Operational Practicality Concarns Against<br />
Perlormance Goals<br />
r EstBblish Perlormance ObjectivsE<br />
Dec-tq'.-o-!-r<br />
. ArB Alte.native Oesigns Practical?<br />
. Do They lmorove Sdlety Pcrldtmanco?<br />
. Conduct In.Sgrvice EvaluEtions<br />
- AFs6ss Duralrility, Pcrlormance, Etc.<br />
Figure 5. Truck frontal attenuation/aggressivity reduc'<br />
tion research Program<br />
Truek Occupant Crash Protection<br />
Each year about 1,000 occupants of medium and<br />
heavy trucks are killed and 400,000 injured in crashes.<br />
Most are drivers of combination-unit trucks. Highway<br />
crashes are the principal occupational hazard faced by<br />
truck drivers.<br />
Accident data analyses have indicated that not all<br />
heavy truck occupant fatalities occur in catastrophic<br />
accidents. Rollovers, cjections, entrirpmellt in crushed<br />
cabs, contact with itrterior surfaces, and fires are the<br />
primary mechanisnts responsible for the majority of<br />
truck occupant fatalities. Most of these fatalities<br />
occur in sirrgle-vehicle accidents which involve running<br />
off the road and hitting fixed objects, simple otr-road<br />
overturning, jackknifing (with or without overturning),<br />
and collisions with low roadside structure$ $uch<br />
as guard-rails, sign posts, and emhankments.<br />
In many crashes which are now fatal to truck<br />
occupants, use of a safety belt more than likely would<br />
have been all that wa$ necessary to avoid the fatal<br />
outcome of the accident. No other L'ountermeasurc is<br />
likely to reduce thc number of truck occupant deaths<br />
and serious injuries a$ greatly as would increased<br />
re$traint system use. Beyond this, further improvements<br />
could be realized through tntck design$ that<br />
provided:<br />
Seats and restraint system$ that keep the<br />
driver firmly in place and prevent him from<br />
being thrown around inside the cab or being<br />
ejected,<br />
<strong>SECTION</strong> 4. TECHNICAI, SESSIONS<br />
I A reasonable amount of protection from<br />
post-crash fire,<br />
t Cab interiors free of sharp, hard objects that<br />
can cause injury during impact-especially<br />
the steering wheel rim and hub,<br />
t Strong, rigid cab designs that provide occupant<br />
survival space in a crash (within reasollable<br />
expectations), and after a crash, means<br />
of escape.<br />
Before practical solutions can be sought in any of<br />
these areas, both the types of crash cnvironments for<br />
which protection would be sought, and atr upper<br />
range of severity lbr which practical solutions are<br />
deemed feasible, would have to be established. Using<br />
this approach, multiple-event collisions/impacts represent<br />
the most reasonable group of accidents to address,<br />
while those involving high-speed impacts into<br />
rigid non-yielding objects (such as bridge piers) clearly<br />
are not. lnitially, 9 g crashes would be assumed to be<br />
the maximum level for which improvements could<br />
practically be sought[5]. Further attempts to refine<br />
this estimate of a reasonable upper bound of deceleration<br />
woulcl have to await the completion of detailed<br />
recon$truction and analysis of accidents that have<br />
been investigated in-depth.<br />
Research would proceed along both analytical and<br />
experinrental lines. The analytical work would consist<br />
of in-depth accident investigations and mathematical<br />
modeling.<br />
The accident investigations would be targeted to<br />
better definc typical crash-induced forces, direction of<br />
force application, luel and ignition sources in accidents<br />
involving fires, occupant trajectories, and causes<br />
and amount of occupant injury trauma sustaincd.<br />
The modeling activitics would focus on delining<br />
vehicle dynamics both before and during the crash<br />
event, describing the response of the vehicle structure<br />
to crash-induced loads, and predicting occupant<br />
trauma outcomes (given assumed crash forces).<br />
Existing approaches and/or standards woulcl be<br />
used wherever possihlc. Component-level testing (as<br />
opposed to full systems-level tests) would be the<br />
preferred method for experimental work. Existing<br />
standards (for example, those now used for rollover<br />
protection systems (ROPS) for construction equipment<br />
and the Swedish and ECE cab structural irrtegrity<br />
tests) would serve a$ initial reference points l'or<br />
experimental testing.<br />
The emphasis on all this work would be to achieve<br />
practical increnrental improvements rather than strive<br />
for total, yet unattainable, solutions.<br />
Research Program To Improve Heavy Truck<br />
Occupant Restraint Systems<br />
Observational surveys of seat belt use among<br />
combination-unit truck drivers indicate that few (6.25<br />
651
percent) use them[6]. Surveys of truck drivers' opinions<br />
relative to safety belts indicate that many erroneously<br />
believe that they are not cffective in reducing<br />
injuries in crashes. ln addition, many drivers feel<br />
safcty belt designs are deficient. Drivers said safety<br />
belts were often dirty (because of lack of rctractors)<br />
and uncomfortable because they did not ',give" in the<br />
truck's relatively rough riding environment.<br />
Efforts to improve this situation have taken several<br />
tacks. First, an industry/government ad hoc group<br />
developed a packaged safety bclt use promotional and<br />
information kit aimed exclusively at motor carricrs<br />
and truck drivcrs. The package has been promoted<br />
through the American Trucking Associations' 50 state<br />
trucking organizations.<br />
Secondly, NHTSA issued an Notice of Proposed<br />
Rulemaking (NPRM) to amend FMVSS 208 to require<br />
emergency locking retractors (ELR'S) and pushbutton<br />
releases on truck and bus salety bclt asscmblies.<br />
The purpose of the proposed amendment was to<br />
promote the use of saltty belts by cnsuring that they<br />
are comfbrtable and easy to use and that fhey remain<br />
clean.<br />
Truck safety belts without any retractors often<br />
become entangled in the suspension mechanism of<br />
truck seats where they become dirty and difficult to<br />
extract and use. It was rcasorred that by requiring<br />
ELR's, safety belts would be kept clcan while ensuring<br />
that they not cinch up around drivers' waists in<br />
the comparatively rough riding environment of a<br />
truck.<br />
F'inally, eft'orts have proceeded to f'urther upgrade<br />
the performance and comfort of truck safety belt<br />
designs. There is growing interest among some truck<br />
operators in having workable, comfortable 3-point<br />
re$traint systems in heavy trucks. Research is needed,<br />
however, to determinc how best to modify and adapt<br />
3-point systems to the ride environment typical in<br />
heavy trucks since pa.ssenger car ,$y$tems cannot be<br />
uscd in unnrodified form. Manufacturers also report<br />
that their efforts to design 3-point systems for hcavy<br />
trucks are often constrained by restraint system<br />
strength requirements they feel are unnecessarily high.<br />
Accordingly, the primary thrust of engineering research<br />
to improve restraint sy$tem$ should be directed<br />
towards ascertaining strength requirements for truck<br />
safety belts that are appropriate for truck occupant<br />
protecti()n goals. These levels should be bascd on the<br />
objcctives of preventing occupaflts from being thrown<br />
about inside the cab while at rhe same time preventing<br />
them from being ejected. The objective would be to<br />
achieve a balance which optimizes occupant protection<br />
performance while also enabling maximum clesign<br />
flexibility.<br />
The program is shown diagrammatically in Figure<br />
6.<br />
652<br />
EXPERIMENTAL SAFETY VEHICLES<br />
Orllnr T.!Ct lld! Con.trrthtl<br />
a Ertrbltrh cofrtott thrtthold<br />
Ylt-.-vlr b.I ctnchtnO<br />
Erl.bllrh T.ntrtlv. l{iw Etr.ngth<br />
FcllorhFnce Lsvala<br />
Trrt ol Btvtlrtt Byrtror<br />
lal{hr Prrdlcllon Analyrar<br />
aPlr occup.nl tlnulrlot<br />
I B'ad lalt!-Fronlal crarh rrr!irfitni<br />
tClb roll liilr-Foltoy!r crrrh rtraaamanl<br />
In B.rvlc. Flatd t.rtr<br />
aVcrlly comlort, !ors-ol-uto<br />
frodolr lq Sug{ lr0trctlon<br />
tltprdcd rt tttrrnrttvt b.lt<br />
llrlnglh IrYalr<br />
Figure 6. Truck occupent restraint systems research<br />
program<br />
Research Program To Prevent Post-Crash<br />
Fires<br />
Post-crash fires are involved in nearly l6 percent of<br />
all fatalities to the occupant$ of medium and heavy<br />
trucks. The comparable figure for passenger cars is 4<br />
percent. Studies that have been conducted on this<br />
issue indicate that between l0 and 50 percent of these<br />
fires result from fuel loss lrorn the truck's I'uel<br />
containment and delivery system [7].<br />
Fire related accidents are obviously very severe. In<br />
many cases, it is impossible to determine whether the<br />
crash events precipitating the fuel release wcre so<br />
severe-in and of themsclves-as to preclude vehiclebased<br />
upgrades. Nevertheless, reasonable incremental<br />
improvements may be possible.<br />
Accordingly, a research program seeking ways of<br />
preventing post-crash truck fires would be directed<br />
towards enhancing the ability of truck fuel systems to<br />
withstand crashes and remain intact. It would include<br />
investigations of both the feasibility and desirability<br />
of using: "kill switches" in the truck's electrical<br />
systcm to eliminate this a sourcc of ignition; bladders<br />
in fuel tanks to contain fuel in damaged tanks;<br />
non-toxic, flame-retardant materials in truck cabs;<br />
on-board firc suppression systems, and; fuel delivery<br />
and return lines rerouted away from engine and,/or<br />
exhaust heat source$. The program is shown diagrammatically<br />
in Figure 7.
Fud|-PallY try $yrtam<br />
T h.rftr I Antlyrlg<br />
I Harl rour(<br />
tuel lampc<br />
t Trrdi-olf<br />
*lutl rlr<br />
al. k<br />
-dfrlgn rl<br />
at rrlrlng<br />
tturoa<br />
<strong>Int</strong>lyil6<br />
ng YE lire<br />
arnallYtl<br />
<strong>SECTION</strong> 4. TECHNICAL SESSIONS<br />
Aceld.nt Raconrlrucllon/ Anttyrtr<br />
I Cralh nrchanlrmr cacalng ayrlam br.achlng<br />
I Crrth lorcar/allracllon of rppilcrrton<br />
a lgnlllgn tgurc.i<br />
Figure 7. Truck fire prevention re$earch program<br />
lmplovf( lD..lgn<br />
Alltrnrliyaa /F.rrlbllltY<br />
a H.loctrlon<br />
Ana I lalr<br />
t Shi.ldlng/ rlranglhihin0<br />
I Fuil llni I<br />
fOutlnq<br />
9rclalon<br />
llcfnttlY6<br />
a Incrrrhitrlal datlgtr<br />
chrngrr llh.ly to yl.ld<br />
rrlrty lmpfdvrrrnl?<br />
Yrr<br />
OaYalOp/Frbrlcric Protoltpaa<br />
tFlrld lrrl fori<br />
- l{|nuf rcl urrbilf ly<br />
-P;tcl lc r llt y<br />
-Srfofy paito.manc.<br />
Research Progrnm To Improve Steering<br />
Assemblies And Other Cab <strong>Int</strong>erior<br />
Components<br />
Serious injuries sustained by truck occupants who<br />
remain inside the vehicle in accidents (where intrusion<br />
of the occupant compartment is not sufficient to<br />
cause entrapment) result from contact with interior<br />
components. Where specific injury information is<br />
available, the steering wheel has consistently been<br />
identified as the primary sourse of serious injury to<br />
heavy truck occupants, followed by sun visors/roof<br />
DrYrlop Srfcly<br />
Ptrlorntnct Mciaurtmtnl<br />
Pr ocrdural<br />
9oaDponant^Lavf l Trrl!<br />
t Erlrbllrh mrrlmum<br />
Parlorminca crprbilily<br />
vlr:<br />
llo<br />
-Drop taili<br />
-Abrr1ls6 1"a1a<br />
-Punctura tttll<br />
Errk glher<br />
oOunltrmltlurtr<br />
top moldings, roof and side rails, and instrument<br />
panels.<br />
Analyses of occupant trajectories in accidents reveal<br />
that the majority of crash-involved drivers move in<br />
more than one direction durirrg the crash sequence.<br />
This is possible because many truck crash events occur<br />
over long time periods (seconds) compared to those of<br />
cars (milliscconds). Given this much movemcnt by<br />
occupants, it is not suprising that besides impacts into<br />
steering wheels, contacts with the windshield, instrument<br />
panel, and surfaces of doors and door headers<br />
653
have also been identified as common sources of<br />
injury.<br />
The goal of this research program, therefore, would<br />
be to develop means of reducing occupant injuries<br />
that result when truck drivers, both restrained and<br />
unrestrained, impact cab interior surfaces and components,<br />
especially truck steeritrg wheel,/column assem-<br />
The program is shown in Figure 8.<br />
Research Program To Enhance The<br />
Structural <strong>Int</strong>egrity Of Truck Cabs<br />
A crash performance objective that heavy trucks<br />
share with pa$senger cars is maintenance of sufficient<br />
space within the occupant compartment to "ride-out"<br />
the crash event. This capability is of equal importance<br />
with that of restraining/containing occupants within<br />
EXPERIMENTAL SAFETY VEHICLES<br />
Figure 8. Truck cab lnterior components research program<br />
654<br />
Ocouprnt Trluma<br />
Pr.dlcllon Hodrla<br />
I Utr truch rl.crlfig<br />
shatl grsmrtrlrt<br />
t urr dacalaartlonr<br />
< 0g'r<br />
In-DrDlh Ascldrnt R.oonatructlon I Anrlyrlr<br />
t Typ. of Inlury rurtallfd<br />
t F.glon ot bodt<br />
t Prrtr ol botlt ilorl ollan Inlurrd Dy rtfttlne<br />
r..tmbllf.<br />
ll <strong>Int</strong>.rlor componfnlf<br />
Orrlgn Dfvllopfilnl<br />
"8ollrr"<br />
Slrd Tr.tr U.lng ATD|<br />
Syrt.mrllcrlly Yary<br />
dfcalttallofi rtttt,<br />
mil.urlng lmptctlflg<br />
fcrcar I altrrlng rh.rl<br />
dafornatlona<br />
Dttrrilln. Irtunt gau.fd<br />
by tltrrlng rh.rlr rnd<br />
olhar conDonanlr<br />
O.c I rlon<br />
t Oo rccldanl rrconrtructlon<br />
tnrlyrlr. llrd lrrtr rnd<br />
lrb ecftpr.rrlon lttlt<br />
lndlcrlr porrlbllltt to<br />
lmprov. d.rlgnt,<br />
pritoamtnct?<br />
crD Inl.rlor<br />
the vehicle since it logically follows that if ejection is<br />
prevented it is of no avail if the occupant is subsequently<br />
killed or injured due to the cab crushing.<br />
Therefore, the objective of research on heavy truck<br />
cab structures would be to determine if presently<br />
available cabs could be strengthened practically to<br />
enharrse their ability to protect occupants in noncatastrophic,<br />
yet potentially lethal crash environments.<br />
Excluding those ejected, 20 percent of all fatally<br />
injured combination-unit truck occupant$ are extricated<br />
from their cabs-a surrogate indication that cab<br />
structural integrity is, at least partially, involved.<br />
European (Swedish and ECE) standards exist<br />
which, if applied to U.S. trucks, would result in<br />
incremental strengthening of most U.S. designed truck<br />
cabs. Research is needed, however, to determine if<br />
practical modifications can bc made to U.S. cabs that<br />
F.tlnr Trrrlng llrthodr<br />
Controllfd SlrrlG<br />
Lrborrlort Trrt. Ot<br />
Elilrlng whmlr<br />
a Har.ur. tcrca,<br />
datohrllon<br />
chrrrctrrlrllc., ol<br />
tlatrlfig :h..1 ?lm.<br />
and tun vlrort, dt.h<br />
Dtnalt. alc.
would materially improve the likelihood of saving an<br />
appreciable number ol' victims in typical U.S. truck<br />
crashes, especially rollovers. Limitations and tradeoffs<br />
are inherent in such an endeavor and must be<br />
recognized and acknowledged at the outset. The<br />
program is shown in Figure 9.<br />
Summary<br />
In the U.S., medium and heavy trucks are annually<br />
involved in crashes which result in over 5500 people<br />
Ftan, Ettht^t Ahatrt.a<br />
In-Drpth ACCldanl nacsnriructlon and An.lrtta<br />
a lmprcr lp.cr htg6llud.r<br />
I Olf.clronr In Fhlch torca la aCpttad<br />
a O.h.0r r.v.ilry<br />
r Tr.vh. n.chrnlrmt<br />
a;orc./d.lbctlcn ch}rFh,laltcr lol<br />
vrrlaur dlrrctlOfra ql lorca<br />
Orvrlopnad ol rn lmprova{<br />
C.b Srrccturr<br />
lC9ghlrrnl ol ralchl/ilrrnslt<br />
a cognlrarr ol cs.r lFprrcarrorl<br />
. CoChtrrnt ot nrrd tA daatCn In<br />
arrrh Irol.clro^ lr.lv.ta lor olh.r<br />
fanl{lt. hll by t/!€lr<br />
Figure 9. Truck cab structural integrity research pro-<br />
9ram<br />
<strong>SECTION</strong> 4. TECHNICAL SESSIONS<br />
European Review of Heavy Goods VehicleSafety<br />
L Neilson<br />
on behalf of the Ad-hoc<br />
D.v.lopn.nl ol Slnplltl.d Conponrnl<br />
Lrvrt Labqrrtory Trrta lo.:<br />
a $tructurrr<br />
twtndrhtrtd<br />
r ooor./rlllarlalchl<br />
Group of the European Experimental<br />
Vehicles Committee on Side Impact<br />
Dummies,<br />
United Kingdom<br />
Preface<br />
The Comrnittee of EEVC (European Experimental<br />
Vehicles Committee) decided at their 1984 policy<br />
;<br />
being killed and 170,000 injured. There are many<br />
complex and interrelated rcasons why these crashes<br />
occur, among them being lactors which relate to the<br />
way the vehicles are designed, maintained, and perform.<br />
This paper identifies the key vehicle-related<br />
medium and heavy truck safety issues and briefly<br />
summarizes programs of research to achieve improve-<br />
ments. It is hoped that these research agendas will<br />
serve as blueprints for both industry ald government<br />
efforts to achieve<br />
those improvements.<br />
References<br />
l.<br />
"Heavy<br />
Truck Safety Study", Congressional Report<br />
prepared in response to Section 216 of the<br />
Motor Carrier Safety Act of 1984, P.L. 98-554,<br />
yti::htlt;ck<br />
occupant protection", congressional<br />
Report prepared in response to Section 217<br />
of the Motor Carrier Safety Act of 1984, P.L.<br />
98-554, January, 1987<br />
U.S. Department of Transportation, Federal<br />
Highway Administration Annual Roadside Vehicle<br />
Inspection Reports<br />
Radlinski, R., "Heavy Truck Braking Performance*The<br />
State-of-the-Art in the U.S.", Society<br />
of Automotive Engineers (SAE) Paper No.<br />
870492, t987<br />
Clarke, R.M. and Mergel, J., "Heavy Truck<br />
Occupant Protection-A Plan for Investigating<br />
Ways to Improve It", SAE Paper 821270, 1982<br />
Allison, P. and Tarkir, R., "Heavy Truck Occupant<br />
Restraint Use", Final Report, U.S. DOT<br />
Contract No. DTNH22-80-C-07451, Septernber<br />
1982.<br />
O'Day, J., Ruthazer, R., Gonzales, T., "An 2.<br />
3.<br />
4.<br />
5.<br />
6.<br />
7.<br />
In-<br />
Depth Study of Fire Accident Data" University of<br />
Michigan Transportation Research Institute Report<br />
No's. UMTRI 84-40 (1984), and UMTRI<br />
85-17-r (r985)<br />
meeting that an informal Working Croup on Heavy<br />
Goods Vehicles be set up to consider the road<br />
accident situation in Europe for these vehicles. It<br />
should also report upon the progress being made to<br />
improve the accident avoidance capability of such<br />
vehicles, the protection that would be provided for the<br />
crew ancl the protection that might be possible for<br />
other road users involved in accidents with Heavy<br />
Goods Vehicles. This informal Working Group did<br />
not start work until 1986. It was requested by the<br />
555
main EEVC committee in 1986 that it report in time<br />
to present papers to the OECD Symposium on this<br />
subject in April 1987 in Montreal, Canada and to the<br />
llth <strong>ESV</strong> <strong>Conf</strong>erence in May 1987 in Washington,<br />
D.C., U.S.A. The former objective has not been met,<br />
but the pre$ent report in preliminary form and without<br />
the final approval of the main EEVC cornmittee is<br />
now presented.<br />
The informal group consisted of:<br />
Mr Pullwitt, lBASI, FR Germany<br />
Mr Cesari, IINRETS, France<br />
Mr Fline, IINRETS, France<br />
Prof. Strandberg, lVTl, Sweden<br />
Mr Tromp, ISWOV, Netherlands<br />
Mr Riley, ITHRL, UK<br />
Mr Neilson, ITHRL, UK (Chairman)<br />
<strong>Int</strong>roduction<br />
In several parts of the world there has been<br />
increasing concern about the contribution that Heavy<br />
Goods Vehicles, and similar vehicles designed for<br />
special purposes, are making to the overall road<br />
accident situation. The prcsent study shows that<br />
generally speaking the situation in Europe is somewhat<br />
improving for a complicated set of interrelated<br />
reasons. This report is intended to review the situation<br />
and to discuss engineering means by which the design<br />
of these vehicles can be further improved. This is a<br />
continuing and important objective because in some<br />
countries l.here has been a widespread fear of these<br />
large road vehicles and the accidents and injuries that<br />
they can cause. This has been hindering the development<br />
of road transport and has been leading to<br />
restrictions on the operation of such vehicles in some<br />
places.<br />
Any discussion of heavy commercial vehicles should<br />
start with some definitions about which vehicles are<br />
included and how the sizes are divided up. The<br />
present study is concerned with Heavy Coods Vehicles<br />
and this excludes light goods vehicles, bus and<br />
coaches and misccllaneous large vehicles which do not<br />
carry goods. The point of division betweerr light and<br />
heavy is not the same in different countries in Europe<br />
ancl varies between about 3.5 and 7.5 tonnes Gross<br />
Vehicle Weight. Taking the lower limit, HGVs are<br />
about 390 of the vehicle population, but they may<br />
cover 890 of the distance. Othcr large and specialist<br />
vehicles which do not carry goods are an addition to<br />
the number of vehicles, but they appear to have a<br />
much lower involvement rate in accidents presumably<br />
because these vehicles cover much shorter distances<br />
each year. The following section gives an indication of<br />
the part that Heavy Goods Vetricles play in the overall<br />
road accident pattern in one country. It is mostly<br />
based on the accident statistics for Great Britain.<br />
656<br />
EXPERIMENTAL SAFETY VEHICLES<br />
The Accident Situation in General<br />
Terms<br />
The Heavy Goods Vehicle fleet in Europe may be<br />
made up of about 600/o two axle rigid trucks, l09o<br />
rigid trucks with more than two axles and 3090<br />
articulated or full trailer vehicles. The traffic and<br />
distance travelled by these vehicles has been increasing<br />
slowly during the past ten years with the rather<br />
variable economic situation and the increasc may be<br />
only about l5Vo over that period. However in some<br />
countries their involvement rate in accidents per<br />
distance covered has dropped by almost a third and<br />
the fatal injury rate for their drivers by a larger<br />
amount (possibly this has almost halved). These<br />
reductions are additional to the rather similar large<br />
reductions which occurred in the previous ten year<br />
pcriod up to about 1975.<br />
Almost all casualties in accidents involving HGVs<br />
are to other road users rather than to the drivers and<br />
passengers in them. These casualties are mostly divided<br />
between car occupants, riders of two wheelers<br />
and pedestrians with the HCV occupants accounting<br />
for only about a tenth of the total. The implications<br />
of this situation are discussed later on in some detail.<br />
For example, it has been noted that a proportionally<br />
large number of latal pedestrian casualties occur in<br />
accidents involving articulated vehicles. Presumably it<br />
is the sides of these vchicles which cause additional<br />
fatal injuries.<br />
Most HGV accidents leading to fatal injuries to<br />
their occupants occur away from built-up areas but<br />
for those injuring other road users perhaps a third<br />
occur in built-up areas. lt is noteworthy that most<br />
fatal accident$ outside built-up areas occur on the<br />
main roads, whereas in built-up areas there are a<br />
surprisingly large number on minor roads, It is the<br />
larger vehicles within the HGV category which have<br />
many of their accidents outside built-up areas and the<br />
two axled vehicles which have relativcly more accidents<br />
in town$. Another way of corrsidering risks to<br />
HGVs on the different roads is to compare their<br />
accidcnt rates per distance travellcd. By this measure,<br />
if the rate fbr roads outside towns is taken a$<br />
standard, then the ratc on Motorways is about a half<br />
of that, but the rate in towns is only slightly higher<br />
thart outside them.<br />
About half of the accident$ to HGVs occur at<br />
junctions, but with rather fewer at junctions tor the<br />
largest vehicles, It is these vehicles which have rather<br />
more accidents away from junctions and this largely<br />
accounts for the diff'erence. Skidding of HCVs tends<br />
to be reported when control is lost of vehicles and<br />
they depart from their intended path. lt is also<br />
reported when tyre marks are deposited on thc road<br />
surface. A half of reported skidding accidents occur<br />
on wet roads, but there are almost a$ many in dry
conditions. In most countries the totals in snowy and<br />
icy conditions are relatively small.<br />
Road accidents occur in many different circumstances.<br />
A comparison with the manoeuvres of cars<br />
before accidents shows that HGVs have relatively few<br />
accidents, presumably because their drivers are professional.<br />
They have particularly few when waiting but<br />
held up, when turning to the offside and when just<br />
going ahead. However for accidents when going ahead<br />
at bends when overtaking, when changing lanes, when<br />
reversing and when parked, their accident rates approach<br />
those for cars. These findings rather suggest<br />
that HGV drivers have real problems in seeing obstacles<br />
and other vehicles but not when turning across<br />
traffic at junctions because they have a good view to<br />
the ofl'side.<br />
The main sections of this report now lollow. There<br />
is a detailed comparison between the accident statistics<br />
for several European countrie$. Then there is consideration<br />
of the rernedial measure$ lor HGVs which are<br />
becoming available ctr which appear to be required.<br />
Firstly there are accident avoidance features such as<br />
improved braking. Then there is a section on protective<br />
measures. This is divided between protection for<br />
the occupants of HGVs and protection for all other<br />
road users likely to be involved in accidents with<br />
HCVs.<br />
Accident Situation<br />
For a comprehensive assessment of the European<br />
accident situation involving heavy goods velticles<br />
(HGV), it is nccessary to come to commou definitions<br />
of HGV weights, sizes and other aspects.<br />
It is reasonable to use already existing common<br />
definitions as far as available, e.g. withitr the Directivcs<br />
of EEC, where r-rrtil'orm definitions for HCV<br />
sizes, weights and axle loads will become effective<br />
gradually by l99l (85/3/EEC).<br />
This report discusses only vehicles for the transport<br />
of goods with a gross weight of more than 3.5 tonne$.<br />
As far as possiblc the corre$ponding figures for<br />
different countries are split up in this way. Figures for<br />
buses and in special cases for cars too, should<br />
underline the comparisons for specific situations for<br />
HGVs.<br />
In Appendix I a detailed comparison is given<br />
between the national regulations of Great Britain and<br />
Germany. The use of the international provided rules<br />
shows that in geueral r-rc'.rrly the same differences exist<br />
between the classes of speed limits and driving licences.<br />
In Creat Britain there is a more varied<br />
classification for HGV licences and there are higher<br />
maximum speed limits for HGVs. ln ordcr to compare<br />
the accident situation in the European states<br />
contributing to this report, it would be necessary to<br />
consider details of the relevant figures and of accident<br />
<strong>SECTION</strong> 4. TECHNICAL SESSIONS<br />
rates and special accident risks. In Table I a comparison<br />
is made over eight years of European figures for<br />
registration and rnileage of HCVs (gross weight over<br />
3.5 tonnes) to give some information about the<br />
increasing presence of HGVs on European roads.<br />
The trend of slight increasing figures of usage is<br />
combined in ncarly all countries with dccreasing<br />
accident figures. This reflects in principle the eft'ectiveness<br />
of rules and regulations in the area of road<br />
and road equipment, training and monitoring of the<br />
drivers, the regulations for vehicle design and its<br />
supervision.<br />
ln Appendix 2 a review is made for Great Britain<br />
and Germany about the development of national<br />
roads with reference of increasing length and width of<br />
different road categories. These figures show a further<br />
possible reason for the decreasing number of accidents,<br />
namely the increasing length of Highways and<br />
Motorways and the widening of other roads.<br />
There is also the possibility of a great influence of<br />
technical improvements made on HGVs and of obligatory<br />
technical inspections upon thc accident figures.<br />
Technical improvements for safety are di$cussed later<br />
in this report. In Reference 3 and Appcndix 3 some<br />
European figures are available for an estimation of<br />
the technical inspections made on HGVs which suggest<br />
that in Germany the number of dcfects found on<br />
trucks has declincd, although this has not happened<br />
for cars.<br />
All those important factors of road traffic in the<br />
countries considered cannot give a complete reason<br />
for the common trend of decreasing figures of fatalities<br />
and injurcd persons, as showtr in Table 2.<br />
Other road users are endangered to varying extents<br />
by trucks in the event of accidents. This circumstance<br />
can be studied in Table 3, where the fatalities are<br />
shown by category of road users in HGV accidents in<br />
a European comparison. The largest trumbers oI<br />
persons killed in the countrics listed are in accidents<br />
of HGVs versus cars; this is certainly caused by the<br />
great number of cars in traffic. But there are obvious<br />
diflerences between France and Sweden on one side<br />
and Great Britain and Cermany on the other. In<br />
France and Swedcn with a greater amount of traffic<br />
outside built-up areas it seems to be that accidents of<br />
HGVs versu$ cars produce injuries of greater sevcrity;<br />
the lack of figures for comparisotr does not allow a<br />
more concrete statement. The same circumstances<br />
probably give a reason for the low percentage of<br />
injured HGV occupants in Germany in comparison<br />
with the others.<br />
For Germany the low figures of injured or killed<br />
HGV occupants might be also founded on the high<br />
mileage on highways and the high safety level of such<br />
roads.<br />
657
Table 1. HGV populatlon and dlstances travelled<br />
Coun try Gross weight = 3,5 t<br />
Frrnce Iruck s<br />
Roed User I<br />
(Rieid)<br />
Tractor s<br />
(Articulated<br />
Vehicles<br />
)<br />
Gemany Truck s<br />
Great<br />
Eritain<br />
SYeden<br />
(R19id)<br />
T rdc to rs<br />
(Artlculated<br />
Vehicles)<br />
Iruck g<br />
(Rield)<br />
T ra c tors<br />
(Articuldted<br />
Vehicles)<br />
,or, t<br />
Indication<br />
Number of vehicles<br />
Di s idnce travel led<br />
(i{ill. km)<br />
Number of vehicles<br />
Distance treYelled<br />
(Mill. kn)<br />
l{umber of vehicles<br />
0lstrnce trtvel led<br />
(t'lill. kn)<br />
Number of vehicles<br />
0istdnce travel led<br />
(Htll. kn)<br />
llunber of Yehlcles<br />
Distence travel led<br />
(tllll. lnr)<br />
Hunber of vehlcles<br />
0istance trrvel led<br />
(t'ti<br />
l l, km)<br />
l{umber of vehicles<br />
0istdnce trrvel led<br />
(llill. km)<br />
EXPERIMENTAL SAFETY VEH ICLES<br />
I - . .<br />
with or without trailers (semi-trailers),<br />
estimated on lst January, 1985.<br />
I 976 l9 78 1980 I 98? I 981<br />
501 746<br />
ll 189<br />
130 105<br />
3 657<br />
433 3oo<br />
ll 396<br />
lo? Bbo<br />
5 477<br />
6l? 221<br />
13 825<br />
I47 629<br />
3 689<br />
345oIq<br />
* Motor HGVs (not trailers) with maximum permissible<br />
gross weight above 35OO kg, registered on Ist January.<br />
The proportion of killed pedestrians is nearly the<br />
same in Great Britain, Sweden and Germany but in<br />
France it is clearly lower. Compared with Germany<br />
and Sweden and to a le$ser extent in Great Britain the<br />
percentage killed of the unprotected road users is very<br />
low in France-but here we have the highest absolute<br />
number l'or motorized two-wheeler riders killed.<br />
ln the Nordic countries the accident risk increases<br />
more for HGVs than for cars when the road surface<br />
becomes more slippery. Snow or ice is a major<br />
environmental factor also in absolute figures, since it<br />
was present in about every second HGV accident<br />
during a whole year period according to data from the<br />
Swedish National Road Administration. It can be<br />
assumed for HGVs that the low coefficient of friction<br />
and the inferior yaw stability in association with poor<br />
brake force distribution causes an overrepresentation<br />
in accidents on slippery roads.<br />
The problem of inferior yaw stability is also a<br />
problem in France, where a lot of traffic is on roads<br />
with insufficient width for driving manoeuvres. In the<br />
United Kingdom there is more concern about the<br />
braking power available on wet roads at high speeds<br />
but irccidents on urban roads are also important.<br />
658<br />
384 8oo<br />
ll 164<br />
lo4 goo<br />
5 953<br />
207 obI<br />
t2l 893 r33 4?6 '<br />
559 169<br />
ll 765<br />
l7l 143<br />
3 9t4<br />
374 9oo<br />
lo 455<br />
99 7oo<br />
5 4t4<br />
t9 o79 8? 016 83 3?t<br />
? 8o5<br />
640 ??l<br />
l3 509<br />
l8B 400<br />
4 65/<br />
l4 7 4oo<br />
lo 425<br />
88 loo<br />
5 569<br />
6?t 531<br />
l3 ll4<br />
209 179<br />
4 89t<br />
3{6 5oo<br />
lo 38?<br />
90 7oo<br />
6 o2?<br />
82 464 85 609<br />
In Germany serious problems are given by the<br />
possibility of high speed driving on highways (Autobahn).<br />
Investigations of BASt in 1985 give some<br />
figures for the speed of HGVs. The background for<br />
these measurements was equally in relation to roads<br />
and road equipment, traffic volume and so on. The<br />
Investigationl resulted in tbllowing figures: l69o of all<br />
HGVs drove within the allowable speed of 80 km/h,<br />
about 6090 had a speed between 80 and 90 km,/h,<br />
2090 were measured with a speed between 90 and 100<br />
km,/h and TVo ran over 100 km/h. Almost every<br />
fourth HGV was faster than 90 km/h.<br />
In connection with inclemency of the weather this<br />
high speed level can cause several accidents with a<br />
large number of vehicles involved, as occurred in<br />
Germany in 1985.<br />
Safety Measures<br />
As pointed out above, official statistics from many<br />
countries indicate that Heavy Goods Vehicles are<br />
overrepresented in fatal accidents. In fact, the absolute<br />
numbers of fatalities involving HCVs are alarming<br />
enough to motivatc special research on this<br />
category of vehicle and road user.
Table 2. Comparlson of eccident flEures In Europe<br />
<strong>SECTION</strong> 4. TECHNICAL SESSIONS<br />
3oun t ry Iddicrtlon t976 t978 | 980 | 98? ' 984<br />
Fra nce<br />
Germilny<br />
Gred t (l<br />
Eritdln't<br />
St*den<br />
Accidents Hlth<br />
personrl lnJurles<br />
HGVs lnvolved<br />
Fatrl i ties<br />
HGVs involved<br />
lnJured occupnntg<br />
l6Ys involved<br />
Accidents Hlth<br />
personrl inJurles<br />
HGvrll lnvol "ed?l<br />
ACcldents Hr th<br />
fatalltles<br />
,tGYsl) invol vedl I<br />
ACCTOenE lnv0,Ytn9<br />
rerlous rnd slight<br />
injury<br />
i.tcvrll involveo?l<br />
Acc i denti Yi th<br />
persgprl inJuries<br />
HGVrU inYolvedcl<br />
Accidents rt th<br />
fdtdl ltler<br />
HGYs ll i nvol vedd<br />
Accident involving<br />
serlor.lr rnd rl ight<br />
ln lury<br />
xGls rl Invot ved?l<br />
Nurber df dccidentl<br />
Yl th I nJuri er<br />
trr:v.lli.u^t'oa4l<br />
luntrcr of rccldentg<br />
ri th frtrl I tlei<br />
tGvsjl lnvolved<br />
359 694<br />
?7 qlA<br />
t3550<br />
I 7tE<br />
146 t44<br />
?5 223<br />
380 35?<br />
lf All HGYs rithout reight llnlt (ln GB, goodr vehlcler grertcr than 1,5 tons<br />
unladen weiqht)<br />
21 0nly dccldents ylth odr rnd t|f Otrtiet Inyolved<br />
3) HGY rlth mrxirun pernlrsr$lr Gross Vehlclr tlrlght rbovc 3,500 tg<br />
4l lluntcr of Involved (not only prlnrrlly) vehlclrg<br />
5| Engl5nd, Scotlrnd and Yrler snly (dorr not lncludG llothern Irrlrnd)<br />
6) Thesr trt nunters of dccldrntt lnvolvlng HGYr<br />
379 ?35<br />
?R t ol 26 ?97<br />
t3 368 tl 9tt<br />
355 984<br />
26 455<br />
258639 ?64 769<br />
rl<br />
t1 F00', r3 858<br />
6 006 6 30f<br />
llo6l 752<br />
?526t3<br />
t58 465<br />
tl<br />
ll<br />
030<br />
041<br />
I ?88<br />
I 035<br />
Though a general decline may be found in the total<br />
number of traffic accident fatalities. the relative<br />
aggressiveness of HGVs (when compared to cars or<br />
other motor vehicles) seems to be comf)aratively<br />
constant. In fact, data from a U.S. review 1985, "Big<br />
Trucks". from the Insurance Institute for Highway<br />
safery, llHS (waterBate 600, washington D"c.) exhibit<br />
a slight increase of HGV aggressiveness in the<br />
last decade: "ln 1977, a car occupant was 26 times<br />
more likely than a truck occupant to be killed when<br />
the two vehicles crashed. Now the ratio is 35 times<br />
more likely."<br />
During the last decades, some international seminars<br />
and multilateral reviews have been devoted particularly<br />
to HCV safety, for instance by HSRI (1975,<br />
later University of Michigan Transportation Research<br />
Institute UMTRI, Ann A,rbor), OECD (1977), and<br />
l8t<br />
r3 r06<br />
l5 0?8<br />
I t{5<br />
9t I<br />
l6?<br />
I 454<br />
361 3?4<br />
?4 ntr<br />
?52 J00<br />
lt 4l/<br />
5 550<br />
6?l<br />
?46 710<br />
t0 791<br />
r5 ?3t<br />
I t3e<br />
755<br />
tzl<br />
?.23l5? 20? 0t5<br />
il 509<br />
r2 102 il 685<br />
I t73<br />
3r?8?Z 284 905<br />
358 593<br />
22 764<br />
t0 581<br />
L z?3<br />
3{E a<br />
?l 011<br />
?55 980<br />
r0 $89<br />
5 441<br />
620<br />
?50 533<br />
I 969<br />
t5 288<br />
I 0t9<br />
681<br />
l15<br />
t5 27?<br />
159 485<br />
]7 Anl<br />
I t04<br />
I I ll<br />
J5U t6t<br />
?l 7?8<br />
?53r83<br />
t0 t7l<br />
5 t38<br />
591<br />
?48 015<br />
I 580<br />
t6 531<br />
I n17<br />
OECD (1983). More recent studies on HGV safety<br />
have been (NHTSA, 1986) and will be published by<br />
the National Highway Traffic Safety Administration<br />
(NHTSA), since 1985 arranging a special session on<br />
HGVs in its bi-annual Technical <strong>Conf</strong>erences on<br />
Experimental Safety Vehicles (<strong>ESV</strong>).<br />
The operating conditions of HCVs are quite different<br />
from light road vehicles. In addition, the great<br />
dimensions and great (variations in) weight of HGVs<br />
have lead to design principles deviating substantially<br />
from cars. Many of these HCV peculiarities deteriorate<br />
their safety perfbrmance to an extent that probably<br />
would not be tolerated in more commonly known<br />
road vehicles.<br />
Safety-related quantities and possible technical<br />
countermeasures have been studied experimentally,<br />
and sometimes in real traffic, by a number of<br />
ltl<br />
il9<br />
6s9
Table 3. Caeualtles In aceldents involvlng HGVs<br />
Country Sever{ ty<br />
of<br />
I nj ury<br />
Frenct fatrl<br />
Ser i OUS<br />
5light<br />
Gennrny fatal<br />
ser10u5<br />
slight<br />
Grea t<br />
Eritdin<br />
fatal<br />
serlous<br />
sl ight<br />
s*eden?)3) fatal<br />
serious<br />
sl iqht<br />
pedes*rrns<br />
r pedrr<br />
cy(lrsti<br />
I<br />
EXPERIMENTAL SAFETY VEHICLES<br />
l) HGV<br />
vtth edch gross relght. excluding accidents rith more then tHo ptrt{cg {nvolved.<br />
Number<br />
of k{lled persont ld ecciderttslhere " goods yehlcles (imesptctlve of r.eight)<br />
rrra J) prinar'lly lnvolyed during lg85 .<br />
4)ln eccldents involvlng lGVs over 7,5 tons grosr Hetght.<br />
, ;:"::,.r';:::''"' I rcy r<br />
tHo-wheele'5l occuoants occunrnts<br />
'rhers I rot.r (roorl<br />
I<br />
|<br />
I I<br />
No t l{0. T llo. Ho_ t llo. I l{0 t<br />
I44 I,l 79 4,5 176 9.9 Ir54 65.1 159 9,0 6l 3,4 tTtJ<br />
t76<br />
to4<br />
8s5<br />
104<br />
261<br />
463<br />
td \<br />
q R<br />
5,0<br />
tq r<br />
8,0<br />
167<br />
803<br />
l5l2<br />
$z<br />
184<br />
366<br />
t1 A<br />
ll,2<br />
A A<br />
7,5<br />
4.1<br />
ll9<br />
I 058<br />
t724<br />
84<br />
'lql<br />
526<br />
investigators in Europe. Below, a few of them will be<br />
ref-erred to directly or indirectly. However, in the<br />
EEVC HGV Working Croup we hope that our<br />
unintended ignorance of other studies will stimulate<br />
the investigators in question to contact EEVCrepresentatives<br />
and to submit papers to the HCV<br />
session in future <strong>ESV</strong> conferences.<br />
Accident Avoidance<br />
Involved Institutions. ln the HGV session of the tenth<br />
<strong>ESV</strong> <strong>Conf</strong>erence 1985, original research results on<br />
HGV and bus accident avoidance properties were<br />
presented from European institutions such as: TUV<br />
Rheinland (Institute for Traffic Safety) in FRG;<br />
Renault Vehicules Industriels in France; Cranfield<br />
Impact Centre in U.K. From other publications it is<br />
known that important experimental research on the<br />
active safety of HGVs also has been conducted<br />
recently: in FRG at TUV Essen and at the Technical<br />
Universities of Aachen, Berlin, Braunschweig, and<br />
Hannover as well as at HUK-Verband (insurance<br />
company cooperation) in Munchen and at Daimler-<br />
Benz; in the Netherlands at the Technical University<br />
of Delft; in Sweden at Road and Traffic Research<br />
Institute (VTI, S-58101 Linkoeping).<br />
Analyses of HCV active $afety problems in real<br />
accidents have been reported by TRRL (Transport<br />
and Road Research Laboratory) and by MIRA (The<br />
Motor Industry Research Association) in U.K. as well<br />
as by the VTT (Technical Research Centre) in Finland<br />
through their Road Accident Investigation Teams.<br />
660<br />
il,5<br />
14.9<br />
10. t<br />
l?,2<br />
ll.7<br />
6.2<br />
618<br />
1Rfr7<br />
ll3?4<br />
1qt<br />
I 589<br />
4487<br />
5I,0<br />
53,9<br />
65, I<br />
5l,l<br />
50,4<br />
s?,9<br />
70<br />
481<br />
I0?9<br />
56<br />
517<br />
I 589<br />
q F<br />
6,7<br />
5.0<br />
I,l<br />
l5 ,4<br />
I8, 7<br />
4l<br />
?55<br />
655<br />
4l<br />
?9e<br />
l0$0<br />
3,4<br />
3,6 1,8,iiiiii<br />
5,0<br />
n q<br />
l?,4<br />
4)<br />
589<br />
4)<br />
ll49<br />
848 I<br />
1l<br />
2l I4,4 l7 Il,6 J 3.4 8l 55.s ?I? t{,4 I 0,t 146<br />
Accident avoidance contributions to the HGV session<br />
of this llrh <strong>ESV</strong> <strong>Conf</strong>erence have been submitted<br />
also by Union Technique de I'Automobile, du Motorcycle<br />
et du Cycle in France and by the Institute of<br />
Technology in Darmstadr, FRC.<br />
Literature references and additional hints on European<br />
HGV research into the active safety area may be<br />
found in a state-of-the-art survey by Vlk (1985, lnt. J.<br />
of Vehicle Design, vol. 6, no. 3, pp. 323-361) from<br />
the Technical University of Brno in Czechoslovakia.<br />
Experimental studies ancl theoretical analyse.s have<br />
revealed numerous accidenl avoidance problems re-<br />
Iated to the HCVs themselves and their load. Hence,<br />
it is essential to identify more precisely the vehicle<br />
design and operation variables decisive of HCVs'<br />
active safety. Such variables have been listed in<br />
numerous studies, and some of them will be elaborated<br />
on below. {See OECD papere by Strandberg,<br />
le87)<br />
Yaw Stability of Articulated Vehicles in Non-Braking<br />
Situations. The deteriorating influence on yaw stability<br />
fiom articulation was investigated in full scale<br />
driving experiments, computcr simulations and theoretical<br />
analyses irr lhc early '70s at the Sweclish Road<br />
and Traffic Research Inr;titute, VTl. Though articulation<br />
has been introduced in HGV design to improve<br />
the manoeuvrability and decrease the inwards offtracking<br />
at low speeds, it was f'ound to impair the<br />
handling properties and to increase the outwards<br />
oft-tracking at highway speeds, when the sicleslip<br />
angles no longer may be neglected. See fig. I. Safety
Side<br />
Sidesl ip<br />
il',='V<br />
fi<br />
0,4<br />
tllil ililt l|tl<br />
ijlj" ull L]lil -U<br />
70 kn,rh<br />
0,3<br />
t,2<br />
t,l<br />
f# '!ll<br />
1l<br />
-{l,l<br />
'7jfun/tt1<br />
<strong>SECTION</strong> 4. TECHNICAL SESSIONS<br />
- u,4<br />
Figure 1. Sldeelip angle peaks for dlfferent axles of a<br />
single trailer (two articulations) and a double<br />
trailer (three artics) HGV with the same<br />
overall length {24m} when making a double<br />
lane change manoeuver. The lateral acceleratlon<br />
at the mass centre of the truck or<br />
tractor was 1.75m/s' and independent of<br />
epeed. The scale for Side Force Coetticient<br />
(side force divided by normal force) is an<br />
approximate average for tyres and loads<br />
typical for these HGVs as measured on wet<br />
asphalt. Computer simulation data lrom<br />
Nordstrdm, Magnusson, Strandberg (1972,<br />
VTI report no. 9)<br />
h I<br />
G<br />
tr o<br />
E<br />
o<br />
e-<br />
E<br />
3.t<br />
t.0<br />
2.5<br />
t.0<br />
1.5<br />
r.0<br />
0.5<br />
0<br />
$lnglr<br />
Unlt<br />
measures in this context have been experimented with<br />
by Woodrooffe, Billing, Nisonger (1983, SAE paper<br />
83 r r 62).<br />
Though tlre lateral friction utilizatinn (or Side Force<br />
Coefficient, SFC: Side Force divided by normal<br />
force) in fig. I is at a moderate level for the triple<br />
artic tractor, the rear wheels are skidding at 90km/h<br />
with a SFC close ro the coefficient of I'riction for the<br />
actual road surface. During this kind of manoeuvre,<br />
very light braking may cause sudden and sevcre<br />
skidding at the rear end of the vehicle combination.<br />
Similar results were arrived at with experimental<br />
research also at the University of Michigan Transportation<br />
Research lnstitute (UMTRI, previously HSRI)<br />
and are supported by others according to the above<br />
mentioned survey by Vlk (1985), who reviewed 70<br />
articles on the handling performance oI truck-trailer<br />
vehicles. These experimental evidences are now supported<br />
by the novel results from a case-control study<br />
of HGV acciclents<br />
by Stein and Jone$ (1987) in fig. 2.<br />
Yaw Stability During Braking. According to schematic<br />
descriptions of tyre force characteristics, eq. I expresses<br />
the approxirnate relationship between Coefficient<br />
o[ Friction (CoF) and the maximum available<br />
(due to road friction) Br aking Force Coefficient<br />
(BFC = braking force divided by normal force) and<br />
Involvement<br />
of Trucks In Slngle Vehlcle<br />
Crscher by Truck <strong>Conf</strong>lguratlon<br />
Tractor-<br />
Trrilrr<br />
Truck-<br />
Trellrr<br />
'frrilo ol lruck crtrh lfiwlvrfiffit pf.Etnt|ef lo cofhprflron ||mplr F.|E.nl|g..<br />
lflarlarn<br />
Ooublr<br />
Flocly<br />
Mounlrln<br />
Doubfr<br />
Figure 2. Involvement of HGVs in single vehicle crashes by HGV configuratlon. Data lrom 222 HGVs involved in<br />
slngle accidents end from 666 comparleon HGVs. From "Crash Involvement ot Large Trucks by<br />
<strong>Conf</strong>iguration: A Case-Control Study" by Howard S. Stein and lan S. Jones (January 1987) with kind<br />
permlssion from Insurance Institule for Hlghway $afety, Watergate 600, Washlngton, DC 20037<br />
661
Side Force Coefficient (SFC). It is often visualized as<br />
the so called friction circle.<br />
BFC2 + SFC2 < CoFz<br />
EXPERIMENTAL SAFETY VEHICLES<br />
(1)<br />
Due to the great rearward amplification of the SFC<br />
in a manoeuvering artic (see I1g. l), very small<br />
braking I'orces may then lock up the rear wheels and<br />
result in severe skidding, since the tyre force direction<br />
becomes indefinite when the unequality in eq. I<br />
approaches equality. The necessary side force for yaw<br />
stability is then no longer available. On icy and very<br />
slippery roads, skiddine and iackknifc accidents may<br />
be initiated also by traction or retarder forces.<br />
Skidding will occur even during straight driving, if<br />
the wheels at some vehicle end are braking too hard in<br />
relation to their load. This will bring the BFC too<br />
close to the CoF. Therefore, the driver has to restrict<br />
the brake pedal force below the level where the least<br />
(relatively) loaded wheels lock up. If no load'<br />
compensating device is installed, Table I demon$trates<br />
that the non-locking braking distance will increase<br />
more than twice when only the trailer has been<br />
unloaded.<br />
In Table 4 it is assumed that the brake force<br />
distribution is constant and adapted to the maximltm<br />
permissible gross wcight in Sweden, where no dcvices<br />
are required for load compensation of the braking<br />
torque. Initial speed: 20m/s or about 70km/h. Winter<br />
road with CoF:0.2. Dynamic load transfer neglected'<br />
These examples of unloading will lead to trailer<br />
wheellock if the braking force exceeds 2590 of the<br />
value, possible to apply at full load.<br />
Brnking Performance of HGV Combinations in Traf'<br />
fic. The handling and stability of HGVs is particularly<br />
poor during braking. Thereforc, a case-control study<br />
(similar to the above mentioned by Stein & Jones,<br />
1987) in the four Nordic countries was opened during<br />
1986 with measurements of decisivc quantities in the<br />
air brake systems and of the braking characteristics of<br />
H(iVs. In cach country, 100 HGV-combinations were<br />
randomly selected from the normal traffic flow on<br />
suitable roads.<br />
Data for Sweden, now being analyzed, indicate that<br />
quite a large proportion of the HGV-combinations in<br />
u$e are unable to reach the minimum deceleration<br />
performance required in legislation, i.e' 5mls2 with<br />
available air pressure when fully loaded' Wheel-lock<br />
and corresponding skidding tendencies (or excessive<br />
braking distances) seem to tre another major problem<br />
in Sweden, where no devices are required for load'<br />
compensation of the braking torque, Out of 100<br />
combinations investigated, 75 were completely without<br />
such equipment.<br />
In fig. 3 the deceleration values measured on these<br />
HGVs have been transformed to the corrcsponding<br />
braking distance fiom 70km/h at maximum control<br />
pres$ure (6bar). So have the Swedish deceleration<br />
requirements for HGVs and for cars. Cars are required<br />
to decelerate 5.8m/s2 without any wheelJock,<br />
and the rear wheels must not lock before the front<br />
ones between 5.8 and 8.0m/s2. HCVs must have<br />
brakes capable of decclcrating the fully ladcn vehicle<br />
at 5.0m,/s2 (from 60km/h). However, the Swedish<br />
rules corresponding to the ECE corridors (restricting<br />
the deceleration-pressure ratio in both directions) are<br />
rarely checked since the announcement of the general<br />
exemption from load sensing valves in the early '70s.<br />
More distinct and general conclusions may be<br />
drawn later in 1987, when data from all participating<br />
countries are available for analysis. Deceleration performance<br />
and skidding tendency will be quantified<br />
and compared between the four countries. Substantial<br />
differences in these qualities are expected, since very<br />
few Swedish HCVs have load compensation, while<br />
many Finnish ones have manually controlled pressurereduction<br />
valves, and while Danish and Norwegian<br />
legislation requires automatic load scnsing valves.<br />
Practical valve problems have been reported, and the<br />
outcome of the comparisons between countries seems<br />
diftlcult to predict.<br />
Characteristics of HGV Air Brakes Impairing $afety'<br />
Apparently, HGV braking properties are even more<br />
inferior to that of the cars than what the (quite<br />
moderate) demands in legislation permit. This inl'eri-<br />
Tabte 4. Non-skidding braking distances with ditterent loading on a typical HGV (such as the truck-trailer in fig'<br />
1a) without load sensing valves<br />
Loacl i ng<br />
cond i t ion<br />
Both loaded 6<br />
Both empty 5<br />
Tra i ler ernpty 6<br />
Tr.bogie unload 5<br />
!rpl,ghF*E*-a!"-_9he..di-Lf ere-ng-Bxle-q-*.LHnsesI<br />
Truck Truck Truck Trailer Trailer<br />
Lrs_ut Dr_i_ve ftajljlog Er-o-n! Eo.+i-e-<br />
I<br />
6<br />
I<br />
I<br />
I<br />
uP=o<br />
I<br />
I<br />
1 n<br />
2.5<br />
2.5<br />
10<br />
I6<br />
4<br />
4<br />
4<br />
Gross<br />
lve i qht<br />
(Esnne*s_)<br />
48<br />
17.s<br />
28.5<br />
36<br />
Braking<br />
Force Distance<br />
H.E,*<br />
1001<br />
fiNJ<br />
100<br />
25% 175<br />
zsB ?38<br />
25?. 300
CARS WITHOUT }.IHEEL-LOCR<br />
I4AXII4UH ]] H<br />
CARS FRONT I.IHEEL-<br />
LOCK ACCEPTED,<br />
ltHE E L* LOC K<br />
NO WHEEL-<br />
LOC K<br />
20 l0<br />
50 60 70<br />
HFV:S IRRESPECTIVE<br />
OF WHEEL-LOCK,<br />
|4ax 38 r-r<br />
<strong>SECTION</strong> 4, TECHNICAL SESSIONS<br />
f<br />
SWED I SH<br />
LEGISLATION<br />
LIMITS<br />
80 90 100 r10<br />
LOAD NEIGHT OF HFV-COHBINATION<br />
I GREAT El MEDtuM Etl<br />
Figure 3. Dlstribution of estlmated non-locking braklng sistance$ trom 70km/h ln a sample of 75. HGV trailer<br />
combinations (without load sensing devices). Random selection from the trafflc on suitable roads in<br />
Sweden 1986- Pretiminary results. Estimale based: (back row) on the smallest recorded deceleration at<br />
wheel-lock or (front rowj on extrapoletlon to 6bar contlol pressure from recorded decelerations in<br />
drivlng tests at 3ber and at 4.5bar, if no wheel-lock was detected<br />
ority in deceleration performance and in wheel-lock<br />
resistance (i.e. yaw stability) may be considered a<br />
natural consequence of contemporary air brake design,<br />
if not equipped with wheel speed sensors of the<br />
anti-lock type. These unwanted characteristics deteriorate<br />
the control accuracy and delay the response of<br />
the brake system, thereby reinfbrcing its open-loop<br />
nature.<br />
Most of the transient and steady-state deviations<br />
(from the ideal and theoretical relationship between<br />
the control air pre$Iiure and the Braking Force Coefficient<br />
at every wheel) attenuate the brake torque.<br />
Therefore, insufficient deceleration performance may<br />
be seen as a secondary consequence of the great brake<br />
force variations within and between wheels. Consequently,<br />
it secms more appropriatc to reduce the<br />
brakes' sensitivity to varying operating conditions,<br />
and to improve the control sy$tem properties than to<br />
increase their peak force and to introduce mtrre valves<br />
or open-loop components.<br />
A list of sal'ety impairing characteristics particular<br />
tor HGVs and air brakes is given below without any<br />
rank order. Apart from by national governmental<br />
bodies, many of these problems are considered by the<br />
Economic Cornmission for Europe, Croup of Rapporteurs<br />
on Brakes and Running Gear (ECE-CRRF), bv<br />
the Society of Arttomotive Engineers (SAE), and by<br />
the <strong>Int</strong>ernational Organisation for $tandardization<br />
(ISO/TCZ2/SC9). An overview of the teclttrical and<br />
committee work issues in this context was made by<br />
Nordstrcim (1983, VTI report no. 257).<br />
a) Air brakes have substantially longer response<br />
times than hydraulic brakes, due to the compressibility<br />
and comparatively low wave propagation velocity<br />
of air. In addition, HGVs have long expandable air<br />
hoses and a long distance from the control valve at<br />
the brake pedal to the larthest wheel brake chamber.<br />
The maximum permissible response time for the worst<br />
brake chamber in the trailer is 0.8s according to the<br />
Swedish regulations (corresponding to ECE no. l3).<br />
b) A number of pressure modifying valves, air lines,<br />
and connectors may be installed by one (e.g. a trailer)<br />
designcr in a way that was not predicted by another<br />
(e.9. the axle-designer).<br />
c) To reduce the brake wear of their own vehicles,<br />
it is said that sonle owner$ install optional valves at<br />
the air coupling; thc truck/tractor owners enhance the<br />
pressure to alien trailers; and the trailer owners<br />
attenuate it.<br />
d) Many sequential brakings may consume air to<br />
such an extent that the spring brakes are automatically<br />
applied, which may cause surprising wheel-lock<br />
and dangerous skidding.<br />
e) Load sensing valves of the mechanical type<br />
(transforming axle suspension Inotions to pre$sure<br />
reductions), if mounted, are often partially or complctely<br />
out of order due to their tough operating<br />
conditions. Many types are not designed to change<br />
their pressure input/otttput ratio quickly enough upon<br />
dynarnic load transfer, which may be substantial with<br />
high and short vehicles.<br />
663
fl The brake chambers are not linear (pressure to<br />
force) transducers. When the diaphragm stroke and<br />
push-rod travel becomes long at solne wheel, the force<br />
declines without any easily visible indication to the<br />
driver.<br />
g) Since a brake lining may be "glazed" and lose<br />
much of its friction when its brake power dissipation<br />
is small in a number of brake applications, anti-lock<br />
brakes seem more favourable than load sensing valves<br />
even in this respect.<br />
h) The trailing shoe is particularly susceptible to<br />
glazing, since the lcading shoe makes more of the<br />
braking work l'rom thc beginning. Differences between<br />
the leading and trailing shoes may therefore be<br />
exaggerated, making the whole brake less efficient and<br />
more likely to fade or to lock up.<br />
i) Creat variations in temperature and friction<br />
coefficients for different tinings on the market add<br />
further balancing problems when some linings have<br />
been worn out.<br />
j) Overheating and eccentricity problems are more<br />
pronounced with drum brakes than with disc brakes.<br />
However, the peak force of air actuated disc brakes<br />
are often Iess than what is demanded in a HCV.<br />
These and other peculiarities ol HCV brakes make<br />
it seem very unlikely that any conventionally braked<br />
HGV (truck, tractor or trailer) would keep the originally<br />
intended brake force balance during its whole<br />
lifetime. Considering that many other vehicles also<br />
may be coupled to it, closcd-loop (anti-lock) brake<br />
systems appear to be essential for the braking safety<br />
of articulated HGVs.<br />
Roll Stability. Apart from increasing the overturning<br />
risk, the high position of the mass centre in relation<br />
to the track width results in great lateral load transfer<br />
to the outer wheels. Since the SFC decreases with<br />
increasing tyre load, this transfer will also aggravate<br />
the skidding tendency. In addition, the great lateral<br />
forces on the outer tyres will reduce the effective track<br />
to considcrably below thc nominal value.<br />
The roll stability becomes particularly poor it the<br />
load is unrestrained laterally, such as in many partially<br />
loaded road tankers. The lateral acceleration at<br />
overturning may be raised more than twice at certain<br />
steering f,requencies, if longitudinal cross-walls are<br />
mounted. See Strandberg (1978, VTI report no. 138).<br />
In highway speed manoeuvres the trailer is often<br />
moving with a greater lateral acceleration than the<br />
towing vehicle. Therefore, it is particularly unfortunate<br />
that the mass of the trailer mostly is higher<br />
above the road than that of the towing truck.<br />
Space Demarrd. The great dimensions of HGVs increase<br />
the probability of collisions, particularly on<br />
narrow roads and in urban areas. The great lcngth of<br />
each vehicle unit means that comparatively moderate<br />
sideslip angles will result in considerable lateral devia-<br />
664<br />
EXPERIMENTAL SAFETY VEHICLES<br />
tions for the rear axles. Such deviations may be<br />
aggravated at highway speeds, if articulation or axle<br />
steering is introduced (to decrease the inwards offtracking<br />
at low speeds).<br />
The large front and side areas may induce dynamic<br />
air forces hazardous to both the unloaded HGV itself<br />
and to other road users.<br />
Indirectly Contributing Risk Factors. A number of<br />
design-, maintenance- or load-related factors affect<br />
the accident risk indirectly. For instance, the splash<br />
and spray from a HGV may contribute to an accident<br />
without any HGV involved or present. However, this<br />
paper will not deal further with this matter, duc to the<br />
diftjculties to determine the el'l'ect on safety from<br />
these factors and their relative importance.<br />
Methods to Identify Relevanl Accident Avoidance<br />
Parameters in HGVs. In general, deviations itt rcporting<br />
routines and tendency make it difficult to l'ind<br />
reliable numbers on travelled distance and on nonfatal<br />
accidents lbr valid risk comparisons between<br />
countries or between different vehicle types. Though<br />
statistics show that HCVs have considerably less<br />
accident risks than cars, the fatality risk (fatal crashes<br />
per 100 million miles) was similar to that of cars for<br />
single unit trucks and substantially greater for articulated<br />
HGVs in a U.S. study by Eicher, Robertson,<br />
Toth (1982, NHTSA no. HS-806-300).<br />
Several studies indicate that $ingle artics (tractorsemitrailer<br />
combinations) have better highway handling<br />
properties than double artics (truck and full<br />
trailer) and triple artics (double bottoms). Nevertheless,<br />
their greater low speed off-tracking may impair<br />
the saf'ety for unprotected road users in urban areas.<br />
The smaller dimensions and weight of tractorsemitrailers<br />
may also lead to a greater mileage in<br />
urban areas comparcd to truck full trailer cornbinations.<br />
ln addition, the yaw $tability during braking<br />
may be poor with semitrailers as compared to full<br />
trailers. In the U.K. for example, many years ago<br />
jacknifing occurred in about l1%o of articulated<br />
vehicle accidents. Load sensing valves were then fitted<br />
to tractor rear axles and the incidence of jacknifing<br />
rcduced to no more than about 5 per cent.<br />
Effects like this may have contributed to the higher<br />
accident risks for tractor-semitrailers (as compared<br />
with truck-trailers of similar length) found in a<br />
Swedish study of long vehicles by Trafiksflkerhetsutredningen<br />
(1977). At that time Sweden considered a<br />
reduction of the maximum permissible length of<br />
vehicle combinations from 24 to ltt metres. However,<br />
the Z4-metre limit appeared safer from several viewpoints<br />
and the l8 metre idea was abandoned.<br />
Though Trafiksiikerhetsutredningen compared the<br />
single and double artics in many way$, the poor<br />
matching of exposure and accident data in ol'l'icial<br />
statistics made it virtually impossible to isolate the
elevant parameters in the vehicles themselves. A more<br />
suitable method for this purpose is the case-cotrtrol<br />
study technique, often used in epidemiology. An<br />
accident group of vehicles is then compared with a<br />
control group passing the accident site at about the<br />
same time as the accident occurred. The basic idea is<br />
that significant group diffcrences lound in design-,<br />
load-, maintenance-, driver-, and employer paratneters<br />
reflect safety relevant factors associated with the<br />
vehicles themselves, since both groups have been<br />
exposed to the same environmental risk factors.<br />
Such a case-control study was conducted by Stein<br />
and Jones (1987, see Figure 2 above) on interstate<br />
highway crashes during two years in Washington<br />
$tate. Their results indicate clearly that certain vehicle<br />
parameter$, such as the number of articulartions, Inay<br />
be even more decisive of safety thatt driver parameters.<br />
This adds further doubts against the common<br />
conclusion that driver education is more important<br />
than vehicle design improvements.<br />
Accident Avoidance lletermined by Vehicle Design<br />
and Compatibility. Similar cotrclusions are often<br />
drawn on the basis of ambiguous results frotn accident<br />
investigations, stating that vehicle factors play a<br />
negligent causal role compared to human factors. No<br />
causal factor can be identified, if one does not know<br />
about its existence in general, and if one does not<br />
search for it. Many of the factors mentioncd above<br />
are of that kind, particularly those haeards that are<br />
not considered in legislation. In addition, accidents<br />
are multicausal phenomena by definition.<br />
Therefore, it is impossible to find really objective<br />
figures on the distribution of accident "causes" between<br />
drivers, vehicles and traffic environment. If<br />
such global cau$e categories are used, the prcsented<br />
figures tell more about the investigators and their<br />
methods than about tlte actual accidents' The impor'<br />
tant thing is to improve safety by the best measures<br />
accessible to ourselves, and to withstand the temptation<br />
to blame the accidents on factors that we cannot<br />
affect.<br />
This problem is particularly pronounced for HGV<br />
combinations, even if one accepts that vehicles are<br />
easier to change than basic human behaviour. The<br />
towing vehicle and the trailer are often designed by<br />
different manufacturers and sometimes they also have<br />
different owners. Thercl'ore, unusual efforts on the<br />
compatibility aspects are required by the involved<br />
parties to improve the accident avoidance properties<br />
of the whole HCV combination.<br />
Injury Protection<br />
The tables earlier in this paper show that the total<br />
numbers kilted per year in accidents involving lteavy<br />
goods vehicles varied considerably within the European<br />
countries, the proportions of most of the differ-<br />
<strong>SECTION</strong> 4. TECHNICAL SESSIONS<br />
ent categories of toad user \ilere similar. The exceptions<br />
were that France had a smaller proportion than<br />
average of pedestrian and pedal cyclist fatalities<br />
whereas Cermany had a higher proportion of pedal<br />
cyclists.<br />
The laboratories in Europe which have been working<br />
on injury protection tneasure$ for accidents involving<br />
Heavy Goods Vehicles are INRETS (LCB) in<br />
France and TRRL in the UK. A detailed investigation<br />
of 25 collisions between trucks and cars by INRETSa<br />
have confirrned the leading features o[ such incidents'<br />
TRRL reviewed all fatal accidents in one year in<br />
Great Britain involving these vehicless. These studies<br />
form much of the background to the following<br />
comments.<br />
In these accidents a heavy goods vehicle occupant is<br />
much less likely to be injured than other road users'<br />
Accidents that injure occupants involve either an<br />
HGV as a result of rollover or an HCV when it<br />
impacts a solid ohjcct, or when an HCV collides with<br />
another large vehicle.<br />
The largest single category of road user at risk in all<br />
countries in accidents involving HCVs is the car<br />
occupant, followed by the various unprotected road<br />
user.s (pedestrians and two-whccler users).<br />
HGV Occupant Prolection. The main causes of fatal<br />
injury to these occupatrts is either by ejection from<br />
the cab or by crushing of the cab $tructure.<br />
Consi
666 ,<br />
EXPERIMENTAL SAFETY VEHICLES<br />
beneficial in many of the single vehicle accidents way has the potential to increase the maximum<br />
where the crush forces are likely to be lower than survivable speed of impact for the car occupants.<br />
when other large vehicles are struck. As an example, The relative importance of special low srructures or<br />
if an unladen platform type HGV rolls over it is often guards at frontr sides and rear depends on several<br />
the cab roof that collapses and crushes the occupant. factors. It is difficult to justify sideguards fitted to<br />
More substantial pillars connecting the roof to the rest trucks to protect car occupants. They would of<br />
of the cab together with more secure glazing might necessity have to be fitted to both sides of trucks and,<br />
also prevent the windscreen coming out and therefore because of their length and strength requirements,<br />
reduce the incidence of ejection. However strong the would be very heavy. Because of the weight and<br />
cab structure, it is difficult to envisage much protec- payload penalties incurred and the relatively small<br />
tion being offered in the far more violent HCV to benefit in terms of lives and injuries prevented, they<br />
HCV type of accident or when the HGV impacts a would probably not be cost effective.<br />
very solid object such as a bridge parapet or other Guards and special low structures fitted to the front<br />
roadside furniture. However the first design of the and rear of the heavy goods vehicle are more likely to<br />
Leyland National bus did have the structure around be cost effective because of their lighter weight and<br />
the driver locally strengrhened $o that it displaced their potential, at least as far as the front guard is<br />
backwards without crushing the driver in frontal coilcerned, to save more lives. The mechanism of<br />
impacts.<br />
impact of cars into the fronts and rears of trucks is<br />
At present only Germany and Sweden have require- similar except that there is usually a greater degree of<br />
ments for cab strength.<br />
under-run at the rear of the goods vehicle because of<br />
its high structure and space under the rear. Also the<br />
Car Occupant Protection. Heavy goods vehicles are speeds of impact of cars into the fronts of trucks are<br />
very aggressive towards cars in collisions. The large usually higher. Because of the much larger number of<br />
mass ratio ensures that the velocity change of the car car occupants killed in impacts into the fronts of<br />
is much greater than that of the truck. The height of trucks compared with those killed in impacts into the<br />
structure around the perimeter of most trucks is such rear, there is a stronger case for the fitment of<br />
that when it $trikes or is struck by a car, the car can protection for cars at the front.<br />
under-run the truck, often to the extent that the truck A British study in 19857 suggested that an estimared<br />
structure comes into direct contact with the car 60 car occupants might be saved out of about 2.000<br />
occupant. By the same mechanism the importarrt killed each year in Creat Britain. This was based on<br />
energy absorbing zones of the car, which tend to be fitting energy absorbing front under-run guards and<br />
below the truck structure, are not used to their be$t an experimental impact test programme suggested that<br />
advantage. Finally, the rigidity of the truck structure such guards could offer protection to seat belted car<br />
ensures that most of the energy of the impact is occupants at closing speeds up to 65 km/h<br />
dissipated in the car structure rather than in that of The concept of including energy absorption<br />
the truck.<br />
in<br />
guard design is important, particularly in front of<br />
Typically, in European countries, the distribution of truck to front of car impacts where closing speeds are<br />
impact of cars around the truck perimeter is that higher. There is however probably a limit in rhe<br />
approximately 60 per cent or more impact into the amount of energy absorption that may be provided.<br />
front of the truck (usually front of car to front of The linear crush of the car plus the crush of the guard<br />
truck), around 25 per cent or more into the sides and must not exceed the original length of the bonnet of<br />
up to 15 per cent into the rear.<br />
the car otherwise the upper structure of the truck may<br />
In all these types of impact, the important primary impinge on the car occupant compartment. Also the<br />
objective is to provide a strong structure or guard, forces necessary to deform the truck guard must lie<br />
fitted to the heavy goods vehicle, which is low enough within the range that will also deform the car srruc-<br />
to impact the car structure. Two advantages are then ture. These two factors may well imply that the design<br />
gained by the car occupant-the truck structure is of the low front or truck guard is closely determined<br />
kept away from the car passenger compartment and by the dimensions and crush forces of small cars. The<br />
the energy absorbing properties of the car arc utilised. previously mentioned British study showed that for<br />
The latter is only a real advantage if the car occupant small car impacts it was possible to utilise at least Zj<br />
is wearing a seat belt. A secondary but important kJ of energy absorption built into a guard.,<br />
desirable objective is to make the guard or structure The ground clearanoe of the guards is also impor_<br />
which strikes the car encrgy absorbing. For this to be tant and would need to be about 300 mm for good<br />
effective the forces needed to deform the guard perforrnance, and certainly no more than 4{X) mm,<br />
should be compatible with those required ro deform otherwise the structural parts of smaller cars would be<br />
the car structure. Energy absorption introduced in this overridden.
As yet there are no European countries that requirc<br />
the fitment of front protection to heavy goods vehicles.<br />
Many countries do however have a requirement<br />
to fit rear protection, mainly to meet EEC Directive<br />
70/221. These countries include Austria, Belgium,<br />
Great Britain, West Germany, ltaly, Luxembourg and<br />
the Netherlands. Sweden has also had a mandatory<br />
requirement to fit rear guards, to their own specification,<br />
since 1973. France also has a national requirement.<br />
It has not yet been possible to estimate what its<br />
effectiveness has been, but a large improvement is not<br />
expected because the incidence of cars striking the<br />
rears of trucks seems to have been declining over the<br />
year$.<br />
With the increased use, throughout Europe, of seat<br />
belts in cars, the case for fitting trucks with both<br />
front and rear protection is now much stronger.<br />
Considerable research has been done and is being<br />
done in countries such as Germany, Sweden, France<br />
and Creat Britain to develop and promote effective<br />
structures and guards.<br />
ln France in 1985. the "Laboratoire des Chocs et<br />
de Biomecanique" of INRETS started a new experimental<br />
research programme on compatibility between<br />
cars and HCVs in frontal impact. The first phase<br />
consists in determining the geometry of an "avergggtt<br />
HGV. This work based on the sizes of 20 trucks is<br />
completed and suggests the dimensions of a rigid<br />
barrier to simulate a truck front end. In the second<br />
phase which is in progress several cars will be tested<br />
against this obstacle at two impact speeds: 50 and 57<br />
km/h. Already one car model has been tested at the<br />
two speeds. The first results seem to show that the<br />
injury parameters currently used to evaluate the protection<br />
of car occupants are not sufficient, and are<br />
not really valid for such a crash configuration. The<br />
third phase will lead to the proposal of a methodology<br />
for the evaluation of compatibility between trucks and<br />
cars.<br />
ln the Federal Republic of Germany the Technical<br />
University of Berlin has investigated the performance<br />
of energy absorbing low front bumpers to protect cars<br />
against under-run.<br />
In Great Britain the TRRL is developing a test<br />
procedure for evaluating frontal impact protection on<br />
trucks and heavy vehicles. It consists of a set of<br />
dynamic impact tests using an impactor of 250 kg<br />
which strikes the truck front at several different<br />
points acrosri the width at low bumper height"<br />
Pedestrian, Pedal Cyclist flnd Motorcyclist Protection.<br />
The unprotected road user, as this group is collectively<br />
known, is mainly at risk from being run over at<br />
the sides of the trucks. The cutting-in of articulated<br />
vehicles as they turn sharply can trap pedestrians and<br />
others. ln the Netherlands a down looking nearside<br />
mirror is required which may help drivers avoid this.<br />
<strong>SECTION</strong> 4. TECHNICAL SESSIONS<br />
Pedal cyclists arc also at risk in normal overtaking<br />
manoeuvers when they may topple towards the vehicle<br />
as it overtakes them and fall under the side and be<br />
run over by the wheels.<br />
Lightweight sideguards would help prevent running<br />
over but their design should be considered carefully in<br />
order to make them effective.<br />
A large proportion of accidents where pedestrians<br />
or two-wheeler users fall into the path of the truck<br />
wheels occur, not surprisingly, in urban areas and<br />
often at quite low speeds. Guards need to be strong<br />
enough to withstand normal everyday use but from an<br />
accident point of view, need not be very strong. More<br />
important requirements are that, if the guard is a<br />
horizontal rail type of structure, the rails should be<br />
close enough to prevent the road users falling through<br />
them and the supporting structure should be recessed<br />
to prevent injury. The whole guard should also be<br />
close to the outside edge of the vehicle or trailer to<br />
reduce head injury caused by the aggressive protrusions<br />
such as loading hooks often to be found in that<br />
area. Ground clearance is possibly the most important<br />
factor and it should be as low as operating conditions<br />
will allow. A maximum height of the lowest edge of<br />
the guard from the ground of about 400 mm would<br />
minimise the tendency of a road user to roll under the<br />
guard.<br />
All European countries have similar problems in<br />
protecting their pedestrians and two-wheeler users and<br />
should benefit from the fitting of sideguards to<br />
HOVs. At present only France, the Netherlands and<br />
Great Britain have a requirement for them to be<br />
fitted. The subject of sideguards is however being<br />
considered by ECE Geneva with the intention of<br />
producing an ECE Regulation to specify their design<br />
and performance. Their potential for saving lives will<br />
of cour$e vary slightly from country to country but as<br />
an example it has been estimated that in Creat Britain<br />
about 50 lives per year could be saved by fitting<br />
effective sideguards, but less stringent requirements<br />
could lead to this being more than halved.<br />
Priority of Measures to Provide Injury Protection,<br />
The following is suggested for the order in which<br />
measures to provide injury prevention should be<br />
introduced. It is based only on the liklihood of saving<br />
lives rather than on cost benefit considerations and it<br />
assumes that nearly all car occupants wear their seat<br />
belts.<br />
l. Frant under-run messures (guards or low<br />
struclure)<br />
Energy ab$orption should be incorporated<br />
and ground clearance should be around 300<br />
mm.<br />
2. Sideguards<br />
Lightweight structures are needed with a<br />
ground clearance of no more than 400 mm<br />
667
and several other detailed but minor requirements<br />
if their effectiveness is not to be<br />
needlessly reduced.<br />
3. HGV occupant prolection<br />
Seat belts suitable for trucks would be a<br />
very cost effective means of' preventing ejection<br />
if they were to be worn by drivers. Air<br />
bags might be an altertrative but tnight be<br />
less effective in some ejection situations.<br />
Stronger cab structures are also desirable to<br />
reduce the injuries due to crushing and<br />
would also make seat belts more worthwhile.<br />
4. Rear under-run guards<br />
The priority here is less than for front<br />
guards but similar requirements are needed.<br />
The primary need is to prevent under-run but<br />
energy absorption can also be beneficial.<br />
Methods of <strong>Int</strong>roducing Injury Protection. With the<br />
exception of HGV occupant protection, the measures<br />
to protect other road u$ers are of little benetit to the<br />
truck operator. He has to pay for the devices. The<br />
only economic advantages lie in the possible reduction<br />
of aerodynamic drag by suitable design of the guards<br />
fitted to the tiont and sides of the truck. For example<br />
the front guard could incorporate an air dam8 and thc<br />
sideguards could be of skinned dcsign. Both these<br />
ideas have been shown to reduce drag and also to<br />
reduce spray around the vehicle. The only other<br />
advantage is that front and rear guards rnay reduce<br />
the extent of damage to the truck itselt.<br />
These factors may not be sufficient to persuade<br />
many operators to fit protection, in which case<br />
compulsory fitment through legislation is the only<br />
certain way to improve the situation. This method is<br />
never popular with operators or mflnufacturers even if<br />
there is a strong case for the proposed legislation. It<br />
may be possible occasionally to trade ofl benefits to<br />
the operators in exchange for enhanced safety. For<br />
example, in Great Britain in 1984, sidcguards and rear<br />
under-run guards were introduced at the sailc time as<br />
an increase in the permissible maximum gross weight.<br />
Although this eased the introduction of safety features<br />
there was opposition from many sources to the<br />
increased weight.<br />
Conclusions<br />
The last ten years has seen a continuation of the<br />
improvements in the accident situation for Heavy<br />
Goods Vehicles in most European countries which had<br />
been apparent during the previous ten years' Frogress<br />
in reductions in casualties has been made in different<br />
countries at different times in this period and not<br />
always for reasons that are readily apparent, To some<br />
degree these results are a consequence of changes in<br />
the transport of goods. In some countries the numbers<br />
of goods vehicles has increased while in others it has<br />
668<br />
EXPERIMENTAL SAFETY VEHICLES<br />
decreased, Total distances travelled have been fairly<br />
stable but there has been a tendency to increase. It is<br />
clear that in many countries there has been a tendency<br />
towards higher capacity vehicles. As a result the total<br />
of goods transported has probably increased. Generally<br />
increases in goods traffic have been greater in<br />
European countries outside the EEVC membership.<br />
Precise comparisons in accident trends between<br />
countries are difficult to determine because of differences<br />
in the minimum size of vehicle regarded as<br />
being a Heavy Good Vehicle. However even between<br />
the four courltries studied in detail (France, Federal<br />
Republic o[ Germany, Sweden and Great Britain)<br />
there is a factor of at least two to one between the<br />
highest and the lowest thtal casualty rate measured<br />
against the various base statistics. The rea$ons are<br />
clearly a combination of geographic and dcmographic<br />
factors combined with goods vehicle factors such as<br />
the amourrts of goods transported by road, the road<br />
user behaviour prevalent in thc different countries.<br />
The lowcst national fatal accident rate per million km<br />
travelled by HGVs (l and 2 vehicle accidents only) is<br />
about 0.04.<br />
In the paper the fatal casualties in HCV accidents<br />
are sub-divided according to their road user category.<br />
About l09o are occupants of the HGVs, while car<br />
occupants make up between 50o/o and 65Vo and<br />
pedestrians about 1590 (although only 890 in France).<br />
The remainder are mostly riders of two wheelers.<br />
These figures suggest that there are five main factors<br />
determining the accident rates for these heavy vehicles-<br />
Road (desien and conditions).<br />
I HGV (design and operation and divided<br />
between accident avoidance and protective<br />
features).<br />
I Other vehicles involved (design and operation<br />
and divided between accident avoidance and<br />
protective features).<br />
I HCV drivers (skill, behaviour and operational<br />
conditions).<br />
o Other road users involved (speed and behaviour)'<br />
This report deals only with HCV vehicle factors from<br />
among these five.<br />
The review of accident avoidance possibilities for<br />
HCVs starts with a list of institutions interested in<br />
their study. lt generally concludes that there is a large<br />
diversity of design practice and requirements in Europc,<br />
never-the-less progress in this atipect of safety is<br />
readily possible.<br />
The stability in yaw of the multi axle HCV is<br />
shown to depend on the load balance between its<br />
many wheels in relation to the side force demands<br />
made on them when cornering and in conditions of
Iow grip. The problems increase a$ the numbers of<br />
articulatisns and axles are increased.<br />
These problerns are compounded when braking is<br />
involved. The brake distribution has to be set and the<br />
maximum braking available without locking wheels is<br />
dependant on many factors which are listed. Various<br />
systems of valves to alleviate the situation are mentioned<br />
as are the limitations of current air brake<br />
system$. It may be concluded that anti locking brakes<br />
and electronic control of the braking of each wheel<br />
are essential if full braking with stability is to be<br />
achieved.<br />
Limited stability can lead to an HGV not always<br />
following in the path taken by its driver in ditticult<br />
conditions and this leads to accidents, especially on<br />
narrow and on crowded roads.<br />
Roll stability is limiting when the load is placed<br />
high and also for fully and partially loaded tankers.<br />
Lowering the height of the load is perhaps the only<br />
viable design improvement.<br />
The review of injury protection possibilities for<br />
road users involved in accidents with HCVs showed<br />
that for their occupants the most desirable measures<br />
are those to prevent ejection and crushing within the<br />
cab. Seat belts might prevent 3090 of all fatalities if<br />
worn. Several countries require strengthening of cab<br />
structure$ in overturning but the great need is to<br />
better resist longitudinal crushing on to the driver in<br />
frontal impacts.<br />
Car occupants whose cars strike HGVs can best be<br />
protected by front and to a lesser extent rear underrun<br />
bumpers or low structures. Studies are well in hand<br />
for front underrun protection, while rear bumpers are<br />
already required.<br />
Unprotected road u$ers can best be helped by the<br />
provision of'side guards to prevent them falling under<br />
the sides of HGVs and then being run over. Several<br />
European countries require them to be fitted and the<br />
ECE Geneva organisation is working towards a Regulation.<br />
As for the underrun protective features the<br />
overall effectiveness is much increased by careful<br />
detailed design of the guards.<br />
It is concluded that the design of Heavy Goods<br />
Vehicles can further be improved in a number of<br />
different ways to reduce its contribution to the road<br />
casualty situation. Most of these features are being<br />
studied at either the research or the design stages.<br />
<strong>SECTION</strong> 4. TECHNICAL SESSIONS<br />
References<br />
l. Hotop, R. Lkw-Geschwindigkeiten auf den Bundesautobahnen.<br />
Stradenverkehrstechnik, Heft<br />
5/1985. Kirschbaum-Verlag, Bonn-Bad Godesberg.<br />
Deutsches Institut fur Wirtschaftsforschung<br />
(DIW): "Verkehr in Zahlen 1985" Hrsg.: BMV,<br />
Bonn, September 1985,<br />
Statistisches Bundesamt Wiesbaden: StraBenverk"<br />
ehrsunfhlle 1984 Fachserie 8. Reihe 3.3 Stuttcart/<br />
Mainz 1985.<br />
4. Dejeammes, M. Heavy trucks aggressivity for<br />
road users-in search of improved safety. Proceedings<br />
of the lOth <strong>Int</strong>ernational Technical <strong>Conf</strong>erence<br />
on Experimental Safety Vehicles, Oxford<br />
1985. NHTSA US Department of Transportation<br />
5. Riley, B S and H J Bates. Fatal Accidents in<br />
Creat Britain in 1976 involvirtg heavy goods<br />
vehicles. Department of the Environment Department<br />
of Transport, TRRL Supplementary Report<br />
SR 586. Crowthorne l9B0 (Transport and Road<br />
Research Laboratory).<br />
Riley, B S, Chinn, B P and H J Bates. An<br />
analysis of fatalities in heavy goods vehicle accidents.<br />
Department of the Environment Department<br />
of Transport, TRRL Report LR 1033,<br />
Crowthorne l98l (Transport and Road Research<br />
Laboratory).<br />
Riley, B S, Penoyre, S and H J Bates. Protecting<br />
car occupants, pedestrians and cyclists in accidents<br />
involving heavy goods vehicles by using<br />
front underrun bumpers and sideguards. Proceedings<br />
of l0th <strong>Int</strong>ernational Technical <strong>Conf</strong>erence<br />
on Experimental Safety Vehicles, Oxford 1985.<br />
NHTSA US Department of Transportation.<br />
Tromp, J P M. Splash and spray by lorries.Institute<br />
lor Road Safety Research SWOV, The Netherlands.<br />
Report R-85-5, Leidschendam 1985.<br />
Strandberg, L. "On 2.<br />
3.<br />
6.<br />
7.<br />
8.<br />
9.<br />
the braking safety of articulated<br />
heavy freight vehicles." Vol. 2 of Proceedings<br />
Sympasium on the Role of Heavy fr'reight<br />
Vehicles in Traffic Accidents, Montreal 1987.<br />
Transport Canada, Ottawa, KIA, ON5.<br />
Twelvc additional ret'erences are given directly in<br />
the text on Safety Measures and on Accident<br />
Avoidance.<br />
669
h<br />
qJ<br />
g)<br />
E)<br />
fiE<br />
o<br />
F l O<br />
r(b<br />
.l tH<br />
E h<br />
I =<br />
(l).=<br />
ELH<br />
r =<br />
6<br />
z<br />
t<br />
F<br />
.E<br />
I E<br />
T'<br />
It<br />
t<br />
o<br />
an<br />
+,<br />
6 o<br />
t<br />
o<br />
(,<br />
E<br />
s<br />
L A<br />
ott<br />
fiE<br />
otr<br />
h t<br />
r-{ l)<br />
gtr<br />
El '.{<br />
H<br />
tt<br />
F<br />
to<br />
+,<br />
s<br />
E0|,<br />
.dcut<br />
troE<br />
F n . !<br />
t{+1 ()<br />
GlFI<br />
nF<br />
liFl O<br />
Q o b 0<br />
+r 'Fa O<br />
*6fi<br />
tst)<br />
n<br />
F<br />
s<br />
F<br />
t,<br />
I<br />
T<br />
u:<br />
F<br />
!<br />
F<br />
D F<br />
,3<br />
EXPERIMENTAL SAFETY VEHICLES<br />
It{<br />
+ J .<br />
t8<br />
P *F<br />
.{ -{l<br />
t t l<br />
3 E 0<br />
O Ei t\,|<br />
f, '{ r{<br />
5.lt or<br />
.olrE<br />
BF fif,<br />
d l l )<br />
3EE$<br />
EE.c.c<br />
-tr +r +t<br />
t! tll u0 E<br />
FiO C tr<br />
5d.3"3<br />
I .<br />
8$<br />
hB i ,i<br />
flEgFFI<br />
E iq E E E<br />
F Ed ; ; E<br />
i :8 i d B<br />
I $B I I I<br />
s .HE s s s<br />
rD<br />
C'| BB 8 3 3 3 3<br />
(\| loto<br />
dt6l 1 8 I I I<br />
N<br />
F{<br />
H<br />
C)<br />
HI<br />
;l<br />
Fq<br />
f;l<br />
HI<br />
o.l<br />
I<br />
F<br />
I<br />
t)<br />
(J<br />
t t)<br />
6<br />
(J<br />
E<br />
(\|lD<br />
F{dl<br />
F{<br />
( \ | l o e<br />
' { ( l | g l<br />
rO<br />
gt<br />
rO<br />
ol<br />
( q ( \ | A A<br />
u*=fi rH rH rH<br />
.$ H6 Hd Hd Ed<br />
E O<br />
o o<br />
H H<br />
EI N<br />
0tl<br />
(\|<br />
Fll<br />
{JI E E<br />
vi t v{ 'r{<br />
^El b0 h0<br />
[tl Y{<br />
}Itr<br />
Yl<br />
E<br />
r r<br />
0t<br />
O<br />
D tt O TtF{<br />
o t l ) o x<br />
Fl +r-l 4) 6<br />
F lx lux ql<br />
d F{l!t F{O<br />
j A 5 L<br />
.ltt tJrt o O<br />
tt v{ v{l<br />
bDE +JE +,<br />
EE IE +b<br />
EO<br />
E<br />
# u<br />
r L<br />
fl +r<br />
L E l<br />
g't<br />
$ "<br />
6 t {<br />
f l f<br />
l L d<br />
E ! d<br />
t r l<br />
Y{ l!<br />
F o<br />
F \ E<br />
o 6 r<br />
h nE<br />
rH q .'{<br />
6sl<br />
8 0 0<br />
C
l(rtronal regulrtion tor tha optrdtion of ythlclCt<br />
styz0<br />
lhtor vrhlrlr trtcgofy<br />
<strong>SECTION</strong> 4. TECHNICAL SESSIONS<br />
Appendix f ft)<br />
cfipAfltsto( oF ttAIlottAt ff(o IirtRr(AIl0lrAl Rt6utlIl0lt5 FoR tr{t oPtMII0t 0F vtHtctts<br />
FtotML RtPUEI lc 0F GERHATiY, stvzo'r trttl'to tctt<br />
0ri vi n9-<br />
I it?nce<br />
clrss<br />
5perd.<br />
l-i mi t\<br />
!./li<br />
Grot 3<br />
vrhiclt<br />
rrr 9ht r<br />
Fr tug<br />
ntrrnatidnrl rrgulltion rorrrsponding to<br />
llotor<br />
vehiclr<br />
ca trgory<br />
rtyin9<br />
I tEnft<br />
lrsco<br />
ttc rnd Ect<br />
Rodd Irrffir R?gistrdtidn AEt<br />
'<br />
Direttions of the [uropesn tconoilit CoimJnity for rotd Yth{tItr (tfC-dfrections}<br />
t"d!'<br />
Prr:rngtt crrt t too ( ) 7.5 rl I t.5<br />
ilotbr buts?s<br />
t<br />
? lxlct<br />
e rrlas<br />
? trndr* rrltt<br />
Articultttd bstrci<br />
Htrvy goodt vchltlrt<br />
? rr lc:<br />
2 rxll5<br />
3 rrll5<br />
I rrlts<br />
Artirulrted Ythicle3<br />
llucters ot the rrles<br />
Semi-trrilrr seFi _trrllerg<br />
trucki<br />
z l<br />
? ?<br />
? 3<br />
3 1<br />
lrtlculrted Yehirlrr yith<br />
I 50 -tontr i ner<br />
Trrilrrrr<br />
1 2<br />
l 3<br />
I rrlP<br />
? rrles<br />
? arles<br />
I rrles<br />
2<br />
2<br />
2<br />
?<br />
3<br />
?<br />
2<br />
2<br />
t<br />
?<br />
?<br />
a<br />
?<br />
z<br />
3<br />
2<br />
?<br />
t<br />
80 (Eo)<br />
80 (80)<br />
B0 (80)<br />
80 (80)<br />
E0 (80)<br />
60 (80)<br />
60 {Bo)<br />
60 (80)<br />
60 (80)<br />
6o {Bo)<br />
60 (80)<br />
60 (80)<br />
60 (80)<br />
60 (80)<br />
80 (80)<br />
60 (80)<br />
60 (80)<br />
60 (80)<br />
J<br />
Frgulrtlont of the tconomic Comisrion for Europt for mtor vthicles lnd their trailerg<br />
t<br />
0ut of twns, ( ) on highH.ys (Autobrhh)<br />
t<br />
5"o.rlt. srttl.nent for frontlrr trdffit in tht slrrlrnd (l Y. StYfO)<br />
sinqle rrle<br />
llt<br />
trnJem r'lts, rxlr bit? Ll,35n ?lt<br />
t6<br />
zt<br />
30<br />
?8<br />
2,8-l ,3<br />
It<br />
2l<br />
x2<br />
2l<br />
tl<br />
t0<br />
r0<br />
t{<br />
l0<br />
t6<br />
7a<br />
#il: I:l;:l: :: l::i;:: l;ll l.ii'Ii." , ,,'., lll<br />
rctor vehicle3 erth I rrlcl rnd trlrler Fith ? trlrs 3gt<br />
r<br />
ltt drtr refer to the intenationdl driving lltencc<br />
I<br />
Yith porrenge', tithout re.tsr roxirum speed: 60 (60)<br />
I g.rving licrncr ct.tl t is necesrrry for truin vith mrf tlrra ! iilcr. vithDut rrgrrd to thG pulllng vehitlt<br />
H?<br />
nl<br />
t{l<br />
t{?<br />
n3<br />
0l<br />
n2<br />
03<br />
0r<br />
D<br />
0<br />
E<br />
c<br />
t<br />
rJi<br />
>5<br />
ig t.5<br />
>l.5El?<br />
-l?<br />
=o.rs<br />
i<br />
E0.7F-r.5:<br />
| -r.=to '<br />
I -ro<br />
Srr tt<br />
>E<br />
>0<br />
Ixplrnrt{ont<br />
0n highxryl (rutobahn)<br />
no Jpeed lifiit. out .d.<br />
f LLqd -LPggd -ol__ll0 ri{!-<br />
IDD ln/h if<br />
-the rux. speed 100 \h/h<br />
(it depends on th. ca.<br />
I i rence )<br />
-the rnginr pffrr ll tl/t<br />
of the grogt Yahltlt<br />
reight<br />
-"100" brdgE rith serl<br />
Irucls up to ?.8t rrr<br />
trertrd llle prri?ngtf<br />
ctr9<br />
Driving licrn(e'E'li<br />
n€ce3srry tor oparrtlofi<br />
rlth r trtiltr<br />
Grosg Yehirlr reight<br />
rrting by;<br />
firsl registrrtion<br />
rfter l9.ol.'87 ;lst<br />
fron dEC.'9t rll :35t<br />
Iu3t not ruFp,t!<br />
th? 9ro33 vehicle reight<br />
qf the 0ullrng tttor<br />
vEhirlr
Appendix 2 (a)<br />
Improvement of road situation in Europe<br />
Great Britain<br />
Road Lengths in 1000 km.<br />
Yetr fotal llotorray ilon-bul lt-up<br />
t973<br />
l97a<br />
t9?5<br />
1976<br />
ts77<br />
ls78<br />
1979<br />
lgao<br />
l96l<br />
l9B2<br />
1983<br />
r9a4<br />
l9A5<br />
327 -l<br />
329,O<br />
330,O<br />
333,4<br />
336.7<br />
336.3<br />
33a.o<br />
339,6<br />
3dt.9<br />
343.6<br />
3d5,4<br />
347,2<br />
3r$.3<br />
1.731<br />
1.a69<br />
1.97s<br />
2.155<br />
2.236<br />
2.394<br />
2.455<br />
?.s56<br />
2.62A<br />
2.666<br />
?..7m<br />
P.802<br />
?,834<br />
Appendix 2 (h)<br />
Improvement of Road Situation in Europe<br />
Germany<br />
19s.5<br />
t99.O<br />
t99.e<br />
200.3<br />
200. I<br />
2()0.5<br />
eol,o<br />
20().9<br />
20r.2<br />
20r,9<br />
2oz. I<br />
202.8<br />
?o2.6<br />
l. Foada rlth lpaed ltrlta of 64 kfr/h oF lcae.<br />
Yer r<br />
| 970<br />
t 97l<br />
1972<br />
roTt<br />
1974<br />
1975<br />
1976<br />
1977<br />
I 978<br />
197 9<br />
| 980<br />
l 98l<br />
| 98?<br />
I 983<br />
| 98{<br />
r 98s<br />
rotal<br />
r6?,3<br />
r64,5<br />
t65,3<br />
r66,i<br />
t67,5<br />
t 68,2<br />
t69,1<br />
r69,6<br />
r70,,|<br />
t 70,7<br />
t7t,5<br />
t7?,4<br />
t72,5<br />
1 73,0<br />
t7?,6<br />
t73,0<br />
Rodd [ength In lDoD tm<br />
Road Crtegory<br />
outside build u<br />
I<br />
rist'*or<br />
4 ,110<br />
4,461<br />
4,8?8<br />
5,?58<br />
5.48 1<br />
5 ,748<br />
6.?13<br />
6,435<br />
6,7 il<br />
7 ,029<br />
7 ,292<br />
7,538<br />
7,784<br />
7,919<br />
I,080<br />
8, 198<br />
EXFERIMENTAL SAFETY VEHICLES<br />
:<br />
t<br />
Butlt-up<br />
r26,9<br />
t28.2<br />
t28.e<br />
l3l.o<br />
txz.4<br />
133,3<br />
t34.5<br />
136.2<br />
l3a. I<br />
t59.O<br />
ldo,5<br />
l{1.6<br />
142.9<br />
trPtS<br />
Rurrl urb! h<br />
t 58,3<br />
r60,0<br />
160,5<br />
161,{<br />
r6?,0<br />
162,4<br />
r63,0<br />
163,1<br />
t63,3<br />
163,7<br />
t64,2<br />
t64,9<br />
t64,7<br />
t65,0<br />
r64,6<br />
t64,9<br />
270<br />
276<br />
28?<br />
286<br />
?90<br />
294<br />
?99<br />
30?<br />
3Ds<br />
308<br />
310<br />
312<br />
314<br />
316<br />
317<br />
Lengths of public roads according to road<br />
categories<br />
/ 2 /<br />
Hidth of<br />
the roads<br />
l. l. 1966<br />
snaller { n<br />
4- 5nr<br />
5 - 6 n<br />
6 - I n<br />
7 - 9n<br />
9-l?rn<br />
l? rnd nore<br />
tota I<br />
r. r. r97 l<br />
smaller 4 rn<br />
4- 5nr<br />
5- 6nr<br />
6 - I n<br />
7 - 9nr<br />
9- r?m<br />
l? and more<br />
tota I<br />
Jg<br />
smaller 4 m<br />
4 - 5 m<br />
5 - 6 n<br />
6 - 7 m<br />
l - 9m<br />
e-t?m<br />
l? and more<br />
tota I<br />
1.L t9Bl<br />
smal ler 4 nr<br />
4- 5rn<br />
5- 6nr<br />
6 - 7 n<br />
7 - 9 n<br />
9 - 1 ? m<br />
l? and more<br />
totnl<br />
Appendix 2 (b)<br />
continued<br />
Road category<br />
H{ghh,ayl Rurrl I<br />
(Autobahn)l<br />
I<br />
?6<br />
3296<br />
337?<br />
69<br />
4 39?<br />
446 |<br />
80<br />
6127<br />
621 3<br />
135<br />
7402<br />
7538<br />
il 5?7<br />
395 78<br />
5?449<br />
30238<br />
r 5980<br />
u6t5<br />
t 798<br />
t54160<br />
7848<br />
3r557<br />
5207?<br />
3895?<br />
?t908<br />
3913<br />
u991<br />
r60008<br />
536 |<br />
t5ttu<br />
53r97<br />
444<br />
t4<br />
?7495<br />
5375<br />
38?3<br />
t62933<br />
4?06<br />
20??7<br />
| 9l5B<br />
48038<br />
3?t9l<br />
638?<br />
4657<br />
U"brn<br />
97t88<br />
75503<br />
42678<br />
I 9356<br />
I 5385<br />
2502 | 9<br />
| 0209?<br />
77627<br />
52888<br />
250 t6<br />
18752<br />
?76375<br />
t0z3f7<br />
795!0<br />
6?58s<br />
3uo37<br />
?t699<br />
2 96 73e<br />
l5q 854 3 I 0000<br />
Lengths of public roads according to<br />
road widths and categories<br />
/ ? /
SECTTON 4. TECHNICAL SESSIONS<br />
Appendix 3 (a)<br />
Heavy Goods Vehicles and Trailers*<br />
Percentage failure by category in Great Britain**:<br />
Body t Chassis<br />
Suspens I on<br />
Erhaust<br />
Tyre5 E llheels<br />
5teer i n9<br />
BrBkes<br />
Lights<br />
ruel t Tanl<br />
Tachograph<br />
0il & lldste<br />
Ilectrlcrl<br />
0thers<br />
t979l80 1983/84 r984/85 r985/86<br />
4.51 X<br />
8.01 r<br />
?.17 x<br />
5,4 I<br />
3. I X<br />
45.97 X<br />
9.17 X<br />
'.: '<br />
1.47 Z<br />
0.96 X<br />
8. 13 x<br />
4,89 X<br />
8.t5 X<br />
?,35 r<br />
6.39 I<br />
2.89 z<br />
48,15 I<br />
11.59 I<br />
1.33 X<br />
3.5 I<br />
1,72 I<br />
0.9t x<br />
9.03 Z<br />
Appendix 3 (b)<br />
4.63 I<br />
7,83 X<br />
2.t8 t<br />
?.77 \<br />
49.14 N<br />
11.9 I<br />
1.33 I<br />
?.71 Z<br />
l.5l I<br />
0.89 I<br />
9.52 z<br />
4.49 r<br />
8.07 r<br />
2.01 |<br />
6.75 |<br />
2.83 I<br />
51 .26 1<br />
12.55 x<br />
1.38 x<br />
2.49 7<br />
1.44 I<br />
0.9? |<br />
10.12 z<br />
Total numbsrs of dcfccta nlqt 90 1647 girllirlil !64340<br />
. Goodr vehicles over 1525 kg unlrden reight rnd tr8ilers over<br />
Io2o ka 6lsd€n s€iaht.<br />
il The table shdvs the percentdge of vehicl?s failing as I result ot<br />
the defect indicated, A vehitle my have more thlh one fiult and<br />
consequently the t0tals o+ the percentdges 0f separdte faults<br />
exceed the percent6ge of vehicles falled.<br />
Results of generat technical inspections for motor vehicles according to type of defect for Germany(3)<br />
letr<br />
I 970<br />
| 975<br />
| 980<br />
l98 l<br />
198?<br />
| 983<br />
| 9{r4<br />
| 970<br />
I 975<br />
| 980<br />
l 98l<br />
r 98?<br />
| 993<br />
r9M<br />
l 970<br />
| 975<br />
r 980<br />
t98l<br />
| 982<br />
t 983<br />
r 984<br />
lel I tnE stock<br />
fl6-tdFTerrr'l?r<br />
rnd<br />
Trr i I ers<br />
in l't000-i<br />
t7dl5<br />
?19{?<br />
?8?67<br />
?9077<br />
?9664<br />
3034 2<br />
3l l6?<br />
Crrl rnd lfrqons<br />
13941<br />
| 7898<br />
?319?<br />
?3730<br />
?n 105<br />
?4 580<br />
?5? 1g<br />
lruckg<br />
il19<br />
t?45<br />
l4it8<br />
t168<br />
tit 7g<br />
t4 75<br />
I lt87<br />
lrlentlfled Defects<br />
l-rn l00o-7<br />
ro*,<br />
I rrsr,t,<br />
| ::*;u | 0.,*.*<br />
730 7<br />
| 0955<br />
t004 |<br />
t0533<br />
10498<br />
r0r50<br />
t0238<br />
s739<br />
9?s5<br />
84 90<br />
8989<br />
89?3<br />
8644<br />
968?<br />
790<br />
66f<br />
517<br />
540<br />
507<br />
16?<br />
145<br />
| 360<br />
?r3l<br />
?0s0<br />
? r64<br />
?l 1g<br />
?0?9<br />
|99t<br />
t061<br />
t805<br />
t 770<br />
r85?<br />
I 795<br />
1720<br />
t6 70<br />
t?6<br />
l14<br />
r0l<br />
99<br />
93<br />
86<br />
83<br />
86t<br />
782<br />
7l I<br />
681<br />
684<br />
668<br />
694<br />
l16<br />
55s<br />
603<br />
978<br />
978<br />
559<br />
588<br />
73<br />
4?<br />
36<br />
3?<br />
30<br />
27<br />
?5<br />
166 5<br />
?460<br />
I 996<br />
?24?<br />
2 r95<br />
? ll'9<br />
?0 75<br />
| 358<br />
?r58<br />
| 754<br />
| 985<br />
| 938<br />
186 I<br />
| 8?0<br />
t5B<br />
t43<br />
99<br />
t06<br />
9B<br />
89<br />
B6<br />
| rr*' I,::lii::"" | ,::nil<br />
503<br />
536<br />
423<br />
42?<br />
q4g<br />
452<br />
453<br />
39s<br />
430<br />
319<br />
3?0<br />
340<br />
345<br />
354<br />
54<br />
38<br />
26<br />
?4<br />
?3<br />
??<br />
?1<br />
l 009<br />
?178<br />
??86<br />
?558<br />
?599<br />
?64 I<br />
27 74<br />
t$<br />
1797<br />
r 93?<br />
?20 9<br />
??4 0<br />
??90<br />
?395<br />
r39<br />
t53<br />
r3l<br />
t34<br />
t?5<br />
ilB<br />
t l5<br />
383<br />
851<br />
833<br />
8lt<br />
798<br />
770<br />
786<br />
3?8<br />
798<br />
783<br />
762<br />
745<br />
t7l<br />
732<br />
3?<br />
3l<br />
?6<br />
?5<br />
24<br />
T(<br />
It
EXPERIMENTAL SAFETY VEHICLES<br />
Priorities in the Active and Passive Safetyof<br />
Trucks<br />
K. Langwieder,<br />
M. Danner.<br />
HUK-Verband<br />
Automobile Engineering Department<br />
German Association of Third Party,<br />
Accident,<br />
Motor Vehicle and Legal Protection Insurers<br />
Federal Republic of Germany<br />
Abstract<br />
In a representative study of some 1,2(X) accidents<br />
the accident characteristics of the truck were ascertained<br />
and priorities for partner-protection measures<br />
were derived from them.<br />
A truck front protection in collisions with cars and<br />
side guards for pedestrians and motorcyclists are of<br />
paramount importance. The protective effect deduced<br />
by the rear underride protection hitherto and the<br />
necessity for further improvements is proved from the<br />
accident analyses.<br />
So far only a few studies are available on the<br />
accident risks for the truck driver himself . In a<br />
representative evaluation of accidents the injury patterns<br />
of truck drivers dependent on collision type and<br />
accident intensity are shown on the basis of 800<br />
truck-collisions. This is followed by a discussion of<br />
the injury causes with regard to possible safety<br />
improvements. The active safety requirements of<br />
trucks resulting from accident studies and the possible<br />
effect of technical sy$tems such as antilock braking<br />
system$, distance warning devices etc., are discussed.<br />
674<br />
\ffl"J*,,,,,",<br />
Accidents<br />
with<br />
fatali t ies<br />
Accidents in<br />
Germany l9t5 7 678 t<br />
Accidents involving<br />
trucks dnd<br />
pcrsonal iniuryr<br />
1 385<br />
Accidents with<br />
seriws iniuries<br />
In the studies the distinction was also made between<br />
the various truck categories.<br />
The Present Situation<br />
Truck accidents constitute an important element in<br />
the general accident scene. Each year in Germany<br />
about 30,000 accidents with personal injury involving<br />
trucks occur /1/, in which some 1,700 people are<br />
killed and 40,000 are injured (Figure l). In addition,<br />
in 1985, about 36,000 truck accidents occurred causing<br />
serious material damage. Although in view of<br />
their mileage the involvement of trucks cannot be<br />
described as overproportionate, more attention in the<br />
future must be paid to truck accidents if the absolute<br />
accident figures are taken into account, which frequently<br />
not only involve extremely serious injuries but<br />
also an extraordinarily hieh level of material damage<br />
and a considerable risk to the other traffic in general.<br />
It is chiefly the accident opponent of trucks who<br />
run the greatest risk of injury. For about every two<br />
carlcar-collisions with fatalities there was one<br />
truck/car-collision with fatal injuries (Figure 2). Compared<br />
with the safety efforts up to now to reduce the<br />
risks in car/car-collisions future truck safety research<br />
must be considerably intensified in view of this fact.<br />
But neither should the efforts to achieve more protection<br />
flor other road users like motorcyclists, pedestrians,<br />
and more safety for the truck occupants themselves<br />
be relaxed: even if the risks to the truck<br />
occupants are not high in relation to the trucks<br />
registered, the absolute injury figures are not insignificant<br />
and the potential safety reserves must also be<br />
used for the truck occupants.<br />
Accidenti with<br />
sliBht iniuriei<br />
Accidents with<br />
injur ics/farrl i ties<br />
Total<br />
320 067 327 7t-5<br />
oc40 r8 532 28 163<br />
of these iniured<br />
truck trcupants 12s I 803 5727 7659<br />
rfurtlrr<br />
tfuck accid€nts with serious material damage in lgtft lI 924 cases<br />
Figure 1. Truck accldents in Germany in 1985 wlth resultlng Inlurles to occupants
I<br />
<strong>SECTION</strong> 4. TECHNICAL SESSIONS<br />
7 678 *.io."tt<br />
wrth latdlrrr(r<br />
I400 f{r{rirics<br />
Flgure 2. Trafflc accldente ln Germany in 1985 wlth fatalities<br />
In view of the existing accident risks, it is astonishing<br />
that up to now only relatively few studies have<br />
dealt with truck accidents, emphasis usually being<br />
placed on the consequences of the accidents and only<br />
rarely on the general accident characteristics and the<br />
crisis situations in the pre-crash-phase.<br />
It is the aim of this paper to give an overview of<br />
the accident involvement of trucks and the findings<br />
available by the HUK research on truck accidents with<br />
respect to<br />
I<br />
t<br />
I<br />
partner protection in truck accidents<br />
self-protection of the truck occupants and<br />
active saf'ety of trucks<br />
Methodical Aspects of Truck Accident<br />
Studies<br />
Building up truck accident rnaterial involves extrernely<br />
great problems, since truck accidents are more<br />
difficult to collect by occurrence, call for supraregional<br />
evaluation because of their high percentage on<br />
highways and since the evaluated accident material<br />
has to be divided into a large nurttber of differing<br />
truck concepts.<br />
Further problems result from the fact that-unlike<br />
in the case of car-or motorcycle-accidents-there is<br />
no clear reference basis I'or critcria of representativity<br />
of the material.<br />
The definition of the term "Lastkraftwagen"<br />
(truck) as given by the Federal German Statistical<br />
Office covers all vehicles which are suitable for<br />
transporting goods. It thus necessarily includes a large<br />
number of completely different vehicle types-vans<br />
and trucks with a tenfold variation of mass and<br />
fundarnentally differing concept and use.<br />
For this reason only trucks of over 3.5 tonnes<br />
maximum laden weight with typical tmck construction<br />
were considered in this HUK accident material presented;<br />
moreover, a detailed classification by mass<br />
categories and the type of truck, trailer and articulated<br />
lorries was carried out.<br />
Two independent bodies of accident material were<br />
available:<br />
'<br />
I Truck material I<br />
an evaluation of 1,447 truck accidents with<br />
car$, cycles, motorcycles and pedestrians<br />
with regard to problems of partner protection.<br />
a Truck material II<br />
an analysis of 770 accidents with truck/<br />
truck- and truck/car participation and single<br />
truck accidents with regard to the problem<br />
on self protection for the truck occupants<br />
and of active safety. With regard to ques-<br />
'<br />
tions of active safety, 300 of these accidents-a<br />
representative sarnple of tmck accidents<br />
in the Federal State of Bavaria in<br />
, 1984*were analysed and examined in-depth.<br />
For these studies which were partly conducted in<br />
cooperation with the German "Forschungsgemeinschaft<br />
Automobiltechnik" (FAT) and thus with the<br />
truck manufacturers well over 10.000 accidents had to<br />
be evaluated in order to filter out this accident<br />
material.<br />
675
The accident material now available will be continuously<br />
expanded in the next few years to create an<br />
enlarged basis for special studies, for example, in the<br />
case of truck categories or accidents involving dangerous<br />
goods, and to examine the effects of typical safety<br />
constructions.<br />
Passive Safety of Trucks-Partner<br />
Protection<br />
Car/truck collisions must be given prominence in<br />
measures of partner protection (Figure 2), although<br />
truck collisions with pedestrians and motorcyclists<br />
also represent a high proportion of accidents with<br />
fatalities. Although ways of protecring cyclists, motorcyclists<br />
and pedestrians in the case of truck collisions<br />
are limited, yet they are existent.<br />
Carltruck cotlisions (945 accidents)<br />
Carltruck accidents account for over 50go of all<br />
truck accidents in which people are injured, and<br />
comprise about 46Vo of all fatalities in accidents in<br />
which trucks are involved. For the car occupants the<br />
frequency of fatal injuries in truck,/car accidents is<br />
roughly four times higher than in car/car accidents.<br />
Figure 3 gives an overview of the type of collision<br />
which occurred, at the same time definirrg which areas<br />
of the car and truck impacted with one another in the<br />
main collision phase.<br />
In assessing the ranking order of the types of<br />
collision, a distinction has to be made between collision<br />
frequency and the severity of the injuries to the<br />
car occupants. Car collisions against the sides of the<br />
trucks (30.490) and truck rear-end accidents with cars<br />
(26.0V0) are the most frequent. But if the resultant<br />
injury severity is taken into consideration, it is the<br />
front,/front collision (collision type A) which is by far<br />
Typeof collisron {iHr An-\I (ivERALt lNtilrtY }EVtRrrY iN {:^il<br />
cnr / r uck l :iiiri,ij;!!i.:i ;:;ffii':i;;-"" ll f'rars:3<br />
I s ll ""^u. I<br />
Front-trontA m]Hflfl- L_ 184 1S.8 QA<br />
Front-side B 293 30.4 ZDO<br />
Fronl - reor c tEBl -l:: [D 88 9.4 33 159<br />
side -fron D<br />
Recr-{rcnt<br />
E<br />
ftrr t3t, al<br />
t5 4<br />
ffiffi]- - r<br />
'rr iltl_]Illf<br />
.f--l 2t2 260 t, L U<br />
TotoI 931 r00.0 100 0<br />
Flgure 3. Type of colllelon ln truck/car accidents. frequency<br />
of occurrence and serious Inluries<br />
resulting<br />
676<br />
EXPERIMENTAL SAFETY VEHICLES<br />
the most important and covers about 40go of the<br />
cases recorded with serious,/fatal injuries from AIS 3<br />
and above. Accidents of cars running into the rear<br />
ends of lorries have a share of about 20go of the<br />
dangerous./fatal injuries in the accident material. The<br />
paramount importance of an optimum rear and front<br />
underrun protection of the truck can be derived from<br />
this.<br />
The frequency disrribution of each of the impact<br />
area$ on the truck is given in fJgure 4 for all of the<br />
945 car/truck-collisions recorded. By far the most<br />
frequent are collisions against the truck front (6090),<br />
which occur namely in the left-hand outside third of<br />
the truck front. The lorry is struck on the side in<br />
about one quarter of the cases, 40go of these occur*<br />
ring in the area between the axles. The impact areas<br />
on the left are far more frequent than on fhe right.<br />
Rear end collisions in which the back of the truck is<br />
struck take place mainly in the left-hand third (55V0).<br />
The car driver instinctively tries to take evasive action<br />
to the left, the main load to the rear underrun<br />
protection thereby being not only concentrated on one<br />
side but also quite often at an angle as well, which<br />
results in the problem of bending away the outer rail<br />
of the underrun protection and thus higher strength of<br />
the underrun protection device is needed. This risk,<br />
which is still quite considerable, is reflected by the<br />
fact that accidents in which cars strike the rear of a<br />
truck have a frequency of altogether g.5go only, but<br />
comprise l1vlo of all fatal accidents in the case of<br />
carltruck accidents.<br />
There is no doubt that even with the improvement<br />
of the reinforcing members of the truck rear underrun<br />
protection by the revision of the ECE-R 5g /Z/ there<br />
is definitely not sufficient prorection. This would<br />
require above all that the rear underride protection of<br />
the truck should be lowered to about 30 cm above the<br />
ground and the permissible distance from the rear<br />
edge of the loading area should be reduced. Further<br />
improvements must-as already mentioned-be made<br />
to the reinforcing support members in the event of an<br />
angled impact in the outer area and increased test_<br />
loads compared with the actual ECE-R 5g are to be<br />
required. The relative impact speed of the car on the<br />
rear of the truck is in most cases in the region of<br />
about 30 to 50 km/h /i.41.<br />
$ffiffi,tu<br />
''"mffi&ffiH<br />
Flgure4.<br />
Dlstribution of the impacted areas of the<br />
truck in colllslons with passenger cars (94S<br />
accidents)
In the case of the dominant front,/front collisions,<br />
quite naturally serious difficulties are caused by the<br />
masses involved and the high relative speed. But<br />
studies /3,5/ showed that even serious lrontal collisions<br />
were mostly not accidents with any offset, in<br />
which, of course, the necessarily high truck mass fully<br />
loads the opponent's car: heavy car-truck collisions<br />
are mostly accidents with comparatively large offset,<br />
in which, however, the front design of the truck with<br />
high mounted bumpers and rigid structures results in<br />
an unfavourable application of force against the car<br />
(Figure 5). The truck overruns the deformation structures<br />
of the car provided to absorb €nergy, forces the<br />
car under the truck front and wedges it there (Figure<br />
6). This fact in an overproportionate number of cases,<br />
result.s in massive intrusion of the passenger cell with<br />
very serious injuries being caused to the car occupants.<br />
Since 1978, the HUK-Verband together with the<br />
Technical University in Berlin and truck manufacturers<br />
has continually carried out car crash tests into the<br />
frolrt of trucks to develop counter measures based on<br />
the knowledge of real-life accidents /6/.<br />
These series of tests showed that to achieve the aim<br />
of truck front underrun protection, both measures<br />
with regard to the truck l'ront geometry and the front<br />
deformation characteristics are nece$sary.<br />
Safety improvements to the truck front design demand<br />
first of all<br />
t a lowering of the bumper to a clearance of<br />
about 30 cm. so that the car structures are<br />
no longer driven oyer by the truck and the<br />
car becomes wedged underneath the truck<br />
a a larger contact area fbr the car on the<br />
truck. so that a wider area of force load is<br />
given and a deflection functiott can take<br />
, , place as far as possible<br />
Simply avoiding the car structures being overrun in<br />
itself results in an advantage, but for a truck front<br />
protection a further prerequisite is that<br />
the truck front is designed for a certain<br />
energy absorption and not, as is the case<br />
today, so that the deformation work has to<br />
be performed almost exclusively by the car.<br />
Figure 5. Typical frontal colllsion of a car into a truck<br />
with relatively high offset but serious intru'<br />
sion of the cer<br />
<strong>SECTION</strong> 4. TECHNICAL SESSIONS<br />
i;":*\r,<br />
tr:' Illiftd,rtl<br />
&'<br />
I<br />
I,{10<br />
Flgure 6. Car to truck crash test: typical force load to<br />
the car with the truck's lront overrunning<br />
the deformatlon structure of the car<br />
As a fundamental finding of the experiments to<br />
date front structure$ of this kind can be createdalthough<br />
with some expenditure-imposing no limitations<br />
on the present truck construction and potential<br />
usage and that considerable safety gains are to be<br />
expected for the car occupants /7 /.<br />
An "energy-absorbing<br />
design of the truck front"<br />
can be achieved by replacing the conventional bumper<br />
systems by a deformation structure which is mounted<br />
on a carrier construction (Figure 7a), this carrier<br />
system, being, in its turn, attached to the frame and<br />
being designed to resist deforrnatiou as far as possible.<br />
The experiments have not yet been completed; in<br />
the light of these latest developments a front underrun<br />
protection of this kind is likcly to mean an additional<br />
length of the truck amounting to about 10 to 15 cm<br />
(Figure 7blc) and additional weight of some 150 kginsignificant<br />
compared with the total weight of a<br />
Figure 7.<br />
, sr i ,'1' ,!rSat1!F<br />
Possible constructlon ot a front underride<br />
protectlon<br />
a) carrler construction and detormation<br />
structure<br />
b) truck front underride protectlon; vlew<br />
from below<br />
c) truck front underrideprotection;<br />
vlew<br />
lrom the side<br />
6'77
truck, but of not inconsiderable significance for<br />
economy calculations.<br />
A front protection of this kind results not only in<br />
advantages for the car occupants but can also improve<br />
the safety of the truck. Even comparatively low<br />
relative speeds often cause a massive car impact<br />
against the truck's front wheel damaging its steerirtg<br />
or even making the lorry unsteerable, so that quite<br />
often very serious secondary collisions occur as a<br />
result. This risk can also be greatly reduced by a truck<br />
front underrun protection in the way suggested'<br />
EXPERIMENTAL SAFETY VEHICLES<br />
M<br />
ffiffi[ ]Et<br />
Flgure 9. Truck colllelons wlth two.wheeled vehlclee;<br />
dlstrlbutlon of the lmFacted areas (390 accl.<br />
dente)<br />
Collisions between trucks and two-wheeled<br />
vehicles (390 accidents)<br />
In the case of these collisions with trucks of 3.5 t or<br />
more a distinction was made between the categories<br />
"motorcycle,<br />
light motorised two-wheel-vehicles<br />
(Mofas, Mokick) and bicycles".<br />
The individual categories of two-wheeled vehicles<br />
show different accident characteristics /3.4/: in one<br />
third of the cases involving motorcycles, frontal<br />
collisions against the side of the truck take place<br />
(Figure 8). When a truck turns off, motorcyclists are<br />
apparently frequently overlooked or their speed is<br />
wrongly estimated. In comparison with motorcycles,<br />
however, "light motorised two-wheeled vehicles" and<br />
bicycles are struck far more frequently by the truck<br />
front, usually in cross traffic.<br />
The truck's side area is involved in about 5090 of<br />
the cases in collisions with motorised two-wheel-vehicles-<br />
(Figure 9); more than one-third of all collisions take<br />
place in the area between the axles (3,4), these<br />
accidents accounting for about half of all motorcyclists<br />
killed, as well as a considerable proportion of<br />
seriously injured people.<br />
Quite a number of these involve glancing off<br />
impacts (for example when overtaking) which, accounting<br />
for a share of ?0 to 33V0, represent the<br />
subsequent fall into the space between the front and<br />
rear axles with resulting run-over by the truck.<br />
The danger of running over increases at a lower<br />
speed of the two-wheeled vehicle in keeping with the<br />
proportion of overtaking manoeuvres. For example of<br />
186 cyclists in the truck accident material with personal<br />
injuries /4/, 14 persons were run over.<br />
Figure 9 shows that in truck collisions with two:<br />
wheeled-vehicles, the right-hand side area is the critical<br />
impact area*a side underruu protection on the<br />
truck would influence around 5090 of the serious-<br />
/fatal injuries to drivers of two-wheeled vehicles<br />
and-in particular-would totally avoid the dangerous<br />
falls between the front and rear axles. Any improve'<br />
ment of the present situation including refitting trucks<br />
and trailors with side protection results in advantages;<br />
an optimum side underrun protection, however,<br />
should be designed with a flat surface covering the<br />
whole space of the side especially on the right-hand<br />
side of the vehicle. Thus the fact is also taken into<br />
consideration that especially motorcycles collide relatively<br />
frequently head on with the truck side area and<br />
that therefore the driver incurs the risk of becoming<br />
entangled by the truck.<br />
Collisions of trucks f,nd pedestrians (112<br />
second highest risk at all. Decisive here is not the<br />
intensity of the impact itself but the danger of a<br />
accidents)<br />
Here, of course, the most serious accidents are<br />
encountered: only one-third of all pedestrians get off<br />
with only moderate injuries in truck,/pedestrian collisions<br />
/3,4/.<br />
The impact of the pedestrian most frequently takes<br />
il 12 l5 l6 20 13<br />
place (4290) with the front of the truck in the right<br />
"L<br />
r#F4<br />
nt.at<br />
I -ffi#<br />
-.t -<br />
?_<br />
l0<br />
17<br />
5<br />
E?<br />
rg<br />
3?<br />
l1<br />
28<br />
1r0<br />
3L<br />
_ol t:n 1l<br />
2L 61 l0 6<br />
-.-'<br />
g9 254 lr @<br />
5? 1l ll<br />
s7 1()2 26. 36 tr<br />
ll 1L 2 I<br />
t6E 190 ]m0 l5l rm(<br />
hand area; in over one third of the cases an impact<br />
against the right hand side area occurs and protective<br />
measures must first of all be taken in thege areas<br />
(Figure l0).<br />
\ilhat is decisive is a closed surface and avoiding<br />
protruding edges in the vehicle's front and side<br />
especially between the truck driver's cabin and the<br />
Flgure 8. Accident characterlstlcs of collision between<br />
trucks and two-wheeled vehicles, frequency<br />
ol the areas lmpacted and serious inlurle$<br />
resultlng<br />
loading area. Also by mounting a truck front protection<br />
as proposed at a short distance from the ground<br />
certain safety improvements, for example, avoiding<br />
being driven over, can be carried out.
'@ffiffiffi]<br />
M M<br />
-- €I<br />
Mre<br />
Flgure 10. lmpactcd arsas ln colllslons ol trucks wlth<br />
pedeetrlanr<br />
(1 12 accldentr)<br />
About two-thirds (65.990) of truck/pedestrian accidents<br />
take place irt a collision speed range of up to 30<br />
km/h /3,4/. Because of this relatively low speed the<br />
search for safety measures, also with regard to pedestrian<br />
protection, do not $eem to be completely hopeless.<br />
The cotlision risk for the pedestrian could also be<br />
reduced by "active safety"; since the pedestrian is<br />
frequently struck only by the outer parts of the truck<br />
/4,8/, equipping the truck with anti-locking brakes<br />
(ALB) a reduction could be expected because of the<br />
possibility of steering the truck in spite of an emergency<br />
braking.<br />
Safety measure$ for the truck occuprnt$<br />
(sample 770 rccidents)<br />
While in the last few years an increasing number of<br />
studies has been made on the subject of "partner<br />
protection" few studies are available today on the<br />
risks to the truck occupants. For this rea$on new<br />
uninjured<br />
Number<br />
<strong>SECTION</strong> 4. TECHNICAL SESSIONS<br />
$li8htly<br />
inlutrd<br />
Numbef<br />
accident material from 770 collisions involving trucks<br />
of 3.5 t or more was evaluated, the studies covering<br />
the whole of the Federal State of Bavaria, which<br />
means they can also be regarded as representative of<br />
the accident situation in Germany. Altogether 3,500<br />
truck accidents from 1984 were evaluated, and from<br />
these the above-mentioned accident material II was<br />
selected according to the following criteria:<br />
To describe the current state of truck safety, only<br />
accidents involving a truck of 3.5 t or more, manufactured<br />
in or after 1976 were included. In addition to<br />
the injuries to the occupants in the truck accidents<br />
with safety related damage to the driver's cabin but<br />
without injury to the occupants were also included in<br />
order to avoid a negative selection and thus to<br />
objectively reflect the safety risks to the truck occupants.<br />
The study showed that the injury risk of the truck<br />
occupants is almost exclusively dominated by truck/<br />
truck collisions and single-truck-accidents (Figure ll).<br />
Carltruck collisions are, of course, frequent as far as<br />
the number of cases is concerned and can also result<br />
in considerable front damage to the truck, but the<br />
resulting injury risk of the truck occupants is nevertheless<br />
slight and the serious injury consequences are<br />
mainly due to secondary collisions.<br />
Surprisingly not the lighter mass categories of up to<br />
12 t were found to be overrepresented in accidents<br />
with injury to truck occupants in the accident material,<br />
but mainly the heavy trucks of 16 t or more, the<br />
truck trailers or the articulated lorries as compared<br />
with their proportion of the registrations. Thus, the<br />
priously<br />
Iniur€d<br />
Nrrmbcr |<br />
%<br />
Fatalities<br />
Number %<br />
TO1'AL<br />
trurk trcupdniS<br />
Number | %<br />
SinBle truck ffcid€art 19 115 L3 33.6 L 30.8 1B'l 18.8<br />
fruck/truck 80 136 57 44.5 6 46.1 279 291<br />
Truck/car 325 1A7 20 r5.6 3 23.1 4s5 l'7.3<br />
Truk/othr:r 26 12 I 6.3 /.6 1.8<br />
TOTAL 450 370 128 100.0 13 100.0 961<br />
100 0<br />
Figure 11. Truck accidents with injury or serious $aiety riek to truck occupants, resultent risk<br />
related to type ol accident<br />
679
"weight<br />
bonus" of heavy trucks involved in collisions<br />
with other accident opponents seems to represent an<br />
additional burden in truck,/truck collisions and single<br />
truck accidents /9/.<br />
Two out of three truck/truck collisions with injury<br />
to the occupants are frontal collisions with the rearend<br />
of another truck, which in 56o/o of the cases<br />
occurred on motorways, and most of which involved<br />
long distance trucks (Figure l2). In 72.10/o of these<br />
front/rear-end collisions the relative speed was under<br />
30 km/h, and in 9690 under 50 km/h.<br />
Figure l3 shows the darnage characteristics in truck/<br />
truck collisions in general. The intrusion in rear-end<br />
impacts of trucks*being the most predominant risk<br />
for occupants-is shown in Figure 14. Even if the<br />
driver often tries to nrove over towards the left as f'ar<br />
as possible at the last moment, the outside left-hand<br />
third of the front is not less frequently loaded with<br />
direct deformation. The central problem for the<br />
stability of the driver's cabin and thus for the injury<br />
risk to the occupants is connected with an impact<br />
against the protruding, rigid and not compatible<br />
rear-end of another truck /4/.<br />
The dangerous intrusions of 60 cm and more were<br />
not to be found in cases with partial force load, but<br />
in full force load to the whole cabin without offset<br />
(Figure l4). The main deformation here is not in the<br />
roof, but in the lower area between the bumper and<br />
lower frame of the windshield. Even if this lrequently<br />
results in massive intrusion, normally a ,.minimal<br />
survival space" remains for the truck occupants, even<br />
in extremely serious accidents.<br />
680<br />
Iype of<br />
co It ision<br />
A B<br />
+ +<br />
A q obtrrvcd trwk<br />
EXPERIMENTAL SAFETY VEHICLES<br />
MAIS 2-5<br />
Number I<br />
gt<br />
B 4 opponent<br />
The second greatest risk of injuries to the truck<br />
occupants is encountered in single vehicle accidents,<br />
5090 of which are characterized by the vehicle leaving<br />
the road and then driving into a ditch or running into<br />
the embankment without a massive collision with an<br />
object. Only in about 2590 of the cases was there a<br />
massive collision with a tree, a wall or some other<br />
object. ln 7lslo of these cases, however, the speed was<br />
over 45 km/h and often in the critical range.<br />
The damage characteristics in single vehicle acci_<br />
dents compared with trucky'truck collisions show<br />
clearly that the impact is in the right-hand area in<br />
4090 of the cases, the intrusion of the driver's cabin<br />
being generally less oflten severe (Figure 15) in com_<br />
parison with front,/rear end truck collisions.<br />
Special risks are involved when the truck tips or<br />
turns over, and this alone accounted for 50Vo of the<br />
fatalities in the rruck and about 25Vo of the injuries<br />
ranging from AIS 3 to AIS 5; these cases occurred<br />
mainly in single vehicle accidents.<br />
In 147 of the 770 cases (Iggo) of this sample the<br />
truck turned over with the vehicle tipping over in 134<br />
cases (usually turning over onto the right side) and<br />
rolling over completely in only 14 cases. When it tips<br />
over to one ride the intrusion into the driver's cabin is<br />
usually moderate, but the danger of ejection of the<br />
unrestrained occupant or the risk of intcrior impact<br />
by being thrown to the side is very great.<br />
In this connection no major problems were ob_<br />
served with rhe rigidity ot the roof-although there<br />
was considerable local intrusion in some cases. the<br />
minimum survival space was maintained even then.<br />
MAIS 6<br />
N{rmber I<br />
all jniured<br />
TOIA{<br />
lauck trcuFantS<br />
Numbe. I X<br />
. L|_<br />
l-ront/tront -'_1LJLJffi 3 7.0 I (16.7) ?t, I t.3<br />
Frontl<br />
side 7 163 2 (33<br />
3) 27 1?,7<br />
Fronl/rear 32 7lr./- 3 ( 50.0) 132 6l.s<br />
Other types of cottisions I 23 30 11,.1<br />
Toto t 43 r00.0 6 100.0 2'r3 r00 0<br />
Figure 12. Hiqhest degree ol iniury severity of truck occupants involved in truck.ro-truck<br />
eollisions-related to type of impact
lftation.)t llx'<br />
deltrrndtr0il No. ol cit*s frequenr y ol defsmarion<br />
upp€r area trly<br />
lower area only<br />
totnl frontal areJ<br />
5<br />
159<br />
187<br />
<strong>SECTION</strong> 4. TECHNICAL SESSIONS<br />
A G caies with partial olfstt<br />
Figure 16 gives the total injury severity of the truck<br />
occupant$ involved and the frequency/severity of the<br />
injuries to the various parts of the body.<br />
As many as half of all severe/fatal injuries to the<br />
truck occupants in this study are due to ejection. In<br />
890 of tlte 710 cases intrusion was so great that the<br />
occupants were wedged in the vehicle (usually in the<br />
region of the legs). The other injuries occurred mainly<br />
through impact in the interior, the "steering wheel/<br />
steering column" and dclormation of the "foot/<br />
leg-space" dorninating as the cause of serious injury.<br />
The impact to the windshield is frequent but mo$tly<br />
without scrious consequences. Occupant impact to the<br />
truck's side areas and in the roof account for a<br />
comparatively Iow proportion /9/.<br />
The injuries to the individual parts of the body<br />
clearly confirm the injury risks typical of trucks.<br />
Head injuries are bound to dominate in fatal injuries,<br />
but abdominal and chest injuries are almost of equal<br />
significance. Among the serious/critical injuries of<br />
AIS 3-5 injuries in the abdominal, chest and leg areas<br />
occur far more frequently than head injuries-an<br />
indication of the problems connected with occupants<br />
being wedged in and the injury causes connected with<br />
the steering wheel,/steering column. In the case of<br />
B = ca*s without oft*t<br />
Flgure 13. Frequency of damaged arear of the truck'g front In truck to-truck collislone generally<br />
intrusion the unfavourable impact conditions of the<br />
steering wheel-flat normal position-thus locally<br />
concentrated impact loading and only limited yielding-<br />
are, in addition, further aggravated by tlre fact<br />
that the steering whccl,/steering column are frequently<br />
pushed upwards (Figure l7)-<br />
Assessments were made to find out which safety<br />
measures are suitable for reducing the comparatively<br />
low, but existing injury risks ol' the truck occupants.<br />
The best protective effect could be expected fronr a<br />
safety belt, which in approximately 50a/o of the cases<br />
would result in a considerable reduction of injuries. In<br />
particular the fatal injuries (ejection) and the serious<br />
injuries in the abdominal and chest region as well as<br />
the thigh fractures as a result of the occupants being<br />
thrown forward would thus be considerably reduced.<br />
Problems which were at first expected, for example<br />
caused by excessive intrusion and lack of survival<br />
space, were-except in two ca$es*not observed in this<br />
study and are below I go. But it must be pointed out<br />
when discussing the question of safety belts that belt<br />
characteristics (restraint effect as with a 3-point-safety<br />
belt) and function (taking into account the truck's<br />
vibration) rnust not restrict the ergonometry.
E<br />
z<br />
;<br />
D<br />
=<br />
Totol<br />
EXPERIMENTAL SAFETY VEHICLES<br />
Domoged oreo<br />
no isolated local intrusion<br />
only in combination with lowcr area<br />
Flgure 14. Range ol lntruelon to th6 dlffer€nt areas of the truck lront In truck-to-truck rear end<br />
collisions<br />
location oI thc damage<br />
upyrr area only , ZO<br />
lower arca only<br />
total frontal area<br />
WZ/ffi<br />
E<br />
z<br />
=<br />
20-40<br />
40-60<br />
'60<br />
-20<br />
20-40<br />
.r0 - 60<br />
560<br />
_ ZO<br />
20-+o<br />
,to - 60<br />
>60<br />
t-)anra6ed area considcrcd<br />
Do mo ged oreo<br />
front third only . combined area .no offset<br />
Totqt<br />
1 r z r s l + t E l e<br />
2 2<br />
2 ? lr<br />
1 2 3<br />
1 I 1 1 1 7 11<br />
I 3 t,<br />
6 6<br />
1 /, 5<br />
Totol lr 1 1 1 t, 2t, 35<br />
Flgure 15. Range of intrusion to the dilferent areas ol the truck front in single vehicle accldents
PARTS tr THE<br />
DODY 'NJUNED<br />
Nek/cffvErl ry#<br />
IPt_r.B__Ejll3gqIIE5<br />
- Chrl<br />
- B.cl d<br />
L(:4!8- EX TR EMrTrEs<br />
- Thith<br />
. Lfls rrt<br />
Totol AtS 1- 2 Ats 3- 5 AIS 6<br />
I g/.<br />
- * l<br />
t{<br />
6r<br />
26<br />
, 1<br />
nl<br />
31,<br />
13<br />
36<br />
75<br />
t9<br />
38<br />
379<br />
76<br />
64<br />
Il9<br />
5.1<br />
9?<br />
lzl<br />
66<br />
8,.<br />
70<br />
I 1,6<br />
7L<br />
r83<br />
36<br />
33<br />
1,5<br />
25<br />
62<br />
33<br />
2L<br />
6S<br />
69<br />
37<br />
39 6<br />
IE<br />
7.1<br />
9.7<br />
101<br />
I J.t<br />
7.1<br />
63<br />
5?<br />
119<br />
11,$<br />
0.0<br />
32 t2 32 69<br />
Efari4 90 r76 s0 19,5<br />
Toral: injurd<br />
Flgure 16. Frequency and EcyGrlty ol Infurlu to tho<br />
dlfferent perts of the body ot truck occupants<br />
Active $[fety-avolding truck nccidents<br />
(sample 300 accidents)<br />
A representative sample of 300 accidents were<br />
selected from accident material II in which safety risks<br />
for truck drivers, including car/truck accidents were<br />
analysed. Collisions with two-wheeled vehicles/pedestrians<br />
were deliberately not irtcluded here, since these<br />
Flgure 17. Exrmples of typical intrusion of the, drlver's<br />
cabin, llluetrating the injury risk from<br />
the steerlng assembly and in the leg ar€B<br />
l_<br />
2<br />
t2<br />
I<br />
;<br />
I<br />
10<br />
6<br />
t0<br />
I<br />
<strong>SECTION</strong> 4. TECHNICAL SESSIONS<br />
10, I<br />
RI<br />
^:,<br />
J l,tt<br />
21<br />
21 6<br />
270<br />
162<br />
270<br />
tt<br />
7 53 I<br />
| 77<br />
l. 308<br />
E<br />
I<br />
t6l<br />
5l? r00 0 162 r00 0 37 100.0 l3 r00 0<br />
5r2<br />
(19<br />
sccidents rcveal completely different characteristics<br />
with different safety requirements (for example, visibility)<br />
and will have to be treated in a separate study.<br />
The criteria for inclusion in the present study<br />
material are given once more:<br />
I trucks of over 3.5 t maximum laden weight<br />
manufactured in or after 1976<br />
t injury to the truck occupants and/or damage<br />
to the truck driver's cabin which is of<br />
significance for safety.<br />
The high proportion of truck-trailer combinations<br />
and articulated trucks, altogether 55.0V0, (figure 18) is<br />
striking in this accident material. Even if the selection<br />
criteria had a certain influence, this does show the<br />
great significance of truck-trailer combinations and<br />
articulated trucks with respect to active safety and this<br />
confirms that in the case of these truck categories all<br />
possible technical efforts will have to be made to<br />
reduce the accident risk.<br />
An accurate assessment of questions of active safety<br />
presupposes detailed knowledge of the individual precrash<br />
situations and the typical behaviour patterndata<br />
which has up to now only been available to a<br />
limited extent and only rarely for typical truck categories.<br />
Experience to date shows that truck accidents can<br />
be classified iflto a few main types which recur with<br />
similar crisis situations.<br />
With regard to the recording criterion the following<br />
frequency of dominating "crisis situations" was to be<br />
found (Figure l9):<br />
I rear-end accidents on Autobahns (24.390)<br />
. single truck accidents (20.3V0)<br />
I accidents in the area of crossings (21.390)<br />
Truck typ+<br />
(rotal ladcn s?itht) Numbcr $<br />
Smnll truck :7r5 t 97 2t,9<br />
limpfq 1,t.k 7., - 12 | 15 39<br />
simDle truck 'l? t 63 l6 2<br />
Tru.k wrth irailcr ;28 t 31 80<br />
Ir(:k with trailer>?t : ft t 95 21.4<br />
Arliculated lorries 8B t L.o<br />
fo(nl of truckr rf,valved 389 r00 0<br />
5s0%<br />
Flgure 18. Representative sample of 300 truck accidents<br />
( = 3,5 tonnes); selection crlteria:<br />
cases with injury to truck occupants or<br />
safety-related demage to the driver'e cabln<br />
, mass category of the 397 trucks lnvolved<br />
683
m-coming traffic<br />
accident, straight<br />
orirorning traffic<br />
accidenl bend<br />
Collision at<br />
crossing/jrrnction<br />
EXPERIMENTAL SAFETY VEHICLES<br />
Totah 300 at:t:idents<br />
Figure 19. Frequency of critical pre-crash situatione<br />
It is typical of the pre-crash situations termed<br />
"oncoming traffic accidents straight" (l4.7Vo) and<br />
"oncoming<br />
traffic accidents bend" (10.790) that most<br />
of them are not characterised by wrong behaviour on<br />
the part of the truck. In three out of four cases the<br />
accident opponent-mostly a car- crossed onto the<br />
truck's side of the road through skidding, overtaking<br />
or excessive speed, unfavourable road conditions,<br />
wetness or snow, being present in about 50 to 7590 of<br />
the cases.<br />
Further details of the "crisis situation" result from<br />
the breakdown by vehicle categories (Figure 20). By<br />
far the largest proportion of the truck-trailer combinations<br />
and articulated trucks in the accident material<br />
r.'. I' i i / | /////fi 7/, 7I i'////r,<br />
: t<br />
// / r ;////// r f f/ f.///;/f /.<br />
,',' )'. / i,m<br />
/t l/////r't'////'/./ /, //<br />
I<br />
//<br />
Rcar+nd (:ollisiorrs<br />
Autobahn<br />
Rcar-cnd
ear-end accldents caused by false estimates of slow<br />
trucks could be avoided.<br />
The dominant occurrence of rear-end accidents on<br />
Autobahns also led to an analysis of the possible<br />
effect of a "distance warning device" for trucks. As<br />
was expected, it was shown that they would be of<br />
Breat benefit: 3l9o of the truck accidents on the<br />
Autobahn would certainly have been avoidable and a<br />
further 220/o might have been avoided or at least the<br />
resulting damage could have been reduced' On coun'<br />
try roads this figure is reduced, although it is still as<br />
high as l2.4Vo.<br />
It would be a pre-requisite, however, that the truck<br />
driver observes this information. The problems with<br />
overtaking, cutting by other vehicles, etc., are obvious-<br />
but if the development of a feasible distance<br />
warning device for heavy trucks, could be successful,<br />
a considerable proportion of the most serious accidents<br />
today could be avoided.<br />
In further studies the braking behaviour depending<br />
on the crisis situation and the possible benefit of an<br />
antilocking brake system (ALB) were examined<br />
(Figure 2l). The study showed that in 52'690 of the<br />
ca$e$ an emergency braking is made by the truck<br />
driver and that-especially in accidents at crossingsthere<br />
is, even today, an attempt to react by braking<br />
and steering. But as the wheels are locked this is not<br />
only unsuccessful but also involves the danger of<br />
secondary collisions.<br />
In a detailed case study the accidents were evaluated<br />
with regard to the possible benefit of an anti-locking<br />
brake system (ALB) using the definition: it was<br />
assumed that the accident would certainly have been<br />
avoided if the driver tried to react by steering and<br />
braking which would have resulted in avoiding the<br />
accident but which was not possible because the<br />
wheels locked. It was assumed that the accident would<br />
probably have been avoided as the accident situation<br />
had providecl a clear possibility of doing so if the<br />
driver had used a steering reaction in spite of the<br />
emergency braking. The effect of reducing the accident<br />
consequences was only taken into this category if<br />
tlr{+d (alliiimi, Auld$n 36<br />
Eo *mrtfry'y Frtsrnt<br />
i''", ;"; ;i*' "',<br />
l'<br />
<strong>SECTION</strong> 4. TECHNICAL SESSIONS<br />
v,ilr emcrf,cEy F*trd<br />
rorar<br />
I ol rrrq llcr.'{<br />
| ".,<br />
H.n...rd .olLr'dE<br />
o I 5 20<br />
18<br />
M..omint lralln .r.i&ilt<br />
-itIE;s':T -- l_n<br />
2L<br />
I<br />
27 3fi<br />
l1 7 1E I<br />
\tr'Rk truk &fffit t1 12 rS J<br />
I 5<br />
1l<br />
71<br />
*<br />
! 2<br />
t, G<br />
'il dll i rrsrs ersims 137 37 100 152 L3 r09<br />
r0<br />
t3<br />
'11<br />
t2.tt ll.6l, u.0 t 37.rt<br />
Flgure 21. Emergency reaction of truck drivers in the<br />
critlcal pre-crash phase<br />
a v€ry substantial reduction of accident intensity could<br />
have been expected with an anti-locking brake system,<br />
It was shown that high effectivity would exist for<br />
Autobahn accidents of trucks by using an anti-locking<br />
braking system about 7Vo of the truck accidents<br />
would certainly have been avoided and a furthet l9Vo<br />
probably. This high rate of avoidability is above all<br />
influenced by the proportion of accidents involving<br />
truck-trailer combinations, in which the trailer fre'<br />
quently gets out ol control if an emergency braking is<br />
made.<br />
ln the case of truck accidents on country roads the<br />
figures were lower because of the different traffic<br />
characteristics, but even so 3.lVo of these accidents<br />
could certainly and an additional 10.890 could probably<br />
have been avoided. If it is considered that irt<br />
about half of the accidents the crisis situation occurs<br />
so quickly and unexpectedly that an effective braking<br />
reaction cannot take place the anti-locking brake<br />
system offers a high degree of effectivetress.<br />
These findings confirnr independent studies into<br />
accidents of trucks with dangerous loads /10/ and bus<br />
collisions /ll/ in which it is estimated that the use of<br />
an anti-locking brake systcm would certainly avoid<br />
590 and probably l59o of the accidents.<br />
From a technical point of view fitting heavy trucks<br />
(12 t and up) with anti-locking brakes as standard<br />
equipment-especially, of course, articulated vehicles<br />
and truck-trailer combinations-is the principle mea'<br />
sure for reducing the existing braking problerns. With<br />
regard to the accident risk, however, in a second<br />
phase the smaller trucks, too, should be fitted with<br />
anti-locking brakes as standard equipment in order to<br />
avoid or reduce accidents especially in the crisis<br />
situations in crossings-frequently accompanied by<br />
extremely serious itrjuries to the accident opponents.<br />
The intention of the West German Covernment to<br />
make anti-locking brake systems compulsory standard<br />
equipment for trucks in the future is a decisive step<br />
towards more safety for trucks.<br />
In further studies based on the present accident<br />
material the peripheral conditions for the demands<br />
made on the anti-locking brake systems will be<br />
analysed. A warning, however, must be made against<br />
exaggerated hopes, since au accurate recording of the<br />
different parameters, such a$ Ioading conditions'<br />
changes in friction values in a longitudinal or transverse<br />
direction is very difficult and is often even<br />
impossible. Analysis of braking marks and the precrash<br />
frequency of trucks leaving the road and driving<br />
on to the shoulder lead us to expect, however, that in<br />
l09o of the accidents p-Split-conditions probably<br />
existed. For this reason, if trucks are to be fitted with<br />
anti-locking brakes as $talldard equipment, an optimum<br />
system of Category I in accordance with the<br />
ECE regulation R 58 /2/ should be aimed at.<br />
685
Summary<br />
685<br />
EXPERIMENTAL SAFETY VEHICLES<br />
Truck accidents represent a significant factor in the<br />
overall accident scene: every sixth fatal accident involves<br />
a truck; each year in Cermany about 1,700<br />
people are fatally injured in truck accidents and<br />
40,000 are slightly/seriously injured.<br />
With regard to passive safety (partner protection)<br />
the measures termed t*truck front underrun protection"<br />
in carltruck accidents and mounting a ,,side<br />
undoubtedly represents an improvement, although<br />
there are still problems in the case of offset impacts at<br />
an angle Onto the outer areas with the risk of the<br />
outer part being bent off. An improvement in the<br />
supporting reinforcing members and increased test<br />
loads in ECE-R 58 (150 KN instead of 100 KN) would<br />
be desirable; the rear underrun protection should have<br />
a clearance from the ground of no more than 30 cm<br />
and be mounted as near as possible to the rear end.<br />
underrun protection" in collisions with two-wheeled<br />
vehicles and pedestrians are of paramount importance,<br />
but the safety criteria for truck occupants<br />
should not be ignored either.<br />
With regard to the passiv e safety of truck occupants<br />
(self-protection) measures are possible and necessary<br />
in respect of a truck structure, the design of the<br />
interior and the use of restraint systems.<br />
In car/ffuck collisions the problem zones are to be<br />
found in the area of the truck front, in the outer<br />
left-hand third of the truck's rear end and on the<br />
truck side between the axles.<br />
About 6090 of the serious carltruck collisions<br />
The main problems connected with intrusion do not<br />
occur in truck collisions with objects but in collisions<br />
with other trucks. The decisive intrusion zone is<br />
therefore in the region between the bumper and the<br />
lower windscreen frame-typical of the collision with<br />
involve the truck front. By creating a truck front<br />
underrun protection system instead of the rigid<br />
bumpers, usually mounted at a high level nowadays, a<br />
considerable reduction of the risks to the car occupants<br />
can be expected.<br />
The development work to date shows that-although<br />
with some expenditure (costs, 150 kg weight,<br />
about l0 to 15 cm additional length)-effective solutions<br />
are possible by mounting energy-absorbing struc-<br />
the rear of a lorry. With regard to roof rigidity the<br />
present study does not reveal essential safety defects;<br />
in spite of, in ssme cases, massive intrusion, a<br />
necessary minimal survival space remained,<br />
Safety tests of the structural rigidity of the driver's<br />
cabin should therefore be carried out against structures<br />
similar to the rear structures of trucks /lZ/,<br />
Isolated loading of the roof does not correspond to<br />
real-life risk situations. Turning oyer onto the side or<br />
tural elements onto the carrier structure of a truck<br />
front pfotection as proposed.<br />
A front protection of this kind would have the<br />
advantage for the truck itself that in the event of<br />
accidents of considerable severity no direct impact<br />
would occur against the front wheel and this would<br />
avoid problems of damaging the steering and,/or the<br />
steerability (danger of secondary collisions).<br />
By being mounted at a low level, the front protection<br />
could act positively by increasing a deflection<br />
effect in collisions with two-wheeled vehicles and<br />
pedestrians who are quite often today knocked over<br />
and driven over; moreover some elastic absorption<br />
area could be attached to this delormation $tructure,<br />
and this might cushion at least to a limited degree the<br />
main points of impact.<br />
The principal requirement for passive safety in<br />
collisions with fwo-wfteeled vehicles and pedestrians,<br />
however, is to mount a side underrun protection and<br />
to consistently make the truck less aggressive in the<br />
region of the right-hand front and side area. The side<br />
underrun protection should be designcd with a plain<br />
surface in the total area between the front and rear<br />
axles, particularly since it should be effective not only<br />
in the case of glance-off collisions, but also in the<br />
case of relatively frequent impacts at an angle by<br />
motorcyclists in this area whcn the truck turns off.<br />
The rear underrun protection device in its present<br />
design in accordance with ECE regulation R 58<br />
even complete rollover, only rarely result in massive<br />
deformation of the driver's cabin and serious restrictions<br />
of the interior-the central problem is, rather, in<br />
the intrusion of the front area between the bumper<br />
and lower frame of the windscreen.<br />
In the truck's interior, energy-absorbing padding<br />
should be improved as it provides better protection<br />
against leg injuries to the driver, and avoids, as much<br />
as possible, his being wedged in in the event of<br />
intrusion of the front structure of the driver's cabin.<br />
The flat position of steering wheels nowadays<br />
represents a considerable injury risk to the chest,/abdominal<br />
region for the unrestrained truck driver. It<br />
should be proved whether truck steering wheels can be<br />
better designed from the biomechanical point of<br />
view- at least design measures must be taken to<br />
avoid the dangerous pushing upwards of the steering<br />
assembly in the event of intrusion of the fiont<br />
structure.<br />
The risks for truck drivers which dominate today as<br />
a result of ejection and impact in the interior,<br />
especially aI the steering column,/steering wheel,<br />
would be considerably reduced by wearing a safety<br />
belt; with safety belts-adapted, of course, to the<br />
specific requirement of trucks-a probable benefit<br />
could be expected in about 50go of the accidents<br />
recorded here, reducing in particular serious/fatal<br />
injuries to a greater extent. A negative effect, if the<br />
occupants are restrained in their seats, in the event of
intrusion did not prove to be relevant in this study<br />
and seems not to be different to the existins situation<br />
in passenger cars.<br />
In the field of active safety the standard equipment<br />
of trucks, especially trucks of 12 tonnes and up,<br />
truck-trailer combinations and articulated lorries with<br />
anti-locking brakes constitutes the central safety measure<br />
of the next year$. It is expected that the<br />
possibility of being able to steer and brake in emergency<br />
situations would certainly avoid 590 and probably<br />
l59o of the truck accidents and considerably<br />
reduce their consequences,-especially since these accidents<br />
frequently occur at relatively low collision<br />
speeds, but nevertheless result in extreme damage by<br />
reason of the great masses involved. But in a second,<br />
later equipment phase the lighter lorries (starting from<br />
3.5 tonnes and up), too, should also be equipped with<br />
anti-locking brakes, since especially lighter trucks are<br />
involved in accidents with considerable injury to<br />
people as a result of their being used in built-up areas.<br />
The great significance of accidents on Autobahns<br />
for heavy trucks was confirmed, rear-end collisions<br />
dominating, As an additional preventive measure to<br />
avoid accidents, an improved rear signalling system<br />
for trucks (warning for vehicles behind when trucks<br />
are driving unusually slowly on Autobahns) should<br />
also be examined as well as the use of distancewarning<br />
devices, especially on Autobahns. There are<br />
certainly considerable problems in the practical operation<br />
with these two possible mea$ures; by reason of<br />
the serious risks in these frequent critical situations,<br />
however. solutions must be achieved.<br />
The catalogue of measures described for active and<br />
passive safety must, of course, remain incomplete.<br />
But it has been possible to acquire a large body of<br />
representative material on truck accidents, and in<br />
further studies possible individual measures will be<br />
examined. The practical applications of the measures<br />
mentioned woultl, however, already result in a considerable<br />
improvement in active and passive safety in<br />
accidents involving trucks. In this connection intcrnationally<br />
uniform safety regulations should be available<br />
for trucks in order to achieve the same safety standard<br />
and uniform conditions of competition in the<br />
international traffic of today which will increase in<br />
future. But these regulations nust guarantee a high<br />
level of safety and must not represent a minimum<br />
common denominator.<br />
Even with an increase in the transport requirements<br />
of the truck, €conomy and safety are not contradictory<br />
demands. Studies of truck accidents must be<br />
continued and intensified to present criteria for deciding<br />
on future technical developments and possibilities<br />
of further advanced truck safety.<br />
<strong>SECTION</strong> 4. TECHNICAL SESSIONS<br />
Concluding Remarks<br />
The authors are indebted to all the member insurance<br />
companies of the HuK-Verband in particular for<br />
making their claims records readily available for this<br />
study, and to Messrs. Heider and Zistler, members of<br />
the HUK staff who carried out accident analysis and<br />
evaluation work. The authors also owe a debt of<br />
gratitude to the various police departments.<br />
References<br />
l. Statistisches Bundesamt Wiesbaden, Reihe 3.3,<br />
1984 / SS " Stradenverkehrsunfdlle"<br />
ECE-R 58; "Einheitliche Vorschriften ftir die<br />
Cenehmigung von Nutzfahrzeugen, Anhflngern<br />
und Sattelanhdngern hinsichtlich ihres rtickwdrtigen<br />
Unterfahrschutzes", Economic Commission<br />
of Europe<br />
K. Langwieder; F. GauF; W.D. Schmidt; M.<br />
Wrobel: "AuBere Sicherheit von Lkw und Anhdngern",<br />
Forschungsvereinigung Automobiltechnik.<br />
Schriftetrreihe Nr. 27<br />
K. Langwieder; M. Danner; M. Wrobel; "A<br />
Contribution to Risk Analysis and the Characteristics<br />
of Truck Accidents", XX. FlSlTA, Congress,<br />
Wien, May 1984<br />
M. Darrner; K. Langwieder: "Results of an<br />
Analysis of Truck Accidents and Possibilities of<br />
Reducing Their Consequences Discussed on the<br />
Basis of Car-to-Truck Crash Tests", Twentyfifth<br />
Stapp Car Crash <strong>Conf</strong>erence, San Francisco,<br />
September l98l<br />
a) l0 Lkw Crash Tests; b) Second Seria of<br />
carltruck crash tests 1984-87, (not yet published),<br />
HUK-Verband, Munich<br />
M. Danner; K. Langwieder: "Lkw-Frontschutz-<br />
ein wescnt licher Beitrag zu mehr Partncrschutz",<br />
TUV-folloquium<br />
"Nutzfahrzeug<br />
2000", December 1986, Koln<br />
K- Langwieder; M. Danner; W. Wachter; Th.<br />
Hummel: "Patterns of Multi-Traumatisation in<br />
Pedestrian Accidents in Relation to Injury Combirrations<br />
and Car Shape", 8. <strong>ESV</strong>-<strong>Conf</strong>erence,<br />
Wolfsburg, October 1980<br />
Research project: "Passive Safety of the Driver's<br />
Cabin of Trucks", Report to be published in<br />
cooperation with FAT, Frankfurt, 1987/88 (yet<br />
unpublished)<br />
10. K. Langwieder: "Unfhllauswertung bei Gefahrguttransporten",<br />
DEKRA Fachtagung, Gefahrguttransport<br />
auf der Starape, Wart, October<br />
r986<br />
ll. K. Langwieder; M. Danner; Th. Hummel: "Col-<br />
2.<br />
3.<br />
4.<br />
5.<br />
6.<br />
7.<br />
E.<br />
9.<br />
lision Types and Characteristics of Bus Accidents-Their<br />
Consequences for the Bus Passengers<br />
and the Accident Opponent", Tenth<br />
<strong>ESV</strong>-<strong>Conf</strong>erence, Oxford, July 1985<br />
687
12. ECE-R 29r "Einheitliche Vorschriften fiir die<br />
Genehmigung der Fahrzeuge hinsichtlich des<br />
Schutzes der Insassen des Fahrerhauses von<br />
EXPERIMENTAL SAFETY VEHICLES<br />
Nutzfahrzeugen", Economic Commission of Europe<br />
Typology of Traffic Accidents Concerning Cars Impacted by Trucks<br />
Giles Vallet,<br />
Michelle Ramet,<br />
Dominique Cesari,<br />
Claude Dolivet,<br />
Inrets-LCB,<br />
France<br />
Abstract<br />
The road traffic mixes in the same flow*light cars<br />
and heavy trucks: well thcn a large part of severe<br />
traffic accidents concerns trucks impacting light vehicles.<br />
Actually, if this type of accident does not occur<br />
freqrrently (4.5 percent of all accident$), it is very<br />
serious and 10 percent of traffic deaths are due to it.<br />
Using the sample o[ our bidisciplinary accident investigation,<br />
this study, concerning 53 cases of actual<br />
accidents, tries to precise the typology of truck-to-car<br />
accidents ancl thc influence of the type of irnpact on<br />
car occupants lesions. Then it determines the more<br />
representative impacts conditions.<br />
<strong>Int</strong>roduction<br />
This study is based on 53 cases of actual accidents<br />
in which a passenger car was impacted by a truck.<br />
Flgure 1. Welght of trucks<br />
688<br />
l0<br />
c<br />
l<br />
7<br />
0<br />
Number o<br />
I<br />
I<br />
8<br />
I<br />
0<br />
These data were collected over a period of five<br />
years from 1982 to 1986, by the bidisciplinary accident<br />
investigation team of the L.C.B.(Inrets France).<br />
We can explain the limited number of cases by the<br />
fact that, on the one hand, the bidisciplinary study<br />
collects all types of traffic accidents and, on the other<br />
hand, it is often impossible to trace the truck, which<br />
leaves the scene of the accident quickly if it is only<br />
slightly damaged.<br />
The aim of this study is to establish the origins of<br />
crash severity, for this type of traffic accident.<br />
We consider as truck, any heavy good vehicle of<br />
which the full weight is higher than 3,500 kg and less<br />
than 38,000 kg. Among these 53 heavy trucks, we<br />
have only four coachs, the 49 others are 27 articulated<br />
and 22 non-articulated trucks. In the 53 passenger<br />
cars, we have 86 passengers involved, 53 drivers and<br />
33 passengers.<br />
Some Considerations Coneerning<br />
Characteristics of Trucks Involved<br />
Truck Mass flnd Pessenger Cflrs Mass<br />
Figure I introduces the actual truck mass at the<br />
accident time, i-e, the truck weight plus load weight.<br />
t a q i l r t t t g l n l l H t n t<br />
Weight (t)
<strong>SECTION</strong> 4. TECHNICAL SESSIONS<br />
We can see in our sample an approxirnately regular<br />
distribution between 3,500 kg to 12,000 kg, concerning<br />
one-third of this sample. Then, we notice a peak<br />
of 12,000 kg and 16,000 kg truck weight, rhen a<br />
uniform distribution between 18,000 kg and 26,000<br />
truck weight. Finally, we notice the highest peak<br />
(38,000 kg) usually fbr rractor semi-trailers.<br />
We observe that we have no trucks between 26,000<br />
range Of mef,,gurements is very extensive between 38<br />
cm and 70 cm.<br />
For the passenger cars, the distance from bumper<br />
top to ground is around 50-52 cm for recent vehicles.<br />
Impact Speed<br />
Clearly, this is one of the most difficult frarameters<br />
to determine, and we may not therefore generalize on<br />
kg and 37,000 kg.<br />
impact speeds for each vehicle. However, we were<br />
The articulated trucks (tractor and semi-trailer)<br />
(38,000 kg) represent about 20 percent of our sample.<br />
able to establish in 13 cases, the truck speed immediately<br />
before impact. This measurement came from the<br />
The absence ol' trucks between 26,000 kg and chronotachygraph logdiscs. Unfortunately, these log-<br />
87,000 kg can al.so be explained since this type of discs are difficult to read and since the time between<br />
truck is used essentially on building sites.<br />
the beginning of braking and the impact is usually<br />
When we consider the weight plus load of passarger<br />
cars (fig. 2), we notice that an important part of them<br />
extremely short, the speed registered on the disc is<br />
often higher than the actual speed on impact. Morc-<br />
are medium sized, indeed even small sized.<br />
over, the logdisc is often missirrg or illegible for<br />
This distributiorr is, in fact, very repre$entative of various reason$.<br />
French number of cars on the roads,<br />
We have thus 13 speeds varying between 50 and 85<br />
Distance from Ground to Bumper for Heavy<br />
Trucks<br />
This parameter is very important because it deter,<br />
mines the underruning of passengers cars under the<br />
truck.<br />
In fact, one of the most important factors is that,<br />
when a truck collides with a passenger car, it generally<br />
km/h, and one case ol'30 km/h. The average speed is<br />
63,8 km/h with a standard deviation of around 15,3,<br />
i-e. 67 percent of the speeds recorded are between 48<br />
and 79 km/h. These speeds (even allowing for them<br />
being slightly higher than reality) are indeed high, and<br />
especially if we consider that for those cases where the<br />
log disc was available, the striking passenger cars were<br />
still moving.<br />
hits the car above the bumper i-e, the deformable part<br />
of the front end, or even the engine part.<br />
We have measured the distance ground,/truck<br />
bumper for our truck sample. These mea.surements<br />
We will have the opportunity to return ro the<br />
problem of impact speed.<br />
Different Impact Types<br />
were carried out on fully loaded trucks. We established<br />
two categories: articulated and non-articulated<br />
trucks as can be seen on fig. 3 and 4.<br />
We categorized accidents according to impact type<br />
for each vehicle; frontal, rear on lateral, and established<br />
5 classifications (t'igs. 5 and 6). Bv Fronto-<br />
The averages are very similar and are situated Lateral, for example, we mean frontal shock for the<br />
around 54.5 cms. On the other hand, we note that the passenger cars, and lateral for the HCV, The class<br />
7<br />
0<br />
E<br />
Number<br />
c<br />
Flgure 2. Weight of passenger vehicles<br />
I<br />
I<br />
0<br />
0.6 0.66 0,t o.al 0.? o.tt 0,a o,& 0, 0,a6 r ld||[ r,l I,16 rJ r,$ r,t r.t6 r.a r.a6 r.!<br />
Weisht (t)<br />
689
Height (cm)<br />
Figure 4. Bumper height of 13 tractor-treller unlts<br />
Number<br />
llfrE ril<br />
Flgure 5. TrucUpassenger vehicle lmpact type$<br />
690<br />
Hetght (cm)<br />
25<br />
?0<br />
t F<br />
l0<br />
5<br />
0<br />
EXPERIMENTAL SAFETY VEHICLES<br />
Number<br />
Flgure 3. Bumper helght of 33 non-artlculated trucks<br />
Number<br />
- BIJIPEF ITIGHT tr 33<br />
HON AFTICIJLITED<br />
IHUCXS<br />
--. AVEN^GE 8IJI#EF IIEIEI{I<br />
_ BUI4PEF HEIGHT OF 13<br />
TNACTOF-TFAILEA UNITS<br />
... AVEFAGE EUI{FEH HEIGHT
Number<br />
t 1, 32X<br />
15,09X<br />
<strong>SECTION</strong> 4. TECHNICAL SESSIONS<br />
g, 431<br />
22, 64I<br />
Flgure 6. Trucks passsnger vehicle lmpact typee (96)<br />
entitled "vs1isqs" includes impacts difficult to classify<br />
and "rear-frontal" shocks,<br />
The most frequent impact type is the Fronto-<br />
Frontal type (42 percent of all cases), which most<br />
frequently takes place after a loss of control by one of<br />
the drivers, or after overtaking.<br />
Fronto-Lateral and Latero-Frontal types have been<br />
separated in our classification, $ince the lesion mechanisms<br />
for car occupants are completely different.<br />
Howsysl, these two types of shocks do have in<br />
common the fact that they most frequently occur at<br />
road intersections.<br />
They represent respectively 27.6 and 15.l percent of<br />
all cases, i-e, when combined, almost 38 percent of all<br />
cases, followed by Fronto-Rear impacts (iust over l0<br />
percent) and the "various" category )also around l0<br />
percent). Each impact type will be studied separately.<br />
Impact Direction<br />
By '*Impact Direction" we mean the direction of<br />
the main force applied to the vchicle during impact.<br />
This direction is indicated on a horizontal plane, by a<br />
clock face reference system "12 o'clock" representing<br />
the direction along the axis of the vehicle from the<br />
exterior to the vehicle (Diae. 1).<br />
,n-<br />
tn\<br />
ti<br />
/on ./in<br />
t2h + th<br />
,'rn/ ,o! ,l ).<br />
Diagram 1<br />
\rn<br />
41,511<br />
fi<br />
N<br />
E<br />
!<br />
I<br />
Fron tofrontal<br />
Fnon t olBterd<br />
I<br />
Latef0f<br />
nonta<br />
I<br />
Fnonto-rean<br />
Van ious<br />
However, it must be noted that this orientation of<br />
force does not allow us to anticipate impact area: it is<br />
quite possible to have direction " l l o'clock" and<br />
impact on the left-hand rear wheel.<br />
Figs. 7 and 8 show the distribution of impact<br />
directions for different vehicle categories. In both<br />
cases, the directions ll and 12 o'clock are in the<br />
majority, which confirms the importance of Fronto-<br />
Frontal impacts: the most frequent source of these<br />
directions. Furthermore, for trucks, we observe a high<br />
number of 3 and 6 o'clock directions, which may<br />
often indicate lateral and rear impacts.<br />
Impact Location<br />
This is shown on figs. 9 and 10, once again with a<br />
clear majority for frontal impacts. However, we<br />
observe a difference between trucks and passenger<br />
vehicles as far as other impact locations are concerned.<br />
For the passenger vehicle, there is a high<br />
difference between left and right-hand sides, and few<br />
impacts at rear, whereas for trucks, neither left nor<br />
right-hand sides predominate, and rear impacts are<br />
frequent.<br />
These different accident characteristics seem to<br />
indicate the importance of Fronto-Frontat impacts<br />
truck-passenger vehicle in accidentology.<br />
The Fronto-Frontal Impact<br />
This type of crash involves 22 trucks and 22<br />
passengers car (with 26 occupants).<br />
Firstly, we exarnined underrun on impact, and<br />
established four types of underrun for passenger<br />
vehicles. In the case of underrun, we studied the area<br />
of the passenger vehicle which had actually been in<br />
collision with the truck. Our four categories are; all<br />
the front of the car, two-thirds, one-third, side-swipe.<br />
Side-swipe produces low underrun, since the two<br />
69r
Flgure 7. Paseenger vehicle impact directlon<br />
vehicles tend to move along at a tangent. We refer to<br />
figs. ll and 12, where for approximately 1/3 of all<br />
cases, underrun for the passenger vehicle was total,<br />
and similarly for the category "two-thirds", whereas<br />
side-swipe represents only 14 percent of all cases. This<br />
may be explainecl by the fact that these accidents most<br />
frequently originate from a loss of control by the<br />
truck or passenger vehicle drivers: and in all the cases,<br />
we examined in the "all-front" and "two-thirds"<br />
underrun categories, there were never traces of the<br />
driver trying to avoid collision, except for some cases<br />
of last-minute braking. This is not the case for<br />
side-swipe, in so far as this type of accident is usually<br />
the result either of a loss of control, and an unsuccessful,<br />
too-delayed to avoid collision or else an error<br />
of judgment in distances when overtaking or at<br />
cro$sroads.<br />
Nurnber<br />
Figure 8. Truck lmpact direction<br />
692<br />
EXPERIMENTAL SAFETY VEHICLES<br />
rrll, , ,.I, , ,r-az<br />
3 4 S s 7 i e t o<br />
Direction (clock face)<br />
r 6 a<br />
Direction<br />
To study the actual damage caused to passenger<br />
vehicles, we use a system of coding called VDI<br />
(Vehicle Damage lndex), the last parameter-crushing<br />
is used below, and is distributecl as follows:<br />
VDI Code no. 5 corresponds to damage reaching<br />
windscreen. Thus we see that our sample is mostly<br />
made up of seriously damaged vehicles. In fact,<br />
damage Code nos. 6-7-8,9 which correspond to some<br />
crushing of the survival $pace area, make up 50<br />
percent of our sample.<br />
As far as occupants are concerned, driver death rate<br />
is exceedingly high at 60 percent. We would point out,<br />
? t f<br />
(clock face)
. !<br />
i<br />
tot<br />
:<br />
I<br />
Number flI<br />
tffis Lcl<br />
I<br />
roI<br />
I I<br />
oL-<br />
Flgure 9. Truck lmpact locatlon<br />
Number eo{<br />
Figure 10. Pes$onger vehicle impact locataon<br />
6<br />
7<br />
B<br />
6<br />
Ntrmber a<br />
IFals Lct<br />
Figure 11. Trucldpassenger vehicle underrun<br />
2<br />
I<br />
o<br />
<strong>SECTION</strong> 4. TECHNICAL SESSIONS<br />
Right sftIc Stu<br />
Location<br />
Rllbt rldo Riil<br />
Location<br />
,_Nl ,<br />
Ijft $i4c<br />
Slde-srtpc
18, 18X<br />
Number<br />
EXPERIMENTAL SAFETY VEHICLES<br />
31, Bet<br />
Flgure 12. Truck/passenger vehlcle underrun (tl6)<br />
however, that only 20 percent of these drivers were<br />
restrained, a very low figure, even considering our<br />
study was carried out before the recent French Campaign<br />
to enforce seat-belt wearing.<br />
If we compare vehicle damage with occupant injury,<br />
we see that out of I I drivers with vehicle<br />
damage Code 6-7-8 or 9, only 2 survived (i-e 82<br />
percent death rate).<br />
These 2 cases merit further study. In the first one,<br />
the driver was restrained, and the VDI coded 8. This<br />
is a high rate of damage, but in this case, was limited<br />
widter since underrun was only one-thirds. The OAIST<br />
code for the driver is 3.<br />
In the second case, the driver was unrestrained, and<br />
the VDI also 8. However, this was a case of sideswipe,<br />
and since there was delayed impact. Furthermore,<br />
the passenger vehicle was not overrun by the<br />
truck: so the energy of the 2 vehicles was not totally<br />
used by the collision, which partly explains the OAIS<br />
of 2 (slight injuries). It would thus seem that the<br />
highest degree of damage is a criterion of impact<br />
severity, but which must be examined in association<br />
with underrun.<br />
If we observe the less-damaged vehicles, we find<br />
five deaths (50 percent). There is thus a correlation<br />
between VDI and injurity severity. Furthermore, for<br />
injured surviving drivers (6 drivers), there are 6 cases<br />
of side-swipe, thus no underrun. For passengers, there<br />
are no severe injuries, but the collisions in question all<br />
occurred with delayed impact on left-hand side, i-e,<br />
the cabin was not impacted on their side.<br />
lThe {)AIS ir the international coding system for occuPmt injury on a scale<br />
of 0 (uninjured) to 6 (deceased).<br />
694<br />
n Alt of fnont<br />
$l Tno-thinds<br />
fi 0ne-third<br />
I Side-swipe<br />
Fronto-Lateral Impact<br />
This type of impact involves 12 trucks and 12<br />
passengers cars (with 2l occupants).<br />
In this type of impact, underrun is less severe, and<br />
the impacting zone of the truck becomes a determining<br />
factor. Some zones, such as wheels, and spare<br />
wheels, $eem particularly aggressive, others less so,<br />
such as some types of underrun side-guards. Tractor<br />
fuel tanks, on the other hand, appear in our sample<br />
to be a relatively t'avourable zone: we have three cases<br />
in which the fuel tank undoubtedly absorbed the<br />
shock. It is also of interest that damage to passenger<br />
vehicles in this type of collision is clearly less severe<br />
than in the case of Fronto-Frontal impact. This is<br />
demonstrated in the following table, which indicates<br />
VDI distribution: maximum level is 4.<br />
t t t t t t t t t l<br />
I r l z | 3 | 4 | 5 I 6 | 7 | 8 1 9 |<br />
t t r t t t t t r r l<br />
l l<br />
I N"ofcaeee I I 13 | 5 | 3 | 0 | 0 | 0 I o lo I<br />
l l r t t l l l l l l<br />
In confirmation of this result, we find a lower<br />
occupant death rate (22 percent), even though only<br />
one driver was restrained. Similarly, amongst surviving<br />
occupants, we find only one injured person OAIS<br />
4, and 3 OAIS 3, which means that severely injured<br />
occupants also represent only 22 percent of total. As<br />
it is also the case with Fronto-Frontal impact, avoidance<br />
of underrun, when applicable, is a beneficial<br />
factor.<br />
Other Impact Types<br />
We have chosen to group together other types of<br />
shocks since our sample was only a small one. ln spite<br />
of the difficulty in the drawing conclusions for this<br />
category, we are able to point out that lateral impact<br />
is always severe for the passenger vehicle (as is also
the case for collisions betweEn 2 paswngers vehicles).<br />
Indeed, in our sample, death rate for occupants on<br />
impact side, when the cabin is damaged, is 75 percent.<br />
Survival rate for occupants on the opposite side<br />
depends on two factors: if they are restrained, and the<br />
speed of truck impact.<br />
As far as wearing a belt is concerned, our observations<br />
are drawn from studies carried out on collisions<br />
between passenBer vehicles, since none of the occupants<br />
in our survey were restrained.<br />
For the second point, as soon as truck speed can no<br />
longer be qualified as "slow" (or even "very slow"),<br />
we have no survivals. By slow speed, we mean speeds<br />
resulting from heavy braking (ground marks) or from<br />
an initial shock (which slows the truck considerably).<br />
Fronto-Rear impacts may be assimilated to Fronto-<br />
Frontal impacts with one notable difference: the<br />
speeds of the two vehicles are to be substracted rather<br />
than cumulated.<br />
Truck Occupnnts<br />
Only two truck occupants were injured. One, at the<br />
wheel of a tractor semi-trailer was in Fronto-Lateral<br />
collision with a CX, suffered a slight hand wound<br />
(OAIS l); the other sole occupant of a l0 t coach was<br />
hit at high speed by a R 25 in a Fronto-Frontal<br />
impact, and had a fractured lee (OAIS 2). This<br />
second case may be explained by the fact that in a<br />
coach, runlike other trucks, the driver's seat is relatively<br />
low. Furthermore, the bodywork of coaches is<br />
different to that of trucks, and more easily deformable.<br />
Conclusion<br />
Our study included 53 pairs of vehicles involved in<br />
accidents: this figure is obviously a very small one.<br />
<strong>SECTION</strong> 4. TECHNICAL SESSIONS<br />
But we would point out that, in 1,985, trucks involved<br />
in accidents resulting in corporal injuries represented<br />
only 5.5 percent of all vehicles involved.<br />
What may we deduce? First of all, it seems that the<br />
most frequent type of impact is the Fronto-Frontal;<br />
therefore this type will be the most interesting source<br />
of study for Truck/Passenger vehicle collisions.<br />
We have also seen that underrun is an important<br />
parameter in impact severity. our survey shows that<br />
the most frequent type of underrun is the two-thirds<br />
one. Indeed, this type represents almost one-third of<br />
all cases, one other third being complete underrun;<br />
the other configurations together making up the<br />
remaining third.<br />
Bibliography<br />
D. Vullin, Accidents avec sortie de chaussde en TPC<br />
sur autoroutes de liaison.<br />
B. Chretien, C. Danner, A. Ciesi, La constitution et<br />
I'evolution du Poids Lourd. Etude Seres-Onser<br />
I 980.<br />
LD. Neilson, R.N. Kenp, H.A. Wilkins, Accidents<br />
involving heavy goods vehicles in Creat Britainl<br />
frequencies and design aspects. TRRC Report<br />
474.<br />
M. Dejeammes, J.L. Masson, G. Vallet, M. Ramet,<br />
SdcuritC des vdhicules de transport utilitaires et<br />
commerciaux. ONSER. Aofit 1984.<br />
C. Uny, Accidents de circulation impliquant des Poids<br />
Lourds. Thdse prEsentde ir I'Universit€ Claude<br />
Bernard LYON. Novembre 1982.<br />
G. Cashera, Rdle des Poids Lourds en traumatologie<br />
routiere. au cours de collisions avec des voitures<br />
. ldgdres. Thbse prdsentde I I'Universitd Claude<br />
Bernard Lvon. 1981.<br />
Seat Belt Effectiveness for Heavy Truck Oecupants During a Collision<br />
Mitsuo Horii,<br />
Kunio Yamazaki,<br />
Japan Automobile Research lnstitute, Inc.,<br />
Yuji Amemiya,<br />
Japan Automobile Manufacturers<br />
Association, Inc.,<br />
Japan<br />
Abstract<br />
In spite of the abundance of passenger car seat belt<br />
studies in various related fields, seat belt tests and<br />
studies for heavy trucks, which are substantially<br />
different in body structure from passenger cars, have<br />
been the minority.<br />
To obtain basic data for evaluating the seat belt<br />
effectiveness of heavy trucksn the following were<br />
studied:<br />
l) The analysis of prediction of ratios by which<br />
the effectiveness of seat belt$, based on a<br />
statistical study of accidents involving heavy<br />
trucks.<br />
2) Sled tests were conducted by simulating the<br />
barrier impacts of heavy trucks, and the<br />
magnitude of impact on the occupant wearing<br />
seat belt$ and not wearing them was<br />
compared.<br />
695
3l And the tests rryere conducted with different<br />
sled floor acceleration, impact speed, and<br />
their influence on occupant behavior was<br />
studied.<br />
The results of the above l) - 3), and their analysis<br />
results are reported as the first step in safety study for<br />
heavy truck occupants.<br />
<strong>Int</strong>roduction<br />
Many studies have been made so far on the seat<br />
belts, those of passenger cars in particular, by leading<br />
nations of the world. These studies cover a wide<br />
scope, including (1) the evaluation of seat belt effects<br />
based on accident survey results, (2) the development<br />
of seat belts designed to improve occupant protection<br />
characteristics, and (3) the development of passive<br />
seat belts.<br />
On the other hand, many nations have made<br />
statistical studies of accidents involving heavy trucks,<br />
and after analyzing the study findings, have reported<br />
that the following are important for the heavy truck<br />
safety(l)-(7)<br />
l) The necessity of seat belts<br />
2) Reinforcement of cab strength to seeirre<br />
survival space<br />
3) Rollover countermeasures<br />
4) Prevention o[ under-ride in front and rear<br />
5) Improvement ol energy absorption by the<br />
steering wheel and dashboard.<br />
In the case of experiments concerning safety during<br />
heavy truck collisions, reports and data are primarily<br />
related to 2) and 4) above; that is, the reinforcement<br />
of cab strength and the prevention of under-ride(g)-<br />
(10).<br />
As for studies of the seat belts of heavy trucks<br />
where body construction, dimensions, specifications,<br />
etc. differ from those of a passenger car, we can cite<br />
a single example made in 1980 in West Ciermany at<br />
the Battle Institute,(ll) in which they studied the<br />
performance of passenger protection under various<br />
belt conditions.<br />
In spite of clamorous appeals for the necessity of<br />
seat belts, studies dealing with the seat belts of heavy<br />
trucks are seldom found among survey analysis and<br />
the results of heavy truck accidents,<br />
To investigate the effectiveness of seat belts when a<br />
cab-over type heavy truck (GVW, 20 tons) has a<br />
collision, we made a systematic study of the scale of<br />
impact on the occupant and the scale of injury to the<br />
occupant in relation to iftpact speeds using and not<br />
using seat belts through (l) the analysis of prediction<br />
of ratios by which the effectiveness of seat belts.<br />
based on a statistical study of accidents involving<br />
heavy trucks are shown, (2) sled tests under various<br />
696<br />
EXPERIMENTAL SAFETY VEHICLES<br />
seat belt systems and (3) a full scale collision re$r as a<br />
preliminary test. Reports thereof follow below.<br />
In the sled test, experiments were made so as to<br />
generate a nearly equal impact to that of a heavy<br />
truck when it makes a frontal collision with a flat<br />
barrier. To establish the impact conclitions for the sled<br />
te$t, a test of fronlal collisions of heavy trucks with<br />
the flat barrier was made first to determine the scale<br />
of impact on rhe body during collision.<br />
On the Effectiveness<br />
of Heavy Truck<br />
Seat Belts Seen From Accident Survey<br />
Findings<br />
Figure I shows the heavy truck accidents (9,710<br />
cases) involving heavy trucks in 19g3 in Japan by<br />
collision areas. Accidents involving pedestrians and<br />
motorcycles are excluded.<br />
The front is the overwhelmingly dominant collision<br />
area with 72-ZTo of fhe total suggesting a considerable<br />
level of seat belt effectiveness as long as a survival<br />
space has been secured in the cabin.<br />
Figure 2 shows the occurrence ratio of the part of<br />
total accidents which consists of accidents where the<br />
cab front was hit and single accidents (roll-overs,<br />
collision with structures, etc.) where occupant injury<br />
levels would have been lowered by seat belts.<br />
The hatched area in the graph shows the number of<br />
drivers killed or seriously injured in spite of little cab<br />
deformation (that is, the $urvival space in each cabin<br />
was secured) in the rear-end collisions. frontal colli_<br />
sions and single accidents. In other words. this data<br />
shows that seat belts would have alleviated the injuries<br />
suffered by this number of drivers.<br />
In the case of heavy truck accidents involving<br />
deaths and serious injuries, it is predicted that such<br />
injuries would be alleviated by about ZSt/o if secondary<br />
impact in the cabin is eased, or prevented, by<br />
using seat belts.<br />
The number of the dead or seriously injured in the<br />
graph (78 persons) are for the drivers alone and the<br />
number will increase if the passengers are inclucled.<br />
-e<br />
o<br />
--}<br />
IN<br />
)[l<br />
I l<br />
I t<br />
Lt I<br />
?<br />
(i) FrunLrr (:,,r I tsron<br />
O stde colttrrm*<br />
O R€ar-end col1trtfi<br />
Note) i The side cdllr*ron, t7.lX<br />
HB c,l4xlar€d froE rhe tsL!htlon<br />
of sccldeilre ciluicd bi<br />
sudden budplng ilnd dlrinfl<br />
IeIL/, irhr trrns, 16gy iadlud.,<br />
.iol.llslons wlrh hegvy<br />
truck froni+,<br />
Figure l. Heavy truck accident$ by collision areas (ln<br />
Japan, during 19BB)
+<br />
The numler of drivert serlously injured<br />
or killed in epite of little cab<br />
defornati on,<br />
Thc number of drivers seriouslv injured or killcd slen<br />
cab were seriously damaged.<br />
Figure 2. Prediction of seat belt effectlyenesa In<br />
heavy truck accldents<br />
As seen, a rough picture of the degree of the<br />
effectiveness of seat belts in heavy truck accidents was<br />
envisaged from ascident survey findings. Though<br />
accident survey$ can clarify statistical ratios, they<br />
cannot explain how impact velocity and degrees of<br />
acceleration affect drivers' injuries. Hence, full scale<br />
collision tests and sled tests were made to draw<br />
conclusions concerning these effects.<br />
A report of these tests follows:<br />
Frontal Collission Test of a Heaw<br />
Truck With a Flat Barrier<br />
To establish impact conditions for a sled test<br />
required to review the effectiveness of seat belts when<br />
a heavy truck makes a frontal collision with the<br />
barrier and to investigate the passenger behavior<br />
during impact condition, a preliminary frontal barrier<br />
impact test of a heavy truck was made to study the<br />
scale of impact applied to the cabin, the duration<br />
time. etc.<br />
A special emphasis was put on the degree of cabin<br />
floor acceleration which greatly affects an occupant's<br />
injury level in a collision.<br />
ln the current test, the collision speed was determined<br />
to be 20 mph (32 km/h) based on foreign<br />
studies(5),(ll),(12) made so far on<br />
(l) Driving speeds<br />
(2) The composition of impact speeds in heavy<br />
truck accidents and<br />
(3) Impact speeds used in actual test.<br />
In addition, to study dummy behavior in a collision,<br />
three Pan 572 dummies (HYBRID-II) were put<br />
on the driver's seat, the center seat, and the passenger's<br />
seat with a 3-point seat belt (NLR), a 2-point<br />
seat belt, and a no belt, respectively. A measurement<br />
of injury values was also carried out.<br />
Figure 3 shows a test scene. To examine dummy<br />
behavior during a collision, the door panel was cut<br />
open for the test but it was reinforced to provide the<br />
same Iongitudinal crush strength of the door in a<br />
collision as before the cutting (the standard condition).<br />
<strong>SECTION</strong> 4. TECHNICAL SESSIONS<br />
'$s{rM.r,ld: .m;ffi--Yr<br />
Figure 3. A test scene<br />
[Test Results]<br />
Figure 4 shows the deformation around the cabin,<br />
after the test.<br />
i) Cabin deformation<br />
As the main frame is highly rigid, the deformation<br />
of the cabin after collision is slight, roughly 6090 of<br />
the passenger car level if absolute values of deformation<br />
are cornpared. The crush stroke of cab frontpanel<br />
is approximately 180 mtn and the survival space<br />
in the cabin is secured sufficiently.<br />
ii) Acceteration of the Cabin<br />
The waveforms of cabin floor acceleration, measured<br />
in the neighborhood of the driver's seat and the<br />
cFt'<br />
# ffi<br />
Figure 4. Cab deformation after the test
Gso<br />
E<br />
P<br />
L<br />
(u<br />
G)<br />
(d<br />
L<br />
o<br />
q-<br />
€<br />
40<br />
30<br />
20<br />
T'ime (ms )<br />
Figure 5. Waveform of cabin floor acceleration<br />
passenger's seat, have two peaks of duration time of<br />
acceleration of 40 to 45 ms and the maximum<br />
acceleration of 55 to 60C as shown in Figure 5. As a<br />
whole, the waveform can be patternized as a triangle<br />
waYe,<br />
Compared with those of passenger cars, this waveform<br />
features a short duration time, roughly 50Vo<br />
shorter, and a steep rise.<br />
Irrespective of the occupant's use of a 2-point seat<br />
belt or no belt, ride-down effects are not usually<br />
realized unless the duration time is longer than 100<br />
ms. Therefore, in the case of an impact where l.he<br />
duration time is 40 to 45 ms at best, as in this test,<br />
the occuparts are caused secondary impact with<br />
interior $tructures and devices at the initial speed<br />
maintained before the collision aftcr the vehicle is<br />
stopped without re$pect to the shapes of the acceleration<br />
waveforms of the cabin. This short time waveform<br />
therefore implies critical conditions for the<br />
driver.<br />
iii) Dummy behavior<br />
Figure 6 shows the behavior of a dummy during<br />
impact condition by the time series.<br />
r Driver's seat (3-point belt)<br />
The knees come in contact with the lower<br />
part of the instrument panel as the belt<br />
extcnds. However, other parts do not come<br />
in contact with the panel.<br />
r Center seat (2-point belt)<br />
The torso fell forward with its hip in position<br />
to allow the head and face to hit the<br />
instrumint panel.<br />
r Passenger's seat (without belt)<br />
After the knees hit the instrument panel, the<br />
EXFERIMENTAL SAFETY VEHICI,ES<br />
torso fell forward while the hip was raised<br />
upward, and the head went out through the<br />
front glass to reach the barrier.<br />
Dri ve r' s<br />
sea t<br />
( 3- po'i nt be I<br />
( 2-point be<br />
Displacement (mm)<br />
ror<br />
'ii",<br />
xlo<br />
1'<br />
ao<br />
rol,;o9-P-<br />
Displacement (mm)<br />
Since valrres of shoulder, hip and knees<br />
ctruld not read as they were behind the<br />
dunrnry seatinq in the pdssenger's seat,<br />
values for the head alone are shovrn.<br />
Passen-<br />
Di spl acemettt (ntm)<br />
tn- -*t -"<br />
,oo ll<br />
f i<br />
w-/<br />
/<br />
!rro'./'<br />
t++:j<br />
t i<br />
6 0<br />
t?o<br />
r<br />
.,nJ ;<br />
f - F t - . - -<br />
Flgure 6. Dummy behavior during impact conditlon<br />
/'<br />
{*<br />
o<br />
6<br />
a<br />
I<br />
a.)<br />
o<br />
0<br />
6<br />
o<br />
E<br />
o<br />
E<br />
U<br />
6<br />
6<br />
o
iv) Values of passenger injury<br />
Figure 7 shows thc injury values obtained from this<br />
test as reference value.<br />
r)<br />
2)<br />
3)<br />
If a 3-point belt is wornn impact on the head,<br />
the chest and the femur are all below the<br />
injury criteria of the human tolerance prescribed<br />
bv FMVSS 208, but<br />
If a 2-point belt is worn or no belt, the head<br />
comes in contact with the instrument panel<br />
or with the barrier front, the head penetrates<br />
into the windshield, respectivcly, pushing up<br />
head injury values much higher than<br />
HIC: 1000.<br />
As for the chest and the femur, injury values<br />
are less than the injury criteria of FMVSS<br />
208 irrespective of the use of a belt.<br />
3-point bel t<br />
2-point bsl t<br />
No belt<br />
3-l)oint bel t<br />
?-poi nt be1 t<br />
No belt<br />
3-point belt<br />
2-point bel t<br />
No bel t<br />
Figure 7. Passenger Inlury valuee (trontal collision of<br />
a heavy truck wlth the flat barrier at 32<br />
km/h)<br />
Sled Test<br />
Injury criteria of Fl.iVSS 208<br />
+,<br />
Che, i- dcceleration (G)<br />
Femur load (kgf)<br />
Outline<br />
To study the effectiveness of a seat belt when a<br />
heavy truck makes a collision, the HYGE impact test<br />
equipment, hereafter called "the sled", was generates<br />
when it makes a frontal collision with the flat barrier.<br />
In the test, a device modelled on the compartment of<br />
the driver's and passenger's seats of a cab-over tyFre<br />
heavy truck was fixed on the sled and a given level of<br />
impact was administered to it after loading belted<br />
dummies or a beltless dummy on it<br />
Figures 8 to l0 show the test conditions.<br />
Part 572 dummies were used as human body<br />
dummies and seat belts were fastened in the following<br />
manner:<br />
<strong>SECTION</strong> 4. TECHNICAL SESSIONS<br />
(1) Driver's seat 1) 3-point belt with NLR<br />
2) z-point belt with NLR<br />
3) No belt<br />
(2) Assistant's seat 1) 3-point belt with ELR<br />
(that $enses floor acceleration<br />
of 0.4G)<br />
2) z-point belt wirh NLR<br />
3) No belt<br />
Figure 8. A eled test scene<br />
Figure 9. Driver's seat (3-point belt with NLR in us6l<br />
Figure 10. Assistant'sseat<br />
(3-point belt with ELR in<br />
use)
Impact Conditions<br />
Generally, the duration time of acceleration applied<br />
on the body floor in a frontal collision with the<br />
barrier remains almost constant irrespective of the<br />
impact speed and, in the case of a heavy truck, is<br />
roughly 50 ms.<br />
In the sled test, the duration time of the floor<br />
acceleration of the sled was set constantly at around<br />
50 ms to give a similar impact to that generated by<br />
the heavy truck when it makes a frontal collision with<br />
the flat barrier and impact were given under various<br />
acceleration degrees, that is, different impact speeds.<br />
Test Results and Review of Results<br />
l) Comparison of the results of a full-scale<br />
collision test and of a sled test<br />
Figure 12 compares the waveform of cabin floor<br />
acceleration in the full scale frontal collision test (32<br />
km/h) with that of the sled floor acceleration in the<br />
sled test (at 37 km/h). In the case of the full scale<br />
test, the waveform shows a very steep rise but, in the<br />
case of the sled test, it is as if the waveform of the<br />
former is simply patternized into a triangle wave, or a<br />
half sine wave.<br />
Figure 13 compares the full scale test results with<br />
the sled test results in terms of injury values incurred<br />
at different sections of the dummy seated on the<br />
driver's seat with a 3-point belt.<br />
The black round marks in the drawings indicate the<br />
results of the full scale test. The sled test results<br />
relatively correspond to the full scale test results. This<br />
means that the behaviors of dummies correspond in<br />
both tests.<br />
2l Dummy behavior<br />
Figure 14 shows the dummy behavior during impact<br />
in the passenger's seat by the time series.<br />
When a 3-point belt was worn, neither the head nor<br />
the chest come in contact with the instrument panel.<br />
In the current test, however, the knees come in<br />
contact with the lower part of the instrument panel if<br />
the speed exceeded 35 km/h, restricting the knees<br />
behavior.<br />
1<br />
Time: Roughly 50 ms, constant<br />
Acc.: Varied between l0 and 45G<br />
Flgure 11. The waveforms of floor acceleration of the<br />
sled<br />
EXFERIMENTAL SAFETY VEHICLES<br />
(5<br />
E<br />
o<br />
+)<br />
lg<br />
L<br />
(u<br />
c)<br />
(J<br />
(J<br />
rC<br />
L<br />
o<br />
|!<br />
Figure 12. Gomparison of the acceleration waveform$<br />
In the full scale teet and the sled teet<br />
If a 2-point belt was used, the torso fell forward<br />
with its pelvis in position to allow the head to hir the<br />
instrument panel top.<br />
In the test, the speed ranged between l7 and 42<br />
km/h, but a certain area of the instrument panel top<br />
was hit by the head without exception. If the capacity<br />
of impact energy absorption of this area is improved,<br />
it is possible to reduce the impact on the head.<br />
If no belt was used, the dummy moved fbrward in<br />
its initial position at flirst, hit the lower part of the<br />
instrument panel with the knees, then hit the instrument<br />
panel front with the chest. Then, while the<br />
pelvis was raised upward, the head hit the instrument<br />
panel top, and then hit the windshield. Thc dummy<br />
was not thrown out of the vehicle in the test a$ a<br />
preventive net wa$ fixed on the windshield. In an<br />
actual accident, however, it is likely that the passenger<br />
would be thrown out.<br />
3) Head injury Criteria (HIC)<br />
FrontaJ co'l'l'ision<br />
of a<br />
l0-ton truck with the<br />
bamier at 32 km/h<br />
(20 mph)<br />
Sled test at<br />
37 kn/h (23 mph)<br />
L, 50<br />
Time (ms)<br />
As an example, Figure 15 shows HIC changes in<br />
impact speeds derived from the test results with and<br />
without a belt.<br />
The straight and dotted lines in Figure 15 show the<br />
driver's and the passenger's value, respectively.<br />
HIC:1000 is reached around 35 to 45 km/h when<br />
either a 2-point belt is u$ed or no belt, while it is<br />
reached at around 55 km/h* (on the passenger's<br />
value) when a 3-point belt is used.<br />
If these are evaluated by the impact speed at which<br />
a heavy truck makes a frontal collision with the flat<br />
barrier, HIC: 1000 will hypothetically be reached<br />
around 30 to 40 km/h if a 2-point belt or no belt is<br />
used and around 50 km/h* (on the passenger'$ $eat<br />
position) if a 3-point belt is worn.
d<br />
s<br />
a<br />
C<br />
E<br />
€ o<br />
E o<br />
o<br />
r) Speed vs, IIIC<br />
?00<br />
{00<br />
Col I i sion or i|npdct speed<br />
0 ro (km/h)<br />
G00<br />
lo(J<br />
t000<br />
Full scale tes{<br />
2) Speed v6. che8E Acc.<br />
0<br />
?0<br />
t0<br />
i0<br />
l0 ?0 30 10<br />
t<br />
. , /<br />
Ful I scale tes!<br />
jled Iest<br />
Sled tert'<br />
3) Speed vg, shoulder belE load<br />
0<br />
r0 ?0 30 t0<br />
L O<br />
E'J<br />
B€<br />
,EO<br />
n<br />
a(t<br />
?n0<br />
t00<br />
$00<br />
t00<br />
t0 00<br />
lr 00<br />
4) Speed vs, pelvls acc.<br />
0<br />
r00<br />
?00<br />
Full scale test<br />
Full scale test<br />
<strong>SECTION</strong> 4, TECHNICAL SESSIONS<br />
SI ed test<br />
Sl ed test<br />
.t'<br />
SS klll/h<br />
Figure 13. Comparison ol test results between full<br />
scale test and sled tests<br />
Note: The corresponding speed on the driver's seat<br />
position to the asterisked speed is predicted<br />
to be over 60 km,zh but, as the degree of<br />
extrapolation is large enough as shown in<br />
Figure l5 l), the evaluation was made on the<br />
passenger's seat position.<br />
The report thus far has been a prediction of<br />
marginal speeds based on test results and only shows<br />
the results of an example. lf whether or not this<br />
represents the general tcndencies of a heavy truck<br />
should be judged after examining the results of many<br />
tests to be rniicle in the futurc. The samc applies to the<br />
chest injury value, etc. explained to the right.<br />
[.]-point BeltJ<br />
[?-point Belt]<br />
[No Bel t]<br />
Displ.rctlrntnt (rtm)<br />
iE_r-il 4..4 ry 4,f,j_Q__|4_!S0<br />
0isFl acement (rrya)<br />
Figure 14, Dummy behavlor durlng lmpacl<br />
4) Chest acceleration<br />
- 26 kn/h<br />
-"- 37 km/h<br />
-.- 4? krn,/h<br />
- l7 k$/h<br />
.--- 28 kn/h<br />
*.- 39 krn/h<br />
Figure 16 shows the relation between impact speeds<br />
and chest injury values (3 ms G).<br />
For the same impact speed, the injury value on the<br />
driver's seat is different from that on the passenger's<br />
seat but the impact speed at which the injury criteria<br />
of FMVSS-208 of the chest of 60G (3 rns cut G) is<br />
reached is roughly 35 kmlh if no belt is used and<br />
roughly 45 to 65 km/h if a 2-point or 3-point belt is<br />
used. This clearly suggests the use of a belt is<br />
effective.<br />
5) Femur load<br />
Figure 17 shows changes in the femur load by<br />
impact speed when a belt is used and when it istt't.<br />
While the femur load remains less than j of the<br />
limit value within the scope of the current test only if<br />
a belt is worn l) and 2) of Figure 17, the human<br />
701
Figure 15. HIC changes in lmpact speeds<br />
EXPERIMENTAL SAFETY VEHICI.ES<br />
Flgure 16. Changes in the chest acceleration by impact speeds<br />
702<br />
-<br />
o<br />
o<br />
4<br />
O<br />
60<br />
4h<br />
I ) 3-point bel t 2-point bel t 3) f{o bel t<br />
20 40<br />
Irrpact speed V (km/h)<br />
r< Driver with 3,point<br />
bel t NLR<br />
tJs* = Z3o<br />
g.---g Assistant with 3-point<br />
bEIt ELR<br />
0s = 60"<br />
3000<br />
?000<br />
r000<br />
20 40 60<br />
Impact speed V (kn/h)<br />
.€ Oriver with Z-point belt NLR<br />
(Head comes jn contact with<br />
steering r{heel )<br />
EI-..€ Assistant with ?-pojnt belt<br />
NLR<br />
(Head comes<br />
'<br />
in contact with<br />
instrument panel )<br />
| / J-polnt Dett ?) z-point bel t 3) No belt<br />
r-<br />
?0 40 60<br />
Irnpact speed V (km/h)<br />
Driver with 3-point belt<br />
lj!^= zs", e llpHJfi[noEJl, -<br />
tiAn<br />
'i0<br />
mm Up<br />
El---'E Assistant witn i-pornt<br />
bett ELR<br />
!s = 60'''<br />
20 40 60<br />
Impact speed V (kn/h)<br />
........-[)river with Z-point belt NLR<br />
Chest comes in contact with<br />
steering wheel<br />
El---€ Assistant with ?-point belt NLR<br />
The head cJmos ifl contact with<br />
'instrument<br />
panel but the chest<br />
. does not as il lustrnted.<br />
=<br />
3000<br />
2000<br />
rm0<br />
?0 rtO<br />
Impdct speed U (km/h)<br />
r+ Driver with non belt<br />
(Head comes in contact<br />
with steering whee'l )<br />
E!-.-tr Assistdnt with non<br />
bel t<br />
(Head comes in contact<br />
wj th j nstrument panel )<br />
20 40<br />
Impact speed V (km/h)<br />
r:_<br />
Driver with flo belt<br />
Chest comes in contact<br />
wrth steering wheel<br />
d-r-fl Arsistafrl rdith no belt<br />
Chest comes in contact<br />
with instrument panel
<strong>SECTION</strong> 4. TECHNICAL SESSIONS<br />
l) 3-point belt Z) 2-point belt 3) No belt<br />
_ _l iai.t .v.a. j gq - -_l=irnl.t_ _va].ue<br />
20 40 60<br />
Impact speed V (kmi<br />
h)<br />
o<br />
E 6,m<br />
L<br />
E<br />
'P<br />
....._ Priyel.wjth 3-pojnt<br />
DEII NLR<br />
B---g Assistant wjth 3-pornr<br />
bEIC LLR<br />
Figure 17. Ghanges in femur load by impact speeds<br />
tolerable level (1,021 kg) is already reached at an<br />
impact speed of roughly 35 km/h, if no belt is used 3)<br />
of Figure 17, as the dummy's knees come directly in<br />
contact with the instrument panel, clearly suggesting<br />
the effectiveness of seat belts,<br />
6) Occupant injury values by impact speeds<br />
So far, occupant injury values by impact speeds in<br />
the sled test have been analyzed. In Figure 18, the<br />
above speeds are sonverted into the impact speeds at<br />
which a heavy truck makes frontal collisions with the<br />
barrier based on the results of<br />
Plotted speeds in the graph show the limit speeds at<br />
which the injury criteria prescribed by FMVSS-208 are<br />
deemed to have been reached.<br />
As the conditions of the driver's seat are different<br />
from those of the pas$enger'$ seat with respect to the<br />
following, comparison cannot be made directly.<br />
l) Seat belt anchorage position.<br />
2) Retractor type (NLR for driver, ELR for<br />
Passenger).<br />
3) Secondary impact position of passenger and<br />
respective absorption of energy.<br />
4) Alloted rate of loads on the shoulder and lap<br />
belts, etc.<br />
If seat belt effectiveness is reviewed in general,<br />
one 3-point belts, two 2-point belts and three no<br />
belts are effective in protecting the passenger, in that<br />
order.<br />
The limit speeds on ihe driver's seat position when<br />
a belt is used and when it isn't are as follows:<br />
?0 40 60<br />
lmpact speed V (kmlh)<br />
.+ Dr-iver with z-point<br />
bCIt NLR<br />
g---E Assistant with ?-point<br />
bel t NLR<br />
o<br />
d f,UIJ<br />
o<br />
L<br />
o<br />
20 s0<br />
lmpact speed V (kffi/h<br />
+ . DriYea si15<br />
n0 0elt<br />
E--€ Ass i stant wj th<br />
no bclt<br />
Non belt , at around 25 to 30 km/h, the<br />
chest or femur will reach its<br />
limit<br />
z'point belt at around 40 km/h, the head<br />
will reach its limit<br />
$-potnr oerr . at around 5O km/h, the che$t<br />
will most likely reach injury<br />
criteria prescribed by<br />
FMVSS-208.<br />
uriver't<br />
tent<br />
ir5<br />
5ea<br />
section Llnlt speed (km/h)<br />
ilo bel t Hend -<br />
2 -potnt bel t<br />
Chest<br />
Head<br />
_*rjlg:l_<br />
l-F jn t bel t hen0 (E<br />
ttcrt -<br />
cffi Thc dbove.e"<br />
sults 5ulqest the<br />
ljkclinesr nf a higher<br />
I inj t rt,red thah tne<br />
Figure 18. The collision speeds at whlch the human<br />
tolerance (iniury eriteria prescribed hy<br />
FMVSS) are reached<br />
_.<br />
-r-<br />
,{o belt Hea 0 t-I<br />
lhe5 t<br />
-<br />
?-Folnt bel t<br />
chest<br />
3-point belt Head -<br />
(;hd:it -<br />
Fcri ur<br />
IIE<br />
-<br />
-<br />
{E:f<br />
dd<br />
703
Similarly, limit<br />
tion are:<br />
speeds on the assistant's seat posi-<br />
Non belt . at around 25 to 30 km/h, the<br />
chest will reach its limit<br />
z-point belt. at around 30 to 35 km/h, the<br />
head will reach its limit.<br />
3-polnt belt. at around 35 to 40 km/h, the<br />
chest will reach its limit.<br />
7') Occupant injury values by seat belt fastening<br />
angles<br />
Figure 19 shows the relationship between HIC and<br />
the impact speed of a 3-point ELR on the passenger's<br />
seat by using shoulder belt fastening angles as param_<br />
eters.<br />
ln the test, the angle of belt fastening (ds) was<br />
changed from 26" to 60" but HIC values changed<br />
little if impact speed remained the same.<br />
Figure 20 shows a similar relationship with respect<br />
to the acceleration of the chest. ln this ca.se, the chest<br />
injury values tend to be irrfluenced by shoulder belt<br />
angles.<br />
Conclusion<br />
The findings of a survey of the effectiveness of a<br />
heavy truck's seat belts derived from accident survev<br />
results, the results of full-scale heavy truck collision<br />
tests, and the results of sled tests made to review the<br />
effectiveness of a heavy truck's seat belts explained so<br />
far can be summarized as follows:<br />
'<br />
l) The effectiveness of a heavy ftuck's seat belt<br />
derived from accident survey results<br />
As a result of investigations into the effectiveness of<br />
a heavy truck's seat belts by using fhe statistical data<br />
of heavy truck accidents that occurred in Japan<br />
during 1983, it is reasonable to predict that the<br />
number of fatalities and seriously injuries could be<br />
-4/<br />
F<br />
I<br />
J<br />
fl<br />
o<br />
I<br />
o J<br />
I J<br />
d<br />
9s<br />
r: ?6o<br />
o,38"<br />
D , 60o<br />
10 l0 30 40 50 60<br />
Impact speed V (km/h)<br />
tj<br />
Figure 19. lmpact speed VS HlC, where the angle of<br />
the shoulder belt fastening is used as a<br />
parameter<br />
EXPERIMENTAL SAFETY VEHICLES<br />
-fo<br />
6o<br />
E a.o<br />
qJ<br />
Tro<br />
U<br />
Ez0<br />
(u<br />
Figure 20. lmpact speed vs. chest acceleration; where<br />
the angle of the shoulder belt fastenlng is<br />
used as a parameter<br />
reduced by roughly Zjolo if occupants<br />
of heaw trucks<br />
were wearing seat belts.<br />
2l A full-scale heavy truck collision test<br />
As a result of a front collision test with the flat<br />
barrier of a cab-over type truck in the GVW 20_ton<br />
class at an impact speed of 32 km/h, it was discov_<br />
ered that<br />
l. The deformation of each section of cabin was<br />
minimal and the cabin's survival space after tests was<br />
secured sufficiently.<br />
2. The acceleration of the cabin floor, which is<br />
reproduced as the floor acceleration of the sled test,<br />
featured a waveform where the duration time was<br />
roughly 5090 shorter and the rise was steeper than<br />
that of a passenger car. This waveform is critical in<br />
that it suggests secondary collisions of passengers.<br />
3. While the injury values of the head, chest, and<br />
femur do not reach the human tolerance prescribed<br />
by<br />
FMVSS 208 if a 3-point belr is in use, the correspond_<br />
ine HICs of the use of Z-point belts and no use of<br />
belts are well over 1000.<br />
3) Sled tesrs<br />
!<br />
c,,<br />
"r,,1,{<br />
i'/<br />
t0 ^-^ 0S = 260<br />
0s = 38"<br />
o*-+ 0s = 60"<br />
10 20 30 40 50 60<br />
Inrpact speed !<br />
( kn/h )<br />
I. By the sled tests, a dummy behavior similar to<br />
that in the collision of a heavy truck with the barrier<br />
was reproduced.<br />
2. As a result of sled tests similar, it is clear that<br />
the use of belts is effective for passenger protection.<br />
On the driver's seat, an impact speed corresponding<br />
to the human tolerance prescribecl<br />
by FMVSS 20g is<br />
predicted as follows:<br />
25 km/h or so if no belt is used.<br />
40 km/h or so if a 2-point belt is used.
50 km/h or so if a 3-point belt is used.<br />
3. In the test, attempts were made to identify the<br />
influence of the angle of the shoulder belt fastening<br />
(ds) on the pa$senger injury value. As a result, it was<br />
found that the HIC had almost nothing to do with the<br />
value of ds, but chest injury value tend to be<br />
influenced by shoulder belt angles.<br />
Recommendation<br />
This time. we made various tests and studies to<br />
examine the effectiveness of the $eat belt as part of<br />
our study of a heavy truck's occupant protection and<br />
could clarify its effectiveness to some extent. The<br />
following, however, are conceivable future problems,<br />
l) When a 2-point belt is used, the head and chest<br />
comes in contact with the steering wheel in the<br />
driver's seat and the head hits against the instrument<br />
panel in the passenger's seat, making damage more<br />
serious. The energy absorption by the steering wheel<br />
and instrument panel during secondary collision will<br />
have to be clarified further from the viewpoint of<br />
occupant protection.<br />
2) When an ELR-type seat belt is installed in a<br />
heavy truck, attention should be directecl to the<br />
following:<br />
The range of standard acceleration sensed by the<br />
current retractor locking mechanism should be set<br />
between 0.45 and 0.8-5 by each country in the case of<br />
an acceleration sensing formula for the vehicle body,<br />
But the level of sensed acceleratiorr varies from<br />
country to country, and Japan which approved 1.5 C<br />
products for automobiles produced after September<br />
I 987.<br />
In addition to a study of the inconveniences caused<br />
by seat belts, including excessive constriction of the<br />
stomach during rough road driving, a reasonable<br />
standard acceleration value should be agreed to internationally<br />
in the future.<br />
3) In this test, rigid seats without suspension were<br />
used, but the use of suspended seats is possible for a<br />
heavy truck and suspension seats will also have to be<br />
examined in the future.<br />
Acknowledgement<br />
Lastly, we would like to express our deep appreciation<br />
for the cooperation of JAMA's rnet'ubers in the<br />
<strong>SECTION</strong> 4. TECHNICAL SESSIONS<br />
heavy truck study committee and the heavy truck cab<br />
impact W/C committee<br />
during this study.<br />
Reference<br />
l. Henry E. Seiff, Heavy Truck Safety-What we<br />
know, Tenth <strong>Int</strong>ernational Technical <strong>Conf</strong>erence<br />
on Experiment Safety Vehicles, 1986.<br />
2. Michigan Univ., Truck Involved in Fatal Accident,<br />
l98l PB84-183037, 1984.<br />
3. Robert M. Clarke, Joseph Mergel, Heavy Truck<br />
Occupant Crash Protection. A Plan for Investigatirrg<br />
Ways to lmprove It. SAE paper 821270.<br />
4. K. Hogstr6m, L. Senenson(s), Injuries in Heavy<br />
Trucks and the Effectiveness of Seat Belts.<br />
VDl-Berichte Nr. 368, 1980.<br />
5. L. Langwieder, M. Danner, M. Wrobel, Ein<br />
Beitrag Zur Risikoanalyse Und Characteristik<br />
Von LKW-Unfiillen. SAE paper 845017, 1984.<br />
6. H. Biirger (D), Bedeutung und Rangfolge von<br />
Sicherheitsbnahmen am Lastkraftwagen. VDI-<br />
Berichte Nr. 368. 1980.<br />
7. F.L. Krall and G.W. Rossow, Heavy Truck<br />
Safety...The Need to Know. Traffic Quarterly,<br />
vol. 35, No. 3, 1981.<br />
8. B.S. Riley, S. Penoyre, H.J. Bates, Protecting<br />
Car Occupants and Cyclists in Accidents Involving<br />
Heavy Goods Vehicles by using Front Underrun<br />
Bumpers and Sideguards. The Tenth <strong>Int</strong>ernational<br />
Technical <strong>Conf</strong>erence on Experimental<br />
Safety Vehicles. 1985.<br />
9. A. Yamanaka, M. Sato, N. Nagaike, and T.<br />
Nishida, The Research and Development of Nuclear<br />
Fuel Safety. Transporter and its Evaluatiorr.<br />
XXI Fisita Congress, June, 1986.<br />
10. H. Biirger, Dynamische und Statiche Untersuchung<br />
der Kollisions-Festigkeit von LastkraftwagenFaherehdusern.<br />
Automobiltech Z vol. 83,<br />
No. 3. 1981.<br />
ll. C. Rtitter, H. Honschik (D), Sicherheitsgurte in<br />
Nutzfahrzeugen, XVIII <strong>Int</strong>ernational Congress,<br />
1980.<br />
t2. E. Franchini, Truck Crush Testing, SAE paper<br />
700411, 1970.<br />
'705
Front Undernrn Guards for Trueks<br />
B.S. Riley,<br />
A.J. Farwell.<br />
T.M. Burgess<br />
Department of Transport,<br />
United Kingdom<br />
Abstract<br />
This paper presents research which is a continuation<br />
of earlier work on front underrun guards for trucks,<br />
carried out at the Transport and Road Research<br />
Laboratory in Great Britain.<br />
Results are given from impact tests between European<br />
small cars and trucks, where both vehicles are<br />
moving towards each other. Comparisons are made<br />
with earlier tests at similar closing speeds but where<br />
the truck was stationary belbre impact. It is concluded<br />
that there is little difference in the results from<br />
either method of test, particularly for the case when<br />
an underrun guard is fitted.<br />
The results suggest that an energy absorbing truck<br />
front underrun guard with a ground clearance of 300<br />
mm is able to provide protection from fatal or severe<br />
injuries to seat belted occupants in a small car (750<br />
kg) at closing speeds up to about 65 km/h.<br />
lmpact tests have been carried out between a rigid<br />
faced 250 kg trolley and three different types of<br />
energy absorbing truck underrun guard. The test<br />
procedure thus developed could form the basis of a<br />
legislative test to determine whether front underrun<br />
guards have adequate energy absorption. Limits are<br />
suggested for the proposed test procedure to cover<br />
speed of impact, input energy, size of trolley face and<br />
trolley decelerations during impact.<br />
<strong>Int</strong>roduction<br />
This paper describes work carried out at the Transport<br />
and Road Research Laboratory in Great Britain<br />
and is a continuation of research presented at earlier<br />
Experimental Safety Vehicle <strong>Conf</strong>erences in 1980t and<br />
19852. On this occasion it is concerned only with<br />
underrun guards fitted to the fronts of heavy goods<br />
vehicles to reduce the severity of injury to car<br />
occupants.<br />
Accident data<br />
Table I shows the number of car occupant$ killed<br />
each year in GB in accidents involving goods vehicles<br />
of gross weight over 7.5 tonnes for the period 1974 to<br />
1985. The number of car occupants killed annually in<br />
all other road accidents is also shown.<br />
There was a general decline in the numbers of all<br />
categories of road user killed in truck accidents until<br />
around 1980. This may possibly be attributed to the<br />
gradual diversion of heavy goods vehicle traffic to the<br />
706<br />
EXPERIMENTAL SAFETY VEHICI.ES<br />
safer motorway roads in this period. Since 1980 the<br />
number of occupants killed each year has levelled off<br />
to around 320. Approximately two-thirds of this<br />
number are killed when their vehicles impact the<br />
fronts of trucks, most frequently when the two<br />
vehicles are travelling in opposite directions and the<br />
front of the car hits the front of the truck.<br />
Heavy goods vehicles are very aggressive toward$<br />
cars in collisions for several reasons. The large mass<br />
ratio results in the velocity change of the car being<br />
much greater than that of the truck. The height of the<br />
truck structure is such that, in a collision, the car may<br />
run under the truck, often to the extent that the truck<br />
structure comes into contact with the car occupant<br />
compartment or in extreme cases into direct contact<br />
with the occupant. By this mechanism, the important<br />
energy absorbing zones of a car, which tend to be<br />
below the truck structure, are not used to protect the<br />
occupant. Finally, because of the rigidity of the truck<br />
structure, most of the impact energy is dissipated in<br />
the car rather than in the truck.<br />
Truck front underrun guard design<br />
The first essential step in providing protection for<br />
car occupants is to lower the front structure of the<br />
truck so that effective use may be made of the energy<br />
absorbing structure of the car. It is also desirable to<br />
make the lowered structure of the truck energy<br />
absorbing. This has the effect of increasing the<br />
maximum survivable closing speed for the car occupants,<br />
which is particularly beneficial in car front to<br />
truck front impacts where closing speeds tend to be<br />
higher.<br />
The amount of energy absorption that may be<br />
provided by the truck frontal structure as it yields is<br />
limited by two factors. Firstly, the total longitudinal<br />
crush of both the car and truck structure must not<br />
exceed the original length of the car bonnet. Secondly,<br />
the force level at which the truck structure yields must<br />
be compatible with the tbrces at which a car front<br />
collapses so that at the end of a severe impact both<br />
have crushed. This latter point is important. If a<br />
guard or other form of protection is very soft, it will<br />
Table 1. Gar occupants kllled In road accldents In<br />
Great Britain.<br />
YEar 1974 1976 1978 1980 1 981 1982 1t8.t 1 984 1985<br />
Acc idents<br />
irrvol v irrg<br />
HGVs<br />
All 6lher<br />
ecc iderrts<br />
471 ]91 It7 296 12J 115 J00 J'i2 125<br />
2238 2'129 2272 1982 1964 2108 17't9 1845 1116<br />
Iotal 2109 2520 7569 2278 2287 2441 2n19 2197 2061
just bottom out and absorb little energy. Similarly, if<br />
it is too stiff (for a snrall weak car) it will not yield<br />
and again will not absorb rnuch energy.<br />
One effective method of increasing the amount of<br />
possible energy absorption would be to bring the face<br />
of the guard forward of the truck front. An increase<br />
in stroke, even as little as 200 mm, introduced in this<br />
way would make a sub$tantial difference to the energy<br />
absorbed. Changes in the measurement of vehicle<br />
length for legislative purposes would be needed to<br />
allow the many vehicles already operating at maximum<br />
length to make use of this concept.<br />
The limiting stroke and force levels that can be used<br />
at present suggest that impacts between small cars and<br />
trucks provide the important design case for the<br />
required truck structure.<br />
fo, ffi Wfl r,t ' tt<br />
$;+<br />
<strong>SECTION</strong> 4. TECHNICAL SESSIONS<br />
The results from this earlier programme of work<br />
suggested that energy absorbing truck guards should<br />
ol'fer protection to seat belted car occupants at closing<br />
speeds up to 65 km/h. lt was also considered that<br />
grourtd clearance should not be much greater than 300<br />
mm and certainly no more than 400 mm, otherwise<br />
the structural parts of smaller cars would be overridden.<br />
It was estimated in Reference 2 that with this order<br />
of protection it should be possible to prevent at least<br />
60 car occupant deaths each year in Great Britain.<br />
Objectives of current work<br />
All the earlier impact tests have been carried out<br />
with the truck stationary. In a study of fatal road<br />
accidents involving trucksa it was observed that when<br />
the truck was moving forward at the time of initial<br />
impact, it tended to ride up onto the car as the latter<br />
was pushed backwards. At the end of the main impact<br />
Previous TRRL work on front underrun<br />
guards'<br />
The TRRL research on this subject which was the truck thcn settled down onto the car cflusing<br />
presented at the 1985 Experimental Safety Vehicle further distortion of the passenger compartlnent.<br />
<strong>Conf</strong>erencez, was based on a series of test impacts Therefore one objective of the present research has<br />
between the fronts of cars of various sizes and the been to investigate the effect on the protection offered<br />
front of a truck fitted with an energy absorbing front to the car occupant when the truck is moving. To this<br />
underrun guard. In these test$ the truck was station- end, impacts have been carried out between trucks<br />
ary and the car was travelling illto it at about 65<br />
km/h. The guard used was one developed jointly<br />
and small cars with both vehicles moving towards<br />
each other at the closing speeds that were used in the<br />
between TRRL and TI Tube Products Ltd and its earlier programrne of work. The tests have been<br />
energ,y absorption is based on the plastic deformation carried out with trucks both fitted and not fitted with<br />
of mild steel in the form of two invertubes. The guard a front guard.<br />
may be seen in Figure l. Each invertube collapses at a The second objective is coucerned with the capabil-<br />
near constant load of just under 50 kN over a stroke ity of a truck front underrun guard to absorb energy.<br />
of 200 mm giving a total energy absorption of about If legislation is introduced to require trucks to be<br />
20 kJ. Because of the geometry of the guard it needs fitted with front guards, it is essential, in the authors'<br />
a horizontal bumper force of about 70 kN to start opinion, that they should be capable of absorbing<br />
collapsing which rises to about 130 kN at the end of energy.<br />
its stroke3. The ground clearance of the guard in all Because some designs of energy absorbing guards<br />
tests was 300 mm.<br />
may be speed sensitive (for example, hydraulic systems)<br />
the test should be dynamic and at a speed<br />
representative of severe but survivable impacts. The<br />
test procedure developed is similar to that proposed in<br />
ffi<br />
Reference 2, usirrg a trolley impactor. Threc differcnt<br />
types of energy absorbing guard have been used in the<br />
test s.<br />
&&r<br />
e m "<br />
E<br />
ff*#' -<br />
G<br />
ffii,,<br />
Figure 1. Invgrtube tront underrun guard<br />
Moving Car to Moving Truck ImPact<br />
Tests<br />
Method of testing<br />
Two tests were performed with both the truck and<br />
the car moving at the same speed. A steel cable was<br />
attached to the rear of the lorry and, via a pulley<br />
fixed to the ground behind il, Lo the front of the car'<br />
Thus the car was pulled towards the truck as the truck<br />
moved forward, resulting in both vehicles moving<br />
towards each other at the same speed. The truck was<br />
707
Results from the test with no truck guard<br />
fitted<br />
In this test the height of the standard bumper of the<br />
truck was 580 mm from the ground. The impact<br />
closing speed was 64 km/h. The deceleration traces<br />
for each 'B'-pillar were found to be similar as regards<br />
general shape and maximum values. One of the two<br />
traces is shown in Figure 2, together with a note of<br />
important events at the times they happened. The<br />
latter were obtained by matching the deceleration-time<br />
trace with the events observed on the high speed film.<br />
The peak deceleration of the car was found to be 38<br />
g. This peak occurred when the standard bumper of<br />
the lorry made contact with the base of the 'A'-posts<br />
of the car (see Figures 2 and 4). The maximum seat<br />
belt load was found to be 2.47 kN. However this low<br />
value was due to the truck bumper reaching the<br />
windscreen of the car and penetrating the occupant<br />
compartment, thus causing contact between the upper<br />
parts of the dummies (including their heads) and the<br />
truck bumper and reducing forward movement and<br />
belt forces. In such a case, in spite of the restraining<br />
708<br />
EXPERIMENTAL SAFETY VEHICLES<br />
driven by an experienced stunt driver: the car contained<br />
a dummy driver and passenger.<br />
The intended position of impact of the car was into<br />
the centre of the truck guard and at right angles to it.<br />
To facilitate this, the left side front and rear wheels of<br />
the car were placed in a guide rail fixed to the<br />
ground. Just before impact with the truck the car left<br />
the guide rail and the towing cable was disconnected<br />
by means of a bomb release. The car was therefore<br />
free running when impact took place. Both the car<br />
conrscr w,rh<br />
I I tavu!;on of ruck bumos,<br />
and the truck speeds were measured just before<br />
impact.<br />
In these tests the lorry had an all up mass of 5300<br />
80 100 1?0 140 160 18d 200<br />
kg, and the cars used were British Leyland Minis,<br />
each of total mass 750 kg. Anthropometric dummies<br />
were placed in the car front seat positions and were<br />
restrained by three point inertia reel seat belts. No<br />
Figure 2. Car<br />
accelerometers were placed in the dummies. However<br />
one was placed at the base of each of the two<br />
'B'-pillars<br />
of the car. The seat belt loads across the<br />
chests of the dummies were also measured. The<br />
deceleration of the lorry chassis was measured and<br />
each collision was filmed with high speed cameras<br />
running at approximately 400 lrames per second.<br />
The intended speed was 3? km/h per vehicle to give<br />
a closing speed of 64 km/h which had been used in<br />
the moving car to stationary truck tests.<br />
The first impact was carried out with no underrun<br />
guard fitted. The test was then repeated with the truck<br />
fitted with a Tl Tube Products invertube energy<br />
absorbing guard described earlier in the introduction<br />
and shown in Figure l.<br />
'B' plllar deceleratlon pulse for test wlth<br />
no guard fltted<br />
action of the seat belts, there would be little hope of<br />
saving the front seat occupants.<br />
The length of thc vehiclc crushed by the truck was<br />
1.32 m (43 per cent of the total length of the Mini).<br />
The damage to the car may be seen in Figure 4.<br />
Results from the test with a truck guard<br />
fitted.<br />
This te$t was undertaken with a TI Tube Products<br />
invertube front underrun guard fitted to the truck.<br />
The lowest edge of the bumper was 300 mm from the<br />
ground as can be seen from Figure l.<br />
The impact closing speed in this case was 62 km/h.<br />
One of the 'B'-pillar deceleration traces for the car is<br />
shown in Figure 3. The peak deceleration was found<br />
to be 33 g. From the high specd film analysis this<br />
peak occurred when the bumper made contact with<br />
the engine block as noted on Figure 3.<br />
The peak belt load recorded was 5.56 kN which is<br />
considered to be a survivable belt load.<br />
The maximum amount of crush was 0.65 m (21 per<br />
cent of the original length ol'the Mini) and this gave<br />
: ? 0<br />
E<br />
GuB.d I'rrv corraoles<br />
m 40 6d 80 too<br />
Time (Elec)<br />
I ?0 140 160 1BD ?00<br />
Flgure 3. Car 'B' plllar deceleration pulse for test with<br />
guard fitted
,<br />
* ',t<br />
F<br />
&<br />
Figure 4. lmpact t€sts without truck guard fltted. Both<br />
vehlcles moving before imPact<br />
no intrusion into the occupant compartment by the<br />
truck front. There was however slight deformation of<br />
the car footwell and at the centre of the car facia.<br />
The truck guard invertubes collapsed fully in this<br />
test. Also, bending of the bumper beam occurred<br />
which suggests that at least 20 kJ of energy was<br />
absolbed by the guard system. The results from this<br />
impact can be seen in Figure 5.<br />
Comparison With Moving Car to<br />
Stationary Truck Tests.<br />
Provided the two vehicles remain togcther after<br />
impact, the decelerations and resulting damage to the<br />
car should be dependent only on the closing speed of<br />
the vehicles. It should not matter whether the truck is<br />
moving before impact.<br />
Comparisons of energy changes<br />
The energy changes that occurred in the four<br />
impact tests, two with both vehicles moving and two<br />
Flgure 5. lmpact te$t with truck Euard fltted. Both<br />
vehlcles movitrg before imPact<br />
<strong>SECTION</strong> 4. TECHNICAL SESSIONS<br />
with the truck stationary, are shown in Table 2.<br />
Energy change here is the difference between the total<br />
energy of the vehicles just before impact and that<br />
remaining immediately after impact is completed. The<br />
theoretical speeds after impact have been calculated<br />
using conservatigrt of momentum theory. In general,<br />
there is good agreement between theory and practice<br />
for these speeds after impact.<br />
There is also generally good agreement between the<br />
energy changes that occurred in the impacts where<br />
both vehicles were moving before impact and in the<br />
impacts where the truck was initially stationary. The<br />
exception is the test without a guard fitted and truck<br />
stationary, where the initial speed of the car was<br />
greater than intended.<br />
Figures 6 and 7 show the two impacts, one without<br />
and one with the guard fitted, for the stationary truck<br />
tests. These figures are directly comparable with<br />
Figures 4 and 5 and generally show very similar<br />
results from the two methods of testing.<br />
Comparison of impacts where no truck<br />
guflrd was fitted<br />
ln comparing the two types of testing procedure in<br />
detail, the rnore important dif'l'erences occur in the<br />
pair of tests where the truck guard is not fitted.<br />
Firstly, the amount of car crush in the stationary<br />
truck test was l.l7 m, while that in the moving truck<br />
test was 1.30 m. lt can be seen from these results that<br />
there is a substantial difference between the two,<br />
Table 2. Vehlcle speeds and energy changes in impacts.<br />
Comparison of actual and theoretical<br />
r€Bults<br />
Impact teat<br />
SpEedF beFdre<br />
i.modc t m/ s<br />
Speed after<br />
impact m/a<br />
loth vehicles moving IrEk C6r Trrck Car<br />
lr thout<br />
luerd<br />
{ith<br />
I Uaro<br />
Irrk<br />
trt hout<br />
luard<br />
{ith<br />
Ju6rd<br />
Act ual<br />
Ieet<br />
Ch6nqe in<br />
kinetic energ,<br />
8,9 + 8.9 7.0 - 7,0 9r<br />
Theory. 8.9 + 8.9 6.7 - 6,7 104<br />
Act uEI<br />
test<br />
gtationery<br />
8,6 + 8.6 6.6 - 6,6 92<br />
h€ofy 8.6 + 8,6 6,5 - 6.5 i1<br />
Ac tual<br />
lest<br />
0 +20,1 + 2.4 + 2.4 117+1<br />
Theory 0 +20.1 + 2.5 + 2,5 115r+<br />
Act ual<br />
test<br />
0 +1 7,8 + 2.? + ?.7 97<br />
Iheory 0 +1 7,8 2.2 + 2.2 104<br />
t Positive speed is in the oriqinsl direction of motion<br />
of the cer.<br />
r+tonpacatively larger enerqy ghanqe de tD qreetet cloeing apeed.<br />
KJ<br />
709
although both amounts of crush mean that the<br />
intrusion into the car has extended to well behind the<br />
'A'-posts.<br />
The reason for the greater crush in the moving<br />
truck test can be seen in the high speed film' During<br />
the impact the truck bumper follows a horizontal<br />
path, contact occurs between the top of thc engine<br />
and the bumper, causing the engine and subframe to<br />
twist so that the top of the engine pivots towards the<br />
rear of the car. This causes the car to sag downwards<br />
until the bottom of the 'A'-posts and sills touch the<br />
ground. At this point the truck meets a resistance and<br />
cannot crush downwards any more. However, after<br />
the main impact the truck still has forward momen'<br />
tum and therefore overrides the structure of the car'<br />
thus driving the front of the truck up and into the<br />
passenger compartment of the car.<br />
This 'jacking' effect was observed in investigations<br />
of road accidents and is described in Reference 4'<br />
Seat belt loads are not available for the stationary<br />
truck test but as in the test with both vehicles tnoving,<br />
contact was made betwcen the dummies and the front<br />
of the truck. ln such circumstances, as stated before,<br />
seat belt loads are largely irrelevant for survival of the<br />
car occupants.<br />
The peak deceleration in the stationary truck test<br />
was 45 g for the car compared with 38 g obtained<br />
when both vehicles were moving. Bearing in mind that<br />
the closing speed of the former test was higher, these<br />
values are in good agreelnent.<br />
The pitching motion of the car during the impacts,<br />
as observed in the film, varied slightly between the<br />
two test$. With the truck stationary the only pitching<br />
of the Mini is as the front gets wedged underneath the<br />
truck. The same situation occurs whcn both vehicles<br />
are moving. However in this case the truck appears to<br />
have a greater vertical displacemerrt (that is riding<br />
Figure 6. lmpact test wlthout truck guerd fltted'<br />
stationary before impact<br />
710<br />
EXPERIMENTAL SAFETY VEHICLES<br />
over), and as has already been mentioned the amount<br />
of crush on the car was greater'<br />
Comparison of imprcts where a truck guard<br />
was fitted<br />
With the underrun guard fitted the amount of crush<br />
of the car in the stationary truck test was 0.60 m,<br />
while that with both vehicles moving was 0.65 m,<br />
giving close agreement for the two test methods.<br />
A maximum seat belt load of 5.10 kN was measured<br />
in the stationary truck test compared with 5.56<br />
kN when both vehicles were moving. Both these loads<br />
are survivable and are meaningful results since there<br />
was no contact between the dummies and the truck<br />
structure as occurred in the tests with no underrun<br />
guard fitted.<br />
A peak deceleration of 40 g was obtained in the<br />
stationary truck test compared with 33 g with both<br />
vehicles moving. The small diff'erences in speeds of<br />
impact and amount of average crush of the car would<br />
account for some of the variation in the peak decelerations.<br />
but not all.<br />
There were again some differences in the pitching<br />
motion of the car during and immediately after<br />
impact but the effect on recorded decelerations would<br />
be small. From the high speed film it can be seen that<br />
with the underrun guard fitted and the truck station'<br />
ary then during the impact the car itself remains<br />
almost horizontal thus giving true deceleration values.<br />
However, immediately after the impact the truck is<br />
moved rearwards by 2 m, and the car itself takes up<br />
severe pitching motion with the rear wheels being<br />
lifted approximately 0.5 m off the ground.<br />
When both vehicles are moving it can be seen that<br />
during the impact, the car pitches more than with the<br />
stationary truck. However after the main impact the<br />
car appears to start to pitch, as in the stationary truck<br />
rffiffii<br />
lmpact test with truck guard fitted. Truck<br />
stalionary before imPact
ca$e, but the car then becomes trapped between the<br />
underrun bumper and the standard bumper and thus<br />
remains reasonably horizontal.<br />
Summary of comparisons<br />
Table 3 is a sumrnary of closing speedsn the<br />
amounts of car crush, peak decelerations at the car<br />
'B' pillar and seat belt loads in the four impact test$.<br />
The conclusions to be drawn from these tests are as<br />
follows:<br />
l. The tests suggest that a truck front underrun<br />
guard with a ground clearance of 300 mm and with a<br />
capability of absorbing about 20 kJ of energy provides<br />
protection from fatal or severe injuries to seat<br />
belted occupants in a European small car at closing<br />
specds up to about 65 km/h.<br />
2. The energy change in an impact between a truck<br />
and a car is largely dependent only ort closing speed,<br />
irrespective of whether or not the truck is moving<br />
before impact.<br />
3. When no truck guard is fitted, the moving truck<br />
to moving car impact test gives a more realistic<br />
indication of the dangers of underrun, particularly<br />
regarding the degree of car crush,<br />
4. When a truck guard is fitted there is little<br />
difference in the resulting car crush, decelerations or<br />
dummy seat belt loads whichever method of test is<br />
used. Because the test procedure with the truck<br />
stationary before impact is much simpler and cheaper<br />
to perform it is recommended as a satisfactory<br />
method of developing truck front underrun guards<br />
and as a means to demonstrate their benefits in use"<br />
Trolley Test to Measure the Energy<br />
Absorption of Front Underrun Guards<br />
It ha$ been statcd earlier in the paper that in the<br />
opinion of the authors it is essential that f ront<br />
underrun guards should absorb energy in order to<br />
raise the maximum survivable closing speed for car<br />
occupants. The tests carried out using one type of<br />
truck guard have shown that it is feasible to incorporate<br />
at least 20 kJ of controlled energy absorption<br />
into the guard.<br />
Table 5. $ummery of illnl car perlormence In lmpact<br />
tests.<br />
loth<br />
,!ihic I eg<br />
rovrnil<br />
r uck<br />
tbtior'cry,<br />
Impect test<br />
Cl dsi r1g<br />
spcPd<br />
n/s<br />
Pe ak<br />
dece I eratjdn<br />
a<br />
<strong>SECTION</strong> 4. TECHNICAL SESSIONS<br />
Car<br />
cI dsh<br />
Peak<br />
seat belt<br />
I oad<br />
KN<br />
Without quard t 7,8 l8 l, ]0 2.41<br />
wiih quard 17.2 71 0,65 5.56<br />
wrtnout guard 20,1 45 1.17 Not<br />
avai I Ebl (<br />
wrth qu8rd | 7.8 40 0.60 5. 10<br />
This section of the paper describes the development<br />
of a dynamic test procedure to measure the energy<br />
absorbed by lront underrun guards. To encourage<br />
future guards to have more energy absorption, an<br />
input energy change of 25 kJ has been used.<br />
The aims of the test are to monitor the force levels<br />
and horizontal stroke of the guard to ensure that the<br />
energy absorption is used satisfactorily in impacts<br />
between small cars and trucks.<br />
The test procedure<br />
The mobile impactor or trolley is shown in Figure<br />
8. It is basically a 6 mm thick piece of square section<br />
steel tube which measures 200 mm by 200 mm and is<br />
approximately 2 m long. It runs ou wheels and has<br />
extra ma$s bolted to it to bring its total mass up to<br />
250 kg. The impact face is a l0 mm thick piece of<br />
steel which is 200 mm high by 400 mm wide and has a<br />
50 mm thick piece of plywood bolted to it. This in<br />
effect forms a non-deformable impactor. The impact<br />
face on an earlier version of the trolley was 200 mm<br />
square, to represent a car engine block. However, in a<br />
trial impact into the centre of an underrun bumper<br />
beam, it caused considerably more bending of the<br />
beam of the guard compared with that occurring in a<br />
similar impact with a car.<br />
The underrun guard to be tested was mounted, in<br />
accordance with the manufacturer's instructions, to<br />
the rear of a truck of similar mass to the one used for<br />
the car impact tests. Thus any limitations in the<br />
effectiveness of rhe guard by the truck itself should be<br />
demonstrated.<br />
The trolley was propelled into the guard at a speed<br />
of about 50 km/h to give the required energy change<br />
of 25 kJ. The method of doing this was similar to<br />
that described earlier for the moving car to moving<br />
truck tests except that the trolley was towed up to<br />
W,<br />
Flgure 8- Tesi trolley<br />
$<br />
{ rfl<br />
lll
speed by a powerful car using a towing cable which<br />
passed beneath the truck. Points of impact were into<br />
the centre of the guard bumper beam and also in line<br />
with one of the drop arms. It was arranged for the$e<br />
tests that the trolley body centre line was at the same<br />
height from the ground as the middle of the bumper<br />
beam. As in the case of the car tests, the trolley was<br />
free running at impact.<br />
The speed of the trolley was measured just before<br />
impact and transducer$ were fitted, one each side of<br />
the body of the trolley, to measure deceleration. The<br />
tests were also filmed by high speed cine camcra$.<br />
The underrun guards tested<br />
Three commercially available guards, normally fitted<br />
to trucks to satisfy British requirements for rear<br />
underrun protection, were tested. Each has built-in<br />
energy absorption working on different principles.<br />
They all employ similar structures which consist of a<br />
cross-beam welded to two vertical drop arms. The<br />
drop arms are pivoted from brackets which are<br />
attached to the truck's chassis. The cross-beam or<br />
bumper bar is a rectanglar hollow steel sectiotr 150<br />
mm by 75 mm with 6 mm wall thickness. The energy<br />
absorbing mechanisms used in each guard are described<br />
below.<br />
The TI Tube Products 'Rearguard', shown again in<br />
Figure 9(a), has been described briefly in the introduction<br />
to this paper but in more detail, it works as<br />
follows:<br />
It uses two invertube cartridges 450 mm long and<br />
capable of being compressed by 200 mm. These join<br />
the lower ends of the drop arms to brackets mounted<br />
on the truck chassis approximately 300 mm forward<br />
of the drop arm pivot brackets. In the event of an<br />
impact the drop arms swing forwards, causing the<br />
invertube cartridges to operate when the compressive<br />
force in either reaches about 50 kN. The function of<br />
these cartridges is to absorb the energy of an impact<br />
by turning a steel tube 'inside out'. The system may<br />
be tuned by changing the dimensions of the invertube<br />
cartridge to enable it to absorb the required amount<br />
of energy. In the form tested the pair of cartridges<br />
could absorb about 20 kJ of energy. Additional<br />
energy may be absorbed by bending of the bumper<br />
beam in severe impacts.<br />
In the Quinton Hazell 'Underider' guard shown in<br />
Figure 9(b) the cartridges used operate on a different<br />
principle. Instead of using invertubes, the cartridges<br />
contain a special hydraulic oil. When the cartridges<br />
stroke in an impact, the oil is forced through a<br />
profiled slot in the cylinder wall and a resisting force<br />
is produced which is dependent on the speed of<br />
impact. Thus its energy absorption increases with<br />
increasing speeds. Externally the cartridges have<br />
strong coil springs which are designed to return the<br />
712<br />
EXPERIMENTAL SAFETY VEHICLES<br />
cartridges (and thus the drop arms and the crossbeam),<br />
back to their original state after an impact.<br />
Tests on this guard rvere carried out with two pairs of<br />
cartridges having diftering internal profiled slots.<br />
Finally, the 'CURB' underrun guard, made by<br />
Lostock Hall Fabrications Ltd, is shown in Figure<br />
9(c). It does not use impact absorbing cartridges as in<br />
the two previously described systems. Instead, at the<br />
top of each drop arm there is a butyl rubber block<br />
placed between the arm and the bracket that it pivots<br />
from. In an impact the drop arms pivot and meet<br />
resistance from the rubber. Because of the type of<br />
rubber used, energy is absorbed. After impact the<br />
guard is designed to return to its original position.<br />
Trolley test result$<br />
A total of eight impact tests were performed.<br />
Complete results are not available for two of the<br />
guards. Filming was not possible due to weather<br />
conditions for the centre impact into the invertube<br />
guard and there was insufficient time to carry out the<br />
CURB centre impact.<br />
The full results for the remaining six tests are given<br />
in Table 4. The force during impact was derived from<br />
the mass of the trolley times its deceleration. Trolley<br />
displacement relative to the truck during impact was<br />
measured from the film and thc total energy absorbed<br />
by the guards was determined from the area beneath<br />
the force displacement curves.<br />
Overall, the energy absorbed by the guards increased<br />
with increase in maximum displacement. The<br />
largest displacement occurred in test 86, into the drop<br />
arm of one of the hydraulic guards but was caused<br />
mainly by a partial tailure of one of the mounting<br />
brackets.<br />
The peak forces varied with the type of guard. The<br />
Tube Products invertube guard and the CURB produced<br />
the largest forces. However, in the impacts into<br />
the Quinton Hazell guards with modified hydraulic<br />
units, the forces irrcreased nearly to the same level.<br />
It is only in the tests with the hydraulic guards that<br />
a full comparison may be made between impacts in<br />
line with a drop arm and into the centre of the<br />
bumper beam. In both pairs of tests (onc pair with<br />
modified hydraulic units) the force levels in the centre<br />
impacts were about 15 per cent greater. This would<br />
indicate that even in asymmetric impacts, work is<br />
being done by both energy absorbing cartridges. This<br />
was also found in the impact in line with the drop<br />
arm of the invertube guard, where the stroke of the<br />
cartridge at the drop arm away from the trolley<br />
impact point was at least half that of the other unit,<br />
showing that it had done work.<br />
In both the centre impacts carried out the bumper<br />
beam deformed, thus absorbing some energy. The<br />
amount of bending is less than that produced in the
<strong>SECTION</strong> 4. TECHNICAL SESSIONS<br />
impact between the small car and the invertube guard impacting face would appear to be a satisfactory<br />
but bearing in mind the higher impact speed and comprotnise. Virtually no beam bending occurred in<br />
energy in the car irnpact, the dimensions of the trolley any of thc impacts in line with the drop arms'<br />
rTT ,4 x<br />
itff$<br />
wdi<br />
4*,fi\<br />
t t<br />
'!*rpll<br />
t " "<br />
P--'<br />
h<br />
I' ft<br />
f,"<br />
s<br />
fi<br />
; l<br />
,W<br />
d<br />
,i<br />
t<br />
ilt<br />
J<br />
t<br />
(a) Invertube energy absorber<br />
?Hydraullc energy absorber<br />
#l<br />
'Try<br />
fl<br />
r ilF<br />
il=<br />
-==!<br />
n m<br />
W-**.L ffi<br />
(c) Rubber energy absorber<br />
Figure 9. Three types ol<br />
underrun guard before and after lmpact
Table 4. Trolley test results<br />
Test<br />
rhb6r<br />
Point<br />
df<br />
impact<br />
BT Drop<br />
Erm<br />
B4 Drop<br />
arm<br />
T ype<br />
of<br />
guaro<br />
lubE<br />
Producte<br />
InvsrtL66<br />
Quinton<br />
HazeII<br />
Hydrculic<br />
B5 CGhtr€ Qui rrtqn<br />
HEzel I<br />
Hydrsulic<br />
86* Drop<br />
srm<br />
Ouinton<br />
Ha4l I<br />
HydrEuI ic<br />
87* Centre Quinton<br />
Hazol I<br />
Hydraul ic<br />
B8 Drop<br />
Erm<br />
CURB<br />
Rubber<br />
Speed<br />
of<br />
ifrpact<br />
n/a<br />
Erergy<br />
ebeorbed<br />
by guatd<br />
KJ<br />
Haximo<br />
Fdfce<br />
duri nq<br />
ImpHct<br />
KN<br />
Haximum<br />
dlBpI dcemen<br />
of front of<br />
tfolley<br />
ft<br />
+*<br />
It.7 10.9 121 0.19<br />
14.0 16.8 & 0.40<br />
14,7 18. o 74 D,47<br />
14,8 19. I 90 0.5J<br />
t4,2 t 6.2 Iil 0,28<br />
I t,6 14.<br />
] 121 0,29<br />
Different profiled slot in hydrBUIic units cmpered with thoee useo<br />
in tasts 84 and 85.<br />
* Eelativs to truck<br />
The results of the impacts in line with the drop<br />
arms, for each type of guard, may be seen in Figures<br />
9(a), (b) and (c). Their force displacement curves are<br />
shown in Figure 10. The shapes of the curves are<br />
different for each guard. The force in the invertube<br />
guard increases with stroke up to a maximum of just<br />
over 120 kN to give a total energy absorption of<br />
about ll kJ. The hydraulic guard force rises to a<br />
lower maximum of just over 60 kN but maintains that<br />
level of force over considerably longer stroke to<br />
absorb about l7 kJ of energy. In the CURB guard<br />
result, the force level is quite Iow oyer the initial O.lj<br />
m of stroke. The analysis of the film suggests that<br />
these low forces occur while the rubber insert is<br />
compressing. The force then rises rapiclly as the drop<br />
arms deform and the stroke increases to 0.Zg m. The<br />
total energy absorbed was about 14 kJ but most of<br />
z<br />
Figure 10. Dynamic force-deflection<br />
cune$ for three<br />
types of energy absorbing underrun guard<br />
714<br />
110<br />
s<br />
80<br />
30<br />
0<br />
I<br />
,.,",,,". .,,..,, ,'\ l*/4-<br />
I<br />
\J<br />
i<br />
i \ i<br />
,<br />
0.10 0.20 0 30<br />
Ilrlli.rlon m<br />
"'"""'"'"'sY 'h$rhc'<br />
{BEr<br />
EXPERIMENTAL SAFETY VEHICLES<br />
Hynraurrc<br />
€noTy rbhrbr. {84)<br />
this was dissipated in drop arm bending (see also<br />
Figure 9(c)).<br />
It is interesting that in the six tests, none of the<br />
guards absorbed more than about three-quarters of<br />
the trolley energy change. The lowest absorption was<br />
obtained with the invertube guard when around half<br />
was absorbed. In this test neither of the invertube<br />
cartridges stroked fully. However, good agreement<br />
was obtained between the energy absorption calcu-<br />
Iated from the linear compression of the cartridges<br />
and that measured from the force displacement curve.<br />
It does, therefore, appear to be a genuine result.<br />
Detailed analysis of the deceleration traces and high<br />
speed film did not yield any obvious parhs for the<br />
remaining energy. Trolley rebound velocities were very<br />
low in all cases and truck movements during impact<br />
were also negligible. It is possible that energy was<br />
absorbed by the temporary bending of various compo_<br />
nents of the truck such as chassis members and the<br />
cab structure and in wind up of the vehicle suspen_<br />
sion.<br />
Implicntions for future legislation<br />
If underrun protection at the front of trucks<br />
becomes mandatory in the future, it is suggested that<br />
legislative requirements for two aspects of its perfor_<br />
mance would be necessary. The first should be concerned<br />
with its energy absorbing properties and the<br />
second with its ultimate strength.<br />
Energy absorption. Corrsidering first the energy ab_<br />
sorption requirements, a dynamic test should be<br />
specified similar to the trolley test described in this<br />
paper. The test speed should be at least 50 km,zh and<br />
it is suggested that the energy input should be at leasr<br />
25 kJ. Limits should be placed on the force levels and<br />
maximum stroke during the impact. As stated earlier<br />
the force level should lie within a range which will<br />
allow the frontal structure of a small car to crush. In<br />
the car to truck impacts described in this paper<br />
maximum forces of between 240 kN and 300 kN (33<br />
to 40 g) were obtained when the trucks were fitted<br />
with one type of guard.<br />
Relating rhese values to a 2510 kg impactor would<br />
suggest that the trolley or impactor deceleration<br />
should be limited ro a maximum of 100 g (equivalent<br />
to a force of 245 kN). It may also be advisable to<br />
have a lower limit, say 50 g, in the initial stages of<br />
collapse of the guard, for example in the first 100<br />
mm. This would extend the benefits of the energy<br />
absorption properties of the guards to lower energy<br />
impacts between cars and trucks.<br />
It i$ suggested rhar rhe maximum $troke of the<br />
guard in the proposed t€st should not exceed 400 mm.<br />
This should prevent the cab structure of the truck<br />
from reaching the passenger compartment of the car<br />
after allowing for the crush of the bonnet of a small
car. The only way of increasing the allowable stroke<br />
would be by permitting the guard to project forward<br />
of the front of the truck.<br />
Test impacts should be carried out both at the<br />
centre of the beam and in line with one of the guard<br />
drop arms. The latter test should ensure that the<br />
torsional strength of the bumper bar and its joints<br />
with the drop arms are sufficient to utilise mosr of rhe<br />
guard's total energy absorbing capability even in an<br />
offset collision. It may prove necessary to specify a<br />
third impact position, close to the outer end of the<br />
guard, to prevent weak bumper beam ends being<br />
used. These can allow the truck structure to $trike the<br />
car passenger conparfment in collisions close to the<br />
lateral extremities of the truck. The required guard<br />
strength in this area is not easy to specify. If the<br />
guard is too stiff it may tear into the footwell of a<br />
weak car. One test carried out at TRRL with a car<br />
impacting into the outer end of an invertube underrun<br />
guard produced reasonably satisfactory results. Although<br />
the beam end bent to some extent, and<br />
therefore absorbed some energy, it did not allow the<br />
upper structure of the truck to strike the car passenger<br />
compartmenf. Further work is needed in this area to<br />
finalise a requirement.<br />
The top edge of the impactor face should be no<br />
more than 400 mm fronr the ground to ensure that the<br />
guard, when fitted to the truck, is low enough to be<br />
effective.<br />
It may be questionable whether such a test procedure<br />
should be carried out with the underrun protection<br />
mounted on a truck because of possible damage<br />
to the vehicle. It does however have the important<br />
advantage that it is representative of how the guard<br />
will be used in practice on the road. For underrun<br />
protection which forms an integral part of the truck<br />
cab structure, it may be the only way to test it.<br />
An alternative test method would be to mount the<br />
guard via a rigid subframe to a large concrete block<br />
but further research would be needed to compare the<br />
results from the two methods of test.<br />
Ultimate strength. The guard or protection must be<br />
ultimately strong enough so that when it is struck by a<br />
large car it does not break off and allow the car to<br />
underrun the truck structure. It is obviously not<br />
justifiable to make the structure strong enough to<br />
survive a large car impact at very high speed since it is<br />
unlikely under such circumstances that even seat<br />
belted car occupants would $urvive.<br />
In an earlier 64 km/h test impact at TRRL between<br />
a heavy car (a 200 series Volvo) and the front of a<br />
truck fitted with a Tube Products underrun guard, the<br />
guard survived the impact. Since this guard meets the<br />
European Community Directive EEC 79/490 (which<br />
stipulates maximum forces and deformations for rear<br />
underrun protection) in order to satisfy the British<br />
<strong>SECTION</strong> 4. TECHNICAL SESSIONS<br />
Construction and Use Regulation 49, it is suggested<br />
that this requirement would form an adequate criterion<br />
for ultimate strength for front underrun guards.<br />
Testing other types of front underrun protection. In<br />
this paper the only type of protection that has been<br />
considered in depth has been the 'add-on' type of<br />
guard. It may, in the future, be possible to provide<br />
front underrun protection as an integral part of the<br />
cab structure or as an extension to it, in the same way<br />
that energy absorption is provided in a car frontal<br />
structure. This could prove to be both lighter and<br />
cheaper.<br />
The testing of this type of protection for legislative<br />
purposes may provide some problems. It would almost<br />
certainly have to be tested 'on the truck'.<br />
Whether a trolley test would be satisfactory for<br />
measuring energy absorption performance is not easy<br />
to say without further research. Ultimately the true<br />
test of its effcctiveness would be demonstrated only<br />
by impacts using a car or car sized mobile barrier<br />
having a deformable face.<br />
Conclusions<br />
Car impact tests to demonstrate the<br />
effectiveness of truck front underrun guards<br />
l. A truck front underrun guard with a ground<br />
clearance of 300 mm and capable of absorbing 20<br />
kJ of energy can provide protection from fatal or<br />
seyere injuries to seat belted occupants in a<br />
European small car at closing speeds up to about<br />
65 km/h. (Equivalent, in this case, to a car<br />
velocity change of 57 km/h).<br />
2. A test procedure, involving a small car impacting<br />
a truck fitted with a front underrun guard where<br />
both vehicles were moving towards each other<br />
before impact, gave similar results to those of an<br />
alternative procedure in which a similar car was<br />
impacted into a stationary truck at the same<br />
closing speed.<br />
3. The stationary truck test is therefore a satisfactory<br />
method of developing front underrun guards<br />
and demonstrating their effectiveness.<br />
4. The test without a front underrun guard fitted<br />
showed the possibility of additional crush of the<br />
car occurring when the truck has initial speed.<br />
This can be caused by the truck 'climbing over'<br />
the car after the basic impact is completed.<br />
Trolley test to demonstrate the effectiveness<br />
of the energy absorption of front underrun<br />
guards or other underrun impact protection<br />
A series of impact tests have been carried out at 50<br />
km,/h bctween a rigid faced trolley impactor of mass<br />
250 kg and three different types of energy absorbing<br />
underrun guards fitted to a truck. The results suggest<br />
that the following procedure could form the basis for<br />
715
a legislative test to determine whether a front underrun<br />
guard has adequate energy absorption. The procedure<br />
might also be suitable for testing alternative<br />
forms of protection such as integral low front structures<br />
on trucks although this has not been verified.<br />
l. The test should consist of three impacts. Two of<br />
them should be at a speed of 50 km/h and with<br />
an energy change of about 25 kJ between a rigid<br />
face impactor and the underrun guard. The face<br />
of the impactor should be approximately 400 mm<br />
wide by 200 mm high and its top edge should be<br />
no more than 400 mm above ground level. The<br />
first impact should be in line with the centre of<br />
the bumper beam and the second in line with one<br />
of the drop arms. Both these impacts should be<br />
,' perpendicular to the guard. A third impact into<br />
one end of the guard has not yet been finalised.<br />
2, The deceleration of the impactor should be measured<br />
and, for the first two impacts proposed,<br />
should not exceed 100 g during the test. For the<br />
first 100 mm of guard mcvement the deceleration<br />
should not exceed 50 g. The total horizontal<br />
movement of the guard during impact should not<br />
exceed 400 mm.<br />
3. To en.sure sufficient ultimate strength, the front<br />
guard should satisfy European Community Directive<br />
EEC 19/490 (which is the Direc-tive normally<br />
used to stipulat€ maximum forces and deformations<br />
for rear underrun protection.)<br />
4. At present, it is considered that the impact tests<br />
should be carried out with the guard fitted to the<br />
truck.<br />
Acknowledgements<br />
The work described in this paper forms part of the<br />
research programme of the Transport and Road<br />
Research Laboratory and the paper is published by<br />
permission of the Director. Thanks are due to TI<br />
EXPERIMENTAL SAFETY VEHICLES<br />
Tube Products Ltd, Quinton Hazell PLC and Lostock<br />
Hall Fabrications Ltd who provided the underrun<br />
guards usecl in the trolley tests, to Ken Sheppard who<br />
drove the truck in the moving truck to moving car<br />
impact tests and to the TRRL personnel involved in<br />
the carrying out and recording of the test programme.<br />
References<br />
l. Riley, 8.S., and Bates, H.J. An analysis of fatal<br />
accidents involving heavy goods vehicles in Great<br />
Britain. Proceedings of the 8th <strong>Int</strong>ernational<br />
Technical <strong>Conf</strong>erence on Experimental Safety Vehicles,<br />
Wolfsburg 1980. NHTSA US Dept. of<br />
Transportation.<br />
2. Riley, 8.S., Penoyre, S. and Bates, H.J. protecting<br />
car occupants, pedestrians ancl cyclists in<br />
accidents involving heavy goods vehicles by using<br />
front underrun bumpers and sideguards. proceedings<br />
of lfth <strong>Int</strong>ernational Technical <strong>Conf</strong>erence<br />
on Experimental Safety Vchicles, Oxford t9g5.<br />
NHTSA. US Dept. of Transportation.<br />
3. Penoyre, S., Riley, B.S. and Page, M. Desirable<br />
structural features for the design of front and rear<br />
underrun bumpers for heavy goods vehicles. <strong>Int</strong>ernational<br />
<strong>Conf</strong>erence on Vehicle Structures -<br />
July 1984 at Cranfield Institute of Technology,<br />
England. Institution of Mechanical Engineers.<br />
4. Riley, 8.S,, Chinn, B.P. and Bates, H.J. An<br />
analysis of fatalities in heavy goods vehicle accidents.<br />
Department of the Environment Department<br />
of Transport, TRRL Reporr LRl0l3. Crowthorne<br />
l98l (Transport and Road Research<br />
Laboratory).<br />
Crown Copyright. Any views expressed in this paper<br />
are not necessarily those of the UK Department of<br />
Transport. Extracts from the text may be reproduced,<br />
except for commercial purposes, provided the source<br />
is acknowledged.<br />
The Benefits of Energy Absorbing Structures to Reduce the Aggressivity of<br />
Heavy Trucks in Collisions<br />
Ian S. Jones,<br />
Insurance Institute for Highway Safety,<br />
United States<br />
Abstract<br />
Because of the large weight differences that now<br />
exist between heavy trucks and cars, car occupants ar€<br />
at risk of serious injury when they collide with large<br />
trucks. However, although there is little that can be<br />
716<br />
done to reduce this disparity in weight, it is possible<br />
to modify trucks so that the effects of the impact<br />
between a heavy truck and a car could be lessened.<br />
This paper estimates the effects of moctifying the<br />
fronts of heavy trucks to incorporate crushable structures<br />
with stiffness characteristics similar to the fronts<br />
of cars. Equations of motion are developed that show<br />
that equipping trucks with crushable zones would<br />
increase the deceleration distance available to car<br />
occupants<br />
in car-truck collisions by 40 percent and
educe the average deceleration to restrained occupants<br />
by a factor of l4. A method is provided that<br />
tran$psses this reduction in acceletation to a reduction<br />
in fatality risk using Fatal Accident Reporting System<br />
data for 1977-1985. An example is given that shows a<br />
cru$hable zone could reduce the likelihood of fatal<br />
injury to car occupants by as much as 33 percent.<br />
<strong>Int</strong>roduction<br />
ln 1985 there were nearly 40,000 fatal accidents in<br />
the United States and 4,211 or ll percent of these<br />
involved heavy trucks (>26,000 lbs.). While attention<br />
has been given to improving the crashworthiness of<br />
cars to reduce the risk of serious or fatal injury,<br />
virtually nothing has been done to reduce the risk to<br />
other road users in collisions with large trucks.<br />
Seventy-nine percent of all fatal truck accidents involve<br />
other vehicles, and 42 percent involve a large<br />
truck and a passenger car (Figure l). Truck-car<br />
collisions are the single most common type of fatal<br />
truck collision and the deaths are almost always to the<br />
car occupants,<br />
Table I gives a breakdown of car occupant deaths<br />
in car-truck collisions by the impact area to the car<br />
and to the truck. Of the 2,187 car occupant deaths in<br />
crashes with large trucks in 1985, 29 percent occurred<br />
in frontal collisions, 32 percent occurred from the<br />
truck hitting the $ide of the car, 9 percent from the<br />
car hitting the side of the truck, 12 percent from the<br />
car hitting the rear of the truck, and 5 percent from<br />
the truck hitting the rear of the car. Engineering<br />
design improvements directed toward reducing the<br />
aggressiveness of trucks could reduce the severity of<br />
many of these crashes. For example, it has been<br />
Figure 1. Dlstrlbution of fatal truck* crashes by number<br />
of vehlcles involved-lg85 FARS data<br />
<strong>SECTION</strong> 4. TECHNICAL SESSIONS<br />
Table 1. Charfictfflstlcs of cer occupsnt deathe In<br />
car-truck crashes-l985 FARS data<br />
established for some time that truck rear underride<br />
guards can reduce fatalities by effectively preventing<br />
cars from underriding trucks whetr cars strike the<br />
rear-ends of trucks. Crash protection devices on the<br />
sides of trucks sirnilar to those for rear undcrride<br />
guards could also reduce car occupant fatalities in side<br />
impacts. Ways to protect car occupants in collisions<br />
where the front of the truck hits the front, side or<br />
rear of the car are less obvious, but, in theory at<br />
least, they can be developed, This paper concentrates<br />
on ways of improving crash protection for car occupants<br />
in collisions in which the fronts of trucks strike<br />
the fronts of the cars.<br />
Theoretical Development<br />
.-tr""L c"""h*;.witrr--- -<br />
ImfEct Point Car Occupant -Fatal,rtl-<br />
Truck C.l N FelcFq!<br />
Frqnt<br />
Front<br />
Side<br />
fted a<br />
front<br />
0lhEr<br />
Front<br />
S ids<br />
Front<br />
Front<br />
Reat<br />
29<br />
6Sq l2<br />
r92 9<br />
It has been claimed that, because of the large mass<br />
difference that now exists between heavy trucks and<br />
cars, for a giverr collision it is difficult to do anything<br />
that would reduce the velocity change that the car<br />
experiences.t Although little can be done 1o reduce the<br />
disparity in mass, it is possible to modify the fronts of<br />
trucks so that the injury potential of the impact<br />
between a heavy truck and a car could be lessened.<br />
The velocity change experienced by the car in a<br />
car-truck collision cannot be changedn but the distance<br />
and time over which it takes place can be increased by<br />
modifying the front of the truck. Increasing the time<br />
or distance of the velocity change has the effect of<br />
decreasing the deceleration experienced by the car<br />
occupants and consequently their risk of injury. This<br />
can be accomplished by putting a structure on the<br />
front of the truck with energy absorbing characteristics<br />
similar to those of a car.<br />
Consider a symmetrical head-on (or central) collision<br />
between two vehicles as shown in Figure 2. The<br />
following notation is used:<br />
E, (Er) = energy absorbed by vehicle I (vehicle 2);<br />
Kr (KJ : crush stiffness of vehicle I (vehicle 2);<br />
mr (mz) : mass of vehicle I (vehicle 2);<br />
dt (dt) = crush distance on vehicle I (vehicle 2);<br />
F, (F ) = force on vehicle I (vehicle 2; and<br />
ar (aJ = deceleration of vehicle I (vehicle 2),<br />
1 1 n<br />
280 13<br />
totAl 2,161 100<br />
q<br />
7t7
Figure 2. Central collision betvueen two vehicles<br />
During the collision the forces on each vehicle are<br />
equal and opposite so that Fr = Fz. If it is assumed<br />
that the force on the vehicle is proportional to the<br />
vehicle crush. then<br />
F1 = K1d1 : Fz = Krde. (l)<br />
The energy absorbed in crushing vehicle I is given by<br />
Er : Krd?/2'<br />
The energy absorbed in crushing vehicle 2 is given by<br />
E2 = Kzdi/z.<br />
Then the total energy (E) absorbed during the collision<br />
is given by<br />
E:Er+Ez<br />
: Ktdl/z + r-2dl/2.<br />
In a truck-car collision, the crush on vehicle 2 (the<br />
truck) is zero and the total energy absorbed is given<br />
by<br />
E : Ktd?/z.<br />
Alternatively, the crush on vehicle I is<br />
d' = rffif<br />
If the truck is modified so that its stiffness is equal to<br />
that of the car, the truck absorbs a proportion of the<br />
energy and the total energy absorbed is given by<br />
E=Ki'1/2+Kzz/z.<br />
where d'1 is the new crush of vehicle l. However,<br />
Equation (l) shows that if the vehicles have equal<br />
stiffness the amount of crush on each vehicle will also<br />
be equal such that d'r : dr so that<br />
E : K,(d',)2.<br />
Rearranging Equation (2), the crush d'1 is given by<br />
d', = ffi,<br />
However, the tgtal crush between the two vehicles is<br />
2d'r : 2 \iElKr.<br />
Note that the energy E, absorbed in the collsion, is<br />
the same irrespective of whether the truck is modified.<br />
Also the velocity change, AV, that the occupants of<br />
the car undergo is the same, but when the truck is<br />
modified the car occupants are decelerated over a<br />
Ionger distance so that their average deceleration is<br />
718<br />
EXPERIMENTAL SAFETY VEHICLES<br />
(2)<br />
Tabte 2. Nurnber of car occupant end truck occupant<br />
tatalities in latal truck crashes by size oi car<br />
involved-FAH$ data 1977-1985<br />
Truck ft4eFnt &r ftcuptnt Clf/Tcqqk Mran Cir<br />
qls_fEE:f!! ___ lies Frt4rrrieg Fat+!{L_.Mass'1bsr<br />
1,500-r,999 17 595 35,0 r,85I<br />
:,000_:,499 35 91i 26-1 z,ifi<br />
2,500-:,999 34 I.0?? 30-1 2,721<br />
1,000-1,499 {9 1,60t 32.7 1,240<br />
3.500-1,e99 52 1,713 24.5 1,141<br />
4,000-{,{9S 29 156 26.1 4,211<br />
4,500-4,sqs t4 245 I7.5 4,750<br />
RcqceBsion analysis rstultt: frtrlily ratio = 4.0043 (ffi$) + {1,{3;<br />
r ! - 0.8.<br />
less. The ratio of the two deceleration distances<br />
2d'1ld1. Then<br />
2d't/dt = 2rlENt/"lZE/K, = €<br />
Thus, if the truck is modified so that its stiffness is<br />
equal to that of the car, the occupants of the car<br />
derive about 40 percent more ride down, i.e., the<br />
distance in which they are decelerated to rest is<br />
increased by 40 percent. To determine what effect this<br />
increased ride down has on the likelihood of injury<br />
for the car occupants, the most straightforward approach<br />
is to see how their average deceleration is<br />
reduced. Assuming a force is proportional to crush<br />
relationship, the average force F on the car during the<br />
impact is given by<br />
F : I<br />
fdt<br />
Jo<br />
rxoxzd,,<br />
where x is the crush distance at any time during the<br />
impact, and dq is the final crush distance. Then F =<br />
Kd,/2.<br />
Comparing the average force on the car in the<br />
unmodified truck collision (F) with that in the modified<br />
collision (F*) we have<br />
F^/F = 4ntwrl-'lzn/Kt : L/E = 0.7. (3)<br />
Table 3. Number of cer occupant and truc* occupant<br />
fatalities In fetel lrontal car-truck crashes by<br />
size of car Involved-FARS data 1977-1985<br />
Eatio<br />
Ca. Truck kcuptnt tur OccuFn\ Cac/T.uck Mean Gr<br />
!CCg-1EE_-______14!-S! _ Frtrtitr+g {atalities_-Mns+-lbq.<br />
1,500-1,9t9 3 lEE 62.7 LE5{<br />
2,000-u,499 | 328 82.0 :,?67<br />
i,5oo-r.sge 4 32: 80.5 2,7oj<br />
3,000-3,499 7 441 63,0 3,?ll<br />
3,500-1,999 1 32e 47,0 3,116<br />
f.000-4.499 6 169 26-2 4,204<br />
4,500-4.9T9 z 15 31.5 {.llr<br />
Rsgrsssion rMlytis rssultsi frtrlily Frtio = -0 0163 (firtt + lI0.li<br />
r + -0,82{-
However, because the mass of the vehicle is unchanged<br />
the ratio of modified versus unmodified<br />
average force also represent$ the change in the deceleration<br />
that the car occupants will experience providing<br />
they are restrained, i.e., modified deceleration =<br />
0.7 (original deceleration).<br />
Thus, equipping the fronts of trucks with a crush<br />
zone of stiffness equal to that of cars will reduce the<br />
deceleration that restrained car occupants experience<br />
by a factor of 1.4. Unrestrained car occupants will<br />
derive less benefit from the ride down.<br />
Estimated Reduction in Fatality Risk<br />
From Modified Truck f'ront-End<br />
Design<br />
If the deceleration of the occupant can be reduced<br />
by 1.4, injury severity will also be reduced particularly<br />
if the occupants are restrained. In effect, the increased<br />
crush space gives the occupant more distance in which<br />
to decelerate while the velocity change for the car<br />
remains the same. Another way to look at this<br />
reduction in deceleration is as an increase in the<br />
elfective mass of the car.<br />
This can be seen by rearranging Equation (3):<br />
F- : Fr.E so that F-/m = Frm Vz<br />
or d/ = F/m 42.<br />
where a' is the reduced deceleration. Hence for the<br />
purposes of calculating the effect of the crushable<br />
zone on reducing the risk of fatal injury, the reduced<br />
deceleration is effectively achieved by increasing the<br />
mass of the car by a factor of V2, i.e., the effective<br />
massm' : mVZ.<br />
There is evidence that the risk of fatality in<br />
car-truck collisions increases as the mass of the car<br />
decreases.r lf this effect can be quantified, the reduction<br />
in fatalities that could be achieved by increasing<br />
the effective mass of the car could be assessed.<br />
Using Fatal Accident Reporting System (FARS)<br />
data for years 1977 to 1985, Table 2 gives the ratio of<br />
car occupant to truck occupant fatalities for fatal<br />
accidents involving large trucks (>26,000 lbs.)<br />
analysed by subcategories of vehicle weight in increments<br />
of 500 lbs; the mean rnass of the cars involved<br />
is given for each car weight category. Figure 3 shows<br />
the fatality ratio plotted against the mean car mass<br />
for each weight category. The increasing fatality risk<br />
with decreasing car size is clearly evident, and the<br />
strength of the relationship is conlirmed by the<br />
regression analysis correlation coefficient of -0.8<br />
(p
injury to the truck driver. ttris would ihcrease the<br />
denominator in the fatality ratio and produce an<br />
anomalous effect of increasing fatality ratio with<br />
decreasing car mass. One would intuitively expect the<br />
effect to be small because, at closing speeds of 60<br />
mph, the increase in velocity change experienced by a<br />
40,000 lb. truck in a frontal collision with a 2,000 lb.<br />
car compared to 4,000 Ib. car is less than I mph.<br />
To examine these effects, multiple logistic regression<br />
procedure$ were used.o To fit the regression<br />
models the CATMOD procedure from the SAS Institute<br />
was used.s The dependent variable in each<br />
observation was the presence or absence of a fatal<br />
injury, and the independent or predictor variables<br />
were car mass, year of accident, and the interaction of<br />
car mass with year of accident. Car mass was centered<br />
about its mean by recoding car mass as the difference<br />
between the mean mass and the mass of the accident<br />
involved car. Regression equations were used to predict<br />
the log odds of occupant lhtality for the following<br />
situations: death of a car occupant given a fatal<br />
head-on car-truck accident; death of a car occupant<br />
given a fatal head-on car-truck accident in which the<br />
truck driver died; death of a truck occupant given a<br />
fatal head-on car-truck accident. The results are siven<br />
in Tables 4 through 6.<br />
The odds of fatality for car occupants (Table 4)<br />
increased significantly with decreasing car ma$s<br />
(p
Cs<br />
hErhs<br />
harhs<br />
1600 20tr 24m z8m 3?m 36m aom tffi 4ru<br />
tsr MsEg . tbE<br />
Flgure 4. Ratlo of car occupant to truck occupanl<br />
deaths versue car mass-frontal crashes<br />
the risk of fatality to car occupants in car-truck<br />
collisions by about one-third. Although rhe concept of<br />
crushable zones or front guards has received little<br />
atfenlion in the United States, their feasibility has<br />
been a$sessed in Europe. A United Kingdom study<br />
estimated that about 25 percent of car occupants<br />
killed in car-truck collisions would have survived with<br />
a suitably constructed front energy absorbing guard.6<br />
A prototype guard was constructed with a crushable<br />
distance or stroke of 40 cm (15.7 in.). This was based<br />
on the fact that 50 to 60 cm is the maximum crush<br />
distance available in the smallest mini-cars before<br />
serious intrusion starts to occur. The characteristics of<br />
the prototype bumper allowecl it to start to stroke at a<br />
load of 146 kN (approximately l0 tons). However,<br />
crash tests of a 1,000 kg car irrto a 5,100 kg truck at<br />
50 km/h (angled offset) and 64 km/h (perpendicular<br />
offset) showed that the bumper did not stroke fullyn<br />
although it proved effective in preventing underrun<br />
and passenger compartment intrusion. A central perpendicular<br />
test of a 1,550 kg car into the truck at 56<br />
km/h also failed to stroke the bumper fully. To<br />
optimize the energy absorption the load required to<br />
stroke the bumper was reduced to 68 kN. The<br />
modil'ied bumper stroked fully, in a central impact<br />
with a 1,fi)0 kg car at 65 km/h (40 mph). This stucty<br />
clearly demonstrated that protection for car occupants<br />
at closing speeds of 65 km/h was possible providing<br />
occupant restraints are used. In the absence of passive<br />
rcstraints or if seat belts are not worn, protection<br />
cannot be provided for unrestrained occupants at<br />
relative speeds much above 40 km/h (25 mph).<br />
A Cerman study that looked at the possibilities of<br />
reducing the consequences of car-truck accidents<br />
found that more than half of car-truck fatalities occur<br />
to car occupants involved in frontal collisions with<br />
trucks.T The study concluded that, although the relative<br />
speeds in frontal collisions were high, reducing<br />
the agressitivity of the front end of rhe rruck would<br />
also reduce the risks in truck collisions- In fact. if the<br />
<strong>SECTION</strong> 4. TECHNICAL SESSIONS<br />
results of the United Kingdom study (i.e., fatal<br />
collisions below 65 km/h are survivable with front<br />
energy absorbing guards) are applied to the German<br />
accident data, more than 40 percent of the fatal<br />
frontal collisions between cars and trucks would be<br />
affected.<br />
The results of all three studies lead to the conclusion<br />
that energy absorbing burnpers on the fronts of<br />
trucks could provide a substantial saving of life. Over<br />
2,000 accidents in the United States each year involve<br />
a car-truck collision in which there is fatal injury to<br />
the car occupant. Table I shows that in 1985, 624 ol<br />
these collisions were frontal impacts so that 32 percent<br />
or about 200 fatal accidents per year could be<br />
ameliorated by energy absorbing bumpers.<br />
Conclusions<br />
l. If trucks were constructed with front energy<br />
absorbing guards so that their energy absorptiorr<br />
characteristics were similar to that of cars. the<br />
severity of injuries to car occupants involved in<br />
carltruck accidents could be substantially reduced.<br />
2. Energy absorbing zones on the fronts of trucks<br />
could increase the ride down distance available to<br />
car occupants by 40 perc€nt and reduce their<br />
average deceleration by a factor of I.4.<br />
3. Energy absorbing zones on the fronts of trucks<br />
could reduce the risk of fatal injury in car-truck<br />
collisions by as much as 33 percent.<br />
Acknowledgments<br />
The author would like to tharrk Dr. Maria penny<br />
and Mr. Marvin Ciinsburg for programming thc FARS<br />
analysis and Dr. Paul Zador for advice with the<br />
statistical analysis and helpful comments regarding<br />
their interpretation.<br />
References<br />
l. Eicher, J,P., Robertson, H.D., and Toth, G.R.<br />
Large Truck Accident Causation. National Highway<br />
Traffic Safety Administration Technical Report<br />
DOT H5-806-300, July 1982.<br />
2. Jones, I.S. The Effect of Impact Type and<br />
Vehicle Velocity on Vehicle Crush Characteristics.<br />
Proceedings, ?lth Annual <strong>Conf</strong>erence, American<br />
Association of Automotive Medicine: 2ll-230,<br />
San Antonio, Texas, 1983.<br />
3. National Highway Traffic Safety Administration.<br />
Fatal Accident Reporting System 1983. A review<br />
of information on fhtal traffic accidents in the<br />
U.S. in 1983. U.S. Department of Transportation,<br />
National Center for Statistics and Analysis. 1983.<br />
4. Walker, S.H., and Duncan, D.B. Estimation of<br />
the probability of an event as a function of<br />
721
5.<br />
6.<br />
several independent variables' Biometrika. 54:.167-<br />
179. 1967.<br />
SAS Institute, Inc. 1985. S'4S Users Guide: Statistics,<br />
Version 5 Edition. SAS lnstitute, Inc., Cary,<br />
NC.<br />
Riley, 8.S., Penoyre, S', Bates, H'J' Protecting<br />
car occupants, pedestrians and cyclists in accidents<br />
involving heavy goods vehicles by using<br />
front underrun bumpers and sideguards. I1th<br />
EXPERIMENTAL SAFETY VEHICLES<br />
<strong>Int</strong>ernational Technical <strong>Conf</strong>erence on Experimental<br />
Safety Vehicles. Oxford, July 1985.<br />
7. Danner, M., and Langweider, K. Results of an<br />
analysis of truck accidents and possibilities of<br />
reducing their consequences discussed on the basis<br />
of car-to-truck crash tests. Proceedings of 25th<br />
Stapp Car Crash <strong>Conf</strong>e,'ertce. Warrcndale, PA:<br />
sAE, 198r.<br />
The Global Approach for Safety in the V.I.R.A.G.E.S. Project<br />
Plerre Soret,<br />
Renault Vehicules Industriels,<br />
France<br />
<strong>Int</strong>roduction<br />
During the loth <strong>ESV</strong> conference (Oxford) RE-<br />
NAULT V.I. presented its Research Programme<br />
V.l.R.A.G.E.S. (Industrial Vehicle Improving Energy<br />
Consumption and Safety) and the test results of a first<br />
stage experimental vehicle (VE l0).<br />
This research programme directed by RENAULT<br />
V,I. has engaged also related industries such as<br />
Fruehauf and Trailer companies for the semi-trailer.<br />
This programme is planned from 1982 to 1988 and<br />
is partially aided by French Administration :<br />
Ministbre des TransPorts<br />
Agence Frangaise pour la Maltrise de I'Energie.<br />
V.LR.A.O.E.S. is a project with multicriteria objectives,<br />
which tends to satisfy new general specifications<br />
in all components :<br />
for mobilitY and energY<br />
for safety<br />
for goods transportation<br />
for comfort, ergonomy and live conditions<br />
on board<br />
for environmental conditions<br />
for industrial building.<br />
The aim of this project is a new global economical<br />
optimum in the industrial field and for the performance$.<br />
We present here the main elements of the second<br />
experimental vehicle (VE Z0) essentially on the<br />
SAFETY aspect.<br />
V.I.R.A.G.E.S. VB 20 and Primary<br />
Safety<br />
The unit has a total streamlining body and presents<br />
a non-aggressive outline.<br />
722<br />
The width and height conform with the new European<br />
regnlation but its bigger length shows the necessity<br />
of a better adapted regulation to satisfy the use of<br />
new long trailer (13.4m) and to maintain a good level<br />
of comfort in the cab,<br />
The maxi gross weight is 44 tonnes, and the unit<br />
conforms with the European turning circle, despite its<br />
important length (17.4m). F'or the tractor two possible<br />
solutions are in test-a 6 x 2 outline and a 6 x 4<br />
one.<br />
Handling-Roll-Over ComPortment<br />
The vehicle is a 6 axles unit-3 for the tractor and 3<br />
for the semi-trailer-with new tires and wheels with<br />
little diameter (wheel 19"5; height under charge, 937<br />
mm).<br />
This choice, organised with the general architecture,<br />
and the level controlfed hydraulic suspensions permit<br />
to have the gravity center 173 mm down and the roll<br />
axle up.<br />
The use of single wheel on each side of axles makes<br />
the real gauge larger.<br />
The direction control system is realised with a<br />
two-way hydraulic safety unit.<br />
In association with a very front axle, all these<br />
elements permit a better handling of the vehicle<br />
particularly to avoid the roll-over situation.<br />
Braking<br />
The energy absorption for the modulation of the<br />
running speed is realized by a hydro-mechanical<br />
retarder installed between the engine and the gear<br />
box. It permits to eliminate 170 KW in a permanent<br />
retarding phase and 300 KW during short phases.<br />
The braking is obtained by disc brakes with high<br />
pressure hydraulic control on the tractor and pneumatic<br />
control on the semi-trailer. There is a double<br />
control circuit on each axle, and an anti-slipping<br />
device on each wheel.<br />
In the 6 x 2 version an original device derived of<br />
the use of hydropneumatic suspensions, permit the
transient overloading of the motorised axle to increase<br />
the limit adherence for the starting phase.<br />
This micro-process piloted device acts automatically<br />
and uses certain components of the anti-slipping<br />
system.<br />
Yisibility-Lights<br />
During night the visibility of the unit is reinforced<br />
by a reflecting painting belt.<br />
At the driving place, the visibility is very improved<br />
because of the front and lateral windshield which<br />
corne down the level of the cab floor*the visibility<br />
distance is divided by 2 in relation of the actual cabs.<br />
The lateral rear visibility is realised by classical<br />
large mirrors.<br />
The Driving Place is nn important<br />
component of the SAFETY<br />
In the objective to obtain a large field of visibility<br />
the dash-board is dirnensioned only for the minimum<br />
number of instruments asked by the regulation. The<br />
other informations for diagnostics or vehicle management<br />
(fuel consumption for example) can be obtained<br />
on a satellite display, only when the driver asks for<br />
them.<br />
Less Splash and Spray<br />
The streamlining of the whole vehicle is a good<br />
solution to minimize splash and spray. More an<br />
original box betweerl each wheel collects water and<br />
pours it out, under the body, out of the track of the<br />
wheels.<br />
An electronical device to survey the pressure of tires<br />
complete this set of systems improving in a full<br />
manner the different factors of active safety.<br />
V.I.R.A.G,E.S. VE 20 and Passive<br />
Safety<br />
ln this area the specifications aim to lower seriously<br />
the consequences of a front-to-front shock between a<br />
personnal vehicle and VE 20.<br />
In this type of collision, the priority is to obtain a<br />
good compatibility with the front $tructure of the two<br />
vehicles, avoiding thc usual underrunning of the<br />
passenger car and permitting the structures of the car<br />
to work in the $ame manner as in a front-to-front,<br />
car-to-car shock.<br />
This is obtained by a special front structure of VE<br />
20. The planes of the strengths during the shock are<br />
compatible on the two vehicles. More, deformable<br />
elements of the front axle system are active between<br />
the bumper and the rigid body of the tractor.<br />
SICTION 4. TECHNICAL SESSIONS<br />
Shock tests at a speed of 5i km/h of a car again<br />
the simulated fixed front parts of VE 20 have given<br />
similar results as the normalized shock of the car at<br />
speed 50 km/h on the Eurttpean wall.<br />
For the lateral and rear collisions the very low and<br />
rigid belt gives a better protection as the actual<br />
devices.<br />
For the persons on board, a lattice structure of the<br />
cab, a very high position and a large inner space ( 9<br />
m3) aim to obtain a minimisation of the importance<br />
of the injuries when the cab is concerned during the<br />
accident.<br />
Safety and Use<br />
When the vehicle is stopped for activities related<br />
with goods transportations, original solutions with the<br />
aim of SAFETY have been built.<br />
The access of the cab is realised only on the right<br />
side of the vehicle by an inner stair-case, protected by<br />
sliding doors, to avoid down on the traffic sicle and<br />
put an end to the risks of sliding.<br />
Howevern these choices claim for a long cab not<br />
possible with the actual European regulation and the<br />
use of long semi,trailers.<br />
Tractor and semi-trailer are equipped with a sy$tem<br />
permitting the automatical coupling and uncoupling<br />
operations. This manoeuvre is initialized at the driving<br />
place. During th€ uncoupling operation, for example,<br />
down the stands, unlocking the king-pin, down the<br />
tractor suspension, putting the park brake, out electrical<br />
and pneumatical connections are automatically<br />
realized and the tractor is authorized to run, just only<br />
all necessary sequences are ended.<br />
Conclusion<br />
The experimental vehicle VE 20 is a technical<br />
compromise in regards the aimed multicriteria objec_<br />
tives.<br />
It is not a commercial version, but the essential<br />
industrial and economical constraints have been taken<br />
in account to build a realistic unit.<br />
Despite of these constraiflt$, the vehicle presents in<br />
all ureas of the SAFETY, solurions permitting important<br />
improvements but these gains are the results of a<br />
global approach, that is to say a new global design of<br />
this type of unit in opposition of margin partial usual<br />
responses.<br />
More, these new solutions are often possible only in<br />
the perspective of new regulations better adapted t'or<br />
the goods road transportation of the years 2000.
724<br />
l---<br />
_1.._.<br />
ll FRoNTAI_<br />
NO RIGID<br />
PART<br />
EXPERIMENTAL SAFETY VEHICLES<br />
EUROPEAN<br />
TIJRNING CIRCLE<br />
1- .11-_-!,1*1<br />
- s . E r * l
<strong>SECTION</strong> 4. TECHNICAL SESSIONS<br />
Side and Rear Marking of Trucks With Passive Materials<br />
Hans-.Ioachim Schmidt-Clausen,<br />
Technical University Darmstadt,<br />
Federal Republic of Germany<br />
Abstract<br />
Starting with an investigation about the distribution<br />
of the reflection factor of trucks in Europe and about<br />
the background luminances around the trucks during<br />
nighttime, the influence of different markings on the<br />
conspicuity is tested. Out of these, in the first step<br />
static experiments an optimal side and rear marking<br />
of trucks is developed.<br />
<strong>Int</strong>roduction<br />
During nighttime driving, the trucks are marked not<br />
too conspicuous, so a lot of side- and rear-impacts<br />
can occur. hr down-scaled experiments special markings<br />
of trucks should be developed to improve the<br />
conspicuity.<br />
Figure 1. Side and rear elde of a truck In the Etreot<br />
L", LL, L", L": background luminances<br />
L,, L", Lu: background luminanceg<br />
Luminances of Trucks During Nighttime<br />
In Figure I the situation of recognition of trucks<br />
during nighttirne driving is plotted schematically.<br />
The truck is only seen in the contrast to the<br />
surrounding luminances Lr, Ln, L., Ls in the side<br />
situation, L,, Lr, Lr in the rear situation. The dotted<br />
area describes the luminance area neces$ary for the<br />
detection of a truck.<br />
The influence of the rear position lamps is neglected<br />
in these expcriments because this marking irr Europe is<br />
the same for all vehicles.<br />
In Figure 2 the test results for the threshold<br />
luminances for trucks seen from aside and from the<br />
rear are plotted. ln addition the curves for seen<br />
luminances in the low beam situation are shown for<br />
the area for the chassis (L, in Figure l) and body<br />
work (Lt in Figure l).<br />
This Figure shows that for example the body work<br />
can be seen from the rear at a distance of 70 m, the<br />
chassis at 120 m. These values are for the threshold<br />
case without glare etc. In the normal traffic situation<br />
these distances are much smaller.<br />
Side Marking of Trucks<br />
In a l:10 down scaled experiment the optimal side<br />
marking of trucks was investigated. ln Figure 3 and 4<br />
(annex) these l5 different markings are shown'<br />
ln an asses$ment experiment (9-step-scaline) the<br />
optimal lumitrance of the 15 different side markings<br />
was derived. The results are plotted in Figure 5.<br />
L/cd.m*2<br />
Figure 2. Threehold luminance$ of trucks seen trom<br />
aside, chessie, body work: mean luminances<br />
of these areag<br />
1?,5
Figure 3. Side marklng of trucke<br />
EXPERIMENTAL SAFETY VEHICLES<br />
In this Figure the optimal luminances L for the marking 3: (Figure 3)<br />
markings shown in Figure 3 and 4 are plotted. The marking 6: (Figure 3)<br />
optimal markings are marking 7: (Figure 4)<br />
Flgure 4. Side marking of truckg<br />
726<br />
3,<br />
--_- I t--il<br />
1 1 r l-r l-.|J<br />
I --l--T - I fl-I: t-r<br />
r---Ln I Lr'J<br />
15.<br />
{ { {<br />
l t t<br />
---l-----T\J"<br />
I<br />
L . i4.--J Lrg
<strong>SECTION</strong> 4. TECHNICAL SESSIONS<br />
L/cd m-?<br />
Flgure 5. Lumlnances L lor optlmal slde marklng of<br />
trucks<br />
The worst markings are 10, ll, 12, 13, 14, the<br />
markings with dots and triangles,<br />
Rear Markings of Trucks<br />
ln the same test-setup the 15 different rear markings<br />
as shown in Figure 6 and. 7 (annex) were tested.<br />
nl<br />
L--*iJ'i<br />
r]<br />
t t<br />
l t<br />
Ir- Jl<br />
LJ---11<br />
i4<br />
L<br />
l l<br />
i l<br />
t t<br />
r==Tl<br />
=-J<br />
7.<br />
rI. '+ 1<br />
;<br />
Figure 6. Rear marking of trucks<br />
'l<br />
i<br />
ri<br />
I<br />
r:<br />
l l<br />
l ' l<br />
l-,,.^l<br />
L_n_l<br />
;-<br />
I:<br />
l<br />
,r--l:<br />
l i , i<br />
l i '<br />
t l ,<br />
l///R\\l ,l<br />
i-f-Li',<br />
L - -<br />
10.<br />
Figure 7. Hear marking of trucks<br />
The results for the rating experiment are shown in<br />
Figure I were again the optimal luminances L for the<br />
15 different rear markings are plotted. The optimal<br />
markings are<br />
marking l: (Fieure 6)<br />
marking l2; (Figure 7)<br />
marking 14: (Figure 7)<br />
The worst case is marking 3, the marking with dots.<br />
0,5 10 2D 5D 10 20 17.6 _-z<br />
Flgure L Lumlnances L tor optimal rear marking of<br />
truck8<br />
727
Flgure 9. Rear slde ol a truck with a conture-marklng<br />
with passive materlals<br />
EXPERIMENTAL SAFETY VEHICLES<br />
Optlmal Marking of Trucks<br />
Out of the down scaled experiments one optimal<br />
marking is for example the conture-marking as shown<br />
in<br />
Figure 4: marking 7<br />
Figure 6: marking l.<br />
Improvement of Side Visibility for SafetyWhile<br />
Turning<br />
Seiichi Saitoh,<br />
Akitsugu Hirose,<br />
Nobuo Shirai,<br />
Isuzu Motors Limited,<br />
Japan<br />
Abstract<br />
In Japan, fatal accidents in which persons are<br />
sometirnes caught in heavy-duty trucks when the<br />
trucks turn left bccame a big social problem starting<br />
around 1976. (In Japan, the driver's $eat is usually on<br />
the right hand side.) The analysis result of the<br />
accidents showed that it will be effective in reducing<br />
the accidents to improve the visibility to the left and<br />
to prevent persons from being caught under truck rear<br />
wheel. To remedy the situation, the introduction of<br />
regulatiorrs were considered which require the improvement<br />
of "indirect" visibility (visibility through<br />
mirrors), betterment of the pedestrian protection side<br />
guard, addition of the direction indicator larnp at the<br />
middle of the vehicle siden etc.. On the other hand,<br />
each truck manufacturer newly in$talled an auxiliary<br />
side window in the left door and enlarged the front<br />
windshield, thus improving visibility, especially to the<br />
left. This report describes the introduction results of<br />
auxiliary side window and enlarged front windshield.<br />
Thanks to the effects of these revisions. combined<br />
728<br />
A rear side of a truck with this kind of marking is<br />
plotted in Figure 9.<br />
with those of regulations and others, the number of<br />
the fatal accidents is now approximately half of that<br />
for 1976.<br />
<strong>Int</strong>roduction<br />
In Japan, fatal accidents in which persons are<br />
caught in heavy-duty trucks when the trucks turn left<br />
became a big social problem starting around 1976.<br />
In those days, the number of such accidents was<br />
not large. But the other party in the accident, such as<br />
pedestrians, bicycles and nrotor bicycles, was in a<br />
disadvantaged position. Also, in many cases, death<br />
accidents were tragic, such as persons being run over<br />
and killed. Therefore, they probably aftracted public<br />
attention.<br />
As remote causes of the accident, heavy-duty trucks<br />
run in the city, creating the traffic situation where<br />
they are mixed with pedestrians, bicycles, motor<br />
bicycles and other vehicles at intersections. In addition,<br />
many intersections are narrow, and as a result,<br />
the difference in turning radius between the front left<br />
wheel and the rear left wheel becomes large, that is,<br />
the rear left wheel turns sharper tharr the other party<br />
thinks, in left turn (Fig. 1).<br />
ln this paper, the authors report the history of the<br />
revision made to solve the problem, taking the case of<br />
the Isuzu vehicle as an example. The 1978 and 1986
F*lfg=*-1---.-i-;-,<br />
-<br />
model year Isuzu vehicles are shown for reference in<br />
Fig. 2.<br />
Additionally, in Japan, the driver's $eat is usually<br />
on the right hand side, therefore, left turn means to<br />
turn to the opposite side of the driver, Most of the<br />
heavy-duty trucks used in Japan are the cab over the<br />
engine type.<br />
lil<br />
<strong>SECTION</strong> 4. TECHNICAL SESSIONS<br />
At Yokohana<br />
Ciry<br />
At Kanas&ki<br />
City<br />
Flgure 1. Typlcal clty intersectlon in Japan, heavy'<br />
duty-truck mixed wlth pedestrient and bicycle<br />
on a pedestrian crossing<br />
l97E t'bdet<br />
1985 !,lodel<br />
Flgure 2. 1978 and 1986 model year lsueu vehicles<br />
rm-on1 g; -f_a:;<br />
,*nn" r,rn,,, ,or, | . I ,^on, nnEEL, RIflt<br />
- _ j'Ery;lry:h_ -. jd',**,*'^"* "*<br />
XIDDTB MD LEN 6? CASES<br />
f r.'<br />
RIAR HI'[LI I,EFT<br />
?6 iltrs tO:l!<br />
I LEFT SIDE<br />
99II | : lo casrs<br />
a : l0 c^srs<br />
hilT ND LEtr<br />
I C^SIS .r.<br />
Flgure 3. Colllslon portions of the heavy-duty trucke<br />
causlng eignificant left-turn accidents<br />
Analysis of Accidents<br />
Typical significant accideuts in l9?8 by heavy-duty<br />
trucks (partially including buses) at left turn were<br />
analyzed in order to study counter-measures(l). Out<br />
of the total 2902 cases of accidents, 355 cases were<br />
analyzed. Shown below is the summary of the analysis<br />
results. (The significant accidents means both fatal<br />
and serious accidents.)<br />
t) As shown in Fig. 3, collision was mostly with<br />
the left side of the truck. Especially, the<br />
front and left portion accounts for 7490.<br />
2l As shown in Fig. 4, 83Vo of the truck drivers<br />
who caused significant accidents did not<br />
recognize the other party of the accident.<br />
3) As shown in Fig. 5, collisions with the<br />
$is:ycle and the motor bicycle are many,<br />
accountirtg for 8890.<br />
Figure 4. Recognition of the other party of the eccl'<br />
dent at the time of slgnlficant left'turn accldents<br />
by heavy-dutY trucks<br />
729
Figure 5. Classifications of the other party that collided<br />
wlth a teft turn heavy-driry riuck<br />
)"'i""t_<br />
LEFT<br />
5%<br />
26.4 n<br />
n)<br />
<strong>SECTION</strong> 4. TECHNICAL SESSIONS<br />
BEFORE REVISION AFTER RIVISION<br />
TIONAL l|IiNDOI|l<br />
(l,vrND TYPE)<br />
33. I in.<br />
(84Omn)<br />
Flgure L Comparlson of the cab before and after revision<br />
Z\ <strong>Int</strong>rcduction of the three mirror system<br />
ln order to meet the revised regulation, the<br />
side-under-view-mirror as shown in Figure l0<br />
was installed. At the same time, the sideview-mirror<br />
and the under-view-mirror were<br />
enlarged.<br />
Others<br />
Besides the measures to improve the visibility to the<br />
left, the following two revisions were made to meet<br />
the requirement of the regulations, thus lessening the<br />
extent of injuries and reducing accidents. They are<br />
introduced here because they are closely connected<br />
with the main subject.<br />
l) Improvement of the pedestrian protecilon<br />
side guard (Article I8-2, Japanese Safery<br />
Regulations for Roud Vehicles)<br />
The side guard was changed to a larger one<br />
with protective ability improved to reduce<br />
the extent of injuries due to running over by<br />
the rear wheel (Fig. I l).<br />
2) New installation oJ the mid direction indicator<br />
lamp. (Article 41, Japanese Sdety Regu'<br />
lations for Road Vehicles)<br />
XILIARY<br />
(37s.1 sq. in.<br />
NEW WINDOW<br />
In order to securely transmit the intention of<br />
left turn to the two-wheeled vehicle running<br />
by the side of the truck, a direction indicator<br />
lamp was added at the middle of the vchicle<br />
body side (Fig. l2).<br />
Ttt ttnlr up to rhlch tht drlvor crn confln b), thd rlrror | 59.1 ln' (lr)<br />
hrtlht r ll.8 ln. (0,3)r dignclqr polq plNcod on tho urqutrd (thofln I'y thd<br />
shs.loJ portlon beloi) Hsr iDcrduroJ {a bcloe.<br />
f,l'<br />
{f<br />
I;ORWARII<br />
A I<br />
I<br />
Haavy rluty<br />
t ruck<br />
1 .t*<br />
1 .oft.<br />
(0'.ln)<br />
, i''\,<br />
9, 8ft .<br />
( 3n)<br />
NIiW REi;ULA] II]N<br />
,\N\<br />
I{<br />
i 6.6ft,<br />
I f2)r)<br />
_.1_<br />
E.P<br />
, ,,,,,1\<br />
\' ',; ''"\\<br />
\,.\,,<br />
\,"''',<br />
\i ' \<br />
'' \'\.\ \<br />
Revised in<br />
I'larch, 1979<br />
Figure 9. Contents of the amendment of Japanese<br />
Safety Regulations for Foad Vehicles (Article<br />
44) "Flear-View-Mirror, etc."<br />
+<br />
FORWARD<br />
,t,<br />
I<br />
Heavy duty<br />
truck<br />
731
BEFORE REVISION AFTER REVISION<br />
Under-view-rltffgl Sidc-view-rnirror<br />
,0<br />
EXPERIMENTAL SAFETY VEHICLES<br />
Flgure 10. Comparison of the mlrror belore and after revision<br />
Under-view-mirror ^. .<br />
- 5lde-Vlew-mlfTof<br />
\- rsurreirLdr r ,--rl4::l-<br />
OLD REGIJI,ATIQIL NEW RTiOULATION<br />
Revised in<br />
March, lg79<br />
Figure 11. Contents ol the amendment of Japanese Safety Regulations for Road Vehicles<br />
"Pedestrian Protection Side Guard, etc."<br />
Front direction<br />
rl<br />
Revised in<br />
March, 1979<br />
Rear direction<br />
indicator I<br />
Conventional<br />
Figure 12. Contents of the amendment of Japanese Safety Regulations for Road Vehicles (Article 41) "Direction<br />
Indicator Lamp"<br />
732<br />
18.2)
<strong>SECTION</strong> 4. TECHNICAL SESSIONS<br />
BEFORE REVISION AFTER REVISION<br />
I ott.<br />
(Orn)<br />
r6.4ft.<br />
[5n)<br />
Figure 13. Dlrect Vlsibility diagram before and revtslon<br />
Effects of Visibility Improvement<br />
Improvement 0f static visibility<br />
The addition of an auxiliary side window showed a<br />
great effect of improving direct visibility (Fig. l3).<br />
Thanks to this window, when a human being came<br />
near the left side of the vehicle, it became possible to<br />
recognize him or her at a distance of approx. 3.3ft<br />
(lm) or morc from the vehicle. Also, for the human<br />
being approaching diagonally in front, the recognizable<br />
distance was reduced to approx. 6.6ft (2m) or<br />
more. (Before improvement, this distance was approx.<br />
6.4ft (5m) or more and approx. 9.8ft (3m) or more,<br />
respectively.)<br />
Indirect visibility approximately doubled (Fig. l4).<br />
Especially, the visibility to the front and left of the<br />
vehicle was increased very much by the new addition<br />
of the side-under-view-mirror.<br />
Effect of preventing accidents<br />
Actual accidents were assumed and the effect of<br />
preventing accidents was confirmed. Fig. 15 shows<br />
example patterns lbr 4 seconds before collision with<br />
the pedestrian, hicycle and motor bicycle. Fig. l6<br />
shows the relative location of the pedestrian, bicycle<br />
I<br />
Heav<br />
truck<br />
*\\N<br />
-16.Sft.<br />
[-5ttt)<br />
-i-- r On'the ground<br />
*: At a height of 39.4 in<br />
-: Easily visible, drivcr<br />
(lleight: 39.4 in. (lnl<br />
and motor bicycle rewritten on the visibility diagram<br />
with the truck placed in a fixed locafion.<br />
From this, the following things are known, and it<br />
could be said that a series of countermeasures have<br />
large effects of preventing accidents (Fig. l7).<br />
'<br />
I<br />
I<br />
{}'=:j<br />
Auxiliary side<br />
6ft.<br />
window<br />
'\\*-+<br />
NI Heavyr<br />
truck'r<br />
Oft.<br />
(Onr)<br />
(lrn) above the ground<br />
slightly bent forward<br />
above the ground)<br />
1) Chances of catching higher quality visual<br />
information by direct view increased,<br />
2) The time of double visual confirmation by<br />
both direct and indirect view increased.<br />
3) The time of visual confirmation only by the<br />
under-view-mirror (spherical) decreased.<br />
4l The time of complete invisibility decreased<br />
almost to zero,<br />
Effects of the Countermeflsures Seen<br />
From the Statistics of Traffic<br />
Accidents<br />
Fig. t8 shows the change in the number of fatal<br />
traffic accidents. Although total fatal accidents level<br />
off through the entire investigation period, the number<br />
of left-furn fatal accidents has been reduced in<br />
recent years to approx. half of that for 1976. Like<br />
this, the series of countermeasures have been found<br />
733
BEFORE REVISION<br />
r*.,r-F.-l ro. +rl.<br />
| oft.<br />
[5m] | rn-r<br />
Unde -vlew-nlrror<br />
EXPERIMENTAL SAFETY VEHICLES<br />
NHeavyl<br />
truck {<br />
t6.4fr.<br />
(5n)<br />
Figure 14, Indirect Vislblllty dlagram belore and after revlsion<br />
T<br />
I t<br />
7'l*<br />
_Pedestrian causht in a I<br />
heavy truck on-the pedesJ<br />
I I train cr-ossing<br />
Pedestrian<br />
' F- h Side<br />
AFTERREVI S ION<br />
| 16.4ft.<br />
- --a"<br />
Oft.<br />
(0nl<br />
t.--<br />
, T- _<br />
i \<br />
t<br />
l6.4ft.<br />
(5n)<br />
t. Oft.<br />
t<br />
I (on) (om)<br />
Side-view-<br />
Ont<br />
: At a height<br />
the ground<br />
Numerals show the time before corlision in seconrr<br />
Flgure 15. Typlcal patterns of collision wlth the left- turn heavy-duty truck<br />
734<br />
,..,<br />
l.i<br />
NHeavy"<br />
of 39.4 in. (IrnJ above<br />
I<br />
2<br />
J<br />
4<br />
I!fi5to<br />
Collision<br />
with the<br />
motor bicycle<br />
start<br />
ing simultaneous<br />
1y'<br />
with the<br />
truck
CASE 1<br />
Pedestrian<br />
-"-Et<br />
\ l<br />
\l<br />
\<br />
t<br />
-\,<br />
<strong>SECTION</strong> 4. TECHNICAL SESSIONS<br />
BEFORE REVISION -t AFTER REVISION<br />
CASE 2 CASE I CASE 2<br />
Bi cycl e<br />
Motor bicycle<br />
truck truck<br />
i CASE 3<br />
,lutotor bicycle<br />
Figure 16. Movement of the other party of the left-turn eccident when viewed from the heavy'duty truck<br />
very effective in reducing left-turn fatal accidents<br />
although the effecfs are combined with those of the<br />
improved road envirortments, tightened regulations<br />
and other efforts by the government and with those of<br />
the education of the person$ ranging from children to<br />
heavy-duty truck driver$ by the police.<br />
cAsE l<br />
trran<br />
The follesin8 shqvs Figure 16 expressed in tems of tiF<br />
Bafora<br />
t""itton<br />
revl sroh<br />
Baforc<br />
CASE<br />
r6'iston<br />
?<br />
Iti cyc lc<br />
revl slon<br />
Bcfore<br />
tc""on<br />
cAsE J<br />
i6tor<br />
,.. . Attcr<br />
.<br />
ElsFsed ti0e [sec,)<br />
0 l z t<br />
D : Rcco8nlzcd only by direct vieu<br />
I l Rcco8nized only by lndLrec( vleH<br />
N : Not seen at all<br />
D/I : Reco8nized by both direct and indirlct vis<br />
(U/H) : Reco8nized by indircct view thtough under-vie{-nirrcr<br />
Flgure 17. Comparlson of ease ol dlscovering the<br />
other party ol the accldent before and after<br />
revision<br />
In this paper, report has been made of the improvement<br />
of the visibility to the left in the case of Isuzu<br />
Motors. But similar mea$ures have been taken also by<br />
each of the other manufacturers of heavy-duty trucks.<br />
Conclusion<br />
Addition of an auxiliary window in the Ieft hand<br />
door, enlatgement of the front windshield and use of<br />
the three mirror system were reported as means to<br />
improve visibility. lt is considered that these are the<br />
measures near to ideal at the current level of technology.<br />
However, no matter what improvement is made<br />
3 '-'<br />
fotil fatsl accid€nts<br />
L€ft-turn fstal<br />
El E? 83 84 85<br />
(sourco: Trrfflc Strtlcticc [2])<br />
Figure 18. Change in total accidents and left-turn fatal<br />
accidents<br />
735
in visibility, it will be meaningless unless drivers take<br />
care ald confirm safety.<br />
From this point, studies are under way on the<br />
installation of the system on the vehicle which will<br />
warn driver$ when there are persons around the truck.<br />
However, as it is difficult to disringuish between fixed<br />
objects on the road and persons, this system has not<br />
yet been put into practical use. The authors hope that<br />
electronics will make great progress and that it will be<br />
applied to realize such a system in the future.<br />
EXPERIMENTAL SAFETY VEHICLES<br />
References<br />
Analysis of Heavy-Freight vehicle and rank-Truck Accidents<br />
736<br />
l.<br />
2.<br />
Traffic Safety Measures Committee of Japan<br />
Automobile Manufacturers Association, INC.<br />
"Report of Actual Conditions and Analysis of the<br />
Accidents by Heavy-Duty Vehicles in Turning<br />
Left and Right" (1980)<br />
Traffic Bureau, National Police Agency, Japan<br />
"Traffic Statistics" (1976-1985) Japan Traffic<br />
Safety Association<br />
Werner Stedtnitz,<br />
Herman Appel,<br />
Institut fi.ir Fahrzeugtechnik,<br />
Technische Universitiit Berlin,<br />
Federal Republic of Germany<br />
Ahstract<br />
It is intended to analyse heavy-freight vehicle acci_<br />
dents paying special consideration to tank-truck acci_<br />
dents with the help of the DAIMLER-BENZ driving<br />
simulator in Berlin. After the interpretation of acci_<br />
dent statistics the characteristics of freight- and tank_<br />
vehicle accidents were formulated by ,,characteristic<br />
accident patterns". On the basis of these patterns real<br />
accidents could be evaluated and some typical acci_<br />
dents (single-vehicle-accident, frontal- and front/rear_<br />
collision) were chosen for our intended profound<br />
simulator analysis.<br />
A comparison between tank-truck and heavy_freight<br />
vehicle accidents shows a 50go higher participation of<br />
tank-trucks in front,/rear collisions on motorways as<br />
well as in single-vehicle accidents and in fiontal<br />
collisions on the highways (..Bundesstra0e,<br />
LandstraBe"). It is assumed that ,,liquid have hitherto been scarcely considered as a factor<br />
possibly causing road accidents. The objective of this<br />
study was to investigate commercial-vehicle accidents<br />
with special attention directed to shifting loads, and<br />
with the aid of calculated and experimental real-time<br />
simulation in the Daimler-Benz driving simulator. The<br />
resulting analysis performed here is part of the project<br />
BASIS [German acronym for<br />
sloshing"<br />
could be one of the causal factors of such tank_truck<br />
accidents. The interaction between liquid sloshing and<br />
the accident characteristics of tank-trucks shall be<br />
investigated with the help of the driving simulator. A<br />
real-time analysis of liquid sloshing demands a simple,<br />
yet precise mathematical description. A mechanical<br />
model (pendulum-analogy and spring-mass system) tbr<br />
the simulation of combined transversal and longitudi_<br />
nal liquid sloshing of tank trucks is prqpessd; and the<br />
equations of motion are presented.<br />
<strong>Int</strong>roduction<br />
In the analysis of accidents involving commercial<br />
vehicles, the effects producecl by shifting cargo such<br />
as that encountered in partially loaded tank trucks<br />
,,Evaluation of Active<br />
Safety Devices in Simulator Work"l sponsored by the<br />
German Ministry for Research and Technology<br />
(BMFT).<br />
Hypothesis: "Liquid Sloshing" as a<br />
Possible Cause of Accidents<br />
The point of departure for this analysis was the<br />
question as to whether shifting cargo-parricularly,<br />
sloshing liquid loads-in commercial vehicles could<br />
influcnce the dynamic road behaviour in such vehicles<br />
(specifically, tank trucks) to such an exrenl as to<br />
represent a cau$e of road accidents.<br />
An analysis of accident $tatistics concerning tank<br />
trucks reveals that such vehicles are, in relative terms,<br />
50Vo more frequently involved in road acciclents than<br />
other commercial vehicles. Such increased participa_<br />
tion in accidents has been observed for tail,end<br />
accidents on German freeways (Autobahn), as well as<br />
for single-vehicle accidents and head-on collisions on<br />
national highways and rural roacls in Germany. This<br />
phenomenon is emphasized in f'rgs. I and i as a<br />
"conspicuous<br />
difference" in the statistics. Assessment<br />
of such statistics witl of course point out characteris_<br />
tics particular to tank-truck accidents; however, it<br />
does not suffice to allow conclusions to be drawn with<br />
respect to the influence exerted by the load. Conse_<br />
quently, statements of various authors will, to begin,<br />
be cited below in initial support of the hypothesis<br />
stated above.<br />
Bauer[Z] investigated the effects of shifting fluids<br />
on the structural and flight stability of rockets, and
later broadened his studies to cover tank trucks. With<br />
respect to semitrailer tank trucks, he reported as<br />
follows: "A liquid loading may lead to considerable<br />
handling difficulties if a free liquid surface exists,<br />
sloshing about its fundamental natural frequency,<br />
thus creating forces and moments acting on the<br />
vehicle, which may easily exhibit a multiple of the<br />
inertia force detennined for the same mass if it were<br />
considered rigid and fixed to the container."[2, Part<br />
I, p. 451. In their analyses of tank-truck accidents in<br />
Australia, Griffiths et al. reported the following:<br />
"Among the factors that lead to tanker rollover are<br />
their hieh center of gravity (c.g.), 'soft' roll stiffness,<br />
and sloshing of the liquid load"[3], p.21.<br />
Erwin et al[.4] investigated the threshold value for<br />
the lateral acceleration beginning at which vehicle<br />
rollover can be expected. Fis. 3 throws light on the<br />
association between rollover threshold and the percentage<br />
frequency of single-vehicle rollover accidents.<br />
Investigation here was made of the three-axle<br />
tractor/two-axle semitrailer in fully loaded condition:<br />
i.e., without possibility of the shifting of liquid loads.<br />
The graphical representation is based on evaluation of<br />
<strong>SECTION</strong> 4. TECHNICAL SESSIONS<br />
records from the USA Bureau of Motor Carrier<br />
Safety (BMCS), in combination with a dynamic<br />
vehicle-behavior model which was used to help determine<br />
the rollover threshold.<br />
The percentage share of rollovers in single-vehicle<br />
accidents demonstrates a direct relationship to the<br />
rollover threshold, as the nonlinear plot in Fig. 3<br />
makes clear. According to the opinion of the authors<br />
involved here, the threshold value is primarily dependent<br />
on the height of the center of gravity.<br />
Even though partially loaded vehicles were not<br />
considered in this investigation, it is nevertheless<br />
obvious that a progressive, percentual rise in the<br />
probability of a rollover in a single-vehicle accident<br />
occurs together with a decrease in the rollover threshold.<br />
A low rollover threshold, furthermore, is occasioned<br />
not only by a high center of gravity-but also<br />
as a result of dynamic fluid tbrces.<br />
In investigations carried out by Strandbergf5], attention<br />
was called to experiments conducted by<br />
Abramson et al[6], in pointing out the distinct possibility<br />
that fluid forces in the case of resonance can<br />
rise to values seven times as great a$ those observed<br />
100<br />
Sinqle<br />
- vehirlp<br />
d((ident<br />
[i<br />
Vt t;,fr,<br />
lnf ef Se( tron<br />
Heod-on collisron<br />
ac(rdenf<br />
1C<br />
ll<br />
1Ww<br />
0 10(<br />
10010c<br />
IT<br />
t,' l'':.<br />
1,. l:i<br />
t-..:<br />
t::.<br />
4Vt<br />
l'::, i.: '1"{/, t.::,<br />
l:.:.<br />
1 ... 'lw 1',., '.<br />
t<br />
l':,"<br />
l.'<br />
'lw<br />
IW:<br />
1 -<br />
t'.<br />
[:::i<br />
lrrl<br />
l> l; l><br />
t- :t t: rl r:<br />
lh<br />
li<br />
l:.<br />
l....,<br />
fr W; d:i<br />
V,t lt.,. t IW<br />
l....r<br />
l. i.;tW<br />
l=<br />
W 1,,,.,<br />
l:i:;<br />
l:r:l'<br />
Nofr0nqt hrghwoys ftg19l roods Iouniy roods<br />
rfl 7A<br />
[':':f tomme rci o I vehi c les ( CV) f7j xozt dous' ror go vEhic les<br />
[l;;l W (HVl<br />
E xo n p_&_l_q1_E_q_d1n g_g Pd ph5, I 47o of o ll h 6zdrd o us - carg 0<br />
occidenis on noti0nol hiqhways toke ploce os sinqle-vehicle<br />
dcci denis.<br />
0otd evdluofion by TUV ttazardous-Corgo Accident Anolysi5 /1/<br />
-n<br />
rtt<br />
t4HilluOlrcHRrx<br />
Conspictrous dtfferences between<br />
pdrtitipoiion of hozdrdous-corgo<br />
ond conmeccroI vehicles in trqffit<br />
drridents, with typeE of sfreets os<br />
refefence f0cidr<br />
Fig. 2<br />
Sted tn t tz<br />
737
when the liquid load cannot shift inside its container.<br />
The following findings were established concerning<br />
the overturn risk of a tank truck from the model<br />
experiments conducted by Norstrcim et al[7, p. 69];<br />
"With<br />
5090 load volume it was found that the<br />
increase in overturning risk compared to rigid load<br />
could be up to rromewhat more than two times, both<br />
in harmonic oscillations at frequencies low enough to<br />
occur in normal driving and in the doublelane change<br />
maneuver,"<br />
Until now, howwer, such influences on the dynamic<br />
vehicle behavior of tank trucks could not be<br />
proved in road tests. The difficulties inherent here<br />
were reported by TOPAS in the following[8, p. 168]:<br />
"Contrary<br />
to all expectations, sloshirrg liquid loads in<br />
half-filled containers exhibit only moderatc eff'ects; in<br />
any case, the measured angles of roll fell below those<br />
values observed for the fully loaded vehicle. In a<br />
subjective sense, even the slightest movements of the<br />
liquid load-for example, the sensation detected by<br />
humans when the vehicle is at rest-can readily be<br />
detected. The effective consequence for the behavior<br />
of the moving vehicle is, however, relatively slight."<br />
The dynamic vehicle measurements serving as the<br />
basis for this conclusion do not, however, sufficc to<br />
E<br />
t<br />
@u<br />
frf,<br />
a<br />
- t<br />
,1fl<br />
GA<br />
O<br />
o<br />
E<br />
uE<br />
tl<br />
aro 0.s Ls! 0.a<br />
FOLLOVER THRESFBLD (C'S)<br />
ralt<br />
rtt<br />
,qrrucncitrr<br />
738<br />
tlLltroIStIt lttlttt totrLoYtl<br />
ttlt3EoLD rtD tollovtl tccIDIII'<br />
rtvotsttttr {tlsfD or rxcs<br />
TCCIDIIT DIIA IOI Tf,I YEITS<br />
\t73-rrt /rl<br />
EXPERIMENTAL SAFETY VEHICLES<br />
Ef.vlt{ EI' AL -<br />
Fl-s - 3<br />
allow an evaluation of the influence of vehicle loading<br />
on the behavior of such cargo vehicles in accidents.<br />
This question can be elucidated only by sufficient<br />
analysis of the entire control system complex represented<br />
by the driver, his vehicle, and the accident-site<br />
circumstances.<br />
Accident analysis of heavy-freight vehicles and tank<br />
trucks in a closed control system is carried out with<br />
the aid ot the Daimler-Benz driving simulator[9,10],<br />
in conjunction with the Institute of Automotive Engineering<br />
at the Technical University of Berlin.<br />
In a parallel test procedure, typical and "characteristic"<br />
heavy-freight-vehicle and tank-truck accidents<br />
are-on the one hand-selected and recreated in the<br />
driving simulator by a large number of test drivers,<br />
with testing in this case performed serially. In the<br />
parallel procedure, on the other hand, the drivingsimulation<br />
model is modified to recreate the movement<br />
of liquids inside tank trucks.<br />
Characteristic Accidents<br />
Only the analysis ol representative accidents can<br />
lend hope for the reduction of future traffic acciclents<br />
on a broad basis. For this reason, it is necessary to<br />
select truly "characteri$tic<br />
accidents" for purposes of<br />
accident research on a driving simulator.<br />
**Characteristic<br />
accidents" are considered to be<br />
those accident$ for which the parameters describing<br />
the accident (e.g., type of collision, type of vehicle,<br />
collision velocity, etc.) represent, in their combination,<br />
percentually salient phenomena observed in accident<br />
statistics.<br />
Fig. 4 depicts the parallel procedure for the determination<br />
of such characteristic accidents.<br />
"Characteristic<br />
accident patterns" result from the<br />
study of road accident statistics in which salient. or<br />
predominating, patterns can be brought to emerge (see<br />
FfC. 5). With the aid of these patterns, actual accidents<br />
can be assessed with regard to their respective<br />
characteristics.<br />
From a comparison of the accident patterns with<br />
actual accidents, finally, characteristic accidents were<br />
able to be ascertained-from which three typical<br />
examples were chosen for further treatment on the<br />
driving simulator. These examples were as follows: a<br />
head-on collision of a tank truck with a pa$senger car<br />
on a national highway, a single-vehicle accident in<br />
which a tractor-trailer unit loaded with hanging loads<br />
of meat turns over while negotiating a curve, and a<br />
tail-end collision of a tank tractor-trailer unit which<br />
runs into a construction-site vehicle on the freeway.<br />
For purposes of simulating the surroundings, lhe<br />
accident sites were recorded by video mcan$ and were<br />
photographed. With the aid of road plans, the course<br />
of the roadway is presently being reconstructed on the<br />
driving simulator in the form of a digital video
Evcluaiion of<br />
orcrdent records<br />
IDEKRA, TUB/HHH, BAST)<br />
Desrription of occidenl<br />
chorocterrsiics<br />
-n<br />
rl,<br />
Selection of orti.dentg<br />
Evaluoiion of<br />
oqcident slslistics<br />
Formuts,tion of<br />
"<br />
chorac lerisfrc<br />
occideni potterns"<br />
Assrgnrnenl of fhe individual<br />
occrdenfs to the corresponding<br />
chcraclerislic occidenl potierns<br />
Chorocteristic accidenls<br />
5e{ection of suitobie orrrdents<br />
. Heod-on collisions: tqnk truck / csr<br />
r Sinqte*veh. oE(-r troctor - trailer<br />
. Toil -end occ., tonk lruck<br />
Type of occidenl:<br />
Type of vehiqle:<br />
Approved totot veighfr<br />
Type of rood:<br />
Road rondilionr;<br />
Aqe of drivers;<br />
Couse of acqideni;<br />
Directiorr of impocl:<br />
Poini of impoctr<br />
Vehicle<br />
hif:<br />
Speed of collisionr<br />
.af<br />
Addlyrrt of Cofifr{r(rsl'vrhr(lr /<br />
ldnt - frvEk A
With the exception of one model based on potential<br />
theory (the vehiclc simulation system TDVS, plus the<br />
computer program SLOSH devised for liquids[13])'<br />
there has been until now no other spatial liquidsimulation<br />
program conceived for freight vehicles.<br />
In the following, a spatial and mechanical model is<br />
described which utilizes insights gained from aeronautics<br />
and astronautics in arriving at the most suitable<br />
approach for arrival at a model for the respective<br />
truck-tank geometry in the direction of excitation' In<br />
this approach, movements of the liquid in longitudinal<br />
and lateral directions are initially considered separately.<br />
They are later superimposed.<br />
The Pendulum Model for Tran$versal<br />
Oscillations<br />
For transversal liquid oscillations in containers with<br />
rounded tank walls, the pendulum analogy has proved<br />
to be the most effective, as can be confirmed from the<br />
studies conducted by Sumner[4,l5,andl6], one of the<br />
pioneers in work with the "Pendulum Analogy." His<br />
work, in addition to elaborations subsequently made<br />
thereon by Sayar[l7] with regard to nonlinear oscillations,<br />
form the basis for the model described here'<br />
Although Sayar and Sumner conducted their investi-<br />
(*-*€) o<br />
-E<br />
rtt<br />
PLUTD FREQT'THCY PIR.II{ETER<br />
SPE.ERICAI. TII{T,<br />
IATER.IT EXITITIOI{.<br />
HC CTRTI TfiD STEPEENS /19/<br />
EXPERIMENTAL SAFETY VEHICLES<br />
Fiq. 6<br />
gations on spherically shaped tanks, application of<br />
their findings to tank geometries featuring circular<br />
cross-sections is permissible, since the oscillatory behavior<br />
with typical tank-truck forms is sufficiently<br />
extensively similar to that of their containers. This<br />
fact has been additionally confirmed by analytical<br />
tests conducted by Budianski[18], as well as in model<br />
experiments performed by McCarty and Stephens<br />
[[l9]. See Figs. 6 and 7.<br />
The natural frequencies of the liquid, which represent<br />
a characteristic value for the description of liquid<br />
motion, demonstrate a maximum deviation from each<br />
other of approximately l09o for a tank filling ratio of<br />
h/d:0.8 (whereby h:the filline heieht and d=the<br />
tank diameter).<br />
The model for transversal liquid motion consists of<br />
the fixed mass-designated by mo, with a moment of<br />
inertia l6-which does not take part in the liquid<br />
movement, the mathematical pendulum with the mass<br />
m, which represents the fundamental oscillation, a<br />
damping element with the damping factor K, and a<br />
spring with the nonlinear characteristic C for simulation<br />
of nonlinear factors which arise from the curvature<br />
effect (a force of restoration arising, in turn,<br />
from the curvature of the tank). See Sayar[I7].<br />
("'*#)<br />
al,<br />
h/ 2R<br />
ftrh \il<br />
o 275 t3<br />
o +aE t5<br />
O 3 l ?<br />
d 6 a 4<br />
-nrq, Ft t<br />
llc Cartl' rnd StdphEns<br />
FLUID ERBQI'E{CY P.I.RTfiETER<br />
EORIZOHTII CIRCIIITI*<br />
CYITII{DER.<br />
LATERIIJ EXITATIOH /19l
Fis. I defines the variables for the mathematical<br />
formulation of the pendulum analogy for the general<br />
case. The dimensions are explained as follows:<br />
ho<br />
cg<br />
C<br />
A<br />
1""<br />
= distance from center of tank to fixed mass<br />
= center of gravity<br />
= gcometric center of the tank<br />
: hinge point<br />
= distance from the center of the tank to center of<br />
gravity<br />
q = vehicle center of rotation<br />
lo,o = distance from hinge point of pendulum arm to<br />
vehicle center of rotation<br />
lp = distancc from center of tank to hinge point of<br />
pendulun'r arm<br />
Lp = length of pendulum arm<br />
angle from vertical through which pendulum<br />
oscillates<br />
g = angular rotation about q<br />
h = liquid deprh<br />
mo = fixed mass (i.e., non-sloshing)<br />
Io : mom€nt of inertia of fixed,mass (non-sloshing<br />
mass)<br />
Fig. 9 depicts the external and effective forces as<br />
they act on the vehicle tank and the pendulum (cf.<br />
Sayar[ 7]).<br />
The equation of motion for the pendulum results<br />
from the law of angular momentum for the accelerated<br />
reference point, as follows:<br />
dl^/dt + mr [(r;s ",ril + (ris x fJl : E t{o<br />
(Eq. l)<br />
--]1<br />
rtt<br />
axtr.rur r0rl<br />
llHttludrfcHxrf,<br />
ltdl. tn tE.H. Aw.l<br />
<strong>SECTION</strong> 4. TECHNICAL SESSIONS<br />
_v/U: it,<br />
where:<br />
L;<br />
ris<br />
E M;<br />
* the angular ffiomentum about A<br />
= vector fiom the point of pendulum susp€fl.<br />
sion to the center of gravity of the pendulum<br />
mass<br />
= sum of the moments ahout point A<br />
U : the angular momentum about A<br />
ii;, 2; = Accelerations of the point of pendulum<br />
suspension<br />
It follows that:<br />
m, Lotii * mr g Ln sin p + k toTi + ca3 Ln =<br />
mr (Lp x^ cos p - Lp 2^ sin p) (Eq. 2)<br />
With sin I E I<br />
- pt/6 and 4 = l/6 - c,/m,g and<br />
the degree of damping 3 = k/Zmt on it follows that<br />
the equation of motion of the pendulum is as follows:<br />
,ii + liluoc t ,o'(e - ,tp\ : l/Lp (iia cos p<br />
- io sin er) (Eq. 3)<br />
In order to determine the forces from the liquid<br />
which act onto the tank, the sum of the external and<br />
the effective forces is found according to D'Alembert's<br />
Principle. See Fig. g.<br />
The following applies to the tank container:<br />
E horizontal forces (external minus effective) : 6<br />
- ctr3 cosp - F, - Tsin,p - kLpgco$(p +<br />
mo jb : 0 1Eq. 4)<br />
SI}IEHATII DIAERAM OF A HORIZONTAL tIRtULAN TVTITNNICIr<br />
CONTAINER PARTIALLY FILLEO WITII FLUIO AND ITS ANALOGOUS<br />
PENOULUM ANALOGY FOR LATTRAL LIOUIO SLOSHING<br />
Fl-tt' - a<br />
Stedlnilz<br />
741
Gr|<br />
rlt<br />
IXITITUT FOII<br />
tiHnltuotEcHxlx<br />
Prol. Or..la. H. APd<br />
mtxl<br />
mrLP,ir?<br />
Lp<br />
inrLp,i<br />
EXPERIMENTAL SAFETY VEHICLES<br />
mt it<br />
nt9<br />
The following applies to the pendulum:<br />
k L p'ir<br />
\-Y{<br />
cA3l.*<br />
EXTERNAL ANO EFFECTIVE FORCES FOR THE PENDULUM ANO THE TANK<br />
X horizontal forces (external minus effective) : 6<br />
T sin rp + k Le,i coslp + c p3 cos (P - m, LoPz<br />
sin p + m, ii, + + m, Lop cos rP : 6 (Eq' 5)<br />
If equations 4 and 5 are added, the total force as<br />
exerted on the tank is as follows:<br />
Fn = Inr iil + mo *o + mr Lr',p cos P - mr Lp<br />
i2 sinp Gq. 6)<br />
It must be pointed out here that, in the event that<br />
the vehicle is rotated about point q (see Frg. 8)' the<br />
accelerations x,, xA, and in will depend on the<br />
angular acceleration 6 (see Sumner [14 and l6])-<br />
The force Fr is the sum of the horizontal forces<br />
which are composed of the following: the forces of<br />
inertia of the masses, the horizontally acting bar force<br />
at the point of pendulum suspension (T sin .p), and<br />
the damping and spring force acting at the level of the<br />
pendulum mass. The various points at which the<br />
forces act must be taken into consideration for<br />
formulation of the moments about the center of<br />
rotation q.<br />
The approach for the vertical florce is as follows for<br />
the forces acting onto the tank:<br />
E vertical forces (external minus effective) : ff<br />
cp3sinp - Fv + kLe.|'sin.p - Tcosg * mo<br />
(zo-g)=O Gq.7)<br />
Fag-9<br />
Sled t n itz<br />
The following applies to the pendulum:<br />
E vertical forces (external minus effective) : 0<br />
Tcosg - kLo psing<br />
2,) - m, Lo iz cos ,p -<br />
Now, when equations 7<br />
following results:<br />
-cg3sin,p-mr(gm1<br />
Lorsing=6<br />
(Eq' 8)<br />
and I are added, the<br />
Fv = - mo(g - 2o) - mr (e - Z,) - m, Lorz<br />
cos .p - m, Lo
For the analysis of rectangutar tank forms, studies,<br />
in professional literature have featured only springmass<br />
simulation models, including the associated parameters.<br />
Fig. 10 shows such a spring-mass model<br />
designed in accordance with Dodge[20].<br />
The model approach for the simulation of longitudinal<br />
sloshing in tank trucks can be maintained on a<br />
simpler basis, since the motion of liquids in tank<br />
containers with straight vertical walls is considerably<br />
more linear in nature than that in containers with<br />
curved tank walls (see Dodge[ZO, p. 205]1.<br />
With this model, masses of higher order can be<br />
neglected, owing ro their relatively slight share in the<br />
forces of the liquid involved.<br />
In the model according to Fig.10, a linear damping<br />
element must additionally be provided lbr simulation<br />
of viscosity or of bafllcs installed in rhe tank.<br />
The equation ol' motion of the model represented in<br />
Fig. ,/0 corresponds to the equation for a simple<br />
spring-mass-(damper) system.<br />
Superposition of Longitudinal and Lnteral<br />
Liquid Motion<br />
The contenrs of the individual tank chambers of a<br />
tank truck are each represented here by one simulated<br />
liquid system. These sy,stems consist of a pendulum<br />
model depicting lateral motion, as well as a springma$s<br />
system to depict Iongitudinal sloshing, in accordance<br />
with the descriptions given in the two sections<br />
above.<br />
1E 5IHFLE ]ITCHAHICAL<br />
HOOEL FOF A<br />
qETTAh6ULAH TANx I Ie,<br />
<strong>SECTION</strong> 4. TECHNICAL SESSIONS<br />
Fig, 10<br />
Now, if these two models are arranged perpendicularly<br />
to each other in a coordinate system fixed with<br />
respect to the tank, and if they are fixed in the<br />
geometric center of the tank, then they provide a<br />
spatial representation of the motion of the liquid.<br />
This representation, however, does not suffice to<br />
account for the mutual interaction of lateral and<br />
longitudinal sloshing, since the motion of the two<br />
models is independent of each other. In the same<br />
manner, assumption was made for the simulation<br />
systems in the two previous sections here, that the<br />
upper surface of the liquid is plane in the direction of<br />
moverlent not described in the respective model. This<br />
factor must be sufficiently taken into account when<br />
the two models are incorporated together.<br />
For the model approach shown in Fig. 1j, the<br />
attitude of the longitudinal and lateral simulation<br />
systems was for this reason maintained variable in the<br />
plane lying perpendicular to the direction of motion<br />
described by the respective model.<br />
An example will make this clearer. When a tank<br />
truck begins to negotiate a curve, the liquid in the<br />
cargo container moves in a direction lateral to the<br />
outside of the curve, as shown at the top of Fig. II.<br />
If the vehicle then decelerares, the liquid would move<br />
Iongitudinally toward for the direction of travelwhereby<br />
the initial situation provided for the longitudinal<br />
sloshing is represenred by the laterally banked<br />
upper surface of the liquid. The longitudinal<br />
"sloshing<br />
force" would then act with lateral displacement,<br />
and no longer in the central geometrical plane<br />
of the tank. Consequently, the simulation model for<br />
the longitudinal movement must also be laterally<br />
displaced, as shown in Fig. I L<br />
Further experiments investigating the moments involved<br />
will be required to determine whether this<br />
lateral displacement of the longitudinal liquid model,<br />
as represented irr Flg. 11, should be oriented to the<br />
lateral displacement of the center of gravity of the<br />
fluid.<br />
Now, the longitudinal displacement of the center of<br />
gravity determines the longitudinal shift of the lateral<br />
liquid model, since the lateral force of the liquidowing<br />
to the longitudinal sloshing of the cargo-also<br />
no longer acts at the middle of the tank.<br />
Mutual interaction between the two models, arranged<br />
perpendicular to each other as they are, is<br />
therefore involved in the manner described here. With<br />
displacement of thc models as described above, forces<br />
of inertia should not be allowed to enter the conf.emplation<br />
of the systems in the direction of lateral<br />
displacement; rather, consideration may be taken here<br />
of only the constantly shifting points at which forces<br />
exerted by the liquid are applied.<br />
In the case of the vertical fbrce arising from the<br />
pendrrlum model (Eq. 9), it must be taken into<br />
743
account that this force was derived from the theoretical<br />
model approach for lateral liquid motion' Consequently,<br />
further experimental confirmation ol' the<br />
situation here is necessary. The point at which the<br />
vertical force is applied is not derived from superposition<br />
of the longitudinal and lateral model' For this<br />
reason, assumption should be made of the vertical<br />
force acting at the center of gravity of the liquid at<br />
rest.<br />
Model Parameters<br />
The parameters contained in the mechanical liquid<br />
model presented here can bc described both analyti'<br />
cally as well as experimentally, as Pfeiffer[2l] and<br />
Sumner[4,l5,andl6l have elaborated. As fiar as the<br />
tank geometrical forms are involved here (rectangular<br />
and spherical), all of the parameters described in the<br />
moclel are quantitatively known and can be gleaned<br />
from professional literature[14,15,16,and20]. These<br />
parameters have been made available in non'<br />
dimensional form, with the result that procedures can<br />
be applied to geometrically similar tanks of any size'<br />
PENDULUH ANALOGY FOR LATERAL TIOUID SLOSHIN6<br />
EXPERIMENTAL SAFETY VEHICLES<br />
*-l--:r*:t<br />
i suRFAcE<br />
SPRIN6-I.,IA55-ANALO6Y FOR LON6ITUOINAL LIOUIB SLOEHIN6<br />
aall<br />
rtt<br />
FAHfrIIUC'ECHHIX<br />
744<br />
l-,'-<br />
5UPERPO5ITION OF LONCITUOINAL<br />
AND LATFRAL LIOUID 5LOSHIN6<br />
-- LIOUIO<br />
5 UR FATE<br />
F ig. 11<br />
Itedtnitz<br />
Discussion<br />
The liquid-cargo simulation model depicted here<br />
represents a further development of the mechanical<br />
liquid models taken from aeronautic and astronautic<br />
engineering applications-models which were origi'<br />
nally conceived for calculation of the structural and<br />
flight stability of rockets. As a result, the question<br />
logically arises as to the validity of application of the<br />
model concept for tank vehicles.<br />
In the answering of this question, the study presented<br />
here provides closer examination of the as'<br />
sumptions used as basis for the liquid simulation and<br />
the determination of model parameter$ involved in<br />
tank-truck efforts.<br />
As has been demonstrated in the work performed<br />
here, assumption of the following is justified:<br />
. absence of friction<br />
. absence of cavitation<br />
vertical position of the upper surface of the liquid<br />
with respect to the pendulum.<br />
In accordance with investigations performed by<br />
Strandberg[S, Vol. lI, p. 86], friction forces in the<br />
liquid due to viscosity may be considered negligible in<br />
comparison to inertial effects.<br />
Cavitation-above all, at such sharp edges as encountered<br />
at baffles, when longitudinal sloshing occurs*can<br />
arise and can lead to damage in the tank'<br />
Since cavitation acts for only very brief periods,<br />
however, its effects contributing to the influence of<br />
the liquid load on dynamic vehicle behavior can be<br />
neglected[5, Vol. II, p. 88].<br />
Justification for assumption of the vertical position<br />
of the liquid surface with respect to the pendulum axis<br />
was confirmed in Sumner's model experimentsll4]. In<br />
addition, confirmation has been provided in actual<br />
driving tests with a tank truck, in which the vertical<br />
position (referenced to the liquid surface of a physical<br />
pendulum mounted in a tank chamber) was indeed<br />
observed[22].<br />
The effects of the following assumptions on the<br />
validity of the liquid model have not yet been able to<br />
be assessed;<br />
r absence of rotation of the liquid<br />
r<br />
.<br />
small excitation amplitudcs<br />
superposition of longitudinal and lateral sloshing<br />
movements.<br />
The assumption of freedom of rotation is of<br />
necessity based on the determination of parameters in<br />
accordance with potential theory. In reality, however,<br />
the liquid does in fact rotate. This phenomenon can,<br />
possibly, be compensated for by the superposition<br />
principle.<br />
The parameter values determined from the model<br />
experiments can vary according to the excitation
amplitude of the tank. Since excitation amplitudes are<br />
small in aeronautic and astronautic study, and since<br />
great amplitudes of this nature are in fact encountered<br />
in motor-vehicle engineering, it will be necessary in<br />
the future to devote particular attention to this point<br />
of discussiorr.<br />
The superposition principle proposed in this section<br />
must, in addition, be subjected to further study<br />
regarding the validity of its employment.<br />
Answers still open to the questions raised here can<br />
most effectively be provided with the aid of model<br />
experiments and actual driving tests, the planning of<br />
which has already begun.<br />
With regard to assessment of the hypothesis stared<br />
at the beginning of the paper-"Liquid Sloshing: a<br />
Possible Cause of Accidents?"-it would appear most<br />
advisable to await the results of testing perfonned on<br />
the Daimler-Benz driving sirDulator.<br />
References<br />
l. Jdger, P.; K. Haferkamp et al.:"Die Auswirkung<br />
des Sicherheitsrisikos von Lagerung und<br />
Transport gefiihrlicher Stoffe auf die Entwicklung<br />
verbesserter Transporttechnologien<br />
(StraBentransporr); Berichrsbdnde l-5; Kciln 1983<br />
2. Bauer, H.F.:"Dynamic behavior of an elastic<br />
separating wall in vehicle corrtainers";Part I ;<br />
<strong>Int</strong>. J. of Vehicle Dcsign, Vol 2, no.l, l98l;<br />
Page 44-77<br />
3. Criffiths, M.; Linklater, D.R.: "Accidents Involving<br />
Road Tankers with Flammable Loads";<br />
Traffic Accident Research Unit, Traffic Authority<br />
of New South Wales, Australia, Jan '84<br />
4. Ervin, R.D. et al.: "Future <strong>Conf</strong>iguration of<br />
Tank Vehicles Hauling Flammable Liquids in<br />
Michigan" ; UM-HSRI-80-73-l; The University<br />
of Michigan, Decernber 1980<br />
5. Strandberg, L.; "Lateral Stability of Road<br />
Tankers"; VTl*report 138 A; Vol l,ll;<br />
Linkdping 1978<br />
6. Abramson, H.N., et al.;"Some Studies of Nonlinear<br />
Lateral Sloshing in Rigid Containers"; J. of<br />
Applied Mechanics, Dec. 1966; 5.177-784<br />
7. Nordstroem, 0. et al.;"Test Proeedures For The<br />
Evaluation of the Lateral Dynamics of Commercial<br />
Vehicle Combinations"; Automobil-lndustrie;<br />
23(1978\2; P.63-69<br />
L Daimler-Benz ;"ToPAS-Tankfahrzeug mit optimierten<br />
passiven und aktiven Sicherheitseinrichtungen";<br />
Studie Sicherheitstankfahrzeug; Stuttgart,<br />
April 1984<br />
9- Drosclol,J- et al.; "The Daimler-Benz Driving<br />
Simulator, A Tool for Vehicle Developmcnt";<br />
SAE 850334: March '85<br />
10. Drosdol, J. et al.;**The Daimler-Benz Driving<br />
<strong>SECTION</strong> 4, TECHNICAL SESSIONS<br />
Simulator; New Technologies demand New Instruments";<br />
gth IAVSD Symposium on Dynamics<br />
of Vehicles on Roads and Tracks; Linkciping,<br />
Sweden, June 1985<br />
Stedtnitz, W., H. Appel:"Analyse charakteristischer<br />
Verkehrsunfdlle mit Nutzfahrzeugen";<br />
l2.BMFT-Statusseminar "Kraftfahrzeugc und<br />
StrabBenverkehr"; Bad Ems, Sept. I986.<br />
Slibar, A.; Troger, H.:"Die kritischen Fahrzustrinde<br />
des Tank-Aufliegerzuges bei verschiedenen<br />
Beladungsgraden und Bertihrbedingungen im<br />
stanonaren Fahrbetrieb"; Bundesministerium<br />
fiir Bauten und Technik.<br />
StraBenforschung Heft 55; Wien I976<br />
Bohn, P.F. et al.:"Computer Simulation of The<br />
Effect of Cargo Shifting on Articulated Vehicles<br />
Performing Braking and Cornering lvlaneuvers";<br />
Vol l-4, FHWA/RD-80/142, Laurel, MD., May<br />
l98l<br />
Sumner, I.E.: "Experimentally Determined Pendulum<br />
Analogy of Liquid Sloshing in Spherical<br />
and Oblatc-Spheroidal Tanks"; Nasa-TN-2737;<br />
N65-19919; Washington, April 1955<br />
Sumner, LE., et al.; "An Experimental Investi'<br />
gation of The Viscous Damping of Liquid Sloshing<br />
In Spherical Tankr;"; NASA, Technical Note<br />
D-1991, Cleveland, Ohio 1963<br />
Sumner, I.E.:"Experimental Sloshing Characteristics<br />
and a Mechanical Analogy of Liquid Sloshing<br />
in a Scale-Modul Centaur Liquid Oxygen<br />
Tank"; NASA TMX-999; Cleveland I964<br />
Sayar, B.A. et al.: "Pendulum Analogy for<br />
Nonlinear Fluid Oscillations in Spherical Containers";<br />
Journal of Applied Mechanics, Dec<br />
l98l; Vol 48;5.769-712<br />
Budiansky, B.;"Sloshing of Liquids in Circular<br />
Carrals and Spherical Tanks"; J. of the Aero/<br />
Space Sciences; Vol 27; March 1960, No.3;<br />
p. l6l-173<br />
McCarty et al.:"Investigation of The Natural<br />
Frequencies of Fluids in Spherical and Cylindrical<br />
Tanks"; NASA TN D-252<br />
Dodge, F.T.: "Analytical Representation of Lateral<br />
Sloshing by Equivalent Meclranical<br />
Models"; aus H.N. Abramson:"The Dynamic<br />
Behavior of Liquids in Moving Containers";<br />
Chapter 6; 5.199-223; Southwest Research Inst.,<br />
Wash. 1966<br />
Pfeiffer, F. ; "Linearisierte ll.<br />
t2.<br />
13.<br />
14.<br />
15.<br />
t6.<br />
t7.<br />
18.<br />
19.<br />
za.<br />
2t.<br />
Eigenschschwingungen<br />
von Treibstoff in beliebigen Behdltern"; Zeits-<br />
22.<br />
chrift frir Flugwissenschaft, l6(1968), Heft 6<br />
Kemp, R.N. et al.:"Articulated Vehicle Roll<br />
Stability:Methods of Assessment and Effects of<br />
Vehicle Characteristics"; TRRL Laboratory Report<br />
788; Crowthorne, Berkshire 1978<br />
't45
EXPERIMENTAL SAFETY VEHICLES<br />
Specialized Procedures for Preparing the Accident-Avoidance Potential of Heavy<br />
Trucks<br />
Psul S. Fancher,<br />
Arvind Mathew,<br />
The University of Michigan Transportation<br />
Research Institute,<br />
United States<br />
Abstract<br />
The ultimate goal of the work described here is to<br />
improve the safety quality of the transportation of<br />
goods on highways. Even though the transportation<br />
missions of heavy freight vehicles have led to a variety<br />
of axle configurations, suspensions, dolly types, and<br />
articulation joints, this paper provides a condensed<br />
summary of fundamental mechanical properties that<br />
can be used to make first-order estimates of the<br />
braking and steering performances of these vehicles.<br />
Specialized analysis procedures, based on basic<br />
properties of tires, suspensions, brakes, and steering<br />
systems, are discussed. Thcsc procedures provide simple<br />
analytical methods for predicting vehicle performance<br />
in maneuvers associated with operating truck<br />
combinations on highways. The performance characteristics<br />
considered are: (l) braking efficiencics, (2)<br />
transient low-speed offtracking, (3) high-speed otftracking<br />
in a steady turn, (4) directional and roll<br />
stability in steady turns, and (5) rcarward amplification<br />
and roll stability in an avoidance maneuver.<br />
The emphasis of this paper is on describing the<br />
features of simplified analytical procedures for estimating<br />
the accident-avoidance potential available to<br />
drivers for handling towing units and having trailers<br />
and semitrailers follow (track) without rolling over or<br />
exceeding pavement boundaries.<br />
<strong>Int</strong>roduction<br />
Since 1970 the Motor Vehicle Manufacturers Association,<br />
the National Highway Traffic Safety Administration,<br />
and the Federal Highway Administration in<br />
the United States have each supported extensive research<br />
programs that have examined the braking<br />
capabilities, directional control and stability, tracking<br />
fidelity, and rollover limits of heavy trucks. These<br />
efforts have indicated that the heavy truck is a special<br />
class of vehicle requiring its own test procedures,<br />
analytical methods, and computerized models for<br />
evaluating braking and steering performance. As a<br />
result of these research efforts laboratory tacilities are<br />
now available for mcasuring the mechanical properties<br />
of heavy trucks including those properties associated<br />
with mass distribution and the properties of truck<br />
tires, suspensions, and steering systems. Simulation<br />
models are now available for predicting the braking<br />
746<br />
and steering responses of heavy trucks. These simulation<br />
models use mechanical ptoperties measured in the<br />
laboratory to predict how vehicles will perform on the<br />
highway or in vehicle tests. Te$t procedures have been<br />
developed for demonstrating the performance capabilities<br />
of trucks in maneuvering situations in which<br />
some heavy vehicles are known to have very limited<br />
capabilities. The results of tests and simulations have<br />
been compared to verify that the model builders<br />
understand the observed phenomena. The current<br />
state of knowledge provides considerable insight with<br />
regard to maneuvering characteristics such as:<br />
r low-speed offtracking (cornering in town)<br />
r high-specd offtracking (turning at highway<br />
speeds)<br />
r braking efficiency (constant deceleration<br />
braking)<br />
I roll stability (rollover)<br />
r steering sensitivity (handling)<br />
. rearward amplification (obstacle evasion)<br />
The maneuvering characteristics listed above have<br />
been selected for use in estimating how well vehicles<br />
will perform relative to the following practical goals<br />
that are, in essence, accident avoidance goalst<br />
'<br />
r the rear of the vehicle should follow (track)<br />
the front with adequate fidelity<br />
r the vehicle should attain a desirable level of<br />
deceleration during braking<br />
the vehicle should remain upright (not roll<br />
over)<br />
. the vehicle should be controllable and stable<br />
enough to follow a desired path.<br />
With respect to these goals, the vehicle should be<br />
able to perform acceptably over appropriate ranges of<br />
operational factors including loading, speed, roadway<br />
friction, lateral acceleration, tire wear, brake maintenance.<br />
etc.<br />
Based on the current status of knowledge concerning<br />
(a) the maneuvering performance$ of heavy<br />
trucks, (b) analytical proccdures for predicting vehicle<br />
responses, and (c) experimental procedures for examining<br />
truck properties, researchers[1,2] have developed<br />
plans I'or guiding decisions on safety benefits. As<br />
illustrated in Figure l, the item entitled "definitions<br />
of response phenomena" is the central factor in a<br />
research program that would provide information<br />
needed to weigh the tradeoffs between costs and<br />
benefits in determining the boundaries between acceptable<br />
and unacceptable performance. The definitions<br />
of pertinent respon$e phenomena provide the
foundation for (l) assessing the distributions of performance<br />
levels existing in thc currcnt truck fleet' (2)<br />
estimating the links betweeu vehicle characteristics and<br />
certain types of truck accidents, (3) developing practical<br />
countermeasures for various types of trucks and<br />
truck accidents, and (4) developing test methods for<br />
demonstrating the performance capabilities of specific<br />
vehicles. These definitions are expected to portray<br />
response characteristics in selected maneuvering situa'<br />
tions in terms of performance signatures (that is'<br />
graphs of performance capabilities), and perforlnance<br />
measures (that is, distinguishing features of the signatures).<br />
(Sets of maneuvers, signatures, and measures<br />
for trucks have been discussed in previous<br />
publications[3,4].) The purpose of this paper is to<br />
further the definition of these respollse phenomena by<br />
describing basic mechanical considerations that have<br />
been incorporated into specialized procedures (simplified<br />
analysis-methods) developed for predicting performance<br />
levels using limited amount$ of paratnetric<br />
data pcrtaining to the mechanical properties of heavy<br />
trucks[5].<br />
Pertinent Mechanical Properties for<br />
Making First Order Estimates of<br />
Accident Avoidance Potential<br />
The mechanical properties of the components of<br />
heavy trucks have been corupiled into a<br />
"factbook"[5]. The influences of component properties<br />
on maneuvering performance are discussed, and<br />
Figure<br />
N}IOWLEDoE EASE FOB GUII'IHG<br />
BAFETY.RELATEO DECISIONS<br />
S{lotY<br />
tlelsled<br />
1. Knowledge<br />
quirement$<br />
JustitiFd Levsls<br />
ol PerlormancE<br />
RsquirBmqdls<br />
I<br />
I<br />
?<br />
bese for evaluating safety<br />
<strong>SECTION</strong> 4. TECHNICAL SESSIONS<br />
tables indicating the relative importance of various<br />
mechanical properties to the dynamic performatrce of<br />
heavy trucks are presented there. The following discussions<br />
relate pertinent mechanical propertie$ to the<br />
maneuvering situations listed in the lntroduction.<br />
Low-Speed Offtracking<br />
The amount of low-speed offtracking for a particu-<br />
Iar vehicle depends upon its basic dimensional properties<br />
indicating where the axles are located (how far<br />
apart they are) and where articulation joints (hitches)<br />
are located. For simplified analyses, tandem and<br />
multiple-axle suspensions can be treated as single axles<br />
locatccl at the centers of the suspension groups. These<br />
simplifications will not be accurate for vehicles with<br />
wide spread axles operating on slippery road surfaces,<br />
but otherwise they are sufficiently accurate for first<br />
order estimates of offtracking.<br />
High-Speed Offtracking<br />
The amount of high-speed offtracking depends<br />
upon those mechanical properties that influence lowspeed<br />
offtracking plus pertinent mechanical properties<br />
describing the installed tires and the distribution of<br />
loacl. The needed information on load distribution can<br />
be supplied by specifying axle loads' For simplified<br />
analyses, the total load otr tandem axle sets will<br />
suffice if the tandem's suspensions have load leveling<br />
mechanisms.<br />
The information on axle loads is used in determining<br />
the angles that a vehicle's tires must assume to<br />
provide adequate side forces for the vehicle to follow<br />
highway curves at highway speeds. An additional<br />
piece of data needed for estimating these angles is the<br />
"cornering<br />
stiffnesses" of the tjres. The angles involved<br />
here are "slip angles", and measured data on<br />
thc lateral force capabilities ol' tires ate usually<br />
presented as functions of slip angle and load. The<br />
cornering stiffncss is the rate of change of lateral<br />
force with respect to slip angle evaluated at small slip<br />
angles and at loads specific to the vehicle's (the tirc's)<br />
operating conctitiotr.<br />
Braking Efficiency (Constant Deceleration<br />
Braking)<br />
In addition to the axle and hitch locations and<br />
"static" loads as nceded for the previous maneuvering<br />
situations, the heights of the centers oi' gravity of the<br />
units comprising a vehicle are required for analyzing<br />
braking performance. Also, the heights of the hitches<br />
are needed to determine the loads existing on the<br />
vehicle's axles when the vehicle is braking at a given<br />
level of deceleration.<br />
To determinc the friction level required to prevent<br />
wheels frorn locking up and vehicles from becotning<br />
directionally uncontrollable, the distribution of braking<br />
effort from irxle to axle is important. Ideally' the<br />
747
instantaneous ratio of braking force divided by vertical<br />
Ioad would be the same for all wheels-that way,<br />
no wheel would require more roadway friction than<br />
another wheel-this corresponds to the maximum<br />
efficiency for utilizing a prescribed level of roadway<br />
friction. However, the distribution of braking forces<br />
lrom wheel to wheel may not Lre capable of achieving<br />
high efticiency over the in-use rarlge of road surface<br />
and vehicle loading conditions. Special equipment,<br />
such as antilock systems or load sensing proportioning<br />
systems, are needed to prevent wheel lock arrcl to<br />
achieve good braking efficiencies- The proportioning<br />
arrangemcnts provided by conventional braking sys_<br />
tems have an important influence on braking efficiency,<br />
and in order to calculate proportioning, brake<br />
efl'ectivencss (gains as funcrtions of pressure) are<br />
needed for each brake.<br />
Some of the load leveling mechani,sm$ used in heavy<br />
trucks react to brake torques in a manner that cau$es<br />
interaxle load transfer between axles in tandem sets.<br />
This Ioad transfer can be large enough to have a<br />
significant influence on braking cfficiency.<br />
Although brake effectiveness or gain seems like a<br />
straightforward matter, it is not. Brake effectiveness is<br />
strorrgly influenced by random variations in lining<br />
flriction, brake wear, work history (temperature history),<br />
and adjustment and maintenance practices.<br />
Nevertheless, simplified analyses can provide first<br />
order estimates of braking efficiencies that are suitable<br />
for judging the relative performances of vehicles<br />
that are expected to have comparable levels of mainte_<br />
nance and braking experience.<br />
Rollover<br />
To make first-order estimates of a truck's rollover<br />
thrcshold (that is, the level of lateral acceleration at<br />
which a truck will rollover), it is necessary to treat the<br />
vehicle as an assembly of sprung and unsprung<br />
masses. Even so, the most important cleterminant of<br />
roll stability is magnitLrdc of the ratio tormed by<br />
dividing half of the track width of the vehicle by the<br />
height of the center of gravity of the sprung mass of<br />
the vehicle. The amount of lateral translation of the<br />
sprung mass is much less imfiortant than the ratio of<br />
track width to c.g. height, bur it is still critical cluring<br />
rolling. Suspension roll stiffnesses and roll center<br />
heights are needed to predict this lateral translation,<br />
and also, to predict the roll restoring moments tend_<br />
ing to keep the vehicle uprighr.<br />
The vertical stiffnesses of the tires serve to react the<br />
suspension roll moments against the ground. The<br />
maximum amount of this restoring moment at any<br />
axle is limited to the product of half of the track<br />
width times the axle load- The clistribution of roll<br />
stiffnesses and vertical loads from axle to axle determines<br />
those axles whose restoring moment,$ will be<br />
748<br />
EXPERIMENTAL SAFETY VEHICLES<br />
limited as the vehicle approaches its rollover threshold.<br />
Finally, the hitches have a significant part to play in<br />
the rolling process. The typical pintle hitch does not<br />
provide a roll restraint bctween the units that it<br />
connects, while fifth wheels and turntables do provide<br />
roll constraints. The analysis of combination vehicles<br />
employing pintle hitches rcquires individual roll analyses<br />
for each independently rolling section of the<br />
vehicle.<br />
Steering Sensitivity (Handting)<br />
The term "steering sensitivity" is associated with<br />
the amount of steering wheel angle (or front wheel<br />
angle) required to maintain a steady turn ar constant<br />
vclocity. It is a performance measure associated with<br />
*'handling." Specifically, it refers to the amount of<br />
change in steering angle accompanying a unit change<br />
in lateral acceleration (that i$, thc inverse of the<br />
lateral acceleration gain with respect to steering<br />
input$). When the steering sensitivity approaches zero<br />
for a particular vehicle, fhat vehicle is approaching a<br />
situation in which a small change in stccring angle<br />
cau$es a large change in lateral acceleration. In this<br />
case, the vehicle is approaching clivergent instability,<br />
and it will be more difficult to steer properly than<br />
other vehicles having larger steering sensitivities (that<br />
is, vehicles having less gain per unit change in steer<br />
angle).<br />
Steering sensitivity depends primarily upon how the<br />
tires on the steered "towing" unit (either a truck or a<br />
tractor) are loaded and upon the cornering stittnesses<br />
of those tires.<br />
To the extent that the properties of towed units<br />
influence the vertical and lateral loads on the tires of<br />
the towing unit, the towecl units influence steering<br />
sensitivity. With regard to steacly turning, information<br />
on the properties of typical full trailers is not necded<br />
because their clollies are equipped with pintle hitches<br />
that do not apply significant vertical loacls. lateral<br />
loads, or roll moments to the unit ahead of the clolly.<br />
In addition to the static loading of the towing unit'r;<br />
tires, the amount of sicle to sidc loacl transfer at the<br />
various axles of the towing unit is important. This is<br />
because a large amount of side to sicle loacl transfer<br />
can cause a small but important reduction in the total<br />
cornering stiffness of the tires installed on an axle.<br />
The factors mentioned above imply that in order to<br />
evaluate steering (handling) performance it is neces_<br />
sary to know all of the properties mentioned previ_<br />
ously for the other maneuvering situations plus information<br />
concerning details of the influences of vertical<br />
Ioads on tire cornering stiffhesses.<br />
Rearward Amplification<br />
In combination vehicles, primarily those employing<br />
full trailers, the motion of the last unit can be a
greatly amplified version of the motion of the leading<br />
tractor or straight truck. This amplified motion is<br />
analogous to "cracking the whip", and it is referred<br />
to as "rearward amplification." Rearward amplificalion<br />
occurs in rapid (emergency) obstacle avoidance<br />
maneuvers performed at highway speeds[7].<br />
Examinations of (a) results from experimental<br />
studies[8,9] and (b) the equations of tltltion for<br />
articulated vehicles[0,11] indicate that the properties<br />
of both towing units aud towed units have significant<br />
influences on rearward amplification.<br />
The important mechanical properties of trailers as<br />
towed units are their wheelbases and their ratios of (a)<br />
the sum of all of the cornering stiffnesses of the tires<br />
installed on the trailer divided by (b) the mass of the<br />
trailer.<br />
The important properties of towing units (be they<br />
trailers, semitrailers, tractors, or trucks) are (a) the<br />
distance from their center of gravity to the rear hitch,<br />
(b) the locations ot their wheels, and (c) thc cornering<br />
stiffnesses of thcir tires.<br />
Forward velocity has a large influence on the<br />
amount of rearward amplification. Rearward anrplification<br />
becomes irnportant at speeds oI approximately<br />
45 mph (72 kph) for vehicles that are susceptible to it,<br />
and it becomes increasingly larger as speed incrcases.<br />
Simplified Analytical Methods for<br />
Predicting Truck Performance<br />
The following analysis procedures might be viewed<br />
as nurnerical equivalents of rules of thumb. They have<br />
beerr programmed for use on personal computers[5].<br />
T'hese calculation methods are based on specialized<br />
models pertaining to specific maneuvering situations.<br />
Detailed descriptions of various versions of these<br />
models will be published in forthcoming reports[5,12].<br />
The following discussion is aimed at providing an<br />
understanding of the basic ideas u.ted in these sirnplified<br />
analyses.<br />
Low-Speed Offtracking<br />
In this case the vehicle may be envisioned as an<br />
assembly of axles and hitches with specified locations.<br />
The basic principle involved here is that, at low speed<br />
near zero velocity, thc wheel planes of thc tire-sets<br />
will remain tangent to the paths of motion of the<br />
tire-sets. (That is, the slip angles will be zero.) To<br />
illustrate this idea consider a simplified unit of a<br />
combination vehicle in which a generic tire-set is<br />
respondirrg to thc rnotion of its leading hitch point<br />
{see Figures 2 and 3). A discrete approximation to tlle<br />
path of the tire-set can be obtained by the constructiorr<br />
illustrated in Figure 3. Thc tirc always remains a<br />
fixed distance behind the hitch point and it proceeds<br />
along a straight linc segment that is determined by the<br />
discrete points describing the hitch motion and the<br />
<strong>SECTION</strong> 4. TECHNICAL SESSIONS<br />
last position of the tire. (In som€what mathematical<br />
terms, the hitch point follows a general curve and the<br />
path of the tire is the "tractrix" of that general<br />
curve.)<br />
Given the path of the leading hitch point and<br />
having determined the path of the tire, one can<br />
deterrnine the path of a trailing hitch point at the rear<br />
of the unit.<br />
In practise, the general curve of the center of the<br />
front axle of the vehicle is given. (That is, it is<br />
assumed that the driver steers to attain a desired path<br />
for the front axle.) In addition, the discrete pctints<br />
describing the path of the front axle are at small<br />
intervals-say I foot (0.3 m) apart. Furthermore, the<br />
path of each hitch point is first calculated using a<br />
numerical equivalcnt of the graphical constructiorr<br />
illustrated in Figure 3, and then it is used as the<br />
general curve for determining the motion of the<br />
preceding unit and its rear hitch point.<br />
High-Speed Offtracking<br />
During low-speed offtracking, if the front axle<br />
follows a constant radius turn long enough (usually<br />
more than through 90 degrees of turn), the vehicle<br />
will eventnally reacl-r a steacly condition with a tixed<br />
level of offtracking. This level of offtracking can be<br />
determined from the properties ot' right triangles since<br />
the tires operate at nearly zero Iateral force, that is, at<br />
nearly zero slip angles.<br />
When a vehicle rregotiates a steacly turn at highway<br />
speeds, its tires generate the lateral forces needed to<br />
make the turn. The tires must operate at non-zero slip<br />
angles (see Figure 4) to prodr.rce these lateral forces.<br />
The geometry of the steady trrrning situation at<br />
highway speeds differs from the low speed situation<br />
due to the non'zero slip anglcs developed at highway<br />
speeds. Figure 5 shows the influence of slip angle, cu,<br />
on the geometry of a generic trailer. The equation<br />
given in the figure provides an approximation to the<br />
Stalionary Oblect Struck by<br />
Offtracking Trailer<br />
Path ot lhe<br />
Olttrackinq<br />
Figure 2. In low-speed otttracking, each axle tracks<br />
inboard of the preceding axle<br />
749
+L,Whelbsc+ DLhE {FlFoxitudon<br />
to thc BencrEI cuwc<br />
FpEsfltin8 thE motiod<br />
ofthc hitch point<br />
Flgure 3. Offtracking behavior of a $emitreiler following<br />
the motion of the fifth wheet kingpin<br />
side force required from the tire set. Using this<br />
approximation, slip angle is found to be a function of<br />
cornering stiffness of the tires, vertical load on the<br />
axle, and the lateral acceleration of the turn. Once the<br />
slip angle is determined, the analysis is reduced to<br />
trigonometry; specifically, rwo applications of the law<br />
of cosines provides the radii of the wheel set and the<br />
rear hitch point if the center of the front axle is<br />
assumcd to follow a curve of a given radius.<br />
As illustrated in Figure 5, there is a speed at which<br />
the offtracking is zero. Above this speed the wheel<br />
tracks to the outside of the turn, and below this speed<br />
the wheel tracks to the inside of the turn reaching<br />
maximum inboard offtracking at zero speed. Typical<br />
heavy vehicles operating at highway speeds on highway<br />
curves tend to offtrack towards the outsicle of the<br />
turn by a small amount-on the order oF I or 2 feet<br />
(0.3 to 0.6 m)-but enough ro cause tripping on curbs<br />
if the driver is not aware of the position of the rear<br />
axles.<br />
EXPERIMENTAL SAFETY VEHICLES<br />
Roar Arlo Otftrrcldm<br />
OulMurd ol Frod Axlt€:<br />
ol Frcnl Axle<br />
Path ol R€ar A116<br />
Figure 4. When cornerlng at speed, trailers may offtrack<br />
outboard ol the tractor if the tire slip<br />
angfes are farge enough<br />
750<br />
,:<br />
Braking Efficiency<br />
The braking capability of a vehicle can be estimated<br />
by analyzing its pcrformance in a series of constant<br />
deceleration maneuvers. By assuming straight line<br />
motion, the complexities of vehicle roll and yaw can<br />
be neglected.<br />
It the brake forces at the wheels are known. the<br />
vehicle's mass distribution helps determine its result_<br />
ing deceleration. Thc pitching motion of the vehicle<br />
characterized by loads being transferred from the rear<br />
wheels onto the front wheels, can be represented in a<br />
straightfbrward sequential calculation starting from<br />
the rear of the vehicle. The pitch moment and force<br />
balances (see Figure 6) for each unit yield hitch and<br />
axle loads, which when carried forward to the power<br />
unit, would define the wheel load distribution for the<br />
vehicle. The amount of load that is transferred<br />
depends upon the deceleration level, the hitch and<br />
axle locations, c.g. heights, static load distribution<br />
and brake proportioning.<br />
Special consideration is given to tandem sets, which<br />
redistribute thcir axle loads based upon a percentage<br />
of the braking effort generated at their wheels (see<br />
Figure 7). This interaxle load transfer is incorporated<br />
into the force and moment balance for each unit. The<br />
Figure 5. lllustration of<br />
tracking<br />
It Rw is the rddius subr8nded by the<br />
a}u,t2. zqJvu mqso -c t, f<br />
forffill d srd<br />
zero olflracking, R=fu<br />
ano nsncE,<br />
it /57,3,wt/?R<br />
Va (wbCog57.3/2F.)os<br />
llole that Vodo€s not<br />
deFend umn FI.<br />
c*u, F.v?Hg<br />
vo, the speed for off-
t+-<br />
| '.J-" I<br />
1*ro s<br />
<strong>SECTION</strong> 4. TECHNICAL SESSIONS<br />
+J<br />
,-v,tLr- '4<br />
tMR?<br />
rzR2<br />
Figure 6. Oimensions and freebody diagram lor a Eactor<br />
semitrailer<br />
analysis also accounts for full trailers with fixed<br />
dollies. lnstead of transferring some load onto the<br />
forward unit, the turlltable of the fixed dolly causes<br />
much of thc pitching motion to be reacted out at the<br />
wheels of the full trailer. Besides altering the equa-<br />
tions for the force and moment balances, the full<br />
trailer doe$ not complicate the analysis.<br />
es<br />
The wheel loads determine the amount of road<br />
friction required to achieve the cotnputed level of<br />
deceleration. The friction is given by, F = Fx/Fz.<br />
The axle whose wheels require the maximum<br />
amount of friction is most prone to wheel lock-rrp and<br />
is therefore the critical axle. The braking efficiency is<br />
defined as the ratio of the vehicle's deceleration to the<br />
friction required by the critical axle.<br />
At higher levels of deceleration, rear-to-front load<br />
transfer increases. Wheel unloading caused by the<br />
load transf'er increases the frictional demands of the<br />
vehicle r€sulting in a reduction in the braking efficiency.<br />
Braking efficiency can therelbre be portrayed<br />
as a function of deceleration. In addition to deceleration,<br />
braking efficiency is very sensitive to the vehicle's<br />
static loading condition. Empty vehicles tend to<br />
have low efficiencies implying the dangers of locking<br />
wheels and losing directional corttrol.<br />
Roll Stability<br />
The conditions for roll equilibrium are determined<br />
in this analysis. The vehicle is envisioned as proceeding<br />
through a sequence of roll angles of its sprung<br />
NotE!1<br />
F..'TL + t(FB?+FBr)<br />
Fzr. +<br />
thrrc F1rryr Flat F3t<br />
qnd lhr sytltrfl<br />
- F*(FE.+F6r)<br />
l) For o wollriilq bcsm fhr<br />
lood on ihc hont is inorored,<br />
ic. F .>O.<br />
2) Foro4lprinq, P .*fl.<br />
'<br />
l+l.l<br />
V -Ft5<br />
1 t<br />
l - l -<br />
'tza tFzI<br />
ir rtploctd Fy fhE rytfcm<br />
I rzil<br />
- l<br />
I!?- I 'a:lJMil<br />
'r F:z( Fsz+ Frr I<br />
Thc irrm rP12(FsatFgal needi to bt qdded to lhe qppropriqtr<br />
gifch iror|l€nt tquolion,<br />
Figurc 7. Approximets representation of interaxle load tranefer
Suspension<br />
Flgure 8. A heavy truck in a left turn<br />
Otrt board shift ol CG fforn track cenrer<br />
mass. For each of these roll angles, the equilibrium<br />
equations of motion are solved for lateral accelera_<br />
tion, the roll angles of each axle, and the relative roll<br />
angles between the sprung mass and each of the axles.<br />
(See Figure 8.) These angles dctcrmine the restoring<br />
moments produced by the suspensions and the tires.<br />
The conditions for wheel lift-offs are determined and<br />
the equations are adjusted to account for the ,,satu,<br />
rfltisn" of restoring moment accompanying lift-off'.<br />
As the suspensions and tires deflect the mass cenrers<br />
translate to the outside of the turn, thereby increasing<br />
the moment tending to produce rollover. The results<br />
of this analysis are examined for the maximum level<br />
of lateral acceleration that can be sustained. This is<br />
the rollover threshold.<br />
Steering Sensitivity (Handling)<br />
This analysis is based on the equilibrium equations<br />
for steady turns at constant velocities. The required<br />
front wheel $teering anglc is calculated as a function<br />
of lateral acceleration. In addition, if the vehicle can<br />
become unstable at high speeds and lateral accelerations,<br />
the boundary between stable and unstable<br />
operation is determined. This boundary is displayed<br />
on a graph with lateral acceleration as the horizontal<br />
axis and forward velocity as ths verticat axis, thereby<br />
indicating those combinations of lateral acceleration<br />
152<br />
EXPERIMENTAL SAFETY VEHICLES<br />
and forward velocity for which the vehicle will be<br />
stable.<br />
Examinations of the equations of motion for articulated<br />
vehicles show that during a steady turn there is a<br />
single value of yaw rate that applies to all units in the<br />
combination vehicle-otherwisc, the articulation angles<br />
would be changing and the motion woulcl not be<br />
a steady turn. This observation leads to a procedure<br />
in which lateral acceleration is specifiecl at each step<br />
of a series of computations made at a constant<br />
velocity. (In a steady turn, lateral acceleration is the<br />
product of velocity multiplied by yaw rate.)<br />
The general form of a step of this procedure is<br />
illustrated in Figure 9. Applicable notation is defined<br />
by the figure. The items shown in this figure can be<br />
used to explain thc basic ideas involvecl in the<br />
calculation. First, the force of constraint acting at the<br />
front of the last unit can be calculated from properties<br />
of the last unit and the selected values of yaw<br />
rate, r, and forward velocity, u. Next, since the force<br />
of constraint at the front of one unit has an equal but<br />
opposite reaction on the next unit, the force at the<br />
rear of the next unit is known. As indicated in the<br />
diagram, the force of constraint at the front of any<br />
unit can be derermined if (a) the force at its rear hitch<br />
point, (b) yaw rare, and (c) I'orward velocity are<br />
known. The analysis proceeds in this manner going<br />
from unit to unit towards the front of the vehicle.<br />
Once the analysis reaches the forward unit (the<br />
tractor) the arlount of steer angle needed to obtain<br />
the required force at the front of the first unit is<br />
determined, thereby providing the information desired<br />
for predicting thc stccring sensitivity aspccts of handling<br />
performance.<br />
The forces of constraint corrtain information that is<br />
useful in understanding the handling performance of<br />
Yrr - Ynr<br />
Yrs = \hz<br />
\fr -\fia<br />
\h4 =0(lastunir)<br />
Fi iunilE*J.dlpill€|.<br />
YHi : larceg al mnstainl<br />
Yt : lorcAs ol mndraint<br />
Ii : aditulatiof, arut€<br />
Xfl ,cut"rc" uv""n ".s. adtw{dHb}<br />
XCt , Ctstancs U"v""n ".g. atu resr hnd<br />
Ccl l i trtu#g Erifin€s ot rtu fras an ha tnt sE<br />
Flgure 9.<br />
randu Ii-F,-Fz+(/qr-Xr:)i<br />
Ii- Fe-Fa + (Xq.-X5.)rl<br />
Ii - Fs- F. * (lhs- xrr)i<br />
Cot I; + l.Q ; Sln fi - fl<br />
The elements involved in calculating steer_<br />
ing angle, 6
certain vehicles. For vehicles with full trailers the<br />
constraint force at the front of the dolly is usually<br />
very small so that changes in the rearward units have<br />
little influence on the steering response of the tractor<br />
(or truck). For tractor semitrailers, the lateral force of<br />
constraint at the fifth wheel is approximately equal to<br />
the lateral acceleration in g's times the static load on<br />
the fifth wheel. This piece of knowledge can be used<br />
to simplify the analysis of the tractor semitrailer, or at<br />
least, to chesk results from more complicated calculations.<br />
(See Appendix A for further discussion of<br />
Figure 9.)<br />
Rearward Amplification<br />
In a full trailer, the conventional dolly provides a<br />
wagon tongue type of steering that causes the center<br />
of gravity of the trailcr to follow the path of rhe hirch<br />
point with excellent fidelity in normal lane changing<br />
maneuvers. However, for sudden obstacle avoidance<br />
maneuvers with steering inputs having periods on the<br />
order o[ 2 to 3 seconds, the motion of the trailer'$<br />
c.g. can be an exaggerated version of the motion of<br />
the hitch point. As explainecl earlier, the severity of<br />
this tendency depends upon the rnechanical properties<br />
of the trailer and its towing unit.<br />
In a surprise avoidance maneuver, the full trailer is<br />
Iike a mechanical serv'ornechanism in which the motion<br />
of the pintle hitch is the input and the motion of<br />
the trailer'.s c.g. is the output. The magnitucle of the<br />
input in the avoidance maneuver depends upon the<br />
properties of the unit towing the full trailer. The<br />
magnitude of this input depends also upon the period<br />
of the maneuver. To fincl the maneuver producing the<br />
largest amplification, it is necessary to compute results<br />
using a set of periods covering the range in which<br />
maximum amplification is expected. Figure l0 illustrates<br />
the type of result that can occur at a high level<br />
of amplification.<br />
In order to avoid performing a number of simulations<br />
to evaluate r€arward arnplification, arrothcr<br />
approach has been used to obtain an estirnate of the<br />
tendency tctwards rearward arnplification. This approach<br />
consists of evaluating the linear range transfer<br />
function hetween the lateral acceleration of the leading<br />
unit and the lateral acceleration of the trailing<br />
unit. Although not as accurate as the simulation<br />
approach, the approach using the transfer function<br />
allows one computation to be used to find the<br />
maximum amplification.<br />
Furthermore. the overall transfer function can be<br />
approximated by products of intermediate transfer<br />
functions relating the motions of c.g.'s to the motions<br />
of hitch points and then the nrotions of hitch points<br />
to the rnotions of c.g.'s in proceedirrg frorn the front<br />
to the rear of the vehicle. This approximate<br />
"factoring"<br />
of the transfer function is possible because<br />
<strong>SECTION</strong> 4. TECHNICAL SESSIONS<br />
the forces at the pintle hitches are small enough to be<br />
neglected. This helps to identity which porrions of rhe<br />
overall tran$fer functions are the important contributors<br />
to rearward amplification, and thereby aids in<br />
identifying where improvements can be made by<br />
changing vehicle design.<br />
Summary and Concluding Remarks<br />
Clearly, a vehiclc's tires are the connections to the<br />
roadway that are used to achieve the driver's transportation<br />
objectives. The tires provide (a) forces that<br />
cause the vehicle to move longitLrclirtally, laterally, and<br />
directionally plus (b) the forces that support the load<br />
and hold it upright. The qualities required for maneuvering<br />
heavy trucks and avoiding accidents in braking<br />
and stecring situations are depetrdent upon the following<br />
tire-related matters:<br />
r where the tires are located on the vehicle<br />
. how the tire$ are loaded<br />
r how the tires are braked<br />
. how the tires are oriented with respect to<br />
their direction of motion<br />
Specifically, this paper indicates that values for the<br />
following meclranical properties are needed to make<br />
first order estimates ol' the braking and steering<br />
performance qualities of heavy trucks:<br />
-locations of the axles<br />
-locations of the hitches<br />
-cornering stiffnesses of the installed tires<br />
-static axle loads that the vchiclc exerts on the<br />
paveI]tent<br />
-effectiveness of the brakes installed on each axle<br />
-interaxle load transfer in tandem suspensions<br />
P6aI $ffind lraler<br />
lal€rJ s@l€ratbo. ey4<br />
Figure 10. In a rapid lane change maneuver, rearward<br />
amplification results in "crack-the-whlp"<br />
action of the rear trailer, sometimes reeulting<br />
in rear trailer rollover<br />
153
-weights and center of gravity heights of the sprung<br />
and unsprung ma$se$ of the units comprising the<br />
vehicle<br />
-suspension roll stiffnesses (or spring stiffness and<br />
spread plus auxiliary roll stiffness)<br />
-roll center heights of each suspension<br />
-vertical stiffnesses of the tires<br />
-track width between the centers of the tire sets<br />
in$tall€d on each axle<br />
-types of constraints provided by the hitches used to<br />
couple units together<br />
-influences of vertical load on the cornering stiff-<br />
nesses of the in$tall€d tires<br />
-compliance in the steering systemand<br />
the steering<br />
ratio<br />
Each of these mechanical descriptors has a bearing<br />
on how the tire$ are operated and how heavy trucks<br />
will perform in braking and steering maneuvers.<br />
The analysis procedures described in this paper are<br />
aimed at evaluating the following performance measure$:<br />
r offtracking at in-town intersections<br />
r offtracking on highway ramps<br />
r friction utilization and braking efficiency<br />
during deceleration<br />
r the lateral acceleration threshold at which<br />
trucks rollover<br />
r the steering sensitivity and stability of tractor<br />
semitrailers, single unit trucks, and the leading<br />
units of multi-articulated vehicles<br />
I the rearward amplification of the lateral<br />
acceleration from the first to the last unit of<br />
articulated vehicles.<br />
This list of maneuvers could be expanded to include<br />
matters such as:<br />
r<br />
.<br />
r<br />
r<br />
response times in sudden turning situations<br />
braking during turning<br />
respon$es to external disturbances (wind<br />
r<br />
r<br />
gusts, road bumps, etc.)<br />
brake fade during mountain descents<br />
frictional requirements lor negotiating turns<br />
on slippery road surfaces<br />
Nevertheless, the set of performance measures discussed<br />
herein provides a starting point for safety<br />
improvement programs of the type illustrated in<br />
Figure I.<br />
It is intended that the understanding provided by<br />
describing and discussing simplified models will assist<br />
vehicle designers, accident investigators, and highway<br />
designers in making informed judgements concerning<br />
the accident avoidance potential of various types of<br />
heavy trucks.<br />
7s4<br />
EXFERIMENTAL SAFETY VEHICLES<br />
References<br />
I. Fancher, P.S., et al. "Heavy Truck Stability:<br />
Synthesis/Program Plan Development." University<br />
of Michigan Transportation Research lnstitute<br />
Report No. UMTRI-96-3, Feb. 19g6<br />
2,. Leasure, W.A. "Issues in Handling and Stability."<br />
Truck Safety-an Agenda for the Future.<br />
SAE P-181, Annapolis, Md., June 1986<br />
3. Fancher, P.S. "An Evaluation of the Obstacle-<br />
Avoidance Capabilities of Articulated Cornmercial<br />
Vehicles." Tenth <strong>ESV</strong> <strong>Conf</strong>erence, Oxford,<br />
England, August 1985<br />
4. Fancher, P.S. and Mathew, A. .,Using a Vehicle<br />
Dynamics Handbook as a Tool for Improving<br />
the Steering and Braking Performances of Heavy<br />
Truck$." SAE paper no. 870494, Feb. l9B7<br />
5. Fancher, P.S. and Mathew, A. ,,A<br />
Vehicle<br />
Dynarnics Handbook for Single-Unit and Arriculated<br />
Heavy Trucks." Final Report to NHTSA<br />
on contract DTNH22-83-C-07IBT, to be published<br />
6. Fancher, P.S., et al. ..A Factbook of the Mechanical<br />
Properties of the Components for<br />
Single-Unit and Articulated Heavy Trucks." Report<br />
on NHTSA contract DTNH22-83-C-07I83,<br />
Dec. 1986<br />
7. Winklcr, C,8., et al. "Parametric Analysis of<br />
Heavy Duty Truck Dynamic Stability." Final<br />
Report NHTSA contract DTNH22-80-C-07344,<br />
March 1983<br />
8. Ervin, R.D., et al. "Influence of Size and<br />
Weight Variables on the Stability and Control<br />
Propcrties of Heavy Trucks." Final Report<br />
FHWA contract FH-ll-9577, March l9B3<br />
9. Winkler, C.8., et al. "Improving the Dynamic<br />
Performance of Multitrailer Vehicles: a Study of<br />
lnnovative Dollies." Final Report FHWA contract<br />
DTFH6I-84-C-00026, July 1986<br />
10. Mallikarjunarao, C. and Fancher p.S. ..Analysis<br />
of the Directional Response Characteristics of<br />
Double Tankers." SAE paper no. ?81064, Dec.<br />
1978<br />
ll. Fancher, P.S. "Transient Directional Response<br />
of Full Trailers." SAE paper no. 821259, Nov.<br />
1982<br />
12. Final Report on an MVMA study entitled ,,Development<br />
of Microcomputer Models of Truck<br />
Braking and Handling." To be published in July<br />
1987.<br />
Appendix A<br />
The quantities symbolized in square brackets (in the<br />
form [A,] in Figure 9) contain combinations of tire<br />
cornering stiffnesses and axle locations having relevance<br />
to handling considerations. (They also contain<br />
terms dependent upon the mass of the unit and its
forward velocity.) The important terms related to the<br />
tires and their locations are (1) the "damping in<br />
sideslip", that is, the sum of the cornering stiffnesses<br />
of all of the tires located on the unit divided by the<br />
forward velocity, (2) the "damping in yaw", that is,<br />
the sum (over all tires) of the cornering stiffness of<br />
each tire times the square of its longitudinal distance<br />
from the unit's center of gravity-all of this divided<br />
by velocity, and (3) the "corrpling between sideslip<br />
and yawn', that is, the sum (over all tires in front of<br />
the center of gravity) of the cornering stiffness of<br />
each tire times its distance from the center of gravity<br />
minus the same sum for all tires behind the center of<br />
gravity of th€ unit-again all of this divided by<br />
velocity. Without enough damping, vehicles may ei^<br />
ther sideslip or yaw excessively to attain the forces<br />
required for equilibrium. For tractors and trucks, the<br />
coupling between sideslip and yaw is usually small<br />
(that is, it is the difference of large, nearly equal<br />
nurnbers) but nevertheless it is important. If it is<br />
greater than zero for the towing unit, there exists the<br />
possibility that the vehicle may be directionally unstable<br />
at highway speeds.<br />
The discussion above is independent of the roll<br />
motion of the vehicle. The vertical loads on the tires<br />
depend upon thc lateral acceleration of the turn and<br />
the roll motions of the units. The cortrering stiffnesses<br />
of the tires depend upon their vertical loads, and<br />
hence upon the roll properties of the vehicle. Through<br />
this mechanism, the amount of change in cornering<br />
stiffnesses is large enough to make some heavy trucks<br />
directionally unstable at lateral acceleration levels that<br />
are less than the rollover thresholds of these trucks.<br />
Another factor of importance is the stiffness of the<br />
steering system. This stiffness is effectively in series<br />
with the cornering stiffness of the front tires, thereby<br />
increasing the amount of steering wheel angle needed<br />
<strong>SECTION</strong> 4. TECHNICAL SESSIONS<br />
Antilock Braking Equipment for Heavy Duty Vehicles and lts Evolutions Within<br />
European Regulation<br />
J.P. Cheynet,<br />
P. Beaussier,<br />
Union Technique de L'Automobile, du Motocycle<br />
et du Cycle,<br />
France<br />
Abstract<br />
Emergency braking of the heavy duty vehicles,<br />
especially the combinations, can be dangerou$, particularly<br />
on wet or icy roads having a low coefficient of<br />
adhesion. Locking of the wheels having important<br />
for a specified level of front wheet angte. This is<br />
equivalent to reducing the cornering stiffnesse$ of the<br />
front tircs.<br />
Returning to Figure 9, the a's and b's represent the<br />
influences of the hitch locations and the influences of<br />
the forces of constraint on the force and moment<br />
balances pertaining to each unit. The distance from<br />
the hitch to the center of gravity of a unit indicates<br />
the leverage that the associated force of constraint has<br />
on the yaw motion of the unit, Short lever arms to<br />
the rear hitch points of dollies generally mean that the<br />
force of constraint at the t'ront hitch point will be<br />
small. In addition, for semitrailcrs, if the rear hitch<br />
point is located near the "neutral force point", the<br />
force of constraint at the rear hitch has little influence<br />
on the force of constraint at the front hitch. The<br />
location of the neutral force point with respect to the<br />
center of gravity is given by the ratio of the "coupling<br />
between sideslip and yaw" divided by the "damping<br />
in sideslip." Although it may not be obvious in all<br />
cases, there are situations in which the steering<br />
sensitivities of the leading units of multi-articulated<br />
vehicles are not strongly influenced by the properties<br />
of the trailing units.<br />
Finally, note that the sideslip angles (p's) of the<br />
motions at the centers of gravity of each unit are<br />
shown in Figure 9. As indicated by the equations<br />
given in the figure, the sideslip angles and the yaw<br />
rate can be used to calculate the articulation angles<br />
(I's). ln addition to solving for the forces of ct:rnstraint<br />
at the front of each unit, the equations of<br />
turning equilibrium can be solved simultaneously for<br />
the sideslip angles of each unit. Hence, this approach<br />
could be used for calculating high speed offtracking in<br />
a manner that includes the influences of spread as<br />
well as tandem axle sets.<br />
consequences, lo$s of the trajectory eontrol, jackknifing,<br />
slipping of the trailer, the equipment and car<br />
manufacturers have devcloped the antilock devices.<br />
Some requirements exist since I972 into the regulation<br />
13 (ONU). The series fitting of the vehicles<br />
effectively started in 1980 and the experience permit'<br />
ted to complete these requirements in 1983 (EEC<br />
Directive 85/6471.<br />
The requirements ask to keep a good braking<br />
efficiency, a good stability, a low compressed air<br />
consumption and no wheel locking.<br />
755
So the manufacturers have adopted different techniques<br />
to give the priority either to the braking<br />
efficiency or to the stability, select high, select low,<br />
independent regulation.<br />
Furthermore, the compatibility between tractor and<br />
trailer shall be studied.<br />
The wheel speed information available to the onboard<br />
electronics from the antilock $ystem provides<br />
the basis for the future introduction of other functions<br />
such as antislip, retarder control, and speed<br />
limitation.<br />
Today, these functions are separated but, for the<br />
future, it can be supposed that they all will be<br />
integrated either on the braking system or on the fuel<br />
injection.<br />
<strong>Int</strong>roduction<br />
The ability of a vehicle to come to a stop over a<br />
short distance depends<br />
on the following three factors:<br />
l) The time it takes the driver to react to an<br />
external stimulus.<br />
2') The potential braking power of the vehicle,<br />
3) The friction coefficient between the tires and<br />
the road surface.<br />
Reaction time varies widely from driver to driver<br />
and thus cannot be considered to fall within the<br />
framework of regulation.<br />
I3raking power can be verified by a number of tests<br />
under load. Braking power carnot be put to effcctive<br />
use, however, unless it is carefully distributed to each<br />
of the axles and the friction between the tires and the<br />
road surface is sufficient to make use of it. If this is<br />
not the case, the $tability of the vehicle can be<br />
severely impaired by wheel blockage on individual<br />
axles. The results can be a loss of steerability,<br />
spinning or, for trailer vehicles, jackknifing.<br />
ln order, to solve these problems, vehicle and<br />
equipment manul'acturers have developed equipment<br />
that can detect the onset of wheel blockage and<br />
eliminate it by easing braking pressure.<br />
Principles of European Regulation<br />
These efforts at eliminating wheel blockage required<br />
that special stipulations be written into existing regulations<br />
to ensure that reasonably effective operation was<br />
maintained. One approach to the blockage problem,<br />
for example, wa$ to considcrably rcclucc braking<br />
pressure, which would not have been a satisfactory<br />
solution.<br />
It was for this reason that in t970. the United<br />
Nations Economic Commission for Europe established<br />
a sct of regulations in this area. This text bccame<br />
Appendix 13 ol'Regulation 13.<br />
The stipulations that were adopted cover the fbllowing<br />
points.<br />
756<br />
EXPERIMENTAL SAFETY VEHICLES<br />
The addition of antilock equipment must not significantly<br />
diminish braking effectiveness either on high<br />
adhesion or low adhesion road surfaces. This must be<br />
verificd for loaded and unloaded vehicles.<br />
The equipment must be effective enough to prevent<br />
thc whecls liom blocking even during hard braking or<br />
when the vehicle passes from a high adhesion to a low<br />
adhesion road surface.<br />
Antilock equipment that is used with brakingenergy<br />
reserve systems must not itself consume significant<br />
amounts of power. Braking effectiveness must<br />
remain sufficient even aller braking continuously tor<br />
15 to 20 seconds and applying rhe brake pedal lbur<br />
times in succession.<br />
Finally, neither the antilock equipment nor the<br />
braking systcm itself should be adversely affected by<br />
electrical or electromagnotic ficld$.<br />
Evolutions<br />
T'hese regulations enabled European manufacturers<br />
to market vehicles equipped with antilock equipment,<br />
which they did beginning in 1980. Four ro five years<br />
of expericnce with these systems demonstrated the<br />
need for modifications and additions to the original<br />
regulations, and in 1985 a working group was forrned<br />
to do this. This group published EEC Directive<br />
85/647, which included a new appendix on testing<br />
antilock equipment.<br />
The most irlportant points of this new directive are<br />
as follows.<br />
- Classification of antilock systems into three categories<br />
based on perforrnance<br />
r Category l: must ensure steerability, stability<br />
and cffectivc braking on split surfaces<br />
r Category 2: must ensure steerability and<br />
stability on split surfaces<br />
. Category 3: must ensure stability on uniform<br />
surfaces with low as well as high adhesion<br />
coefficients.<br />
- <strong>Int</strong>roduction of a split surface te$t that enables<br />
antilock devices to be categorized as defined above.<br />
These additions are such that the European countries<br />
are now prepared to require antilock equiprrrent<br />
on the types of vehicles included in the following<br />
table.<br />
Table 1.<br />
Buses, GVI{ } I2 T<br />
Seni-trailer tractors<br />
GVl4l}16T<br />
Carrier cspab16 of having a<br />
trailer and GVW<br />
) 16 T<br />
Trailers end semi-treiletB<br />
GVI{}IOT<br />
GVW<br />
r Gross Vehlcle y{eioht<br />
Category<br />
Category<br />
Cateqory I<br />
ABS on at least two<br />
wheels on each side
ABS Circuit Arrangements<br />
Vehicle and equipment manuf'acturer$ have developed<br />
different techniques in response to diflerent<br />
directives in the regulations. Thc solutions applied to<br />
motor vehicles have generally beerr the following (see<br />
Figure l).<br />
- One sensor and one trrake pressure control mechanism<br />
pcr whcel. This system, called independcnt wheel<br />
control or individual regulating systcm (1.R.), offers<br />
the advantage of making the maximum use of the<br />
adhesion potential of uniform road surfaces. It enables<br />
the maximum braking force to be applied to<br />
each wheel. The disadvantage of this system is that it<br />
creates torque that tends to spin the vehicle on its<br />
vertical axis. When applied to steered wheels, it can<br />
generate parasitic steering-wheel torque that interferes<br />
with steering.<br />
- One sensor for each wheel and one pressure<br />
controller for both wheels on tlle same axle. The<br />
pressure threshold for both wheels may set to the<br />
higher of the two friction coefficients read from the<br />
sensors: that is called select high regulating system<br />
(S.H.), but is more usually set to the lower of the two<br />
friction coefflcients read from the sensors. This is<br />
called select low regulating system (S.L.).<br />
The advantage of the select low regulating system is<br />
that brake drag is equalized, which ensures effective<br />
steering. The disadvantage is that it does not make<br />
use of the highest available friction coefficient on split<br />
road surfaces, with the result that it is less effective<br />
than the first system (1.R.).<br />
- f)ne sensor and one pressure controller per wheel,<br />
but with the additional ability to diminish the differences<br />
between braking forcesn and thus drag, applied<br />
to each wheel when the vehicle is braking on a surface<br />
that offer$ various friction cocfficients. This solution<br />
repre$ents a compromise between the mo.st effective<br />
braking and the best stability and this is called<br />
modified individual system (M.l.R.).<br />
Heavy vehicle manufacturers have used these solutions<br />
in concert, applying different solutions to different<br />
axles. Some examples of what has been done<br />
(Figures 2 to 4).<br />
The principles used to outfit motor vehicles with<br />
antilock have also been applied to trailers and semitrailers.<br />
The customary configurations are a$ irt figures<br />
5 to 7.<br />
Whichever solution is adopted for a motor vehicle,<br />
it always represents a comprornise between braking<br />
effectiveness on one hand and steerability and stability<br />
on the other.<br />
Further, when connecting a trailer or semi-trailer to<br />
a motor vehicle, differences in equipment performance<br />
can give ri$e to cornpatibility problems. A<br />
notable reflection of this can be seen in the effort.r put<br />
into improving vehicle coupling. The compatibility<br />
problem, which has been clearly recognized by manufacturers,<br />
requires that special care be taken in<br />
choosing equipment for each of the two coupled<br />
elements.<br />
Beginning with the principle of antilock and the<br />
parameters used in its operation, equiprnent manufacturers<br />
have also bccn thinking of other vehicle functions<br />
that could be introduced.<br />
The primary piece of information is wheel speed.<br />
What vehicle functions other than antilock de vice<br />
make use of this parameter?<br />
'<br />
t - lndication of vehicle speed by the chronotachograph<br />
2 - Speed limitation governor<br />
3 - Drive slip control<br />
The central nervous system of antilock and the<br />
functions mentioned above is the onboard processor.<br />
It follows that rhere is a possibility of making<br />
important progress in the areas mcntioned, as the<br />
speed information needed I'or all these functions now<br />
usually comes from independent sources.<br />
ELECTRONIC<br />
BRAKE PILOT SYSTEM ELEMENTS<br />
Chronotachographs now operate through a mechanical<br />
or electrical connection to the gear box. The<br />
speed limitation governor, which acts on the fuel<br />
injection pump through a control linkage, gets its<br />
information on vehicle speed from the chronotachograph.<br />
This information on speed, now used for the speed<br />
limitation function, could also be used for the antilock<br />
function.<br />
This same information on wheel speed could also be<br />
used in anti slip systems to control the power being<br />
delivered to the drive wheels when skidding occurs.<br />
Control would be through a device similar to that<br />
now used wirh the fuel injection pump to limit speed.<br />
(See figures I to l0).<br />
Thc speed information could be used to prompt a<br />
bricl'braking action on any found to be racing.<br />
Finally, the retarder considered to be an indispensible<br />
extension to the braking system should not<br />
impede antilock operation. French manufacturers<br />
757
uTAc ANTI-Loct( BBAKTNc EoT..FMENT ffiflm<br />
Flgure 1<br />
Flgure 2<br />
2 AXLES TRUCK<br />
UTAC ANTI-LOCK BHAKING EOI.FMENT<br />
3 AXLES TRUCK<br />
EXPERIMENTAL SAFETY VEHICLES<br />
UTAC ANTI-LOCK BRAKING EQUIPMENT<br />
Flgure 5<br />
Figure 6<br />
i-;--------.----r<br />
- r r : - l<br />
. q:-----J lF----J L-.:i I<br />
I<br />
5 AXLES TRAILER<br />
UIAC ANTI-LOCK BRAKING EQT.TPMENT<br />
: q-J<br />
--l<br />
l--r I<br />
I<br />
=l :l<br />
L<br />
3 AXLES SEMI-TRA!LER<br />
UTAC ANTFLOCK BRAKING EQIJPMENT<br />
| :=- a-,<br />
- ' a<br />
t--:al I<br />
, €E- -J €l<br />
'<br />
I =r f-{ --r<br />
t _I=t f =t =f '<br />
t - B d t i l [ l<br />
: Y--L :+ ; I<br />
| [_il____r]<br />
t<br />
I<br />
il _ll_ I<br />
r l{ frl ?1,<br />
r i- r i_ir-1 f-___tr<br />
I L- ts-.-<br />
:<br />
_ - J<br />
5 AXLES SEMI-TRAILER<br />
OFIVE SLP COfiITHOL<br />
HNGINE CONTROL
UTAC ORVE SLF CONTHOL<br />
Figure 9<br />
DIFFERENTIAL-BRAKE CONTROL<br />
have done important research in this area, and the<br />
TELMA Corporation has developed an interface that<br />
links the retardcr and antilock operations. This interface<br />
functions as described below.<br />
When the antilock control processor is actively<br />
regulating braking through the antilock function,<br />
retarder operation is temporarily inhihited.<br />
Once the processor cea$es regulating, retarder braking<br />
power is gradually brought back to full capacity<br />
unless the proce$sor intervenes with another comtnand<br />
to regulate the braking functions.<br />
This linkage makes it possible to prevent the<br />
retarder fronr degrading stability on slippery surfaces<br />
as well as to couple control of the retarder and brake<br />
operations.<br />
Figure 10<br />
COiEilATK I OF DHIVE STf GO'TITROI.<br />
Alf SFEED COVEHT{OH<br />
<strong>SECTION</strong> 4. TECHNICAL SESSIONS<br />
Flgure 11<br />
Conclusion<br />
In the near term, it is also possible to imagine<br />
individual wheel speed sensors linked to a single<br />
electronic controller that would enable the following<br />
as they are needed;<br />
I Speed information feedback for the driver<br />
r Antilock braking and retarder equipment<br />
. Speed limitation governor<br />
r Drive slip control.<br />
See figure ll.<br />
The grouping of all these functions will allow a<br />
diagnostic on the functioning state and a detection of<br />
pannes.<br />
See figure 12.<br />
Figure 12<br />
ELECTRONIC FUNCTIONS<br />
I<br />
7s9
EXPERIMENTAL SAFETY VEHICLES<br />
NHTSA'S Heavy Vehicle Brake ResearchProgram-An<br />
Overview<br />
Richard W. Radlinski.<br />
National Highway Traffic Safety<br />
Administration,<br />
United States<br />
Abstract<br />
The National Highway Traffic Safety Administration<br />
(NHTSA) has been conducting experiments to<br />
assess the braking performance ol heavy duty vehicles<br />
for a number of years. Many different types of<br />
vehicles have been tested and various aspects of<br />
braking performance have been evaluated. Experimcnts<br />
have included full scale vehicle tests on the test<br />
track, Iaboratory measurements on systems and components<br />
and dynamometer tests of brake assemblies<br />
and linings. Tests have included those which measure<br />
the status quo, as well as those which evaluate<br />
modifications and hardware designed to improve<br />
braking performance.<br />
This paper provides a<br />
Vehiclc Brake Program,<br />
areas and presents some<br />
and conclusions.<br />
Program History<br />
The National F{ighway Traffic Safety Administration<br />
(NHTSA) has been involved in research, testing<br />
and evaluation of heavy vehicle braking performance<br />
since the late 60's. NHTSA's first major effort was a<br />
large scale truck braking study conducted by the<br />
University of Michigan's Highway Safety Research<br />
Institute (HSRI). The objectives of this study, initiated<br />
in 1969 and completed in 1971, were to determine<br />
the braking perfonnance levels exhibited by<br />
current design buses, trucks and tractor trailers and to<br />
establish the maximum braking performance capabilities<br />
of these vehicles when equipped with difiercnt<br />
types of advanced brake system hardware.<br />
Much of the information developed in this study<br />
was utilized by the Agency in the formulation of<br />
Federal Motor Vehicle Safety Standard (F'MVSS) No.<br />
l2l, Air Brake S/s'ferns, which became cffective for<br />
trailers on January l, 1975, and trucks and buses on<br />
March I, 1975.<br />
In 1975 as production vehicles built to comply with<br />
FMVSS l2l became available, the Agency began to<br />
evaluate their performance and to compare it to that<br />
exhibited by vehicles built prior to FMVSS t2l. A<br />
vehicle test program was established at the NHTSA's<br />
Safety Research Lab (SRL) in Riverdale, Maryland.<br />
SRL utilized the track facilities at the U.S. Army<br />
Proving Ground in Aberdeen, Maryland, flor the<br />
necessary road tests. Also, as part of this program,<br />
SRL evaluated stability augmcntation devices (in-<br />
760<br />
brief history of the Heavy<br />
discusses major program<br />
of the significant findings<br />
cluding "anti-jackknife" devices) as possible alternatives<br />
to antilock brake systcms. This initial program at<br />
SRL was the genesis of the current program at<br />
NHTSA's Vehicle Research and Test Center (VRTC)<br />
in East Liberty, Ohio; the SRL is now a division of<br />
the VRTC.<br />
SRL's initial program was expanded to address<br />
various issues being raised as controversy surrounding<br />
FMVSS l2l began to grow. One of the major<br />
concerns within the trucking industry was the compatibility<br />
between the braking systems o[ pre and post<br />
FMVSS 12l vehicles. Many users reported that mixing<br />
pre and post FMVSS I21 vehicles in combinations<br />
(tractor-semitrailers, truck-full trailers, doublcs, etc)<br />
resulted irr dcgradcd brake performance. ln 1977, SRL<br />
tested a number of combination vehicles in various<br />
mixed configurations under a range of operating<br />
conditions on the test track. Many laboratory tests<br />
were also run.<br />
In 1978, two significant events occurred: 1) the<br />
NHTSA moved SRL from its Riverdale, Maryland,<br />
laboratory to the Transportation Research Center<br />
(TRC) in East Liberty, Ohio, to become one of the<br />
two major divisious within the newly created Vehicle<br />
Research and Test Center (VRTC) and 2) the Ninth<br />
Circuit Court of Appeals issued a decision invalidating<br />
the stopping distance requirements specified in<br />
FMVSS 121. This eliminated the regulatory need to<br />
install antilock on heavy vehicles.<br />
The move of SRL to Ohio slowed the progress of<br />
the program, but resultcd in SRL having convcnient<br />
access to extensive facilities ideally suited for heavy<br />
vehicle testing.<br />
The court decision had a significant impact on the<br />
scope and direction of the program. The Agency<br />
wanted to study the performance of trucks, buses and<br />
trailers built to conform to FMVSS 121 when antilock<br />
systems were removed. Also, many different issues<br />
were raised during the time period that the standard<br />
was fully in eff'ect that needed to be studicd. With<br />
improved facilities available and many problcms to<br />
address, NHTSA established the Heavy Duty Vehicle<br />
Brake Research Program (as it exists today) in 1979.<br />
This program, over the years, has addressed many<br />
different subjects relative to heavy vehicle braking.<br />
Vehicle road tests as well as laboratory and inertia<br />
dynamometer tests have been run. In addition to the<br />
in-house research at VRTC from 1979 to the present,<br />
the Agency has conducted research on heavy vehicle<br />
braking systems through contracts with private firms.<br />
This work includes a three-year in-fleet study of<br />
automatic brake adjuster performance and reliability,<br />
and a study of the benefits of retarders for heavy<br />
vehicles.
The purpose of the discussion which follows is to<br />
identify the major subject area$ that have been<br />
addressed in the NHTSA Heavy Vehicle Brake Frogram<br />
over the years, briefly describe what has been<br />
done in each area and report some of the more<br />
significant findings. The references at the end of the<br />
paper cover the program in more detail.<br />
Stopping Distrnce and Stability<br />
During Braking<br />
Stopping distance tests have been run on over 70<br />
different heavy vehicles. This group of vehicles con-<br />
sisted of buses, single unit trucks and combinations<br />
including tractor-semitrailers, truck-full trailers, doubles<br />
and triples. Vehicles were tested empty and fully<br />
Ioaded in straight line stops as well as braking and<br />
turning maneuvers. Various surfaces from dry pavement<br />
to ice were utilized. Although some of the tests<br />
were run with the driver fully applying the brake<br />
control (i.e., panic application) without limitations on<br />
wheel lockup and skidding, most testing was done to<br />
evaluate how quickly vehicles could stop under full<br />
directional control. This required that the driver<br />
modulate the brake control to minimize the amount<br />
of wheel lockup that occurred during the stop. Vehicle<br />
testing has been performed with fully operational<br />
brake systems as well as with simulated failures in the<br />
brake systems. Detailed results of all of these tests are<br />
given in References l-7.<br />
Approximately one fourth of the vehicles tested<br />
utilized hydraulic brake systems; the rest had air<br />
brakes, the most common system for hcavy vehicles.<br />
The test results indicate that rhe srable sropping<br />
capability of the various types of vehicles can be<br />
ranked as follows:<br />
Stopping Capability<br />
Ranking<br />
1 (best)<br />
2<br />
3<br />
4<br />
5 (worst)<br />
Vehicle Type<br />
Buses (empty and loaded)<br />
Loaded Tractor Trailers<br />
Loaded Trucks<br />
Empty Trucks and Tractor<br />
Trailers<br />
Bobtail Truck Tractors<br />
This ranking is essentially independent of road<br />
surface coefficient of friction and vehicle speed. The<br />
ranking applies to '*typical" configuration vehicles in<br />
these categories in either straight line braking or<br />
braking while turning maneuvers.<br />
Looking first at air lrraked vehicles (as currentll<br />
manufactured), Figure I shows the range of stable<br />
stopping distances that might be expected from 60<br />
mph on a straight dry road for the different types of<br />
air braked vehicles, assuming the brake systems are in<br />
good condition, burnished and fully adjusted. Performance<br />
of a typical passenger car is also shown in<br />
Figure I for reference.<br />
<strong>SECTION</strong> 4. TECHNICAL SESSIONS<br />
Buses perform best, primarily becruse under most<br />
conditions their braking force distribution is close to<br />
the normal force distribution on their axles. This<br />
allows buses to achieve maximum utilization of the<br />
tire/road friction force available at both axles before<br />
wheel lockup occurs. In effect, the buses have close to<br />
"ideal"<br />
braking distribution under most conditions.<br />
The front to rear weight distribution in a bus generally<br />
does not change substantially in going from the<br />
empty condition to the fully loaded condition due to<br />
the uniform nature of the Ioading. In addition,<br />
dynamic weight transfer in a bus is low due to a<br />
relatively low center of gravity height/wheelbase ratio,<br />
Loaded tractor trailers also perform relatively well<br />
during braking due to the fact that their braking<br />
distributions and axle normal force distributions are<br />
similar. They do not perform quite as well as buses,<br />
however, due to the fact that the percentage of<br />
braking on their front (steering) axles is less than<br />
ideal. Loaded trucks do not perform as well as Ioaded<br />
tractor trailers. They experience more weight transfer<br />
onto their front axles than Ioaded tractor trailers<br />
which cause$ the percentage of braking available at<br />
the front axles of the loaded trucks to be even further<br />
below ideal.<br />
The stable stopping capability of empty trucksn<br />
tractor,/trailers and, in particular, bobtail tractors is<br />
relatively poor. This is due to the lact that their<br />
braking systems, which are sized for the loaded<br />
condition and have fixed braking force distributions,<br />
produce too much braking at the rear (or trailer)<br />
axles. These axles decrease in weight by a much<br />
greater percentage than the front steering axles when<br />
the loads are removed. This results in premature<br />
lockup irnd a corresponding loss of lateral (side) force<br />
capability at the tires on the "light" axle(s) permitting<br />
vehicle instability at relatively low deceleration levels.<br />
ffit*<br />
'S4tS ffi.,#r*'",*<br />
-EJ-\ Lodd6d<br />
|ffi<br />
Truckg<br />
#lEmprvrrrcttt<br />
rrq lTdltrETrolhrg<br />
r6---EiiJ<br />
#s 9lS'#'<br />
Sbpphg olElorlce.{l<br />
Flguro 1. Stable stopping distance of heavy air braked<br />
vehlcles from S0 mph on dry siraight road<br />
76t
The problem is exaggerated if a vehicle has a short<br />
wheelbase and very lightly loaded rear axle which is<br />
why bobtail tractors exhibit the worst performance.<br />
In general, most of the air braked trucks and truck<br />
tractors tested were found to be "under braked" on<br />
their front axles in that they would not lock up their<br />
front wheels before their rear wheels at any load level<br />
on any of the test surfaces including ice. In addition,<br />
several of the vehicles were equipped with front axle<br />
automatic limiting valves (ALV's) which reduce front<br />
braking substantially when control line pressures are<br />
low. Since low control line pressures are utilized when<br />
vehicles are empty, these valves further upset or<br />
degrade braking distribution in a situation where it is<br />
already considerably less than ideal. Complete removal<br />
or deactivation of the front brakes, a practice<br />
which is common among some truck users, obviously<br />
degrades the situation even further. The use of ALV's<br />
or the removal of front brakes increases the chance of<br />
drive wheel or trailer wheel lockup which can lead to<br />
spin-out, jackknife, or trailer swing.<br />
Modification to test vehicles to increase the percentage<br />
of braking on the front axle such as removal of<br />
ALV's, increasing the size of brake chambers or<br />
installing variable brake proportioning systems<br />
(making braking distribution closer to ideal for<br />
straight line stops) resulted in optimum performance<br />
in the braking and turning case. Much shorter and<br />
more stable stops resulted in both cases. Increasing<br />
the front brake torque, however, did increase steering<br />
wheel pull when a vehicle was braked on an uneven<br />
coefficient of friction surface (difference in slipperi'<br />
ness left to right). This increase was insignificant if<br />
the vehicle was equipped with power steering and the<br />
steering axle had a low kingpin offset (scrub radius)<br />
but was quite significant when the vehicle had manual<br />
steering and a high kingpin offset. This indicates that<br />
steering $ystem design must be taken into account if<br />
consideration is given to increasing front brake torque<br />
Ievels substantially above those which now exist. lt<br />
may be necessary that vehicles have power steering<br />
and/or better steering geometry if greater levels of<br />
front brake torque are utilized.<br />
Current model heavy hydraulically braked trucks<br />
were found to perform somewhat better than air<br />
braked trucks.* Figure 2 shows the relative performance<br />
of typical trucks with air and hydraulic brakes.<br />
Performance of the hydraulically braked vehicles is<br />
better primarily because they are typically designed<br />
with higher torque front brakes and achieve better<br />
braking force distribution particularly when empty'<br />
.Class 6 and 7 singlc unit trucks and school bttscs are available from some<br />
manufacturers with either air or hydraulic brakes. Hydraulic brakes are<br />
standard on these vehicles and air brakes are oflered as an option. Because<br />
of thc irdditional complexity of the air brakc system the cost of such a system<br />
is higher.<br />
762<br />
EXPERIMENTAL SAFETY VEHICLES<br />
100 e00 300<br />
STOPFINB D]STANEE. ft<br />
r.lFAilBE FOF<br />
L I TYFICAL VEHICLEB<br />
Flgure 2. Relatlve performance of truckt equlpped<br />
wlth alr and hydraullc brakee-60 mph, dry<br />
road<br />
One point that should be made about the above<br />
discussion of stopping capability is that it is based on<br />
the premise that brakes are in good working order,<br />
burnished and fully adjusted. If this is not the case,<br />
total brake force output may not be sufficient to<br />
produce a very high deceleration when the vehicle is<br />
loaded, even if the brakes are fully applied. With<br />
degraded output brakes, higher loads result in poorer<br />
performance, just the opposite of the situation as<br />
discussed above where the fully loaded vehicles out<br />
performed the empty vehicles.<br />
Antilock<br />
NHTSA tested a number of vehicles (five power<br />
units, four trailers and one converter dolly) with<br />
production antilock systems between 1975 and 1977.<br />
These tests described in References 2 and 3 were<br />
primarily designed to evaluate the braking performance<br />
gains provided by the antilock systems and to<br />
evaluate compatibility of tractors and trailers with and<br />
without antilock in various "mixed" vehicle combinations.<br />
Straight line stops as well as braking and<br />
turning maneuvers were run with both empty and<br />
loaded vehicles on surfaces ranging from dry asphalt<br />
to wet Jennite (pavement sealer). Although these tests<br />
did not specifically include an evaluation of reliability<br />
and vehicle test mileage was generally low compared<br />
to typical truck user mileage, the operation of a group<br />
of antilock equipped test vehicles did provide some<br />
insight into the problems being reported by the truck<br />
users. Component failures, electrical connector and<br />
wiring problems, intermittent failure warning light<br />
operation, etc were experienced on some test vehicles.<br />
When the systems were operating properly, however,<br />
braking performance gains were significant. Vehicles<br />
stopped shorter and were much more controllable<br />
with the antilock in operation. Antilock on the front<br />
axle prevented loss ol' stcering, on the drive axle(s)<br />
prevented jackknifing and on the trailer axles prevented<br />
trailer swing. In terms of compatibility between<br />
vehicles with and without antilock there were
no cases found where havlng antllock on one vehicle<br />
or one zurle in a combination degraded performance.<br />
In fact, just the opposite was found. The application<br />
of antilock to any axle provided a braking performance<br />
improvement; the more axles that had antilock,<br />
the greater the improvement. This was found to be<br />
true with single unit vehicles, tractor semi trailers and<br />
doubles combinations.<br />
After the Court struck down the stopping distance<br />
requirements in FMVSS l2l in 1978, very few trucks,<br />
trailers, and buses were built with antilock systems<br />
and very few users attempted to keep existing systems<br />
operational. Use and production of antilock essentially<br />
dropped to the negligible level in the U.S. ln the<br />
meantime, however, interest in antilock began to grow<br />
out$ide the U.S., particualrly in Europe. Several<br />
European component manufacturers began producing<br />
second generation antilock systems and European<br />
vehicle manufacturers began offering them as optional<br />
equipment. Thousands of these systems are now in<br />
use in Europe and although no countries currently<br />
require antilock, several are considering issuing regulations<br />
mandating the systems on heavy vehicles.<br />
Two fleets in the U.S. are currently operating a<br />
small number of vehicles with one particular brand of<br />
European antilock. In early 1986, one of these fleets<br />
made a two-axle straight truck available to NHTSA<br />
for testing at VRTC. Reference 8 provides a detailed<br />
description of the NHTSA test program on this<br />
vehicle. Figure 3 shows a summary of the test results<br />
and indicates the percent improvement in stable stopping<br />
distance that resulted when the antilock was<br />
operational in various types of braking maneuvers.<br />
Figure 3 is based on comparing the performance of a<br />
skilled test driver modulating the brakes on the vehicle<br />
without the antilock to the performance of the antilock<br />
system. Performance improvement with the antilock<br />
for more typical drivers would be expected to be<br />
even greater than that shown in Figure 3. ln addition,<br />
Figure 3 assumes the driver has the presence of mind<br />
at#lt Ard.lr foli!h.d<br />
tuncr.t.<br />
Flgure 3. Percent lmprovement in controlled/steble<br />
otopplng distance with antilock-fulfi loaded<br />
vehicle<br />
l<br />
tm,ail/Y<br />
<strong>SECTION</strong> 4. TECHNICAL SESSIONS<br />
E**<br />
I**<br />
W*^<br />
to modulate the brakes if the wheels bcgin to lock. In<br />
an actual emergency on-road situation, this may not<br />
be the case: the driver may panic and lock the wheels<br />
skidding out of control.<br />
In addition to this two-axle truck, VRTC has<br />
recently completed tests on a European tractor-trailer<br />
combination equipped with antilock and is currently<br />
in the proces$ of testing a U.S. tractor-trailer combination<br />
with antilock. In the current tests, VRTC is<br />
evaluating the performance of a 'rstandard" European<br />
system as well as modified versions of the<br />
standard system with different (simplified) control<br />
strategies. The purpose of these tests i$ to quantify the<br />
performance gains provided by the different control<br />
strategies. Individual wheel control, axle-by-axle control<br />
and tandem control strategies are all being<br />
evaluated.<br />
In order to evaluate reliability of current antilock<br />
systems, NHTSA is planning to conduct (under contract)<br />
a two year fleet study of approximately 200<br />
vehicles with various available antilock systems. This<br />
program will start in about a year. Action to find a<br />
suitable on-board data acquisition system has already<br />
been initiated. This data acquisition system will be a<br />
relatively simple device not unlike commonly used<br />
electronic tachograph and will monitor antilock function<br />
while the vehicle is in operation in the fleet. The<br />
NHTSA will also follow (via a contractor) experience<br />
with antilock in Europe as well as Australia where<br />
there are also many systems in-use. In addition, the<br />
NHTSA will attempt to obtain as much information<br />
as possible on antilock equipped vehicles operating in<br />
the U.S. that are not specifically included in the 200<br />
vehicle fleet study.<br />
Tractor and Trailer Compatibility<br />
As mentioned earlier, compatibility between vehicles<br />
with and without antilock in combinations was studied<br />
by NHTSA in the late 70's. The subject of tractor<br />
and trailer brake system compatibility, however, is<br />
much broader than the issue of mixing vehicles with<br />
and without antilock. In fact, compatibility is a major<br />
area of concern today even though vehicles do not<br />
typically utilize antilock. ln general, compatibility<br />
refers to the braking system ou the tractor and the<br />
braking system on the trailer working together in<br />
harmony to provide desirable combination vehicle<br />
brake system durability antl braking performance. It<br />
is primarily determined by the transient and steady<br />
state brake force distribution existing at the various<br />
axles of thc combination vehicle.<br />
Both of these aspects of compatibility have been<br />
addressed in depth in the NHTSA research program<br />
over the years. The transient brake force distribution<br />
is strongly influenced by the flow characteristics or<br />
timing of the pneumatic system. Most of the NHTSA<br />
763
Trollor Brokgs<br />
Truclor Slow /Troller FoBl<br />
(go,00olb Vehicle)<br />
Tlme<br />
Figure 4. Klngpln force versus tlme for e panlc stop<br />
EXPERIMENTAL SAFETY VEHICLES<br />
research on pneumatic timing is described in Reference<br />
9. The time that it takes for the pressure at the<br />
brakes to reach a particular level after the pedal is<br />
applied is known as the apply timing; the time that it<br />
takes the pressure to be reduced to a specified low<br />
level is known as the release timing. Overall apply<br />
time is important because it determines how quickly<br />
full braking force is achieved; this has an influence on<br />
stopping distance. Relative apply time for tractors<br />
with respect to trailers is also important because it<br />
affects the coupling or "kingpin" force between the<br />
two units during braking. High coupling force is<br />
undesirable because it aggravates the jackknife situation.<br />
If the trailer brakes apply slow with respect to<br />
the tractor brakes, the trailer will tend to ,,bump" Irnolr<br />
lmrve<br />
ffi<br />
the<br />
tractor harder. Figure 4 shows results of actual<br />
measurements made on an 80.000 lb combination<br />
during a panic stop on dry pavement using a semitrailer<br />
with an instrumented kingpin. It can be seen in<br />
Figure 4 that when the tractor brakes apply fast with<br />
respect to the trailer brakes, overshoot in kingpin<br />
force occurs. This overshoot reaches the same level as<br />
the case where the trailer brakes are not working (i.e.,<br />
infinite trailer brake apply time). One point that<br />
should be made relative to Figure 4 is that even with<br />
the ideal case (trailer applies before the tractor) there<br />
is a substantial force at the kingpin.<br />
Recent test$ of typical late model vehicles(Reference<br />
l0) indicate that trailer brakes do not usually apply<br />
before tractor brakes. Figure 5 shows apply times (0<br />
to 60 psi) for nine tractor-semitrailers and six doubles<br />
combinations.<br />
Release timing is also important to vehicle stability<br />
although it has no effect on $topping distance. If a<br />
driver is applying his brakes in an emergency situation<br />
and locks the wheels, it is important that he be able to<br />
release the brakes as quickly as possible; otherwise he<br />
may skid out of control. Slow release times also affect<br />
brake temperature and wear.<br />
Steady state brake force distribution is very important<br />
to compatibility. NHTSA research in this area is<br />
covered in References 4 and 10. In sublimit braking<br />
rnarren<br />
4 5 8<br />
VEHICLE No,<br />
Flgure 5a, Apply time at each axle set*nine tractor<br />
semitrailere<br />
situations (i.e., well below the point of wheel lockup)<br />
brake forces must be balanced, otherwise excessive<br />
wear and temperature build-up will occur at the<br />
"overbraked"<br />
axle. ln limit braking situations, wheels<br />
on overbraked axles will lock up and skid prematurely.<br />
The input level at which braking force start$ to<br />
occur at each brake, known as the brake force<br />
threshold pres$ure, is a very critical parameter to<br />
compatibility. If brake force at the tractor starts to<br />
occur at an input level below that needed for the<br />
trailer braking to start or visa versa, brake temperature<br />
imbalance is probable in repeated or continuous<br />
low pressure braking situations (such as mountain<br />
grade descents). lf the vehicles are on low coefficient<br />
of friction surfaces, wheel lockup can occur prematurely.<br />
Figure 6 shows the final brake temperature on a<br />
tractor and trailer at the end of a 5 mile long 4go<br />
grade descent at 45 mph as a function of threshold<br />
pressure difference between the tractor and trailer.<br />
Only a 2 psi diffcrence in threshold pressure can make<br />
a difference of over 200oF in final brake temperature.<br />
Figure 7 shows the effect of threshold pressure<br />
difference on braking efficiency by comparing a<br />
combination with equal thresholds to one when the<br />
7&4<br />
sEc0N05<br />
!rnmr<br />
0,8<br />
lonrve<br />
ffi rnlrrrn r<br />
[.]oor,r v<br />
0,5 N<br />
ffiNffi<br />
rnaten a<br />
ffi<br />
!? L3<br />
VEIiICLE IIO.<br />
Flgure 5b. Apply tim6 at each axle set-six doublos<br />
combinatlons
e0<br />
E<br />
d| Eou<br />
E<br />
L<br />
F*o<br />
H ,oo<br />
1 1 3 4 5<br />
tIRSSEolJl PR$93. DIF ERBNCB.FTI<br />
Figure S. Brako temperatures for 4tf grade elmulatlon-flve<br />
mlles at 45 mph<br />
trailer threshold is 4 psi lower than that on the<br />
tractor. On low mu surfaces particularly with the<br />
empty vehicle, the drop in efficiency that occurs when<br />
threshold pressure is different is quite significant,.<br />
Brake Adjustment<br />
Both vehicle and inertia dynamometer tests have<br />
been run to determine the effect of adjustment on<br />
E<br />
f<br />
f<br />
I<br />
e<br />
I<br />
t<br />
n<br />
C<br />
U<br />
E rft<br />
J<br />
8e.<br />
6i.<br />
f 8 c<br />
I<br />
2e;<br />
c<br />
I<br />
t<br />
n<br />
6 c<br />
G<br />
u r .<br />
e.1 I<br />
0,c<br />
e,a<br />
\<br />
i--__<br />
TADEH<br />
r t t l<br />
e.r e.6 t,8 1.6<br />
Equat Thrssholds<br />
Trat lar ,lpot Lou<br />
UHLADEH<br />
o,a G.e Q,4 C.6 f .8 t.e<br />
Frtk TlrazRord Frlctlon (rul<br />
Flgure 7. Breklng elficiency tor tractor-semitraller<br />
combination with equal threshold pressures<br />
and 4 psi I'low" trsller threshold (or 4 psl<br />
"high" tracter threshold)<br />
<strong>SECTION</strong> 4. TECHNICAL SESSIONS<br />
Percent of Fully<br />
Adjusied Torque<br />
(ot 2OO"F)<br />
too<br />
\<br />
Mfgr's Recommerd€d<br />
Adjustment Ronge<br />
Figure 8. S-cam drum brake performance ae a function<br />
of adlustment level and drum tempetatu<br />
re<br />
braking system performance. This work is described<br />
in Reference.s ll and 12. It has been determined that<br />
the torque output of air braked heavy trucks is very<br />
sensitive to brake adjustment level. This is not the<br />
case for hydraulic brakes used on heavy trucks and<br />
most hydraulic brakes on cars and trucks are of the<br />
automatic adjusting type. The majority of truck air<br />
brake systems must be manually adjusted.<br />
Figure I shows the effect of brake adjustment on<br />
the output of a typical heavy duty air brake at two<br />
different temperature levels, 200oF and 600oF (temperature<br />
in the brake drum).<br />
The lower temperature repr€sents a relatively<br />
"cool"<br />
brake that has not been exposed to a great<br />
deal of repeated or continuous braking. The higher<br />
temperf,ture represent$ a relatively "hot" brake, and<br />
is typical for a mountain descent although it is by no<br />
means the maximum temperature that a brake might<br />
experience in service. Figure 8 is for an S-cam drum<br />
type brake, used on the majority (over 90 percent) of<br />
heavy duty air braked vehicles.<br />
Adjustment level in Figure I represents the stroke<br />
of the air brake actuator (chamber) when the pressure<br />
in the actuator is 100 psi and the brake is at ambient<br />
temperature. Normally for the brake shown, the<br />
stroke of the actuator at 100 psi with the brake fully<br />
adjusted is approxirnately I.5 inches; this stroke is<br />
required to take up the slack and deflection in the<br />
system. As the brake shoe wears, the stroke increases<br />
\ t\\<br />
t \\tI<br />
e.5<br />
Adjustment Level(in.)<br />
ZOO"F Drum<br />
\ t<br />
b 6oo"F Drum<br />
765
due to the greater actuator travel necessary t6 move<br />
the brake shoes out against the brake drum. For this<br />
particular brake, the manufacturer recommends that<br />
the brake be readjusted when the stroke reaches 2.0<br />
inches although the actuator actually has a full travel<br />
of approximately 2.5 inches.<br />
It can be seen from Figure 8 that at 200oF brake<br />
temperature, brake torque continually drops as adjustment<br />
level degrades from the fully adjusted level. This<br />
is true even over the manufacturerts recommended<br />
adjustment range; at the recommended readjustment<br />
point (2.0 inches) the torque has dropped to 85<br />
percent of its fully adjusted level. When the brake is<br />
hot (600"F), there is a drop to 85 percent even when<br />
the brake is fully adjusted. This drop is due to two<br />
factors: l) brake lining fade at the elevated temperature<br />
and, 2) brake drum expansion which results in an<br />
actuator stroke increase. Brake torque is reduced to<br />
50 percent compared to a fully adjusted cool brake,<br />
when adjustment reaches the mauufacturer's recommended<br />
readjustment point. This is a signifiicant drop<br />
even though brake adjustment is considered to be<br />
acceptable in terms of the manufacturer's recommendations.<br />
Under this condition, the brake can only<br />
develop on half of the torque it could ii it was fully<br />
adjusted and cool. Beyond the manufacturer's recommended<br />
adjustment range brake torque drop is even<br />
more dramatic, particularly if the brake is hot.<br />
Reduced brake torque due to brakes being out-ofadjustment<br />
affects the brake force balance and overall<br />
braking capacity of the vehicle. As a result, not ouly<br />
is limit performance stopping ability affected, but<br />
downhill operations also become more prone to brake<br />
fade and runaway.<br />
Figure 9 shows the results of limit performance<br />
stopping distance tests conducted on a fully loaded<br />
6x4 truck at two different adjustment levels: l) fully<br />
adjusted, and 2) at the manufacturer's recommended<br />
readjustment point. Both cool brakes (200"F) and hot<br />
brakes (600'F) are shown. Beyond the manufacturer's<br />
recommended adjustment range the stopping distance<br />
tm E06 300 400 !00 @0 ?00 d,0<br />
Figure L Stopplng distance of fully loaded truck at<br />
two brake adiustment levels (60 mph-dry<br />
road)<br />
766<br />
EXPERTMENTAL SAFETY VEHICLES<br />
of the vehicle would be even longer than that shown<br />
in Figure 9.<br />
Brake adjustment primarily affects the stopping<br />
capability of trucks when they are loaded; this is<br />
where maximum brake torque is needed to decelerate<br />
vehicle mass. With an empty vehicle, more than<br />
enough brake torque is usually available to lock the<br />
rear wheels despite the level of adjustment, unless<br />
adjustment is so poor that practically no torque is<br />
generated.<br />
Retarders<br />
Research performed under contract by the University<br />
of Michigan to evaluate the benefits of retarders<br />
for heavy vehicles(References 13,14,15) indicates that<br />
these devices can extend brake life and reduce the<br />
possibility of runaways on downgrades. VRTC, working<br />
in cooperation with the University of Michigan,<br />
conducted full scale vehicle tests to determine what<br />
effect these devices have on vehicle stability and<br />
stopping performance in limit braking maneuvers.<br />
Reference 16 describes this effort. The results of tests<br />
on two different combination vehicles indicate that in<br />
limit braking maneuvers, retarders can increase the<br />
stable stopping distances. Since most U.S. vehicles are<br />
"overbraked"<br />
on their drive axles, retarders (most<br />
commonly used retarders act through the drive axle)<br />
tend to upset brake force distribution even further.<br />
With retarders in operation, drivers must modulate<br />
the service brake control to an even greater degree to<br />
avoid wheel lockup and jackknife. Table I shows test<br />
results for braking tests on wet Jennite curves. Both<br />
of the vehicles use "engine brake" type retarders.<br />
Use of retarders without applying the service brakes<br />
can also affect vehicle stability. Since retarders, in<br />
effect, utilize longitudinal friction at the tire/road<br />
interface, they reduce the lateral friction available for<br />
cornering. The maximum safe speed for entering a<br />
curve is reduced whcn the retarder is "on".<br />
In<br />
addition, loss of control at the limit speed can change<br />
from a stable "plow out" mode with the retarder<br />
"off"<br />
to an unstable jackknife mode if the retarder is<br />
'*ontt.<br />
In order to warn retarder users of the potential for<br />
stability problems, NHTSA has prepared an infbrma-<br />
Table t. Effoct of reterdeE on stable stopping dis.<br />
tancB In sllppery curyes.<br />
vchtcls ldsdtnr<br />
6x4-3? Enpty Tratler<br />
Efrpty Trsllsr<br />
Bobtstt<br />
4x2-sl Enpty TrslI€r<br />
Empty Tratler<br />
Londcd lrstlcr<br />
CurvG<br />
Radtug<br />
( fr.)<br />
200<br />
500<br />
200<br />
200<br />
500<br />
?00<br />
Best In-kne<br />
Inltlal<br />
sp€ed<br />
(nrh) 9,/0Rclard+r U/tret{rder<br />
25<br />
40<br />
25<br />
88 95<br />
3lr 123<br />
98 t23<br />
88 98<br />
183 224<br />
98 tO3
tional booklet(Reference 17) and given it widespread<br />
distribution in the trucking community. This booklet<br />
encourages the installatiorr of retarders on vehicles<br />
since they do offer safety benefits and can extend<br />
brake system tife significantly. The booklet, however,<br />
cautions against use of retarders (all types are usually<br />
controlled by an in-cab switch) in situations where the<br />
vehicle is empty and/or the road slippery.<br />
Anti-Jackknife Devices<br />
ln 1975, NHTSA tested $everal different anti-<br />
<strong>SECTION</strong> 4. TECHNICAL SESSIONS<br />
jackknife devices on several different combination<br />
vehicles. Brake-in-a-curve, brake-during-a-lane-change<br />
and straight line braking tests were run on several<br />
different surfaces. Although these devices restrict<br />
articulation and prevent the tractor from hitting the<br />
trailer, they do not prevent wheel lock, and thus do<br />
not cure the basic instability problem' Figure l0<br />
shows a tractor trailer both with and without an<br />
anti-jackknife device. Without the anti-jackknife device,<br />
the vehicle could jackkniie if the tractor wheels<br />
Iock. With such a clevice the vehicle will not jackknife<br />
but could spin as an entire unit (possibly across<br />
several Ianes of traffic). In effect, the combination<br />
becomes a "long" straight truck.<br />
Anti-jackknife devices will improve vehicle stability<br />
if the trailer wheels are kept rolling'+ In this case, the<br />
trailer acts as a "rudder" Figure 10. Loee of stability with and without antl'<br />
iackknife device<br />
the trailer cannot be sensed by most tractors' Even if<br />
for the combination vehicle. the trailer has a large leak, the tractor worlld still be<br />
Most U.S. vehicles when empty, however, have their able to maintain full reservoir pressure and would<br />
brakes balanced such that the first axle to lock on thus not give the clriver any indication of the problem<br />
increasing brake input are those on the trailer' In a on the trailer. Unfortunately, in this catie, the tractor<br />
panic situation, full application of the brakes almost low pressure warning light and buzzer which senses<br />
always locks the trailer brakes' It, therefore, cannot tractor reservoir pressure is no help in the event of<br />
be assumed that the trailer wheels will be rolling in trailer failures.<br />
limit or emergency brakirrg lnaneuvers.<br />
Trailer Emergency Systems<br />
A number of tests have been run to determine if the<br />
pneumatic systems tln trailers could be simplified.<br />
This work, describetl in Relerence 18, was performed<br />
in lieht of comments on a notice of proposed rulemaking<br />
to modify thc requirements of FMVSS No'<br />
l2l. Full scale vehicle tests, inertia dynamometer tests<br />
and laboratory tests of trailer pneumatic system<br />
"mockups" were performed. The results of these tests<br />
indicated that simplification would be possible but<br />
that care must be taken to avoid systems that pernlit<br />
spring (parking) brake drag withoLtt warning the<br />
driver. lt was found that drivers could not feel spring<br />
brake drag even though it was occurring to the point<br />
of overheating and rcducing the effectiveness of the<br />
brake system. It was also found in these tests that<br />
typical tractor plumbing is so restrictive in its delivery<br />
of supply air to the trailer that pneumatic failures on<br />
tsote pto-otetg of thac devicet demonstratc them in tests with the trailer<br />
brakes turned off, an unrealistic operating condition<br />
Wlthouf<br />
Anti - Jockknife<br />
Device<br />
Performance of U'S, Versus European<br />
Vehicles<br />
Comparative testing of a European tractor semitrailer<br />
built to meet European brake standards (and<br />
not equipped with antiloc-k) and a U.S. combination<br />
of equivalent siee and weight has been performed'<br />
Many different types of braking maneuvers (straight<br />
line, curves, and lane changes), various surfaces and<br />
different vehicle loads have been included in these<br />
tests. Since this work has only recently been completecl<br />
the report describing this effort in detail has<br />
not yet been published. The basic conclusion reached<br />
from these tests, however, is that the braking performance<br />
of the European combination is generally<br />
superior to that of the U.S. combination although the<br />
difference in performance was much smaller than<br />
expected. The European vehicle had the samc brake<br />
on the front axle as on each rear axle and load<br />
sensing proportioning systems on the drive and trailer<br />
axles ancl this provided a more optimum brake force<br />
distribution over the range of operating conditions'<br />
't67
The only tests where performance was greatly different,<br />
however, wcre those with the bobtail tractors_<br />
the European tractor stopped much shorter and was<br />
easier to control during braking. When a simple<br />
bobtail proportioning sysrem+ was added to the U.S.<br />
vehicle, however, the performance of the two tractors<br />
was essentially the same.<br />
Brake Linings<br />
During the last year, dynamometer tests have been<br />
run to investigate the performance of heavy vehicle<br />
brake linings. This research which is expected to<br />
continue for at least another year is addreising two<br />
issues: I) Iining performance variability, Z) dif't'erences<br />
between asbestos and non-asbestos linings. Lining<br />
performance variability is important because it deter_<br />
mines how closely brake force balance and braking<br />
efficiency can be controlled. This impacts tractor and<br />
trailer compatibility as well.<br />
Understanding the performance characteristics of<br />
non-asbestos Iinings is important because they may be<br />
the only type of linings available in the future. Many<br />
vehicle manufacturers are now using them and EpA<br />
has proposed the complete elimination of asbestos in<br />
brake linings.<br />
Data from this research effort will be made avail_<br />
able to the SAE subcommittee rhar is currently<br />
developing new test procedures and rating schemes for<br />
brake linings. The SAE subcommittee is ittempting to<br />
replace current SAE Recommended practices for<br />
brake linings that are known to be inadequate. The<br />
data will also be provided to the SAE subcommittee<br />
that is developing Recommended practices for tractor<br />
and trailer brake system compatibility.<br />
Summary and Conclusions<br />
NHTSA has heen conducting research on heavy<br />
vehicle braking since l969. Over the years many<br />
vehicles have been tested and many issues have been<br />
addressed. As a result of this effort, the braking<br />
performance characteristics of heavy vehicles are well<br />
understood and perfotmance deflciencies have been<br />
identified. There is a large gap between the perfor_<br />
mance of passenger cars and heavy trucks and al_<br />
though this gap may never be completely bridged,<br />
significant improvements are possible.<br />
References<br />
l. Murphy, R.W., Limpert, R. and Segal, L.,<br />
"Bus,<br />
Truck, Tractor-Triler Brking System performance,<br />
Volume I or Z: Research Findings,"<br />
Final Report, University of Michigan Highway<br />
Safety Research Institute, DOT NHTSA Contract<br />
Number FH-l l-7290. March 1971.<br />
fThis system is available es en option on 6ome U.S. tractors. It reduces<br />
pressure to the drive axle brakes whcn a trailer i$ not connected td lhc<br />
tractor,<br />
768<br />
EXPERIMENTAL SAFETY VEHICLES<br />
Z. Radlinski, R.W., .,Air Braked Vehicle perfor_<br />
mance: FMVSS No. l2l Braking Systems Versus<br />
Pre-FMVSS No. l2l Braking Systems and Sta_<br />
bility Augmentation Devices," U.S. Department<br />
of Transportation Report Number DOT HS_gOl<br />
967, Augusr 1976.<br />
3. "Technical Assessment of FMVSS l2l_Air<br />
Brake Systems," A Report of the FMVSS l2l<br />
Task Force, U.S. Department of Transportation,<br />
February 24,1978.<br />
4. Radlinski, R.W. and Williams, S.F.. ,.NHTSA<br />
Heavy Duty Vehicle Brake Research program<br />
Report No. l-Sropping Capability of Air<br />
Braked Vehicles," Volume l-Technical Report,<br />
Report No. DOT HS 806 738, April 1g85.<br />
5. Kirkbride, R.L. and Radlinski, R.W., ,.NHTSA<br />
Heavy Duty Vehicle Brake Research program<br />
Report No. 4-Stopping Capability of Hydrauli_<br />
cally Braked Vehicles-Volume l: Technical<br />
Report," National Highway Trafl'ic Safety Ad_<br />
ministration, Report Number DOT HS 906 860.<br />
October 1985.<br />
6. Radlinski, R.W. and Flick, M.A., ,,A Demon_<br />
stration of the Safety Benefits of Front Brakes<br />
on Heavy Trucks," Vehicle Research ancl Test<br />
Center Final Report No. DOT-HS-807<br />
061, De_<br />
cember 1986.<br />
7. Garrott, W.R., Cuenther, D., Houk, R., Lin,<br />
J., and Martin, M., ,.Improvement<br />
of Methods<br />
for Determining pre-Crash parameters From<br />
Skid Marks," National Highway Traffic Safety<br />
Administration, Final Report, Report Number<br />
DOT HS 806 063, May t98t.<br />
8. Radlinski, Richard W. and Bell, Steven C.,<br />
"NHTSA Heavy Duty Vehicle Brake Research<br />
Program Report No. 6-performance Evaluation<br />
of a Production Antilock System Installed on a<br />
Two Axle Straight Truck," Vehicle Research<br />
and<br />
Test Center, Reporr Number DOT HS g06,<br />
August 1986.<br />
9. Radlinski, R.W. and Williams, S.F., *.NHTSA<br />
Heavy Duty Vehicle Brake Research program<br />
Report No. S-Pneumatic Timing," Vehicle Re_<br />
search and Test Center, Report Number DOT<br />
HS 806 897, December 1985.<br />
10. Radlinski, R.W. and Flick, M.A., ..Tractor and<br />
Trailer Brake System Compatibility," SAE pa_<br />
per Number 861942, November lgg6.<br />
It. Radlinski, R.W., Williams, S.F. and Machey,<br />
J.M., "The Importance of Maintaining Air<br />
Brake Adju$tment," Society of Automotive Engineers,<br />
Paper Number 821263, November 19g2.<br />
12. Radlinski, R.W. and Williams, S.F., ,.NHTSA<br />
Heavy Duty Vehicle Brake Research program<br />
Report No. Z-The Effect of Adjustment on Air<br />
Brake Performance," National Highway Traffic
Safety Administration, Report Number DOT HS<br />
806 ?40, April 1985.<br />
13. Fancher, P., O'Day, J., Bunch, H., Sayers, M.<br />
and Winkler, C.,<br />
14.<br />
15.<br />
"Retarders for Heavy Vehicles:<br />
Evaluation of Perforrnance Characteristics and<br />
In-Service Costs-Vol. I: Technical Report," University<br />
of Michigan Transportation Research Institute,<br />
Report Number DOT HS 805 807, February<br />
1981.<br />
Fancher, P.S., O'Day, J. and Winkler, C.8.,<br />
"Retarders<br />
for Heavy Vehiclesl Phase II Field<br />
Evaluations," University of Michigan Transportation<br />
Research Institute, Report Number DOT<br />
HS 806 297, June 1982.<br />
Fancher, P.S. and Winkler, C.8., "Retarders<br />
for Heavy Vehicles: Phase III, Experimentation<br />
and Analysis; Performance, Brake Savings, and<br />
<strong>SECTION</strong> 4. TECHNICAL SESSIONS<br />
Vehicle Stability," University of Michigan<br />
Transportation Research Institute, Report Number<br />
DOT HS 806 672, January 1984.<br />
Fancher, P.S. and Radlinski, R.W,, "Directional<br />
Control of Retarder Equipped Heavy Trucks<br />
Operating on Slippery Surfaces," SAE Paper<br />
No. 831788, November I983.<br />
"A<br />
Professional Truck Driver's Guide on the<br />
Use of Retarders," National Highway Traffic<br />
Safety Administration, Report Number DOT HS<br />
806 675, January 1985.<br />
Radlinski, R.W. and Williams, S.F., "NHTSA<br />
I6.<br />
t7.<br />
18.<br />
Heavy Duty Vehicle Brake Research Program<br />
Report No. 3-Evaluation of Parking and Emergency<br />
Pneumatic Systems on Air Braked Trailers,"<br />
Vehicle Research and Test Center, Report<br />
Number DOT HS 806 757, May 1985.