the florida state university college of arts and sciences evolution of ...
the florida state university college of arts and sciences evolution of ...
the florida state university college of arts and sciences evolution of ...
You also want an ePaper? Increase the reach of your titles
YUMPU automatically turns print PDFs into web optimized ePapers that Google loves.
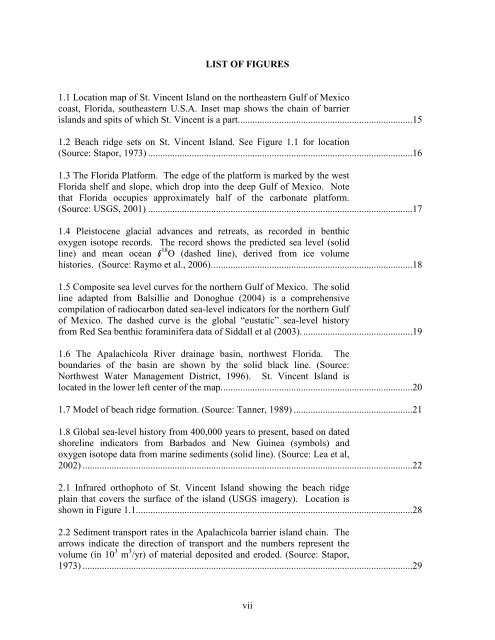
LIST OF FIGURES<br />
1.1 Location map <strong>of</strong> St. Vincent Isl<strong>and</strong> on <strong>the</strong> nor<strong>the</strong>astern Gulf <strong>of</strong> Mexico<br />
coast, Florida, sou<strong>the</strong>astern U.S.A. Inset map shows <strong>the</strong> chain <strong>of</strong> barrier<br />
isl<strong>and</strong>s <strong>and</strong> spits <strong>of</strong> which St. Vincent is a part........................................................................15<br />
1.2 Beach ridge sets on St. Vincent Isl<strong>and</strong>. See Figure 1.1 for location<br />
(Source: Stapor, 1973) .............................................................................................................16<br />
1.3 The Florida Platform. The edge <strong>of</strong> <strong>the</strong> platform is marked by <strong>the</strong> west<br />
Florida shelf <strong>and</strong> slope, which drop into <strong>the</strong> deep Gulf <strong>of</strong> Mexico. Note<br />
that Florida occupies approximately half <strong>of</strong> <strong>the</strong> carbonate platform.<br />
(Source: USGS, 2001) .............................................................................................................17<br />
1.4 Pleistocene glacial advances <strong>and</strong> retreats, as recorded in benthic<br />
oxygen isotope records. The record shows <strong>the</strong> predicted sea level (solid<br />
18<br />
line) <strong>and</strong> mean ocean O (dashed line), derived from ice volume<br />
histories. (Source: Raymo et al., 2006)...................................................................................18<br />
1.5 Composite sea level curves for <strong>the</strong> nor<strong>the</strong>rn Gulf <strong>of</strong> Mexico. The solid<br />
line adapted from Balsillie <strong>and</strong> Donoghue (2004) is a comprehensive<br />
compilation <strong>of</strong> radiocarbon dated sea-level indicators for <strong>the</strong> nor<strong>the</strong>rn Gulf<br />
<strong>of</strong> Mexico. The dashed curve is <strong>the</strong> global “eustatic” sea-level history<br />
from Red Sea benthic foraminifera data <strong>of</strong> Siddall et al (2003). .............................................19<br />
1.6 The Apalachicola River drainage basin, northwest Florida. The<br />
boundaries <strong>of</strong> <strong>the</strong> basin are shown by <strong>the</strong> solid black line. (Source:<br />
Northwest Water Management District, 1996). St. Vincent Isl<strong>and</strong> is<br />
located in <strong>the</strong> lower left center <strong>of</strong> <strong>the</strong> map...............................................................................20<br />
1.7 Model <strong>of</strong> beach ridge formation. (Source: Tanner, 1989) .................................................21<br />
1.8 Global sea-level history from 400,000 years to present, based on dated<br />
shoreline indicators from Barbados <strong>and</strong> New Guinea (symbols) <strong>and</strong><br />
oxygen isotope data from marine sediments (solid line). (Source: Lea et al,<br />
2002) ........................................................................................................................................22<br />
2.1 Infrared orthophoto <strong>of</strong> St. Vincent Isl<strong>and</strong> showing <strong>the</strong> beach ridge<br />
plain that covers <strong>the</strong> surface <strong>of</strong> <strong>the</strong> isl<strong>and</strong> (USGS imagery). Location is<br />
shown in Figure 1.1..................................................................................................................28<br />
2.2 Sediment transport rates in <strong>the</strong> Apalachicola barrier isl<strong>and</strong> chain. The<br />
arrows indicate <strong>the</strong> direction <strong>of</strong> transport <strong>and</strong> <strong>the</strong> numbers represent <strong>the</strong><br />
volume (in 10 3 m 3 /yr) <strong>of</strong> material deposited <strong>and</strong> eroded. (Source: Stapor,<br />
1973) ........................................................................................................................................29<br />
vii


