- Page 1 and 2: THE FLORIDA STATE UNIVERSITY COLLEG
- Page 3 and 4: ACKNOWLEDGEMENTS I would like to th
- Page 5 and 6: 4. RESULTS Laboratory Analyses ....
- Page 7 and 8: LIST OF FIGURES 1.1 Location map of
- Page 9 and 10: preheating is carried out on a heat
- Page 11 and 12: 4.17 Site SVI 023. a) Trench. b) Sa
- Page 13 and 14: 4.38 Location relative to the Apala
- Page 15 and 16: A.37 Granplot analysis of sample 05
- Page 17 and 18: A.83 Granplot analysis of sample 05
- Page 19 and 20: ABSTRACT The goal of this investiga
- Page 21 and 22: 4) To further develop Optically Sti
- Page 23 and 24: the rate of erosion or deposition a
- Page 25 and 26: esult of the buildup of offshore ba
- Page 27 and 28: Recent studies of barriers using Gr
- Page 29 and 30: and, therefore, sea level) (Dorsey,
- Page 31 and 32: Holocene Sea Level Over 900 Holocen
- Page 33 and 34: first is that sea level rose steadi
- Page 35 and 36: Figure 1.2. Beach ridge sets on St.
- Page 37: -100 Figure 1.4. Pleistocene glacia
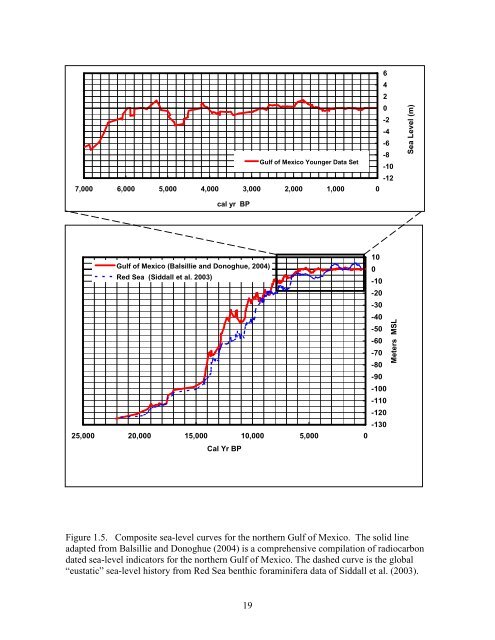
- Page 41 and 42: Figure 1.8. Global sea-level histor
- Page 43 and 44: K and L have crest elevations of ap
- Page 45 and 46: Geoarchaeology The earliest inhabit
- Page 47 and 48: Oyster Pond Figure 2.1. Infrared or
- Page 49 and 50: Figure 2.3. St. Vincent Island shor
- Page 51 and 52: Pickalene Middens Paradise Point Si
- Page 53 and 54: At each vibracore or trench locatio
- Page 55 and 56: luminescence signal equivalent to t
- Page 57 and 58: Application of OSL to Coastal Studi
- Page 59 and 60: atio between the first and the fift
- Page 61 and 62: Topographic Surveying Topographic s
- Page 63 and 64: time elapsed between when this ener
- Page 65 and 66: a) b) Figure 3.1. a) Collecting a v
- Page 67 and 68: Increasing energy T CONDUCTION BAND
- Page 69 and 70: Figure 3.5. Sample removed from lar
- Page 71 and 72: Figure 3.7. Location of samples col
- Page 73 and 74: Figure 3.9. Basis of airborne LIDAR
- Page 75 and 76: Sample Sites CHAPTER 4 RESULTS A to
- Page 77 and 78: SVI005 This site is located just we
- Page 79 and 80: collapsed the trench. Therefore, a
- Page 81 and 82: SVI025 This site is located within
- Page 83 and 84: m and 3.7 m respectively. A cross s
- Page 85 and 86: Vincent Island has changed little o
- Page 87 and 88: (sorting). Standard deviation decre
- Page 89 and 90:
4,100 and 3,500 years ago. The corr
- Page 91 and 92:
Table 4.1 Continued Site Samples Be
- Page 93 and 94:
Table 4.3. Measured elevations of S
- Page 95 and 96:
Table 4.5. Application of Tanner’
- Page 97 and 98:
Table 4.7. OSL age calculations usi
- Page 99 and 100:
Table 4.9. Paleosealevel position e
- Page 101 and 102:
Figure 4.2. Example of a trench thr
- Page 103 and 104:
Figure 4.5. Site SVI 003. Trench ex
- Page 105 and 106:
a) b) 050505-01E 050505-01K 050505-
- Page 107 and 108:
a) b) 050505-04C 050505-04A Figure
- Page 109 and 110:
Figure 4.13. Site SVI 015. Vibracor
- Page 111 and 112:
a) b) 011006-15 011006-16 Figure 4.
- Page 113 and 114:
a) b) 011106-08 011106-07 011106-10
- Page 115 and 116:
Figure 4.21. Dutch gouge-auger core
- Page 117 and 118:
Figure 4.23. Line A-A’ represents
- Page 119 and 120:
Elevation (m) NAVD 88 5.00 4.50 4.0
- Page 121 and 122:
1200 +/- 100 yr 102 Figure 4.27. GP
- Page 123 and 124:
0.65 Set C 0.6 0.55 0.5 Set A 0.45
- Page 125 and 126:
6 Set B Set C Set E 5 Set A Set F S
- Page 127 and 128:
0.7 Set C 0.6 Set A 0.5 Set E Set F
- Page 129 and 130:
ENVIRONMENTS OF DEPOSITION -- SKEWN
- Page 131 and 132:
mean grain size (phi) 3 2.5 2 1.5 1
- Page 133 and 134:
SVI 015 SVI 002 SVI 003 114 SVI 004
- Page 135 and 136:
CHAPTER 5 DISCUSSION The beach ridg
- Page 137 and 138:
vibracore or trench, both of which
- Page 139 and 140:
Skewness can be used to identify th
- Page 141 and 142:
island. Another is a C-14 date of 2
- Page 143 and 144:
sea level. It was at this point tha
- Page 145 and 146:
The fourth hypothesis was that sea-
- Page 147 and 148:
APPENDIX A INDIVIDUAL SIEVE ANALYSI
- Page 149 and 150:
99.99 99.97 99.9 99.7 99 97.5 95 90
- Page 151 and 152:
99.99 99.97 99.9 99.7 99 97.5 95 90
- Page 153 and 154:
99.99 99.97 99.9 99.7 99 97.5 95 90
- Page 155 and 156:
99.99 99.97 99.9 99.7 99 97.5 95 90
- Page 157 and 158:
99.99 99.97 99.9 99.7 99 97.5 95 90
- Page 159 and 160:
99.99 99.97 99.9 99.7 99 97.5 95 90
- Page 161 and 162:
99.99 99.97 99.9 99.7 99 97.5 95 90
- Page 163 and 164:
99.99 99.97 99.9 99.7 99 97.5 95 90
- Page 165 and 166:
99.99 99.97 99.9 99.7 99 97.5 95 90
- Page 167 and 168:
99.99 99.97 99.9 99.7 99 97.5 95 90
- Page 169 and 170:
99.99 99.97 99.9 99.7 99 97.5 95 90
- Page 171 and 172:
99.99 99.97 99.9 99.7 99 97.5 95 90
- Page 173 and 174:
99.99 99.97 99.9 99.7 99 97.5 95 90
- Page 175 and 176:
99.99 99.97 99.9 99.7 99 97.5 95 90
- Page 177 and 178:
99.99 99.97 99.9 99.7 99 97.5 95 90
- Page 179 and 180:
99.99 99.97 99.9 99.7 99 97.5 95 90
- Page 181 and 182:
99.99 99.97 99.9 99.7 99 97.5 95 90
- Page 183 and 184:
99.99 99.97 99.9 99.7 99 97.5 95 90
- Page 185 and 186:
99.99 99.97 99.9 99.7 99 97.5 95 90
- Page 187 and 188:
99.99 99.97 99.9 99.7 99 97.5 95 90
- Page 189 and 190:
99.99 99.97 99.9 99.7 99 97.5 95 90
- Page 191 and 192:
99.99 99.97 99.9 99.7 99 97.5 95 90
- Page 193 and 194:
99.99 99.97 99.9 99.7 99 97.5 95 90
- Page 195 and 196:
99.99 99.97 99.9 99.7 99 97.5 95 90
- Page 197 and 198:
99.99 99.97 99.9 99.7 99 97.5 95 90
- Page 199 and 200:
161 170 99.99 99.97 99.9 99.7 99 97
- Page 201 and 202:
99.99 99.97 99.9 99.7 99 97.5 95 90
- Page 203 and 204:
99.99 99.97 99.9 99.7 99 97.5 95 90
- Page 205 and 206:
99.99 99.97 99.9 99.7 99 97.5 95 90
- Page 207 and 208:
99.99 99.97 99.9 99.7 99 97.5 95 90
- Page 209 and 210:
99.99 99.97 99.9 99.7 99 97.5 95 90
- Page 211 and 212:
99.99 99.97 99.9 99.7 99 97.5 95 90
- Page 213 and 214:
99.99 99.97 99.9 99.7 99 97.5 95 90
- Page 215 and 216:
99.99 99.97 99.9 99.7 99 97.5 95 90
- Page 217 and 218:
99.99 99.97 99.9 99.7 99 97.5 95 90
- Page 219 and 220:
99.99 99.97 99.9 99.7 99 97.5 95 90
- Page 221 and 222:
99.99 99.97 99.9 99.7 99 97.5 95 90
- Page 223 and 224:
99.99 99.97 99.9 99.7 99 97.5 95 90
- Page 225 and 226:
99.99 99.97 99.9 99.7 99 97.5 95 90
- Page 227 and 228:
99.99 99.97 99.9 99.7 99 97.5 95 90
- Page 229 and 230:
99.99 99.97 99.9 99.7 99 97.5 95 90
- Page 231 and 232:
99.99 99.97 99.9 99.7 99 97.5 95 90
- Page 233 and 234:
195 204 99.99 99.97 99.9 99.7 99 97
- Page 235 and 236:
99.99 99.97 99.9 99.7 99 97.5 95 90
- Page 237 and 238:
99.99 99.97 99.9 99.7 99 97.5 95 90
- Page 239 and 240:
201 99.99 99.97 99.9 99.7 99 97.5 9
- Page 241 and 242:
99.99 99.97 99.9 99.7 99 97.5 95 90
- Page 243 and 244:
99.99 99.97 99.9 99.7 99 97.5 95 90
- Page 245 and 246:
99.99 99.97 99.9 99.7 99 97.5 95 90
- Page 247 and 248:
99.99 99.97 99.9 99.7 99 97.5 95 90
- Page 249 and 250:
99.99 99.97 99.9 99.7 99 97.5 95 90
- Page 251 and 252:
99.99 99.97 99.9 99.7 99 97.5 95 90
- Page 253 and 254:
99.99 99.97 99.9 99.7 99 97.5 95 90
- Page 255 and 256:
99.99 99.97 99.9 99.7 99 97.5 95 90
- Page 257 and 258:
99.99 99.97 99.9 99.7 99 97.5 95 90
- Page 259 and 260:
99.99 99.97 99.9 99.7 99 97.5 95 90
- Page 261 and 262:
99.99 99.97 99.9 99.7 99 97.5 95 90
- Page 263 and 264:
99.99 99.97 99.9 99.7 99 97.5 95 90
- Page 265 and 266:
99.99 99.97 99.9 99.7 99 97.5 95 90
- Page 267 and 268:
99.99 99.97 99.9 99.7 99 97.5 95 90
- Page 269 and 270:
99.99 99.97 99.9 99.7 99 97.5 95 90
- Page 271 and 272:
233 99.99 99.97 99.9 99.7 99 97.5 9
- Page 273 and 274:
99.99 99.97 99.9 99.7 99 97.5 95 90
- Page 275 and 276:
99.99 99.97 99.9 99.7 99 97.5 95 90
- Page 277 and 278:
Berger, G., 1988, Dating quaternary
- Page 279 and 280:
Douglas, B., Kearney, M. and Leathe
- Page 281 and 282:
Jol, H.M., Peterson, C.D., Vanderbu
- Page 283 and 284:
Northwest Florida Water Management
- Page 285 and 286:
Stapor, F.W. and Tanner, W.F., 1977
- Page 287 and 288:
BIOGRAPHICAL SKETCH Beth Margaret F