Highlands and Islands Airport's Annual Report (3MB pdf - Scottish ...
Highlands and Islands Airport's Annual Report (3MB pdf - Scottish ...
Highlands and Islands Airport's Annual Report (3MB pdf - Scottish ...

Create successful ePaper yourself
Turn your PDF publications into a flip-book with our unique Google optimized e-Paper software.
28 COMPANY STATEMENT OF COMPREHENSIVE INCOME<br />
FOR THE YEAR ENDED 31 MARCH 2011<br />
COMPANY STATEMENT OF CHANGES IN EQUITY<br />
FOR THE YEAR ENDED 31 MARCH 2011<br />
Equity share Retained Total<br />
capital earnings equity<br />
£000 £000 £000<br />
At 1 April 2009 50 8,904 8,954<br />
Profit / (loss) in year attributable to equity holders – 599 599<br />
Other comprehensive income – (9,045) (9,045)<br />
At 1 April 2010 50 458 508<br />
Profit / (loss) in year attributable to equity holders – (2,325) (2,325)<br />
Other comprehensive income – 3,706 3,706<br />
At 31 March 2011 50 1,840 1,890<br />
Equity share Retained Total<br />
capital earnings equity<br />
£000 £000 £000<br />
At 1 April 2009 50 9,582 9,632<br />
Profit / (loss) in year attributable to equity holders – 699 699<br />
Other comprehensive income – (8,211) (8,211)<br />
At 1 April 2010 50 2,070 2,120<br />
Profit / (loss) in year attributable to equity holders – (2,339) (2,339)<br />
Other comprehensive income – 3,207 3,207<br />
At 31 March 2011 50 2,938 2,988<br />
Notes 1 to 28 form part of these financial statements<br />
2011 2010<br />
Notes £000 £000<br />
(Loss) / profit for the year (2,339) 699<br />
Other comprehensive income:<br />
Actuarial gains <strong>and</strong> (losses) 20 3,207 (8,211)<br />
Tax on items relating to components of other comprehensive income – –<br />
Other comprehensive income for the period, net of tax 3,207 (8,211)<br />
Total comprehensive income for the period 868 (7,512)<br />
GROUP STATEMENT OF CHANGES IN EQUITY<br />
FOR THE YEAR ENDED 31 MARCH 2011<br />
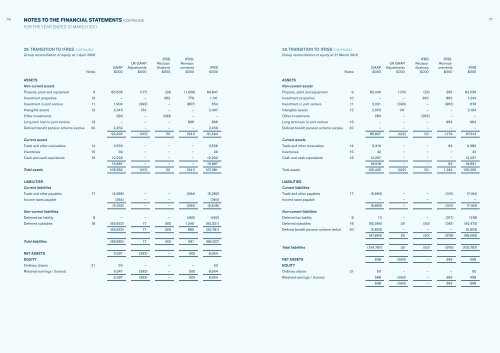
GROUP BALANCE SHEET<br />
FOR THE YEAR ENDED 31 MARCH 2011<br />
2011 2010 2009<br />
Notes £000 £000 £000<br />
ASSETS<br />
Non-current assets<br />
Property, plant <strong>and</strong> equipment 9 79,423 82,536 83,847<br />
Investment properties 10 1,235 1,244 1,141<br />
Investments accounted for using the equity method 11 584 676 654<br />
Intangible assets 12 1,891 2,194 2,497<br />
Defined benefit pension scheme surplus 20 – – 2,459<br />
Long term loan to joint venture 13 1,038 964 896<br />
84,171 87,614 91,494<br />
Current assets<br />
Trade <strong>and</strong> other receivables 14 3,588 6,382 3,556<br />
Inventories 15 56 42 39<br />
Cash <strong>and</strong> cash equivalents 16 14,045 12,257 12,292<br />
17,689 18,681 15,887<br />
Total assets<br />
101,860 106,295 107,381<br />
LIABILITIES<br />
Current liabilities<br />
Trade <strong>and</strong> other payables 17 (5,090) (7,194) (5,282)<br />
Income taxes payable – – (364)<br />
(5,090) (7,194) (5,646)<br />
Non-current liabilities<br />
Provisions for liabilities <strong>and</strong> charges 8 (291) (318) (460)<br />
Defined benefit pension scheme deficit 20 (2,740) (5,803) –<br />
Deferred subsidies 18 (91,849) (92,472) (92,321)<br />
(94,880) (98,593) (92,781)<br />
Total liabilities (99,970) (105,787) (98,427)<br />
NET ASSETS 1,890 508 8,954<br />
EQUITY<br />
Ordinary shares 21 50 50 50<br />
Retained earnings 1,840 458 8,904<br />
1,890 508 8,954<br />
Notes 1 to 28 form part of these financial statements<br />
Grenville Johnston CA<br />
Chairman<br />
29 July 2011<br />
Inglis Lyon<br />
Managing Director<br />
29 July 2011<br />
29