beitrag breyer
beitrag breyer
beitrag breyer

You also want an ePaper? Increase the reach of your titles
YUMPU automatically turns print PDFs into web optimized ePapers that Google loves.
Assessment of pile bearing capacity<br />
ASSESSMENT OF PILE BEARING CAPACITY BY LOAD TESTS AND<br />
NUMERICAL ANALYSIS<br />
ERMITTLUNG DER PFAHLTRAGFÄHIGKEIT DURCH PROBEBE-<br />
LASTUNGEN UND NUMERISCHE ANALYSEN<br />
DETERMINATION DE LA RESISTANCE DE PIEUX PAR ESSAIS DE<br />
CHARGEMENT ET ANALYSE NUMERIQUE<br />
Bernd Breyer, Carola Vogt-Breyer, Stefan Crienitz, Gottfried Sawade,<br />
Rainer Wellhäußer<br />
SUMMARY<br />
In conjunction with the expansion of the city highway (Motorring 3) in<br />
Copenhagen it is necessary to build several bridges and noise barriers, founded<br />
on drilled piles. The Danish standardisation is mainly based on experiences with<br />
driven piles. Therefore pile load tests are essential for an economic utilisation of<br />
drilled piles.<br />
The subsoil of the testing sites consists of artificial landfill followed by<br />
moraine clay and Pleistocene sands. The static and dynamic pile load tests show<br />
comparable bearing capacities, which in most cases are well above the specifications<br />
of DIN 1054. Based on numerical modelling of the load tests by finite<br />
element calculations, further conclusions (extrapolation of the loaddisplacement-curves,<br />
other pile geometry) can be drawn.<br />
ZUSAMMENFASSUNG<br />
Im Zusammenhang mit dem Ausbau der Autobahn (Motorring 3) um Kopenhagen<br />
sollen zur Gründung von Brücken und Lärmschutzwänden Bohrpfähle<br />
ausgeführt werden. Die dänische Normung basiert überwiegend auf Erfahrungen<br />
mit Rammpfählen, so dass, um eine wirtschaftlichere Ausnutzung zu<br />
ermöglichen, Probebelastungen durchgeführt wurden.<br />
Der Untergrund in den Probefeldern besteht aus Auffüllungen über Moräneton,<br />
der von pleistozänen Sanden unterlagert wird. Die statischen und dynamischen<br />
Probebelastungen liefern vergleichbare Pfahltragfähigkeiten, die in den<br />
meisten Fällen deutlich über den Angaben der DIN 1054 liegen. Mit Finite-<br />
Elemente-Berechnungen können – basierend auf Nachrechnungen der Probebe-<br />
99<br />
Otto-Graf-Journal Vol. 17, 2006
B. BREYER, C. VOGT-BREYER, S. CRIENITZ, G. SAWADE, R. WELLHÄUSSER<br />
lastungen – weitergehende Aussagen (Extrapolation der Widerstands-<br />
Setzungslinien, andere Pfahlgeometrien) gewonnen werden.<br />
RESUME<br />
Liés à l’expansion de l’autoroute (Motorring 3) de Copenhague, plusieurs<br />
ponts et murs antibruits, fondés sur des pieux forés, doivent être construits. La<br />
normalisation danoise se base surtout sur des expériences avec des enfoncepieux.<br />
C’est pourquoi des essais de chargement sont nécessaires pour une utilisation<br />
économique de pieux forés.<br />
Le sous-sol des terrains d’essai consiste en remblai artificiel sur de la<br />
glaise moraine et du sable pléistocène. Les essais de chargement statiques et<br />
dynamiques montrent des résistances comparables, qui en majorité sont fortement<br />
plus grandes que les données de DIN 1054. Les essais de chargement ont<br />
été récalculés avec la méthode des éléments finis. Ceci permet des conclusions<br />
élargies (extrapolation des courbes traction-déplacement, pieu d’une autre géométrie).<br />
1 DESCRIPTION OF CONSTRUCTION<br />
The city highway (Motorring 3) runs along the west side of Copenhagen<br />
and is one of the most important and busiest highways in Denmark.<br />
In summer 2003, due to regular congestion the parliament decided to expand<br />
Motorring 3 from Jægersborg to Holbæk-highway (16,2 km) from 4 to 6<br />
lanes. The road traffic department (Vejdirektorat) estimates the building costs to<br />
1,91 Billion DKR (256 Mio. Euro).<br />
In conjunction with the expansion of the city highway several bridges will<br />
be broadened or newly built and a large scale of retaining walls and noise barriers<br />
will be constructed. Due to the location in the western part of Copenhagen<br />
with nearby housing, the usual foundation method of driven piles can not be<br />
utilised. Therefore drilled piles will be used.<br />
To achieve an economic solution with this uncommon foundation method<br />
in Denmark, load tests were advertised by the technical advisor and planner of<br />
the road traffic department (COWI A/S) and contracted to Züblin Scandinavia<br />
A/S for execution.<br />
100
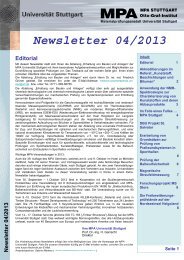
Figure 1: Outline map (www.vd.dk)<br />
2 DESIGN OF PILES FOLLOWING DANISH STANDARD<br />
101<br />
Assessment of pile bearing capacity<br />
With reference to Danish standard DS415 (4.1): „Norm for fundering“ the<br />
design of piles must be carried out at least according to one of the following<br />
bases:<br />
- Static pile load tests, the results of which are in harmony with other relevant<br />
experiences.<br />
- Geo-static calculation, which must be validated by static pile load tests in<br />
comparable situations.<br />
- Dynamic pile load tests (pile driving formula or Pile wave Analysis), which<br />
must be validated by static pile load tests in comparable situations.<br />
In Denmark, as a result of broad and long lasting experience, a safe and economic<br />
design of driven piles by geo-static calculations, according to the above<br />
mentioned standard, is normally possible.<br />
For compressive loading the characteristic value of the skin friction of driven<br />
concrete piles can be assessed as:<br />
τm,k = 1/1,5 . 0,4 . cu for cohesive soil and<br />
τm,k = 1/1,5 . 0,6 . qm<br />
for non-cohesive soil<br />
where qm is the vertical stress in the middle of the soil layer.<br />
The characteristic value of the base resistance can be assessed as:<br />
qs,k = 1/1,5 . 9 . cu for cohesive soil<br />
Otto-Graf-Journal Vol. 17, 2006
B. BREYER, C. VOGT-BREYER, S. CRIENITZ, G. SAWADE, R. WELLHÄUSSER<br />
If the base of driven piles is located within non-cohesive soil, a geo-static<br />
calculation of the base resistance is deemed to be so uncertain, that it may not<br />
be used for the determination of the pile bearing capacity.<br />
With reference to drilled piles the Danish standard basically says: The pile<br />
bearing capacity of drilled and cast in situ piles can be decisively smaller than<br />
the capacity of driven piles. At most 30% of the skin friction of an adequate<br />
driven pile and at most 1000 kN/m 2 as base resistance may be assumed, unless<br />
an accepted documentation of a greater bearing capacity is available. This<br />
means that the design value of the skin friction of a driven concrete pile for<br />
compressive loading within cohesive soil (e.g. cu = 100 kN/m 2 ) amounts to<br />
τmd = 1/1,3 . 1/1,5 . 0,4 . 100 kN/m 2 = 20,5 kN/m 2<br />
At most 30% of this value, i.e. a design value of the skin friction of 6,2<br />
kN/m 2 , could be assumed for an adequate drilled pile.<br />
This reveals that in many cases, due to the rare prevalence of drilled piles,<br />
the assumed values are by far on the safe side. Therefore load tests can be expected<br />
to show greater bearing capacities.<br />
3 PILE LOAD TESTS<br />
The load tests were expected to gather information about the pile bearing<br />
capacity of drilled piles for representative soil conditions of the project.<br />
For this purpose static tension and compression pile load tests were performed.<br />
In addition all piles were tested afterwards by dynamic pile load tests to<br />
gain information about the comparability of the different testing methods and to<br />
increase the reliability of the results. The aim was to optimise the diameter and<br />
length of the piles for the building project and to arrange for the potential to<br />
control the bearing capacity by further dynamic load tests.<br />
3.1 Location and geological Situation<br />
Three possible testing sites were chosen by COWI A/S. They were all situated<br />
in the middle section of the high way. According to the preceding site investigation<br />
they were regarded as representative for the whole building project.<br />
The testing sites were named as follows<br />
- test site 1 – Ørnegårdsvej<br />
- test site 2 – Nybrovej<br />
- test site 3 – Gladsaxe Ringvej<br />
102
Figure 2a: Test site 1 and 2, COWI A/S<br />
103<br />
Assessment of pile bearing capacity<br />
Figure 2b: Test site 3: Gladsaxe Ringvej,<br />
COWI A/S<br />
The geological and hydrological situation of each test site was closely investigated<br />
by a cased (0,6') exploratory drilling down to 25 m (GP-PP1) or 20 m<br />
(GB-PP2 and GB-PP3) below ground level. Cohesive soil layers were tested by<br />
field vane in order to obtain the undrained cohesion cu. Non-cohesive soil layers<br />
were tested by Standard-Penetration Tests (SPT). In addition selected soil samples<br />
were tested in the laboratory.<br />
As a result of the soil investigation the testing sites 2 and 3 were chosen<br />
for the execution of the tests. Test site 1 was discarded, owing to an ultra large<br />
layer of silt (GP-PP1), which was considered non-representative.<br />
Simplified the geological situation can be described as follows:<br />
Test site 2 (Nybrovej): The subsoil consists of artificial landfill of 1,5 m thickness,<br />
followed by senglacial sand deposits of 3 m and 7 m of moraine clay. Finally<br />
Pleistocene melt water sand was encountered down to 20 m below ground<br />
level without reaching the bottom of this layer. The groundwater table was located<br />
at about 7 m below ground level.<br />
Test site 3 (Gladsaxe Ringvej): The sequence of strata commences with 3 m of<br />
artificial landfill followed by 4,5 m of moraine clay and concludes with 12,5 m<br />
of Pleistocene melt water sand, which was encountered till the end of the drilling<br />
without reaching the bottom of this layer. The groundwater table was located<br />
at about 9,5 m below ground level.<br />
Otto-Graf-Journal Vol. 17, 2006
B. BREYER, C. VOGT-BREYER, S. CRIENITZ, G. SAWADE, R. WELLHÄUSSER<br />
Figure 3a: Geology and pile length at test<br />
site 2 (Nybrovej), COWI A/S<br />
Table 1: Test schedule<br />
104<br />
Figure 3b: Geology and pile length at test<br />
site 3 (Gladsaxe Ringvej), COWI A/S<br />
Pile PP 1.1 1.2 1.3 2.1 2.2 2.3<br />
Length [m] 8,0 10,0 17,0 7,5 10,0 17,0<br />
Compression load [MN] (stat.) > 1,5 > 1,8 3,0 - > 2,55 3,0<br />
Tensile load [MN] (stat.)<br />
-<br />
Dyn. pile load test x x x x x x<br />
3.2 Concept of load tests<br />
><br />
0,83<br />
At both test sites three test piles of 770 mm diameter were produced. The<br />
particular pile lengths and their position relative to the geological layers are<br />
shown in Figure 3a and 3b. The test program is summarised in Table 1.<br />
For the determination of the load transfer along the shaft of the pile, test<br />
piles PP 1.3 and PP 2.3 were equipped at 5 cross sections with 4 vibrating wire<br />
strain gauges each. Layers 1 and 2 were arranged at ground level and base level<br />
of the moraine clay. Layers 3 to 5 were evenly distributed over the embedded<br />
length within the melt water sand.<br />
><br />
1,8<br />
><br />
1,0<br />
><br />
1,4<br />
2,1
Assessment of pile bearing capacity<br />
In addition test pile PP 1.3 was equipped with 3 sensors for the measurement<br />
of the temperature of the concrete. The sensors were arranged at 65 mm,<br />
175 mm and 285 mm from the centre of the pile at about 10 m depth.<br />
The maximum test loads for all test piles had been predefined to 3000 kN<br />
for compressive loading and 2100 kN for tensile loading. The testing abutment<br />
had been designed accordingly.<br />
3.3 Arrangement and production of the test piles and testing abutment<br />
At both test sites the test piles were arranged in a row at a distance of 6,60<br />
m, reducing the costs and effort for the testing abutment, because parts of the<br />
tensile and compressive elements could be used for two pile tests.<br />
All test piles were reinforced by one reinforcement cage for the whole<br />
length of the pile. The transmission of the tensile loading into the short piles PP<br />
1.2, PP 2.1 and PP 2.2 was effected starting at the top of the pile by GEWI-bars<br />
(2 x 63,5 mm) with a total bonding length of 5,6 m. In contrast, the transmission<br />
of the tensile loading into the long piles PP 1.3 and PP 2.3 was performed starting<br />
at the base of the pile. For this, two GEWI-bars were directed through cladding<br />
tubes and anchored at the base of the pile.<br />
The head of the pile was reinforced by a casing pipe of 1,2 m diameter and<br />
0,5 m height.<br />
Figure 4a: Test apparatus for compression<br />
test<br />
105<br />
Figure 4b: Test apparatus for tension test<br />
The testing abutment consisted of reinforced steel girders, 2 HE-M 1000 as<br />
main beams and 2 HE-B 650 as auxiliary beams. The reaction forces, resulting<br />
from the tensile and compressive loading of the test piles, were transferred into<br />
Otto-Graf-Journal Vol. 17, 2006
B. BREYER, C. VOGT-BREYER, S. CRIENITZ, G. SAWADE, R. WELLHÄUSSER<br />
the ground by strip foundations (3,00 m x 1,25 m x 0,50 m) or by 4 GEWI-piles<br />
(GEWI 50, 15 m length).<br />
In August 2004, the test piles were installed by cased drilling (double<br />
walled casing of 750 mm diameter) according to DS/EN 1536. The drilling rig<br />
used was a Liebherr LRB 155.<br />
The GEWI-piles for the testing abutment were installed by overburden<br />
drilling of 133 mm diameter.<br />
3.4 Implementation of the tests<br />
The set-up of the test and the measuring equipment matched the “Recommendations<br />
for Static and Dynamic Pile Tests” of working group 2.1 of the<br />
German Society for Geotechnics. Test piles 1.1, 1.2, 2.1 and 2.2 were tested according<br />
to level 1 (lower requirements) and test piles 1.3 and 2.3 according to<br />
level 3 (higher requirements). The static pile load tests were carried out by<br />
MPA, University of Stuttgart, the dynamic pile load tests were performed by<br />
GSP, Mannheim.<br />
3.4.1 Implementation of the static pile load tests<br />
The test load was applied by four hydraulic jacks (hydraulically coupled)<br />
and was held constant by an automatic load-maintaining pump, which was regulated<br />
by an electrical pressure gauge. In addition the load was controlled by four<br />
electrical load cells.<br />
The vertical displacement of the piles was registered by 2 electrical displacement<br />
transducers and 2 mechanical dial gauges (metering precision / reading<br />
accuracy 1/100 mm), which were arranged diametrically opposed at the<br />
head of the piles. The transducers and dial gages were mounted on a long measuring<br />
bridge, built of two parallel arranged formwork girders, the support of<br />
which were outside of the expected area of influence of the test pile and the reaction<br />
supports.<br />
The vertical displacement was controlled independently of this measurement<br />
by a digital level (1/100 mm accuracy).<br />
The whole test equipment was sheltered from climatic effects by an overall tent<br />
and the control and measuring electronics were housed in an office container.<br />
Each load step was held constant until at least the defined minimum waiting<br />
time was reached, the creep ratio ks = (s2-s1) / log(t2/t1) had been assessed<br />
106
Assessment of pile bearing capacity<br />
reliably and the predetermined rate of displacement had decreased to less than<br />
0,1 mm / 20 min over a period of one hour.<br />
All load changes were carried out slowly (quasi-static). After each unloading<br />
to the initial load the displacement was observed at least for 30 min until the<br />
rate of rebound had essentially ceased<br />
Figure 5: Test apparatus for dynamic test<br />
3.4.2 Implementation of the dynamic pile load test<br />
The dynamic pile load tests were carried out only few days after the static<br />
pile load tests.<br />
The impact loading was induced by a frame guided weight of 6 tons with<br />
variable height of fall. The whole equipment was placed on a working platform<br />
of two large I-beams above the test pile.<br />
Two strain and two acceleration transducers were mounted diametrically<br />
opposed on both sides of the pile. Two planes had been prepared on the surface<br />
of the piles about 0,6 m below the pile head for this purpose. In addition the residual<br />
displacements were optically controlled.<br />
During the pile load test 5 to 8 impacts with increasing height of fall were<br />
carried out. By that process the uplift caused by the static pile load test under<br />
tensile loading was successively compensated.<br />
The measured signals were processed and recorded by the Pile Driving<br />
Analyser, model PAK of Pile Dynamics Inc., Cleveland.<br />
107<br />
Otto-Graf-Journal Vol. 17, 2006
B. BREYER, C. VOGT-BREYER, S. CRIENITZ, G. SAWADE, R. WELLHÄUSSER<br />
3.5 Results and evaluation<br />
3.5.1 Results and evaluation of the static pile load tests<br />
The static pile load tests could generally be carried out according to the<br />
predetermined loading programs. Only three load tests had to be aborted prematurely.<br />
The displacement of Piles 1.1D and 2.1Z had by far passed the limit of<br />
77 mm (stop criterion 1/10 of pile diameter). During the load test of pile 1.3Z,<br />
the auxiliary load beams above the hydraulic jacks had turned unacceptably<br />
around it’s longitudinal axis.<br />
Test load[kN]<br />
3000<br />
2500<br />
2000<br />
1500<br />
1000<br />
500<br />
60 kN<br />
0<br />
750 kN<br />
375 kN<br />
1125 kN<br />
KMD1<br />
KMD2<br />
KMD3<br />
KMD4<br />
Test load<br />
1500 kN<br />
1500 kN<br />
1875 kN<br />
2250 kN 2250 kN<br />
2625 kN<br />
3000 kN<br />
2 4 6 8 10 12 14 16 18<br />
Duration of test [h]<br />
Skin friction [kN/qm]<br />
120<br />
100<br />
80<br />
60<br />
40<br />
20<br />
0<br />
Vertikal displacement of pile head [mm]<br />
0 2 4 6 8 10 12 14 16 18<br />
Position below top of pile head (28,30 m DNN) [m]<br />
108<br />
0<br />
2<br />
4<br />
6<br />
8<br />
0 500 1000 1500 2000 2500 3000<br />
Test load [kN]<br />
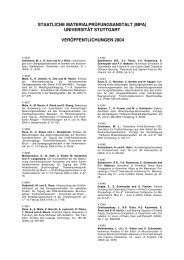
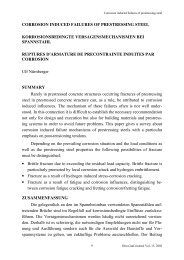
Figure 6: Typical graphs of loading program, load-displacement curve and distribution of the<br />
activated skin friction at all load steps for the compression test at pile PP 2.3<br />
No significant horizontal displacements or inclinations of the pile head<br />
were noticed during the tests, so that any adverse effects on the measurements<br />
due to eccentric loading or an unscheduled bending moment could be excluded.<br />
3000<br />
kN 2250<br />
kN 1500<br />
kN 750<br />
kN
109<br />
Assessment of pile bearing capacity<br />
The load-displacement behaviour and creep behaviour could be determined.<br />
In addition to that the distribution of the activated skin friction could be<br />
determined at the piles PP 1.3 and PP 2.3.<br />
In Figure 6 typical graphs of loading program, load-displacement curve<br />
and distribution of the activated skin friction at all load steps for a compression<br />
test are shown. In Figure 7 all load-displacement-curves for the static load tests<br />
are shown, simplified without unloading and reloading.<br />
Axial load [kN]<br />
3500<br />
3000<br />
2500<br />
2000<br />
1500<br />
1000<br />
500<br />
Static pile load tests<br />
0<br />
0 40 80 120<br />
Vertical displacement of pile head [mm]<br />
PP1.1D<br />
PP1.2D<br />
PP1.2Z<br />
PP1.3D<br />
PP1.3Z<br />
Figure 7a: Load-displacement-curves of all piles at test site 2 (Nybrovej)<br />
Axial load [kN]<br />
3500<br />
3000<br />
2500<br />
2000<br />
1500<br />
1000<br />
500<br />
Static pile load tests<br />
0<br />
0 40 80 120<br />
Vertical displacement of pile head [mm]<br />
PP2.1Z<br />
PP2.2D<br />
PP2.2Z<br />
PP2.3D<br />
PP2.3Z<br />
Figure 7b: Load-displacement-curves of all piles at test site 3 (Gladsaxe Ringvej)<br />
3.5.2 Results and evaluation of the dynamic pile load tests<br />
All dynamic load tests were carried out according to the planned procedure.<br />
Otto-Graf-Journal Vol. 17, 2006
B. BREYER, C. VOGT-BREYER, S. CRIENITZ, G. SAWADE, R. WELLHÄUSSER<br />
Additional displacement [mm]<br />
Load [kN] Load [kN]<br />
Addotional displacement [mm]<br />
Figure 8: Load-displacement-curves calculated from dynamic load tests (evaluated blow<br />
only)<br />
The evaluation of the measurements was carried out with CAPWAP<br />
(CASE Pile Wave Analysis Program). In this process a computer-modelled pile<br />
in the subsoil is altered in an iterative procedure to optimise the correspondence<br />
of the calculated and the measured time responses of the pile head velocity. In<br />
an additional step with this optimised computer-model static loadings (i.e. loaddisplacement<br />
curves) are simulated, and a respective distribution of the skin<br />
friction is determined.<br />
3.5.3 Comparison of the results of the static load tests with the dynamic load<br />
tests<br />
In the following table the max. test load resp. the max. calculated load capacity<br />
and the corresponding displacements are shown for the static and the dynamic<br />
load tests. The second displacement value gives the total displacement<br />
including the displacements from previous load tests.<br />
At the long piles 1.3 and 2.3, which are embedded in good bearing sand<br />
the ultimate bearing capacity was neither reached at the tension test nor at the<br />
compression test. The higher values (compression) of the dynamic tests are<br />
therefore plausible.<br />
The load-displacement behaviour of the middle-long piles 1.2 and 2.2,<br />
which are only embedded marginally in good bearing sand, was significantly<br />
softer.<br />
However only at pile 1.2 was the ultimate bearing capacity approximately<br />
reached at the tension test. The somewhat higher values (compression) of the<br />
dynamic tests are therefore plausible.<br />
At the short piles 1.1 and 2.1 the ultimate bearing capacity was clearly<br />
reached or exceeded. In consideration of the preceding displacements from pre-<br />
110
Assessment of pile bearing capacity<br />
vious load tests the correspondence with the dynamic results at pile 1.1 is nevertheless<br />
good.<br />
Table 2: Comparison of the static load tests with the dynamic load tests<br />
PP Form of test<br />
1.1<br />
1.2<br />
1.3<br />
2.1<br />
2.2<br />
2.3<br />
max. test load /<br />
load capacity<br />
111<br />
Accumulated displacement<br />
of the<br />
pile head [mm]<br />
Creep<br />
[mm]<br />
Stat. (compression) 2063 kN ~104 9,21<br />
Dyn. (Blow 2/5) * 1846 kN<br />
8 resp.<br />
~112<br />
Stat. (Compression) 3000 kN 15,44 1,16<br />
Stat. (Tension) 2100 kN<br />
-57,13 resp.<br />
-41,69<br />
Dyn. (Blow 8/8) 3172 kN 73 resp. 31,31 -<br />
Otto-Graf-Journal Vol. 17, 2006<br />
-<br />
10,55<br />
Stat. (Compression) 3000 kN 9,41 0,54<br />
Stat. (Tension) 1800 kN ** -9,21 resp. 0,20 0,34<br />
Dyn. (Blow 6/6) 3764 kN 17 resp. 17,2 -<br />
Stat. (Tension) 1367 kN -109,80 � ∞<br />
Dyn. (Blow 8/8) 2422 kN 163,5 resp. 53,70 -<br />
Stat. (Compression) 3000 kN 14,91 1,05<br />
Stat. (Tension) 2100 kN<br />
-25,36 resp.<br />
–10,45<br />
Dyn. (Blow 7/7) 3443 kN 54 resp. 43,55 -<br />
4,26<br />
Stat. (Compression) 3000 kN 8,04 0,64<br />
Stat. (Tension) 2100 kN -8,31 resp. –0,27 0,33<br />
Dyn. (Blow 5/7) 3785 kN 17,5 resp. 17,23 -<br />
* (Blow 2/5): 2. Blow of 5 blows altogether<br />
** preliminary abortion due to tilted load beam<br />
4 FINITE-ELEMENT-CALCULATION<br />
By means of a comparative calculation of the pile resistance with the finite-element<br />
method (FEM) it is shown what prediction can be made with FEM,<br />
what additional information can be gained, and where, in this case, the applications<br />
limitations lie.
B. BREYER, C. VOGT-BREYER, S. CRIENITZ, G. SAWADE, R. WELLHÄUSSER<br />
The calculations were carried out with the Plaxis program. The pile and the<br />
surrounding soil were modelled as a rotation-symmetrical problem. The mesh<br />
used is displayed in Figure 9.<br />
The elements used are triangle shaped wit 15 knots and a displacement<br />
ansatz of 4 th order.<br />
Figure 9: Finite-element-mesh for a 17m pile at test site Nybrovej<br />
The input data for the layers of soil were taken from the geotechnical report<br />
from COWI A/S.<br />
The load-displacement behaviour of the subsoil was approximated with the<br />
accepted linear-elastic elasto-plastic constitutive equations from Mohr-<br />
Coulomb.<br />
With Plaxis one could use constitutive equations to cover the elastoplastic<br />
soil behaviour even more realistically. To do so one requires further soil parameters,<br />
that are commonly not specified in geotechnical reports. This means<br />
that the accuracy of the results is not improved if one uses a constitutive equation<br />
of a higher order but can estimate the necessary additional parameters only<br />
roughly.<br />
For the cohesive soil layers the used shear strength parameters used for the<br />
calculations were obtained by vane shear tests. For the cohesionless soil layers<br />
the parameters were obtained by standard penetration tests.<br />
Both tests were carried out in-situ, in the borehole, in almost undisturbed<br />
soil. The modulus of elasticity of the different soil layers was estimated on the<br />
basis of existing empirical values for those soils. For each test site the calcula-<br />
112
Assessment of pile bearing capacity<br />
tions of the pile load tests for different pile lengths were carried out with a uniform<br />
set of soil parameters. For the modulus of elasticity of the piles themselves,<br />
the linear elastic stiffness of concrete was applied.<br />
Layer<br />
Table 3: Input data for soil parameters<br />
ϕ´<br />
[ o ]<br />
Test site<br />
Nybrovej<br />
cu<br />
[kPa]<br />
113<br />
Es<br />
[Mpa]<br />
ϕ´<br />
[ o ]<br />
Test site<br />
Gladsaxe Ringvej<br />
cu<br />
[kPa]<br />
Es<br />
[Mpa]<br />
Backfilling / Sand 30 - 10 30 - 10<br />
Moraine clay (top) - 248 40 - 276 40<br />
Moraine clay (bottom) - 165 30 - 474 60<br />
Moraine sand - - 60 32,5 - 60<br />
Melted snow and ice sand 35 - 100 35 - 100<br />
Due to the drilling process the high values for the consolidated undrained<br />
cohesion of the in-situ layers can be decreased considerably at the interface<br />
pile-soil. In the German DIN-standards this is taken into account. There only<br />
50% resp. 30% of high undrained cohesion values are allowed to be applied for<br />
the characteristic skin friction. Therefore the finite-elements calculations were<br />
performed for each pile with 100% undrained cohesion as well as 50%<br />
undrained cohesion values. Due to the slow performance of the tests, an appearance<br />
of pore water pressure was not taken into account. For the non-cohesive<br />
soil layers none of this variation was carried out but a uniform shear strength<br />
was applied.<br />
The calculations were carried out as CPR-tests (constant rate of penetration).<br />
This means that a displacement is induced incrementally up to 100 mm<br />
while the required axial load is plotted over the displacement of the pile head.<br />
In the computed simulations only piles under a compression load were considered.<br />
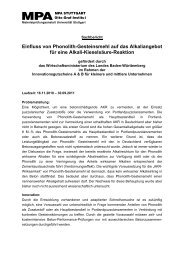
The calculated load-displacement curves are shown in Figure 10.<br />
The advantage of a FEM calculation in combination with pile load tests is<br />
that one can verify the data input on the basis of the test results. Other pile dimensions<br />
can easily be analysed numerically. Due to specific technical reasons<br />
(abutment), the ultimate bearing capacity was not reached with all piles. By<br />
means of the FEM calculations the ultimate bearing capacity could be narrowed<br />
down.<br />
Otto-Graf-Journal Vol. 17, 2006
B. BREYER, C. VOGT-BREYER, S. CRIENITZ, G. SAWADE, R. WELLHÄUSSER<br />
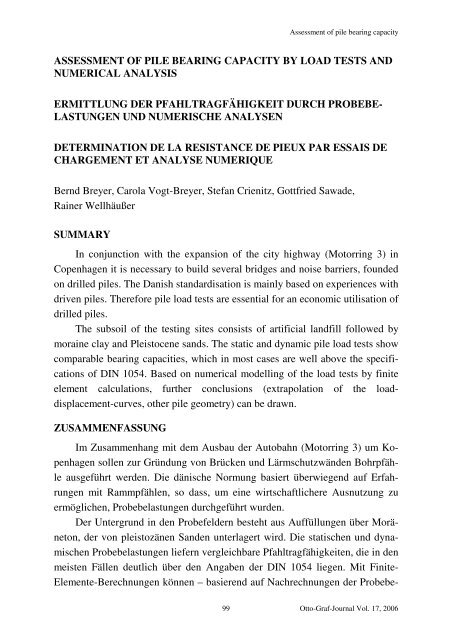
5 COMPARISON PILE LOAD TEST – FEM CALCULATION -<br />
STANDARDS<br />
To compare the results of the static and dynamic load tests with the FEM<br />
calculations and with the German and Danish standards, the following curves<br />
for a pile ( Ø =770 mm, compression test) were plotted in Figure 10:<br />
- measured load-displacement curve from static load test<br />
- calculated load-displacement curve from dynamic load test<br />
- load-displacement curve from FEM calculation with 100% undrained cohesion<br />
value for cohesive layers<br />
- load-displacement curve from FEM calculation with 50% undrained cohesion<br />
value for cohesive layers<br />
- calculated load-displacement curve with input values from the German standard<br />
DIN 1054<br />
- calculated bearing capacity with input values from Danish the standard DS<br />
415. According to this standard a geo-static calculation of the end bearing<br />
capacity in cohesive soils would be considered as unsure. However, for a<br />
comparison of bearing capacities the use of empirical values is expedient. In<br />
this case the max. value given in this standard of qd = 1000 kPa was proper<br />
Axial load [kN]<br />
1,2<br />
1<br />
0,8<br />
0,6<br />
0,4<br />
0,2<br />
6000<br />
5000<br />
4000<br />
3000<br />
2000<br />
1000<br />
0<br />
Static pile load test<br />
Dynamic pile load test<br />
FEM, 100% cu<br />
FEM, 50 % cu<br />
DIN 1054<br />
DS 415<br />
Axial load [kN]<br />
0<br />
0 20 40 60 80<br />
Vertical displacement of pile head [mm]<br />
3500<br />
3000<br />
2500<br />
2000<br />
1500<br />
1000<br />
500<br />
0<br />
0 20 40 60 80<br />
Figure 10a: Pile PP1.1<br />
114<br />
Axial load [kN]<br />
Vertical displacement of pile head [mm]<br />
10000<br />
8000<br />
6000<br />
4000<br />
2000<br />
0<br />
0 20 40 60 80<br />
Vertical displacement of pile head [mm]<br />
Figure 10b: Pile PP1.2 Figure 10c: Pile PP1.3
Axial load [kN]<br />
8000<br />
6000<br />
4000<br />
2000<br />
0<br />
0 20 40 60 80<br />
Vertical displacement of pile head [mm]<br />
115<br />
12000<br />
9000<br />
6000<br />
3000<br />
Assessment of pile bearing capacity<br />
0<br />
0 20 40 60 80<br />
Vertical displacement of pile head [mm]<br />
Figure 10d: Pile PP2.2 Figure 10e: Pile PP2.3<br />
Figure 10: Comparative load-displacement curves<br />
The comparative plot shows that in most cases the bearing capacity of the<br />
static and dynamic load tests lie between the results of the FEM calculations<br />
with 50 % and 100 % undrained cohesion value.<br />
The test results exceed the values in the German standard DIN 1054 in<br />
most cases. Though, particularly with regard to the results of pile PP2.3 one can<br />
clearly see that the standard gives an appropriate lower limit.<br />
As one could expect for the previously mentioned reasons, the calculated<br />
bearing capacities with input values from the Danish standard DS 415 lie decidedly<br />
below the test results.<br />
6 CONCLUSIONS<br />
The described static pile load tests provide a good basis for an economical<br />
dimensioning of bored piles, for the expansion of the city highway Motorring 3<br />
in Copenhagen. The load-displacement curves of all six tests show a coherent<br />
image that were reconfirmed by the dynamic load tests. As a result further dynamic<br />
tests in the course of the construction work are possible.<br />
The in-situ proved bearing capacities exceed the values according to German<br />
standard DIN 1054 in most cases. In consideration of the margin of deviation<br />
the standard gives an appropriate lower limit.<br />
A geo-static calculation of the bearing capacity according to the Danish<br />
standard DS 415 gives very conservative results. Therefore pile load tests for<br />
extensive building projects are of financial benefit, especially if the pile toe lies<br />
in cohesive soil.<br />
With FEM calculations and the soil parameters from the geotechnical report,<br />
a well fitted mathemathical model of the load bearing behaviour could be<br />
found.<br />
Axial load [kN]<br />
Otto-Graf-Journal Vol. 17, 2006
B. BREYER, C. VOGT-BREYER, S. CRIENITZ, G. SAWADE, R. WELLHÄUSSER<br />
Regarding the determination of ultimate bearing capacities, a limiting consideration<br />
with the use of 50% resp. 100% of the cohesion values as a lower<br />
resp. upper limit is recommended.<br />
7 BIBLIOGRAPHY<br />
Pile load test report from MPA-University of Stuttgart 55120/9008358, 10-2004<br />
Website of Vejdirektorat (Danish highway board department): www.vd.dk<br />
Geotechnical report from COWI A/S: Vejdirektoratet O3 Motorring 3, Borede<br />
prøvepæle, Geoteknisk datarapport, 08-2004<br />
Pile load test report from Züblin Scandinavia A/S: København – Motorring 3,<br />
Rapport vedr. borede prøvepæle, 11-2004<br />
DS 415(4.1): Norm for fundering (1998)<br />
Danish standard DS/EN 1536: Udførelse af særlige geotekniske konstruktioner.<br />
Borede pæle. (1999)<br />
German standard DIN 1054: Baugrund. Sicherheitsnachweise im Erd- und<br />
Grundbau (2003)<br />
Recommendations for static and dynamic pile tests from the German society for<br />
geotechniques, working group 2.1 (1998)<br />
Plaxis V8 users manual (2003)<br />
116