reducing revenue loss due to disturbances in ... - Automatic Control
reducing revenue loss due to disturbances in ... - Automatic Control
reducing revenue loss due to disturbances in ... - Automatic Control

You also want an ePaper? Increase the reach of your titles
YUMPU automatically turns print PDFs into web optimized ePapers that Google loves.
2. Utilities and Availability<br />
Utilities are support processes that are utilized <strong>in</strong> production.<br />
Utilities are crucial for plant operation, but are not<br />
part of the f<strong>in</strong>al product. Examples of common utilities <strong>in</strong><br />
the process <strong>in</strong>dustry are steam, cool<strong>in</strong>g water and electricity.<br />
Utilities are often such that they only affect production when<br />
their supply is <strong>in</strong>terrupted or does not meet the specifications,<br />
i.e. when a utility parameter, such as pressure or temperature,<br />
is outside the limits required for normal operation.<br />
Utilities are often used plant-wide, and thus <strong>disturbances</strong> <strong>in</strong><br />
utilities may affect several production areas simultaneously.<br />
From a site-perspective, the problem thus becomes <strong>to</strong> transfer<br />
the variability from critical areas <strong>to</strong> areas where the variability<br />
does less damage (Q<strong>in</strong> (1998)). In this work, the<br />
objective is <strong>to</strong> divide the resources at a utility disturbance<br />
such that the <strong>revenue</strong> <strong>loss</strong> caused by the disturbance is m<strong>in</strong>imized.<br />
A disturbance <strong>in</strong> a utility is def<strong>in</strong>ed <strong>to</strong> occur when<br />
the measurement of a utility parameter is outside the limits<br />
that are set for normal operation of that utility.<br />
The availability of a utility is def<strong>in</strong>ed as the fraction of<br />
time all utility parameters are <strong>in</strong>side their normal limits.<br />
Area availability is divided <strong>in</strong><strong>to</strong> direct and <strong>to</strong>tal availability.<br />
The direct availability of a production area is def<strong>in</strong>ed<br />
as the fraction of time all the utilities required <strong>in</strong> the area<br />
are available. The <strong>to</strong>tal area availability is obta<strong>in</strong>ed when<br />
also connections between areas are considered, such that an<br />
area is only available if all the required utilities and all upstream<br />
areas are available. The measures of utility and area<br />
availability are used <strong>to</strong> estimate the direct and <strong>to</strong>tal <strong>revenue</strong><br />
<strong>loss</strong>es caused by <strong>disturbances</strong> <strong>in</strong> utilities.<br />
3. Buffer tanks<br />
Buffer tanks are commonly used <strong>to</strong> avoid the propagation<br />
of <strong>disturbances</strong> or <strong>to</strong> allow <strong>in</strong>dependent operation of production<br />
units (Faanes and Skogestad (2003)). In this study,<br />
buffer tanks are located between production areas at a site.<br />
These buffer tanks can be seen as both buffer tanks with the<br />
purpose <strong>to</strong> allow <strong>in</strong>dependent operation of production areas,<br />
and as <strong>in</strong>ven<strong>to</strong>ries of products that can be sold on the market.<br />
4. Site model<strong>in</strong>g<br />
In L<strong>in</strong>dholm et al. (2011b), three approaches for model<strong>in</strong>g a<br />
site with respect <strong>to</strong> <strong>disturbances</strong> <strong>in</strong> utilities were suggested.<br />
1. On/off production without buffer tanks<br />
Utilities and areas are considered <strong>to</strong> be either operat<strong>in</strong>g<br />
or not operat<strong>in</strong>g, i.e. ’on’ or ’off’. An area operates at<br />
maximum production speed when all its required utilities<br />
are available, and does not operate when any of<br />
its required utilities are unavailable. It is assumed that<br />
there are no buffer tanks between the areas at the site.<br />
This means that if an area is unavailable, downstream<br />
areas of that area will also be unavailable.<br />
2. On/off production <strong>in</strong>clud<strong>in</strong>g buffer tanks<br />
The same model<strong>in</strong>g approach as approach 1, but buffer<br />
tanks between areas are <strong>in</strong>cluded <strong>in</strong> the model. The<br />
buffer tanks act as delays from when an area upstream<br />
of the tank s<strong>to</strong>ps produc<strong>in</strong>g until its downstream areas<br />
have <strong>to</strong> be shut down.<br />
3. Cont<strong>in</strong>uous production<br />
Utility operation and production are considered <strong>to</strong> be<br />
cont<strong>in</strong>uous. Areas can operate at any production rate<br />
below the maximum limit determ<strong>in</strong>ed by the operation<br />
of utilities.<br />
In this study, on/off model<strong>in</strong>g <strong>in</strong>clud<strong>in</strong>g buffer tanks was<br />
used.<br />
5. General method for utility disturbance management<br />
Ageneralmethodfor<strong>reduc<strong>in</strong>g</strong>theeconomiceffectsof<br />
<strong>disturbances</strong> <strong>in</strong> utilities was <strong>in</strong>troduced <strong>in</strong> L<strong>in</strong>dholm et al.<br />
(2011b). The method consists of four steps:<br />
1. Get <strong>in</strong>formation on site-structure and utilities<br />
2. Compute utility and area availabilities<br />
3. Estimate <strong>revenue</strong> <strong>loss</strong> <strong>due</strong> <strong>to</strong> <strong>disturbances</strong> <strong>in</strong> utilities<br />
4. Reduce <strong>revenue</strong> <strong>loss</strong> <strong>due</strong> <strong>to</strong> future <strong>disturbances</strong> <strong>in</strong> utilities<br />
The case study at Pers<strong>to</strong>rp presented <strong>in</strong> this paper focuses<br />
on the last two steps of the general method, when<br />
us<strong>in</strong>g the on/off production model<strong>in</strong>g approach <strong>in</strong>clud<strong>in</strong>g<br />
buffer tanks. A case study has previously been performed at<br />
the same production site us<strong>in</strong>g on/off production model<strong>in</strong>g<br />
without <strong>in</strong>clud<strong>in</strong>g buffer tanks (L<strong>in</strong>dholm et al. (2011a)). In<br />
Section 6.5, the results obta<strong>in</strong>ed us<strong>in</strong>g on/off model<strong>in</strong>g with<br />
and without buffer tanks are compared.<br />
6. Case study at Pers<strong>to</strong>rp<br />
6.1 Get <strong>in</strong>formation on site-structure and utilities<br />
Site Stenungsund is one of 13 sites owned by the enterprise<br />
Pers<strong>to</strong>rp. The site consists of 10 production areas. The products<br />
of the 10 areas at the site are here denoted product 1-10<br />
for area 1-10 respectively. Internal buffer tanks exist for<br />
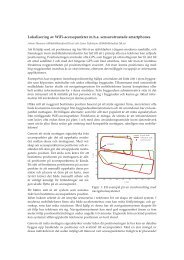
products 1-5. A flowchart of the product flow at the site is<br />
shown <strong>in</strong> Figure 1. The utilities that are used at site Stenungsund<br />
are listed below. Disturbance limits for these utilities<br />
have been determ<strong>in</strong>ed by speak<strong>in</strong>g <strong>to</strong> opera<strong>to</strong>rs and other<br />
Figure 1. Product flow at site Stenungsund.