A Procedure to Simulate the Turbulent Noise Interior of Cars ... - FKFS
A Procedure to Simulate the Turbulent Noise Interior of Cars ... - FKFS
A Procedure to Simulate the Turbulent Noise Interior of Cars ... - FKFS

You also want an ePaper? Increase the reach of your titles
YUMPU automatically turns print PDFs into web optimized ePapers that Google loves.
Introduction<br />
A <strong>Procedure</strong> <strong>to</strong> <strong>Simulate</strong> <strong>the</strong> <strong>Turbulent</strong> <strong>Noise</strong> <strong>Interior</strong> <strong>of</strong> <strong>Cars</strong><br />
S. Krampol 1 , M. Riegel 2 , J. Wiedemann 3<br />
1 <strong>FKFS</strong>, 70569 Stuttgart, Germany, Email: susanne.krampol@fkfs.de<br />
2 <strong>FKFS</strong>, 70569 Stuttgart, Germany, Email: matthias.riegel@fkfs.de<br />
3 <strong>FKFS</strong>, 70569 Stuttgart, Germany, Email: jochen.wiedemann@fkfs.de<br />
The development effort has been expended on lowering <strong>the</strong><br />
aerodynamically generated noise as <strong>the</strong> powertrain noise and<br />
<strong>the</strong> tyre-road noise <strong>of</strong> mo<strong>to</strong>r vehicles have been reduced<br />
continuously over <strong>the</strong> past decades [1]. The classic wind<br />
noise optimisation is performed in full-size wind tunnels<br />
under flow conditions which are considered invariant in<br />
space and time. The noise generated under so-called smooth<br />
flow conditions leave a steady audi<strong>to</strong>ry impression on <strong>the</strong><br />
occupants. The natural wind environment differs<br />
significantly from <strong>the</strong> flow conditions simulated in <strong>the</strong> wind<br />
tunnel. A turbulent on-road flow condition arising from <strong>the</strong><br />
atmosphere and wakes <strong>of</strong> o<strong>the</strong>r vehicles generates an<br />
instationary wind noise. Human hearing is quite sensitive <strong>to</strong><br />
time-related structures as audible in <strong>the</strong> modulated,<br />
instationary wind noise. Variations in flow velocity have an<br />
effect on <strong>the</strong> sound pressure level (SPL). The acoustic signal<br />
is amplitude-modulated and correlates with <strong>the</strong> approaching<br />
flow velocity. Variations in flow direction have an influence<br />
on <strong>the</strong> frequency spectrum because cross winds lead <strong>to</strong><br />
changing flow conditions along <strong>the</strong> vehicle (e. g. A-pillar,<br />
mirror) [2]. Changes in amplitude and frequency in a short<br />
period <strong>of</strong> time are thus clearly perceptible <strong>to</strong> <strong>the</strong> human ear<br />
and leave an unpleasant hearing impression. Hence, a<br />
detailed knowledge <strong>of</strong> <strong>the</strong> turbulent flow field and <strong>the</strong>ir<br />
impact on <strong>the</strong> instationary wind noise is essential. Acoustic<br />
effects <strong>of</strong> changing flow conditions, however, have so far<br />
been largely neglected in <strong>the</strong> vehicle development process.<br />
In order <strong>to</strong> provide a high level <strong>of</strong> noise comfort, it should be<br />
possible <strong>to</strong> examine <strong>the</strong> acoustic behaviour <strong>of</strong> a vehicle<br />
under <strong>the</strong>se conditions as well.<br />
The passive turbulence generation method is a commonly<br />
used experimental approach for generating turbulent flow in<br />
<strong>the</strong> wind tunnel. Special active vortex genera<strong>to</strong>rs have<br />
already been used in different wind tunnels, <strong>to</strong>o. An example<br />
<strong>of</strong> such an installation in <strong>the</strong> nozzle exit <strong>of</strong> <strong>the</strong> wind tunnel is<br />
<strong>the</strong> Pininfarina Turbulence Generation System (TGS) [3]. It<br />
consists <strong>of</strong> five groups <strong>of</strong> Vortex Genera<strong>to</strong>rs (VG) and has<br />
been operative since 2003. Such systems are suitable for <strong>the</strong><br />
simulation <strong>of</strong> instationary wind noise in <strong>the</strong> wind tunnel only<br />
<strong>to</strong> a certain extent, as <strong>the</strong> large turbulent length scales<br />
occurring under atmospheric conditions cannot be<br />
reproduced by this technique [4].<br />
The Research Institute <strong>of</strong> Au<strong>to</strong>motive Engineering and<br />
Vehicle Engines Stuttgart (<strong>FKFS</strong>) has <strong>the</strong>refore developed a<br />
procedure for <strong>the</strong> computer-aided simulation <strong>of</strong> instationary<br />
wind noise. The noise syn<strong>the</strong>sis represents an innovative<br />
approach for <strong>the</strong> integration <strong>of</strong> instationary wind noise in<strong>to</strong><br />
noise assessment, without having <strong>to</strong> carry out extensive<br />
modifications <strong>to</strong> <strong>the</strong> wind tunnel hardware or time-intensive<br />
measurements on <strong>the</strong> road.<br />
<strong>Procedure</strong> <strong>of</strong> <strong>Noise</strong> Syn<strong>the</strong>sis<br />
The aim <strong>of</strong> <strong>the</strong> noise syn<strong>the</strong>sis is <strong>the</strong> simulation <strong>of</strong> realistic<br />
instationary wind noise. The noise sy<strong>the</strong>sis is based on wind<br />
tunnel interior noise measurements carried out for each<br />
vehicle under smooth flow conditions at varying flow<br />
velocities and yaw angles (by using <strong>the</strong> wind tunnel<br />
turntable). Different noise sequences taken from <strong>the</strong><br />
stationary measurements are <strong>the</strong>n combined <strong>to</strong> form <strong>the</strong><br />
corresponding instationary wind noise. The input data<br />
required <strong>to</strong> carry out a noise syn<strong>the</strong>sis consists <strong>of</strong> a chosen<br />
flow condition with which <strong>the</strong> noise sequences <strong>to</strong> be<br />
combined can be determined and <strong>the</strong> noise database, where<br />
<strong>the</strong> measured stationary wind noise is s<strong>to</strong>red (see Figure 1).<br />
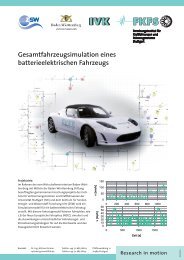
Figure 1: Schema <strong>of</strong> noise syn<strong>the</strong>sis<br />
The flow condition for which <strong>the</strong> instationary wind noise is<br />
<strong>to</strong> be syn<strong>the</strong>sised must be available as a time signal and must<br />
contain <strong>the</strong> spatial flow velocity components so that yaw<br />
angle and flow velocity in <strong>the</strong> longitudinal direction (ucomponent)<br />
<strong>of</strong> <strong>the</strong> vehicle can be determined.
The flow condition can be available as an actually measured<br />
time signal or it can be a computer-generated time signal.<br />
The basic principle <strong>of</strong> noise syn<strong>the</strong>sis is reading <strong>the</strong> values<br />
<strong>of</strong> <strong>the</strong> flow velocity and yaw angle from <strong>the</strong> flow condition<br />
at a discrete point in time as well as loading <strong>the</strong><br />
corresponding stationary noise file from <strong>the</strong> noise database.<br />
By sampling <strong>the</strong> time signal <strong>of</strong> <strong>the</strong> flow condition, as shown<br />
in Figure 1, <strong>the</strong> sequential order and length <strong>of</strong> <strong>the</strong> different<br />
noise sequences from <strong>the</strong> noise database are determined.<br />
Sampling <strong>the</strong> flow condition with 10 Hz means that within a<br />
second, ten stationary noise files are combined consecutively<br />
<strong>to</strong> form <strong>the</strong> syn<strong>the</strong>sised wind noise sample. By using a<br />
crossfader one stationary noise file is faded out while <strong>the</strong><br />
next one is faded in. In this way syn<strong>the</strong>sised sound samples<br />
<strong>of</strong> any length and for selected flow conditions can be<br />
generated and assessed for any vehicle measured in <strong>the</strong> wind<br />
tunnel.<br />
Definition <strong>of</strong> Tasks<br />
It is necessary <strong>to</strong> assess methods <strong>of</strong> measurement and<br />
analysis technology in order <strong>to</strong> minimise time and work and<br />
<strong>to</strong> guarantee that <strong>the</strong> received results are significant. An<br />
au<strong>to</strong>mated run <strong>of</strong> instationary wind noise syn<strong>the</strong>sis ensures a<br />
fast comparison <strong>of</strong> syn<strong>the</strong>sised sound samples. Among<br />
o<strong>the</strong>rs, <strong>the</strong> following points must be clarified:<br />
- Which position near <strong>the</strong> vehicle is most suitable for<br />
measuring <strong>the</strong> local approaching flow? At which<br />
measuring positions do vortices occur which have<br />
<strong>the</strong> highest influence on <strong>the</strong> instationary wind<br />
noise?<br />
- Which fac<strong>to</strong>rs must be considered when compiling<br />
<strong>the</strong> noise database? Which range <strong>of</strong> flow velocity<br />
and yaw angle are relevant for noise syn<strong>the</strong>sis?<br />
- What sampling frequency <strong>of</strong> <strong>the</strong> flow condition<br />
provides optimum results? How can <strong>the</strong> sampling<br />
frequency be selected optimally on <strong>the</strong> basis <strong>of</strong> <strong>the</strong><br />
flow spectrum?<br />
- How should <strong>the</strong> stationary noise files be combined?<br />
What fade-over time is best?<br />
Validating <strong>Noise</strong> Syn<strong>the</strong>sis<br />
In order <strong>to</strong> find answers <strong>to</strong> <strong>the</strong>se questions a method for<br />
validating noise syn<strong>the</strong>sis must be found. Due <strong>to</strong> disturbing<br />
noise sources, measurements made on <strong>the</strong> road are <strong>of</strong> only<br />
limited use. Validation examinations were thus carried out in<br />
<strong>the</strong> full-scale aeroacoustic wind tunnel <strong>of</strong> <strong>the</strong> University <strong>of</strong><br />
Stuttgart.<br />
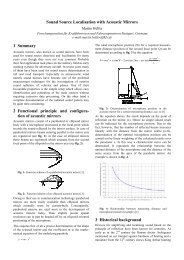
Figure 2 illustrates <strong>the</strong> full-scale aeroacoustic wind tunnel <strong>of</strong><br />
<strong>the</strong> University <strong>of</strong> Stuttgart including <strong>the</strong> measurement set-up<br />
for validation. It shows <strong>the</strong> situation for <strong>the</strong> case <strong>of</strong> turbulent<br />
flow with a vehicle driving ahead. The measuring set-up<br />
consists <strong>of</strong> a vehicle as a turbulence genera<strong>to</strong>r placed inside<br />
<strong>the</strong> nozzle area and <strong>the</strong> vehicle <strong>to</strong> be measured positioned in<br />
<strong>the</strong> collec<strong>to</strong>r downstream.<br />
Figure 2: Plan view <strong>of</strong> <strong>the</strong> full-scale aeroacoustic wind<br />
tunnel <strong>of</strong> <strong>the</strong> University <strong>of</strong> Stuttgart including <strong>the</strong><br />
measuring set-up (right: turbulence generating vehicle in<br />
<strong>the</strong> nozzle exit, left: test vehicle in <strong>the</strong> centreline <strong>of</strong> <strong>the</strong><br />
collec<strong>to</strong>r)<br />
Measurements under this turbulent flow condition were<br />
carried out consecutively on a SUV, on an upper-middle<br />
class car and on a vehicle <strong>of</strong> <strong>the</strong> compact-size category while<br />
<strong>the</strong> turbulence generating vehicle remained unchanged in <strong>the</strong><br />
nozzle exit. Acoustic time signals were recorded at a<br />
velocity <strong>of</strong> 160 km/h by means <strong>of</strong> an artificial head placed<br />
on <strong>the</strong> driver's seat. In each measurement <strong>the</strong> sampling<br />
frequency <strong>of</strong> <strong>the</strong> artificial head was set <strong>to</strong> 44.1 kHz with a<br />
high pass filter <strong>of</strong> 20 Hz. The instationary wind noise<br />
recorded for each test vehicle under this turbulent flow<br />
condition was used as a reference signal with which <strong>the</strong><br />
syn<strong>the</strong>tically produced sound samples were compared during<br />
validation.<br />
Fur<strong>the</strong>rmore it was necessary <strong>to</strong> determine <strong>the</strong> local<br />
turbulent flow close <strong>to</strong> <strong>the</strong> vehicle. A four-hole probe was<br />
used for measuring <strong>the</strong> flow velocity components (also at a<br />
velocity <strong>of</strong> 160 km/h). The sampling frequency was 625 Hz.<br />
The four-hole probe was located at various measuring<br />
positions near <strong>the</strong> test vehicle. Since <strong>the</strong> flow condition in<br />
<strong>the</strong> area <strong>of</strong> <strong>the</strong> front vehicle has a significant effect on <strong>the</strong><br />
generation <strong>of</strong> aerodynamic noise, <strong>the</strong> measuring positions<br />
were primarily positioned <strong>the</strong>re. Among o<strong>the</strong>rs, <strong>the</strong>y were in<br />
<strong>the</strong> centre <strong>of</strong> <strong>the</strong> hood, over <strong>the</strong> fender and above <strong>the</strong> Apillar.<br />
In addition <strong>to</strong> <strong>the</strong> turbulent flow data, a noise database<br />
must be compiled. For this, wind noises were measured and<br />
s<strong>to</strong>red in a noise database for various flow velocities and<br />
yaw angles under smooth flow conditions.<br />
With <strong>the</strong> time his<strong>to</strong>ry <strong>of</strong> <strong>the</strong> turbulent flow data and <strong>the</strong> noise<br />
database <strong>the</strong> basic preconditions for noise syn<strong>the</strong>sis are<br />
fulfilled. The measured data can be loaded with a noise<br />
syn<strong>the</strong>sis audio mixer developed on <strong>the</strong> basis <strong>of</strong> Matlab. The<br />
syn<strong>the</strong>sised noise can be subsequently calculated for<br />
different measuring positions and different sampling<br />
frequencies <strong>of</strong> <strong>the</strong> flow.
Findings<br />
Stationary noise files with velocity increments <strong>of</strong> 2 km/h and<br />
yaw angles with increments <strong>of</strong> 2.5° proved <strong>to</strong> be optimal for<br />
compiling <strong>the</strong> noise database. The stationary wind noises<br />
were recorded at <strong>the</strong> respective yaw angles (range from -20°<br />
<strong>to</strong> +20°) by means <strong>of</strong> speed ramps (from 60 km/h <strong>to</strong><br />
200 km/h) which guarantee time- and cost-savings. It was<br />
found that <strong>the</strong> flow measured with <strong>the</strong> four-hole probe<br />
strongly depends on <strong>the</strong> measuring position and <strong>the</strong> shape <strong>of</strong><br />
<strong>the</strong> test vehicle. Since <strong>the</strong> composition <strong>of</strong> <strong>the</strong> stationary noise<br />
files is based on <strong>the</strong> flow condition, <strong>the</strong> measuring position<br />
significantly affects <strong>the</strong> syn<strong>the</strong>sised noise.<br />
Hearing comparisons were performed <strong>to</strong> verify <strong>the</strong><br />
applicability <strong>of</strong> noise syn<strong>the</strong>sis. A group <strong>of</strong> 25 persons had<br />
<strong>to</strong> compare different syn<strong>the</strong>sised noises with <strong>the</strong><br />
corresponding reference noise. The results showed <strong>the</strong><br />
highest similarity <strong>of</strong> reference noise and syn<strong>the</strong>sised noise<br />
for <strong>the</strong> measuring positions above <strong>the</strong> fender and sampling<br />
frequencies for <strong>the</strong> flow condition at 10 or 15 Hz.<br />
For an objective examination and <strong>the</strong> visualisation <strong>of</strong> <strong>the</strong><br />
instationary audi<strong>to</strong>ry perception, <strong>the</strong> modulation spectrum <strong>of</strong><br />
<strong>the</strong> acoustic signal over time is an appropriate <strong>to</strong>ol. In this<br />
context, it is important <strong>to</strong> know that human hearing reacts<br />
with high sensitivity <strong>to</strong> amplitude modulations <strong>of</strong> fm = 4 Hz.<br />
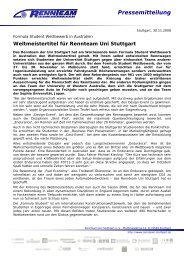
Figure 3 shows <strong>the</strong> modulation spectrum <strong>of</strong> <strong>the</strong> syn<strong>the</strong>sised<br />
noise and <strong>the</strong> recorded reference noise under turbulent flow<br />
conditions as well as <strong>the</strong> modulation spectrum <strong>of</strong> <strong>the</strong><br />
stationary noise (160 km/h, 0°) for <strong>the</strong> compact-size car.<br />
Figure 3: Modulation spectra over time in <strong>the</strong> 5.6-kHz<br />
octave band for <strong>the</strong> compact class car, left ear<br />
The modulation analysis is based on <strong>the</strong> calculation <strong>of</strong> <strong>the</strong><br />
envelope <strong>of</strong> <strong>the</strong> band-pass filtered noise signal using <strong>the</strong><br />
Hilbert transform. The last step <strong>of</strong> <strong>the</strong> modulation analysis is<br />
a Fourier analysis <strong>of</strong> <strong>the</strong> envelope which shows <strong>the</strong> resulting<br />
modulations. The strength <strong>of</strong> <strong>the</strong> modulation is given by <strong>the</strong><br />
degree <strong>of</strong> modulation m which is generally defined as <strong>the</strong><br />
ratio <strong>of</strong> an alternating component <strong>to</strong> a constant component <strong>of</strong><br />
an amplitude-modulated signal .The degree <strong>of</strong> modulation m<br />
is colour-coded. The result <strong>of</strong> <strong>the</strong> syn<strong>the</strong>sised noise is shown<br />
in Figure 3 for a sampling frequency <strong>of</strong> 15 Hz and <strong>the</strong> flow<br />
condition measured above <strong>the</strong> fender. Syn<strong>the</strong>sised noise and<br />
reference noise showed similar degrees <strong>of</strong> modulation. As<br />
expected, <strong>the</strong> stationary noise measured under a yaw angle<br />
<strong>of</strong> 0° has <strong>the</strong> lowest modulation degrees. The similarity <strong>of</strong><br />
<strong>the</strong> modulation spectra and <strong>the</strong> subjective impression <strong>of</strong> <strong>the</strong><br />
hearing comparison prove <strong>the</strong> basic applicability <strong>of</strong> noise<br />
syn<strong>the</strong>sis for analysing instationary wind noise.<br />
Conclusions and Outlook<br />
In order <strong>to</strong> be able <strong>to</strong> meet <strong>the</strong> increasing demand for higher<br />
acoustic comfort in <strong>the</strong> future, it will be crucial <strong>to</strong> include<br />
<strong>the</strong> optimisation <strong>of</strong> instationary wind noise in <strong>the</strong> vehicle<br />
development process. One approach <strong>to</strong> this end is <strong>the</strong><br />
application <strong>of</strong> noise syn<strong>the</strong>sis processes for simulating <strong>the</strong><br />
acoustic behaviour <strong>of</strong> vehicles in turbulent flows. The<br />
method developed at <strong>the</strong> <strong>FKFS</strong> shows promising initial<br />
results. The audio mixer developed on <strong>the</strong> basis <strong>of</strong> Matlab<br />
permits an optimised procedure in <strong>the</strong> generation <strong>of</strong><br />
syn<strong>the</strong>sised noise as well as a flexible implementation <strong>of</strong><br />
parameters. With <strong>the</strong> help <strong>of</strong> this method for acoustic<br />
development time-consuming road measurements and<br />
complex turbulence generation mechanisms in aeroacoustic<br />
wind tunnels can be avoided. Before noise syn<strong>the</strong>sis can be<br />
integrated in<strong>to</strong> <strong>the</strong> vehicle development process on a regular<br />
basis, however, more extensive optimisation <strong>of</strong> <strong>the</strong> method is<br />
required, above all <strong>the</strong> determination and validation <strong>of</strong> o<strong>the</strong>r<br />
relevant flow situations. Additional effort should go in<strong>to</strong><br />
determining an index for describing a vehicle's sensitivity <strong>to</strong><br />
interior noise with respect <strong>to</strong> turbulent flow. This would<br />
permit <strong>the</strong> fast and easy comparison <strong>of</strong> different vehicles in<br />
benchmark studies.<br />
References<br />
[1] Blumrich, R.: Vehicle Aeroacoustics – Today and<br />
Future Developments. 5th Int. Styrian <strong>Noise</strong>, Vibration<br />
& Harshness Congress “Optimising NVH in future<br />
vehicles” Graz; 2008<br />
[2] Riegel, M.; Helfer, M.; Wiedemann, J.: The effect <strong>of</strong><br />
turbulence on in-cabin wind noise – a comparison <strong>of</strong><br />
road and wind tunnel results. In: 6th MIRA International<br />
Vehicle Aerodynamics Conference; 2006<br />
[3] Lindener, N.; Miehling, H.; Cogotti, A.; Cogotti, F.;<br />
Maffei, M.: Aeroacoustic Measurements in Tubulent<br />
Flow on <strong>the</strong> Road and in <strong>the</strong> Wind Tunnel. SAE paper<br />
No. 2007-01-1551; 2007<br />
[4] Watkins, S.; Saunders, J.: A review <strong>of</strong> <strong>the</strong> wind<br />
conditions experienced by a moving vehicle. SAE paper<br />
No. 981182; 1998