R A I LT R AC K - The Railways Archive
R A I LT R AC K - The Railways Archive
R A I LT R AC K - The Railways Archive

You also want an ePaper? Increase the reach of your titles
YUMPU automatically turns print PDFs into web optimized ePapers that Google loves.
developing<br />
We believe that this<br />
growth is not merely<br />
a reflection of the<br />
current phase of the<br />
economic cycle, but<br />
heralds a trend<br />
which is potentially<br />
capable of being<br />
sustained. . .<br />
64<br />
120<br />
100<br />
80<br />
60<br />
40<br />
20<br />
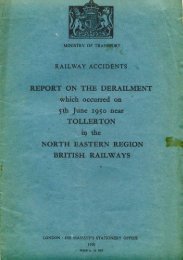
6.2 continued 6.3 6.4<br />
Passenger gr owth (billion passenger kilometres)<br />
Source:Transport statistics Great Britain 1998;Railtrack demand models<br />
century and,in particular, since the 1950s.Its share has been<br />
under 6% since the ear ly 1990s.However, since 1910,the<br />
absolute level of passenger rail volume , while fluctuating with<br />
economic cycles,has remained remarkably constant as the<br />
graph above indicates.This has happened through periods of<br />
immense social change, two world wars,and the<br />
transformation of personal transport through the motorcar.<br />
Such stability against such a background is strongly<br />
s u g g e s t i ve of other factors . In our opinion, it results from an<br />
ove rall capacity constraint on the rail netwo rk , for although it is<br />
t rue that netwo rk size has been reduced, the portions that<br />
h ave been closed actually carried ve ry little tra f fi c.<strong>The</strong> Beeching<br />
cuts of the 1960s are scarcely noticeable on the gra p h .<br />
In the two years since privatisation was completed,<br />
passenger kilometres have risen by 15%.However, the<br />
resulting traffic volumes have not exceeded the parameters<br />
of the recent past.<br />
We believe that this growth is not merely a reflection<br />
of the current phase of the economic cycle, but heralds a<br />
trend which is potentially capable of being sustained.But<br />
unless the century-long capacity constraint is tackled,such<br />
growth cannot continue.<br />
We set out in this section plans to create this extra<br />
capacity. Many of the schemes are fully commercially viable,<br />
and we are committed to them.Others require a<br />
partnership approach and a proportion of public funding,<br />
and we are also prepared to commit to these.<br />
Annual compound growth rate 4.3%<br />
Annual compound growth rate 0.7%<br />
0<br />
1910 1930 1950 1970 1990 2010 2030<br />
Together, these plans provide capacity to enable<br />
passenger traffic growth of around 30% over the next ten<br />
years,and involve total expenditure of around £27bn<br />
(compared to £17bn in last year’s NMS).Nevertheless,even<br />
112<br />
96<br />
80<br />
64<br />
48<br />
32<br />
16<br />
Fr eight gr owth (billion gross tonne-kilometres)<br />
S o u r c e :Tra n s p o rt statistics Great Britain 1998;R a i l t rack analysis and freight opera t o rs ’fo r e c a s t s<br />
0<br />
1953 1960 1970 1980 1990 2000 2007<br />
this level of growth,although unprecedented this century, is<br />
at the lower end of the range that some of our train<br />
company customers aspire to achieve.<br />
6.3 Freight markets and growth<br />
Our freight growth assumptions are driven principally by<br />
working with our existing customers and understanding how<br />
their own businesses need to develop if they are to<br />
successfully capture market share.We have also developed a<br />
freight demand model,and continue to discuss new business<br />
opportunities with prospective customers.<strong>The</strong> results of this<br />
analysis have led us to develop the freight strategy set out in<br />
Section 7.<strong>The</strong> graph above indicates the range of possible<br />
growth scenarios.<br />
6.4 Capacity bottlenecks<br />
Operator forecast – annual compound growth rate 9.1%<br />
Low – annual compound<br />
growth rate 1.4%<br />
<strong>The</strong> 1998 NMS identified locations on the network with<br />
current and predicted congestion.<strong>The</strong>se locations were<br />
identified through a systematic evaluation of capacity across<br />
the whole network,which established current and predicted<br />
train-path use and capacity indicators for all key terminals,<br />
junctions and plain line sections.Utilisation percentages were<br />
then derived by dividing actual or forecast train paths by the<br />
maximum number allowed.<strong>The</strong> locations identified in the<br />
1998 NMS were all those with current or predicted use,<br />
measured at 90% or above, together with a small number of<br />
other locations at which use is slightly below this level but<br />
which have high levels of reactionary delays.<br />
Railtrack has evaluated the technical options for<br />
alleviating the current and potential congestion problems<br />
identified at these locations.<strong>The</strong>se technical options have