
Create successful ePaper yourself
Turn your PDF publications into a flip-book with our unique Google optimized e-Paper software.
Telephone Nigam Ltd, its<br />
counterpart in Mumbai<br />
and Delhi) to reduce staff<br />
in a targeted manner. What<br />
is the update on your plan<br />
for a voluntary retirement<br />
scheme?<br />
BSNL’s biggest problem<br />
is that 49 per cent of<br />
revenues go towards staff<br />
salaries. That is why we are<br />
exploring all possible<br />
revenue streams, including<br />
land resources. The proposal<br />
for VRS is still pending.<br />
What other new<br />
projects are on the anvil<br />
for increasing revenues?<br />
We have chalked out a<br />
strategy to increase<br />
revenues by 10-15 per cent<br />
through various measures,<br />
including leasing out real<br />
estate, outsourcing<br />
operations, management of<br />
towers, and offering<br />
enterprise services. We also<br />
plan to make full use of our<br />
seven telecom factories. We<br />
have galvanising facilities in<br />
our units, used for tower<br />
manufacturing. We have had<br />
initial discussions with<br />
private players and will soon<br />
come out with an Expression<br />
of Interest on appointing a<br />
consultant for this.<br />
Besides, we will be<br />
focusing on broadband<br />
services across all<br />
technology platforms.<br />
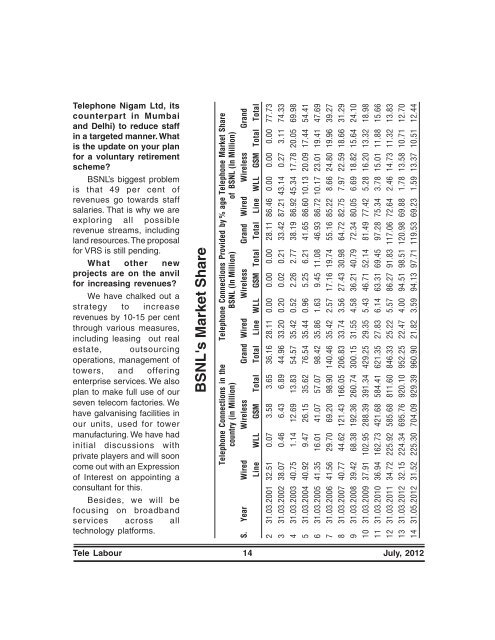
BSNL's Market Share<br />
Telephone Connections in the Telephone Connections Provided by % age Telephone Market Share<br />
country (in Million) BSNL (In Million) of BSNL (In Million)<br />
S. Year Wired Wireless Grand Wired Wireless Grand Wired Wireless Grand<br />
Line WLL GSM Total Total Line WLL GSM Total Total Line WLL GSM Total Total<br />
2 31.03.2001 32.51 0.07 3.58 3.65 36.16 28.11 0.00 0.00 0.00 28.11 86.46 0.00 0.00 0.00 77.73<br />
3 31.03.2002 38.07 0.46 6.43 6.89 44.96 33.20 0.20 0.02 0.21 33.42 87.21 43.14 0.27 3.11 74.33<br />
4 31.03.2003 40.75 1.14 12.69 13.83 54.57 35.42 0.52 2.26 2.77 38.19 86.92 45.34 17.78 20.05 69.98<br />
5 31.03.2004 40.92 9.47 26.15 35.62 76.54 35.44 0.96 5.25 6.21 41.65 86.60 10.13 20.09 17.44 54.41<br />
6 31.03.2005 41.35 16.01 41.07 57.07 98.42 35.86 1.63 9.45 11.08 46.93 86.72 10.17 23.01 19.41 47.69<br />
7 31.03.2006 41.56 29.70 69.20 98.90 140.46 35.42 2.57 17.16 19.74 55.16 85.22 8.66 24.80 19.96 39.27<br />
8 31.03.2007 40.77 44.62 121.43 166.05 206.83 33.74 3.56 27.43 30.98 64.72 82.75 7.97 22.59 18.66 31.29<br />
9 31.03.2008 39.42 68.38 192.36 260.74 300.15 31.55 4.58 36.21 40.79 72.34 80.05 6.69 18.82 15.64 24.10<br />
10 31.03.2009 37.91 102.95 288.39 391.34 429.25 29.35 5.43 46.71 52.14 81.49 77.42 5.28 16.20 13.32 18.98<br />
11 31.03.2010 36.94 162.73 421.68 584.41 621.35 27.83 6.14 63.31 69.45 97.28 75.34 3.78 15.01 11.88 15.66<br />
12 31.03.2011 34.72 225.92 585.68 811.60 846.33 25.22 5.57 86.27 91.83 117.06 72.64 2.46 14.73 11.32 13.83<br />
13 31.03.2012 32.15 224.34 695.76 920.10 952.25 22.47 4.00 94.51 98.51 120.98 69.88 1.78 13.58 10.71 12.70<br />
14 31.05.2012 31.52 225.30 704.09 929.39 960.90 21.82 3.59 94.13 97.71 119.53 69.23 1.59 13.37 10.51 12.44<br />
Tele Labour 14 July, 2012