Coastline Reports 16 (2010) From Brazil to Thailand - Küsten Union ...
Coastline Reports 16 (2010) From Brazil to Thailand - Küsten Union ...
Coastline Reports 16 (2010) From Brazil to Thailand - Küsten Union ...

Create successful ePaper yourself
Turn your PDF publications into a flip-book with our unique Google optimized e-Paper software.
EUCC<br />
COASTLINE<br />
REPORTS<br />
<strong>2010</strong>-<strong>16</strong><br />
<strong>From</strong> <strong>Brazil</strong> <strong>to</strong> <strong>Thailand</strong> -<br />
New Results in Coastal Research<br />
Edi<strong>to</strong>rs:<br />
K. Schwarzer, K. Schrottke & K. Stattegger<br />
The Coastal <strong>Union</strong><br />
Die <strong>Küsten</strong> <strong>Union</strong> Deutschland
<strong>Coastline</strong> <strong>Reports</strong><br />
<strong>16</strong> (<strong>2010</strong>)<br />
<strong>From</strong> <strong>Brazil</strong> <strong>to</strong> <strong>Thailand</strong> -<br />
New Results in Coastal Research<br />
Edi<strong>to</strong>rs:<br />
Klaus Schwarzer, Kerstin Schrottke & Karl Stattegger<br />
Christian-Albrechts-Universität Kiel<br />
Kiel, <strong>2010</strong><br />
ISSN 0928-2734<br />
ISBN 978-3-9811839-9-3
Imprint<br />
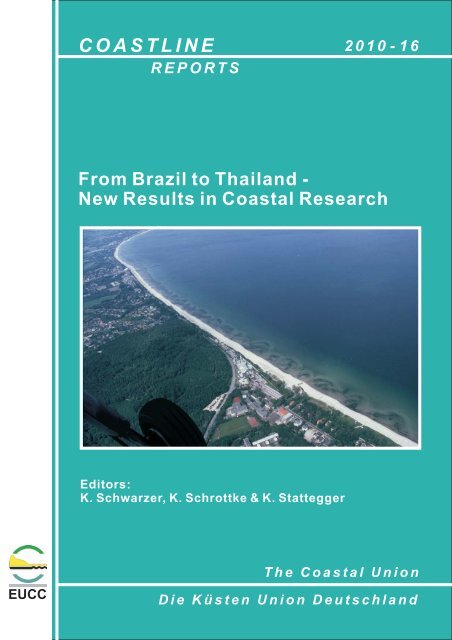
Pho<strong>to</strong> front: Inner Lübeck Bay (Timmendorf <strong>to</strong> Haffkrug) showing a crescentic nearshore bar system<br />
(Pho<strong>to</strong>: Klaus Schwarzer)<br />
<strong>Coastline</strong> <strong>Reports</strong> is published by:<br />
EUCC – Die <strong>Küsten</strong> <strong>Union</strong> Deutschland e.V.<br />
c/o Leibniz-Institut für Ostseeforschung Warnemünde<br />
Seestr. 15,<br />
18119 Ros<strong>to</strong>ck, Germany<br />
eucc@eucc-d.de<br />
<strong>Coastline</strong> <strong>Reports</strong> are available online under http://www.eucc-d.de/ and http://www.eucc.net/. For<br />
hardcopies please contact the edi<strong>to</strong>rs or the EUCC.
Vorwort der Herausgeber<br />
Die 27. Jahrestagung des Arbeitskreises „Geographie der Meere und <strong>Küsten</strong>“ (AMK) fand vom 24.-<br />
26. April 2009 in Kiel statt. Schon mehrfach waren Einrichtungen der Christian-Albrechts-Universität<br />
zu Kiel Gastgeber dieser Veranstaltungsreihe, doch erstmals waren das Institut für Geowissenschaften<br />
(IfG), AG Sedimen<strong>to</strong>logie, <strong>Küsten</strong>- und Schelfgeologie, gemeinsam mit dem Exzellenzcluster „Ozean<br />
der Zukunft, AG Meeresspiegelanstieg und <strong>Küsten</strong>erosion“ die Ausrichter. Dieser Standort an der<br />
Kieler Förde hat einen besonderen Bezug zur maritimen Forschung. Von hier aus nahmen viele<br />
Bereiche der deutschen, aber auch der internationalen Meeresforschung ihren Ursprung. Der<br />
Stellenwert der marinen Forschung in Kiel wird auch dadurch unterstrichen, dass hier 1987 das<br />
Forschungszentrum für marine Geowissenschaften GEOMAR gegründet wurde, welches sich am 1.<br />
Januar 2004 mit dem ehemaligen Institut für Meereskunde zum Leibniz-Institut für<br />
Meereswissenschaften IFM-GEOMAR vereinigte, welches heute seinen Hauptsitz an der<br />
Schwentinemündung auf dem Ostufer hat. Keine andere Stadt der Welt kann auf eine Tradition von<br />
über 300 Jahren interdisziplinärer Meeresforschung zurückblicken und in keiner anderen Stadt kann<br />
man mit ein bisschen Glück vier Forschungsschiffe (POLARFUCHS, LITTORINA, ALKOR und<br />
POSEIDON) nahe der Innenstadt an der Institutspier des IFM-GEOMAR gleichzeitig versammelt<br />
sehen.<br />
Die aktive Arbeit im Arbeitskreis findet ihren Höhepunkt in einer alljährlichen Tagung. Die Vielzahl<br />
der im <strong>Küsten</strong>bereich aktiven Disziplinen schlug sich diesmal in 26 Vorträgen und 10 Postern nieder,<br />
die neben der geowissenschaftlichen Seite auch die Ingenieurwissenschaften und die Biologie<br />
einschlossen. Aber auch die Umsetzung und Nutzung der im Feld und im Labor erarbeiteten Daten<br />
durch die unterschiedlichsten Bundes- und Landesbehörden und Einrichtungen der<br />
Wasserwirtschaftsverwaltung ist in den Vorträgen vertreten. Beispielsweise wurden<br />
Risikoabschätzungen für den <strong>Küsten</strong>raum, mit seinen Flussmündungen sowie das Datenmanagement<br />
auf nationaler und internationaler Ebene diskutiert. In diesem Band werden 17 der insgesamt 36<br />
Beiträge vorgestellt.<br />
Der Veranstaltungsort in Schleswig-Holstein, als einziges Bundesland an zwei Meeren gelegen, führt<br />
fast au<strong>to</strong>matisch zu den regionalen Schwerpunkten Nord- und Ostsee. Aber auch die Elbe, als die<br />
südliche Begrenzung von Schleswig-Holstein findet ihren Raum in den Vorträgen. Hamburg, als eine<br />
der größten Hafenstädte Europas an der Elbe gelegen, präsentierte seinen Fluss und die damit<br />
zusammenhängenden vielfältigen Herausforderungen. Hier wird die interdisziplinäre Zusammenarbeit<br />
besonders deutlich. Auch andere <strong>Küsten</strong>regionen Europas und der Welt wurden in Vorträgen und<br />
Postern präsentiert. Inhaltlich waren die Themen vielfältiger Art, sie handelten von<br />
Sedimentumlagerungen in Flussmündungen bis hin zu Kulturlandschaftsänderungen an der Küste<br />
durch Biokrafts<strong>to</strong>ffproduktion. Als ein weiterer fachlicher Schwerpunkt kristallisiert sich seit einigen<br />
Jahren die Tsunami-Forschung heraus.<br />
Stets ist auch eine Exkursion mit der AMK-Jahrestagung verknüpft. Es gibt in Schleswig-Holstein<br />
wohl keine bessere Lokalität für die Darstellung des großen Spektrums der <strong>Küsten</strong>forschung als die<br />
Nordseeinsel Sylt. Von der natürlicher <strong>Küsten</strong>entwicklung der Wattbereiche und der sandigen<br />
Brandungsküsten bis hin zu den vielfältigen Maßnahmen des modernen, technischen <strong>Küsten</strong>schutzes<br />
hat diese Insel alles zu bieten.<br />
Die Bandbreite der <strong>Küsten</strong>forschung spiegelt sich schon beim Titel beginnend, in diesem<br />
Tagungsband wider. Das ist für die Tagungen des Arbeitskreises der Meere und <strong>Küsten</strong> durchaus
gewollt, da auch diee<br />
geologischh-geographische<br />
<strong>Küsten</strong>-<br />
und Meereesforschung<br />
ein großes Spektrum S<br />
aufweistt.<br />
Die Kunsthalle<br />
zu Kiel unterrstützte<br />
mit all ihren logistischen l<br />
Möglichkeiiten<br />
die 27 7. AMK-<br />
Jahrestaggung,<br />
und diie<br />
Nähe zu dden<br />
Kuns<strong>to</strong>bjekten<br />
gab di ieser Veransttaltung<br />
ein gganz<br />
besonde eres Flair.<br />
Logistiscche<br />
Unterstüützung<br />
erfollgte<br />
auch voom<br />
IFM-GE EOMAR undd<br />
dem Präsidium<br />
der CAU. C Die<br />
vielen ffreiwillig<br />
heelfenden<br />
Sttudentinnen<br />
und Studen nten, die eein<br />
großes Interesse an a dieser<br />
<strong>Küsten</strong>foorschung<br />
zeiigen,<br />
lassen, was den wisssenschaftlic<br />
chen Nachwuuchs<br />
angeht, hoffnungsv voll in die<br />
Zukunft blicken.<br />
Klaus Schwarzer,<br />
KKerstin<br />
Schrrottke<br />
& Kaarl<br />
Stattegge er<br />
Christiaan-Albrechtss-Universitäät<br />
Kiel, Instiitut<br />
für Geowissenschafften<br />
Exzellennzcluster<br />
Ozzean<br />
der Zukunft,<br />
Chrisstian-Albrec<br />
chts-Universität<br />
Kiel
Vorwort des Sprechers<br />
Die 27. Jahrestagung des Arbeitskreises „Geographie der Meere und <strong>Küsten</strong>“ (AMK) fand auf<br />
Einladung von Klaus Schwarzer und Karl Stattegger vom Institut für Geowissenschaften, <strong>Küsten</strong>- und<br />
Schelfgeologie der Christian-Albrechts-Universität zu Kiel, sowie von Kerstin Schrottke vom<br />
Exzellenzcluster „Ozean der Zukunft, AG Meeresspiegelanstieg und <strong>Küsten</strong>erosion“ in der Kunsthalle<br />
zu Kiel statt. Rund 90 Teilnehmerinnen und Teilnehmer gestalteten ein vielseitiges Programm mit 26<br />
Vorträgen und 10 Posterbeiträgen.<br />
An der 27. Jahrestagung des AMK waren Arbeitsgruppen geographischer und geologischer Institute<br />
der Universitätsstandorte Göttingen, Greifswald, Hamburg, Jena, Kiel, Köln, Marburg und Oldenburg<br />
sowie zahlreiche Wissenschaftler internationaler Forschungseinrichtungen beteiligt, beispielsweise aus<br />
Brasilien, Polen, <strong>Thailand</strong> und Vietnam. Besonders hervorzuheben ist die aktive Einbindung offizieller<br />
Stellen, Behörden und außeruniversitärer Forschungseinrichtungen wie zum Beispiel des<br />
Landesbetriebs für Straßen, Brücken und Gewässer in Hamburg, der Hamburg Port Authority, des<br />
Forschungsinstituts Senckenberg, des Alfred-Wegener-Instituts für Polar- und Meeresforschung, des<br />
GKSS-Forschungszentrums Geesthacht, des Leibniz-Instituts für Ostseeforschung Warnemünde sowie<br />
des Ministeriums für Landwirtschaft, Umwelt und ländliche Räume, des gleichnamigen Landesamts<br />
und des Landesbetriebs für <strong>Küsten</strong>schutz, Nationalpark und Meeresschutz des Landes Schleswig-<br />
Holstein. Diese anregende Mischung dokumentiert sowohl gelebte Interdisziplinarität innerhalb des<br />
Arbeitskreises als auch die unmittelbare Umsetzung von Forschungsergebnissen in die Praxis.<br />
Die Vorträge der 27. Jahrestagung deckten eine Vielzahl hochaktueller Themen ab. Schwerpunkte<br />
lagen im <strong>Küsten</strong>zonen- und <strong>Küsten</strong>risikomanagement, im Meeresmoni<strong>to</strong>ring und in der Modellierung<br />
von „Ecosystem Services“. Ein weiterer Vortragsblock befasste sich mit Extremflut- und<br />
Hochwasserereignissen an Elbe und Weser und mit his<strong>to</strong>rischen Aufwachsraten und der<br />
Sturmgefährdung ausgewählter Halligen, insbesondere vor dem Hintergrund der globalen<br />
Klimaänderung. Es folgten Studien zum Sedimenttransport im Wattenmeer und in der Tideweser, zum<br />
Moni<strong>to</strong>ring von Kolken an Offshore-Pfeilern und zur ökosystemar relevanten Temperaturverteilung in<br />
Wattsedimenten. Ein weiterer Vortragsblock thematisierte event-stratigraphische, geomorphologische<br />
und paläogeographische Studien zur Erfassung und Rekonstruktion von Tsunami-Ereignissen in<br />
Griechenland, Portugal und <strong>Thailand</strong>. Zudem wurden Modellierungsergebnisse für eine Tsunami-<br />
Risikoanalyse für die thailändische Küste vorgestellt. Für das Mekong-Delta (Vietnam) wurden neue<br />
Ergebnisse zum Deltavorbau und zum postglazialen Meeresspiegelanstieg präsentiert. Der<br />
abschließende Vortragsblock befasste sich mit der holozänen <strong>Küsten</strong>entwicklung der südlichen Ostsee<br />
und der Dynamik von Dreissena-Muschelbänken und ihrer ökologischen Bedeutung im Oderhaff. Ein<br />
Beitrag zeigte Möglichkeiten und Grenzen der Datierung von <strong>Küsten</strong>- und Meeressedimenten mittels<br />
Lumineszenzmethoden auf.<br />
Mit diesem Buch liegt ein weiterer Band der seit 1983 durchgehenden Reihe wissenschaftlicher<br />
Veröffentlichungen zu den Jahrestagungen des AMK vor. Den Organisa<strong>to</strong>ren gebührt größter Dank<br />
für die Organisation und Durchführung der Tagung in Kiel sowie für die Redaktion des<br />
Tagungsbandes in der Reihe <strong>Coastline</strong> <strong>Reports</strong>.<br />
Andreas Vött<br />
Sprecher des AMK
Inhaltsverzeichnis<br />
Simon Matthias May, Timo Willershäuser & Andreas Vött<br />
Boulder transport by high-energy wave events at Cap Bon (NE Tunisia) ........................ 1<br />
Ulrich Floth, Andreas Vött, Simon Matthias May, Helmut Brückner & Svenja Brockmüller<br />
Estimating tsunami hazards between Lefkada and Preveza, NW Greece, by means<br />
of computer modeling ........................................................................................................... 11<br />
Peter Feldens, Daroonwan. Sakuna, Penjai Somgpongchaiykul & Klaus Schwarzer<br />
Shallow water sediment structures in a tsunami-affected area (Pakarang Cape,<br />
<strong>Thailand</strong>) ................................................................................................................................ 15<br />
Gunilla Kaiser, Hannes Römer, Daniela Arp, Horst Sterr & Ralf Ludwig<br />
Use of high resolution geodata for inundation modelling as part of a tsunami risk<br />
assessment in <strong>Thailand</strong> ......................................................................................................... 25<br />
Nélida Ros<strong>to</strong>ck<br />
Zoning instruments for “Coastal and Marine Protected Areas of Multiple Use” –<br />
An Example in Southern Chile ........................................................................................... 35<br />
André Giskard Aquino da Silva & Helenice Vital<br />
Estimation of Presídio’s Barrier Island (Guamaré-NE/<strong>Brazil</strong>) Migration by Means<br />
of GIS and Remote Sensing. ................................................................................................. 45<br />
Christiane Fenske, Sven Dahlke, Philip Riel & Adam Woźniczka<br />
Dynamics of mussel beds in the Szczecin Lagoon .............................................................. 49<br />
Henning May, Kerstin Schrottke & Klaus Schwarzer<br />
Coarse-grained sediment distribution in shallow water of the south-western<br />
Baltic Sea (Germany) ........................................................................................................... 55<br />
Tobias Dolch<br />
Coarsening of tidal flat sediments - long-term mud depletion in a tidal bay in the<br />
northern Wadden Sea (SE North Sea) ................................................................................ 59<br />
Caroline Radegast, Thomas Strotmann & Ulrich Ferk<br />
Studies on the Development of Wind set-up in the River Elbe ......................................... 63<br />
Svenja Papenmeier, Kerstin Schrottke & Alexander Bartholomä<br />
Total volume concentration and size distribution of suspended matter at sites<br />
affected by water injection dredging of subaqueous dunes in the German<br />
Weser Estuary ....................................................................................................................... 71<br />
Gabriele Gönnert & Sigrid Thumm<br />
Das Risiko von Extremsturmfluten in Ästuaren angesichts globalen Klimawandels ..... 77<br />
Kristina Sossidi, Gabriele Gönnert & Dieter Ackermann<br />
GIS-gestützte Analyse des Überflutungsrisikos in Hamburg unter Berücksichtigung<br />
der EG-Hochwasserrichtlinie .............................................................................................. 87
Ingrid Holzwarth & Frank Kösters<br />
Effects of Changes in Sea Level on the Tidal Dynamics of the River Weser ................... 97<br />
Heike Munderloh<br />
Costs of sea-level rise under different climatic and socio-economic scenarios: an<br />
application of the DIVA model .......................................................................................... 101<br />
Jacobus Hofstede<br />
<strong>From</strong> coastal flood defence <strong>to</strong>wards coastal flood risk management ............................. 105<br />
Jörn Kohlus & Hans-Christian Reimers<br />
Das Projekt MDI-DE - Marine Daten-Infrastruktur in Deutschland ............................ 115<br />
Marie Naulin & Thorsten Albers<br />
Feasibility Study for Optimisation of Land Drainage by Using Renewable Energy .... 127
Abstracct<br />
Thhe<br />
Mediterraneean<br />
is charactterized<br />
by a coonsiderable<br />
se eismic and geoodynamic<br />
actiivity<br />
resulting g in<br />
a hhigh<br />
tsunamiggenic<br />
potentiaal,<br />
particularlyy<br />
for the cent tral and eastern<br />
Mediterrannean.<br />
Within the<br />
lasst<br />
decades, nuumerous<br />
studiees<br />
dealing witth<br />
deposits ca aused by extreeme<br />
events reevealed<br />
recurr rent<br />
tsuunami<br />
events in the Mediterranean<br />
throoughout<br />
the Holocene. Inn<br />
general, twoo<br />
main types of<br />
exttreme<br />
wave eevent<br />
depositss<br />
have been ddescribed<br />
so far: (i) fine-ggrained<br />
allochhthonous<br />
mar rine<br />
seddiments<br />
foundd<br />
in near-coaast<br />
geological archives and d (ii) wave-emmplaced<br />
blockk<br />
deposits alo ong<br />
roccky<br />
shorelines.<br />
However, iin<br />
many casess,<br />
there is an ongoing debaate<br />
on whetheer<br />
these deposits<br />
weere<br />
accumulateed<br />
by tsunamii<br />
or s<strong>to</strong>rm eveents.<br />
Thhis<br />
paper pressents,<br />
for the first time, evvidence<br />
of bl lock accumulaations<br />
from tthe<br />
north-east tern<br />
coasts<br />
of Tunisia<br />
induced byy<br />
extreme waave<br />
events. Along A the nortth-western<br />
coast<br />
of Cap Bon,<br />
sevveral<br />
block fieelds<br />
and wavee-transported<br />
bboulders<br />
were e detected. Thee<br />
blocks are ppartly<br />
arranged d in<br />
thee<br />
form of immbrication<br />
traains<br />
up <strong>to</strong> 4 m a.s.l. Man ny boulders sshow<br />
two disstinct<br />
rock pool<br />
gennerations<br />
alloowing<br />
for a reelative<br />
chronollogical<br />
interpr retation. Furthhermore,<br />
the ppresented<br />
resu ults<br />
po oint <strong>to</strong> a tsunammi-induced<br />
traansport<br />
of the blocks rather r than <strong>to</strong> a s<strong>to</strong>rrm-induced<br />
diislocation.<br />
1 Intrroduction<br />
Schwarzerr,<br />
Schrottke & Stattegger (eeds.):<br />
<strong>From</strong> Brazzil<br />
<strong>to</strong> <strong>Thailand</strong> – New Resultts<br />
in Coastal Research R<br />
<strong>Coastline</strong>e<br />
<strong>Reports</strong> <strong>16</strong> ( (<strong>2010</strong>), ISSN 00928-2734,<br />
IS SBN 978-3-9811839-9-3<br />
S. 01-10<br />
BBoulder<br />
ttransport<br />
by high-e energy waave<br />
eventts<br />
at Cap BBon<br />
(NE Tunisia)<br />
Simmon<br />
Matthiias<br />
May 1 , Timo<br />
Willers shäuser 2 & Andreas Vö<br />
2 Insti<br />
1 Institu<br />
ute for Geograaphy,<br />
Universi ity of Köln, GGermany<br />
itute for Geoggraphy,<br />
Johannnes<br />
Gutenberg g-University oof<br />
Mainz, Gerrmany<br />
The devaastating<br />
Deccember<br />
26<br />
tsunami hazards all<br />
catastropphic<br />
wave-in<br />
demonsttrates<br />
the nee<br />
events. A comprehen<br />
estimatioon<br />
of tsuna<br />
Apparenntly,<br />
reliable<br />
dimensioon<br />
of wave in<br />
this conttext,<br />
geo–sci<br />
one of thhe<br />
most prom<br />
First seddimentary<br />
stu<br />
1980s (AAtwater<br />
198<br />
described:<br />
(i) fine g<br />
such as lagoons or<br />
However,<br />
in many<br />
marine oorigin<br />
and th<br />
on the diistinguishabi<br />
instance Goff et al. 2<br />
2003a, 22003b,<br />
Robin<br />
<strong>2010</strong>, Swwitzer<br />
& Jon<br />
th , 22004<br />
Indian Ocean tsuna ami dramaticcally<br />
changedd<br />
public awa areness of<br />
l over the wworld.<br />
Howwever,<br />
the ev vent not onnly<br />
showed the tremend dous and<br />
nduced enerrgy<br />
of tsunaami<br />
and its potential foor<br />
destructioon<br />
- in part ticular, it<br />
ed for intenssified<br />
geosciientific<br />
resea arch on tsunaami<br />
events aand<br />
on extreme<br />
wave<br />
nsive knowleedge<br />
about ccomparable<br />
tsunami t evennts<br />
in the passt<br />
is necessar ry for the<br />
ami hazard in a distincct<br />
area and for effectivve<br />
coastal pprotection<br />
measures. m<br />
informationn<br />
on tsunammi<br />
recurrence<br />
intervals as well as on the inten nsity and<br />
nundation arre<br />
inevitable for an appro opriate hazardd<br />
assessmentt<br />
(Bondevik 2008). In<br />
entific investigations,<br />
beesides<br />
the ana alysis of hist<strong>to</strong>rical<br />
accouunts,<br />
are cons sidered as<br />
mising approaaches<br />
in palaaeo-tsunami<br />
and palaeo-eevent<br />
researcch.<br />
udies about tsunami impprints<br />
in geo ological archhives<br />
were carried<br />
out in n the late<br />
87). Since tthen,<br />
two mmain<br />
types of o extreme wwave<br />
event deposits ha ave been<br />
grained allochthonous<br />
maarine<br />
sedime ents found inn<br />
near-coastt<br />
geological archives,<br />
coastal swammps,<br />
and (ii) ) wave emplaced<br />
block deposits aloong<br />
rocky sh horelines.<br />
cases the deeterminationn<br />
of the even nt source reemains<br />
probllematic<br />
and only the<br />
he high-energgy<br />
nature of f the deposit can be provved.<br />
Thereforre,<br />
a vivid discussion d<br />
ility betweenn<br />
tsunami and<br />
s<strong>to</strong>rm depo osits in the ggeological<br />
record<br />
has evo olved (for<br />
2004, Kortekkaas<br />
2002, KKortekaas<br />
& Dawson D 20007,<br />
Mor<strong>to</strong>n ett<br />
al. 2007, Nott N 1997,<br />
nson et al. 22006,<br />
Schefffers<br />
& Kellet tat 2001; Schheffers<br />
20055;<br />
Switzer & Burs<strong>to</strong>n<br />
es 2008a, 20008b,<br />
Williamms<br />
& Hall 20 007).<br />
ött 2
2 May et al.<br />
In this paper, we present first evidence of block accumulations from the north-eastern coasts of<br />
Tunisia induced by extreme wave events. Chronological aspects of the block movement and possible<br />
event sources are discussed.<br />
2 Palaeotsunami studies in the Mediterranean<br />
Evidence for extreme wave events during the Holocene is known from a number of areas in the<br />
Mediterranean, and in most cases these events are associated <strong>to</strong> tsunami. In particular, numerous<br />
his<strong>to</strong>rical reports on tsunamis exist for the central and eastern Mediterranean, especially for Italy and<br />
Greece, summarized in tsunami catalogues (for instance Soloviev et al. 2000, Tinti et al. 2004). In<br />
these catalogues, additional information on event-related earthquakes, tsunami wave heights,<br />
inundated areas and other effects is recorded.<br />
Figure 1: a) Overview of the Mediterranean with main tec<strong>to</strong>nic structures (map based on Facenna et al. 2001,<br />
Wortel & Spakman 2000). White boxes mark reports on sedimentary tsunami imprints. The study<br />
area presented in this paper is marked by a grey box. b) Study area, north-western coast of Cap Bon,<br />
NE Tunisia, with presented locations of block findings. The coastal morphology shows a typical bay<br />
and headland configuration.<br />
Sedimentary evidence for palaeotsunami events in the central Mediterranean proves the occurrence of<br />
tsunami events since the mid-Holocene. Especially the eruption of San<strong>to</strong>rini in the Bronze Age was<br />
subject <strong>to</strong> geological investigations (Bruins et al. 2008, Dominey-Howes et al. 2000a,<br />
McCoy & Heiken 2000, Minoura et al. 2000, Scheffers & Scheffers 2007). More recent events also<br />
left sedimentary signatures such as the 1956 tsunami in the southern Aegean Sea for which imbricated<br />
pebbles on the island of Astypalaea are described (Dominey-Howes et al. 2000b). Korteekaas (2002)<br />
and Kon<strong>to</strong>poulos & Avramidis (2003) gave evidence for tsunamigenic sediments in the Corinthian<br />
Gulf. Scheffers et al. (2008) found palaeotsunami imprints on the coasts of the southern and southwestern<br />
Peloponnese. For northwestern Greece, Vött et al. (2006, 2007, 2008, 2009, <strong>2010</strong>), May<br />
(<strong>2010</strong>) and May et al. (2008) presented manifold sedimentary evidence of tsunami influence on the<br />
Preveza-Lefkada coastal zone.<br />
Several studies were also conducted on tsunami induced changes of coastal morphology such as<br />
boulder and block accumulations along rocky shorelines (Mastronuzzi & Sanso 2000, 2004;<br />
Scicchitano et al. 2007) and washover fans (Gianfreda et al. 2001) in southern Italy. Further evidence<br />
for extreme wave events was presented by Reinhardt et al. (2006) for the Israeli coast close <strong>to</strong> the
Boulder transport by high-energy wave events 3<br />
ancient harbour of Cesarea, and Morhange et al. (2006) gave evidence for wave emplaced boulders at<br />
the coast of Lebanon. <strong>From</strong> the North African coast, Maouche et al. (2009) report on large boulder<br />
accumulations in northern Algeria and suggest a tsunamigenic origin and Kelletat (2005) describes<br />
wave transported boulders in southern Mallorca. Frébourg et al. (2007) describe a possible tsunami<br />
layer found within eolianites from eastern Tunisia. Block accumulations are also known from<br />
Morocco (Mhammudi et al. 2008), but may be related <strong>to</strong> event sources in the Atlantic Ocean,<br />
comparable <strong>to</strong> the 1755 earthquake and tsunami of Lisbon (Andrade 1992, Whelan & Kelletat 2005).<br />
When considering possible source mechanisms for tsunami events in the Mediterranean, several<br />
potential triggers must be taken in<strong>to</strong> account (see also figure 1). Especially the central Mediterranean<br />
exhibits a high seismic activity. Numerous strong earthquakes are reported from the subduction zone<br />
of the Hellenic Arc or major fault zones. It is well known, that vertical crustal movements of terrestrial<br />
and submarine origin have a high tsunamigenic potential in this region (for instance Beneta<strong>to</strong>s et al.<br />
2004, Pirazzoli 1986). In northwestern Greece, the Cefalonia transform fault (CF), situated west of the<br />
Ionian Islands Cefalonia and Lefkada, connects this zone of subduction with an area of continentcontinent<br />
collision beginning off the coast of southern Epirus (figure 1). The CF also shows a<br />
remarkably high seismic activity and has been responsible for numerous strong earthquakes during<br />
his<strong>to</strong>ry (Beneta<strong>to</strong>s et al. 2005, Cocard et al. 1999, Louvari et al. 1999, Sachpazi et al. 2000,<br />
Papadopoulos et al. 2003). In the western Mediterranean, several tsunamigenic earthquakes are known<br />
from south-eastern Spain and North Africa (Alasset et al. 2003, Gràcia et al. 2006). Moreover,<br />
Pareschi et al. (2006) suggest that flank collapses of the Etna volcano, occurring during the middle<br />
Holocene, resulted in mega tsunami events effecting large parts of the Mediterranean. <strong>From</strong> the central<br />
Ionian Sea and the Sirte basin <strong>to</strong> the north of the African coast, several turbidite layers have been<br />
detected in the deep sea geological record. These layers suggest repeated and extensive submarine<br />
mass movements in the area that may also have produced large tsunami events in the central<br />
Mediterranean (Hieke 2000, Hieke & Werner 2000). Further potential tsunami triggers are cosmic<br />
impacts for which, however, no evidence has yet been found in the Mediterranean.<br />
3 Study area<br />
Field survey was carried out along the north-western coast of Cap Bon, NE Tunisia (figure 1). In<br />
general, the Geology of the low lying coastal areas at Cap Bon is dominated by Tertiary and early<br />
Pleis<strong>to</strong>cene sequences, mainly consisting of marine sands<strong>to</strong>nes and aeolianites (Mensching 1979). The<br />
coastal morphology is characterized by slightly elevated marine terraces, most likely of late<br />
Pleis<strong>to</strong>cene origin (Jedoui et al. 1998, Morhange & Pirazzoli 2005).<br />
Figure 2: Cliff <strong>to</strong>p platform with field of dislocated blocks, around 50 m distant from the sea. Inlay: View of<br />
Pleis<strong>to</strong>cene terrace with cliff <strong>to</strong>p platform reaching up <strong>to</strong> 4 m a.s.l. Elevation of cliff ~ 2 m. Note<br />
typical coastal configuration with bays and headlands.
4 May et al.<br />
They form, in most cases, small headlands, which are characterized by a well-developed cliff, up <strong>to</strong> 5<br />
m high, and a cliff <strong>to</strong>p platform, up <strong>to</strong> 200 m wide (figure 2). These promon<strong>to</strong>ries are separated from<br />
each other by small and narrow bays with, at some locations, sandy beaches. Well-defined notches<br />
document a comparatively stable relative sea level for the area for the late Holocene. The cliff <strong>to</strong>p<br />
platforms are free of vegetation and characterized by intense karstification and, in the lit<strong>to</strong>ral and<br />
supralit<strong>to</strong>ral zone, extensive rock pool formation.<br />
4 Methods<br />
During August 2008, a geomorphological field survey was carried out along the northern shorelines of<br />
Tunisia in order <strong>to</strong> detect geo-scientific imprints of extreme wave events. In this context, we found<br />
evidence for extreme wave emplaced blocks, up <strong>to</strong> at least ~ 5 m³ and 11 t.<br />
Block fields detected during the geomorphological survey were documented and partly measured. The<br />
sizes of selected boulders were estimated based on measurements of the x-, y- and z-axes using a<br />
measuring tape. All the dislocated blocks and boulders were examined for rock pools on their surfaces.<br />
The number and the dimension of different rock pool generations were studied in order <strong>to</strong> get<br />
information on different phases of boulder transport. For weight calculation of the transported<br />
boulders, rock density was estimated <strong>to</strong> ~2.2 g/cm³ (Scicchitano et al. 2007). GPS points were<br />
measured for the study areas and for the sampling points.<br />
5 Results and discussion<br />
Location one (El Haouaria A, 37°03'9.08"N; 10°56'46.91"E, figs. 1 and 3) is situated 5.5 km west of<br />
the City of El Haouaria. Here, the cliff <strong>to</strong>p platform reaches an elevation of around 4 m a.s.l. (above<br />
mean sea level) and is covered by numerous blocks and boulders, up <strong>to</strong> 3 m³ in size. The blocks are<br />
assembled in block fields and can be followed up <strong>to</strong> a distance of 50 m onshore.<br />
Figure 3: a) Block field at El Haouaria site A. Cliff <strong>to</strong>p platform lies at around 3 m a.s.l. Note person (around<br />
1.80 m) as scale. b) Overturned block of ca. 2.7 m³ in size with former surface (rock pool generation<br />
I) at its bot<strong>to</strong>m side. c) Rock pool generation II on <strong>to</strong>p of the recent surface.
Boulder transport by high-energy wave events 5<br />
Most blocks show extensive rock pools at their surface. These rock pools are usually formed by bioerosional<br />
processes in the lit<strong>to</strong>ral zone (Laborel & Laborel-Deguen 1994). Found in the present<br />
constellation, they clearly prove that the blocks were transported from the lit<strong>to</strong>ral zone <strong>to</strong> their current<br />
position. Most probably, the rock slabs and blocks originate from the cliff front area.<br />
Some of the dislocated blocks are overturned, with the former surface facing downwards. For the<br />
block depicted in figure 3, which is around 2.7 m³ in size and weighing approximately 6 t, this is<br />
indicated by well-developed rock pools, up <strong>to</strong> 35 cm deep and 1 m wide, found on the lower side of<br />
the block (figure 3b, rock pool generation I). A comparatively long period of rock pool formation was<br />
thus needed before the block was dislocated and transported <strong>to</strong> its recent position. Clear indications of<br />
bio-erosion by gastropods point <strong>to</strong> the formation of the rock pool in a lit<strong>to</strong>ral environment. Moreover,<br />
a second generation of rock pools (rock pool generation II) was observed on <strong>to</strong>p of the recent surface.<br />
This rock pool generation shows a much smaller depth and width of around 8 cm and 40 cm,<br />
respectively, and must have developed subsequent <strong>to</strong> the transportation of the block (figure 3c). Thus,<br />
for this block, the period of time between the start of the formation of rock pool generation I and its<br />
displacement must have been much longer than the period of time since its transport. As not more than<br />
two rock pool generations could be observed, a displacement of the block during one singular event<br />
can be assumed.<br />
Figure 4: a) Block field at El Haouaria site B showing several imbrication trains; the cliff <strong>to</strong>p platform lies at<br />
around 1 m a.s.l. Note person (around 1.80 m) as scale. b) and c) Imbrication trains – blocks are<br />
typically tilted in wave direction. Inlay in b) shows two rock pool generations found for the second<br />
block within the imbrication train (grey – rock pool generation I, white – rock pool generation II).<br />
Location two (El Haouaria B, 37°03'5.00"N; 10°58'9.20"E, figure 1 and 4) is located around 2 km east<br />
of location one and some 3.5 km west of El Haouaria. Dislocated blocks and boulders were<br />
encountered on <strong>to</strong>p of an elevated marine terrace, about 1 m a.s.l. As illustrated in figure 4, blocks and<br />
rock-slabs are abundant and are assembled in a block field, extending approximately 3000 m². Within<br />
the block field, several trains of imbricated blocks, up <strong>to</strong> 5 m 3 in size, were found, consisting of up <strong>to</strong> 6<br />
tilted blocks or rock-slabs. The imbrication of the blocks proves their extreme wave generated<br />
displacement and deposition.
10 May et al.<br />
Scheffers, A., D. Kelletat, A. Vött, S.M. May & S. Scheffers (2008): Late Holocene tsunami traces on the<br />
western and southern coastlines of the Peloponnesus (Greece). In: Earth and Planetary Science Letters<br />
269(1-2): 271–279.<br />
Scheffers, A., S. Scheffers & D. Kelletat (2005): Paleo-Tsunami Relics on the Southern and Central Antillean<br />
Island Arc. In: Journal of Coastal Research 21: 263–273.<br />
Scicchitano, G., C. Monaco & L. Tor<strong>to</strong>rici (2007): Large boulder deposits by tsunami waves along the Ionian<br />
coast of south-eastern Sicily (Italy). In: Marine Geology 238(1-4): 75–91<br />
Soloviev, S. L., O.N. Solovieva, C.N. Go, K.S. Kim & N.A. Shchetnikov (2000): Tsunamis in the Mediterranean<br />
Sea 2000 B.C.-2000 A.D. Kluwer, Dordrecht.<br />
Switzer, A.D. & B.G. Jones (2008a): Large-scale washover sedimentation in a freshwater lagoon from the<br />
southeast Australian coast: sea-level change, tsunami or exceptionally large s<strong>to</strong>rm? In: The Holocene 18(5):<br />
787–803.<br />
Switzer, A.D. & B.G. Jones (2008b): Setup, Deposition, and Sedimentary Characteristics of two S<strong>to</strong>rm<br />
Overwash Deposits, Abrahams Bosom Beach, Southeastern Australia. In: Journal of Coastal Research 24<br />
(1): 189–200.<br />
Switzer, A.D. & J.M. Burs<strong>to</strong>n (<strong>2010</strong>): Competing mechanisms for boulder deposition on the southeast Australian<br />
coast. In: Geomorphology 114(1-2): 42–54.<br />
Tinti, S., A. Maramai & L. Graziani (2004): The New Catalogue of Italian Tsunamis. In: Natural Hazards 33:<br />
439–465.<br />
Vött, A., M. May, H. Brückner & S. Brockmüller (2006): Sedimentary Evidence of Late Holocene Tsunami<br />
Events near Lefkada Island (NW Greece). In: Zeitschrift für Geomorphologie N.F., 146: 139–172.<br />
Vött, A., H. Brückner, S.M. May, F. Lang & S. Brockmüller (2007): Late Holocene tsunami imprint at the<br />
entrance of the Ambrakian Gulf (NW Greece). In: Mediterranée 108: 43–57.<br />
Vött, A., H. Brückner, S.M. May, F. Lang, R. Herd & S. Brockmüller (2008): Strong tsunami impact on the Bay<br />
of Aghios Nikolaos and its environs (NW Greece) during Classical-Hellenistic times. In: Quaternary<br />
International 181(1): 105–122.<br />
Vött, A., H. Brückner, S. Brockmüller, M. Handl, S.M. May, K. Gaki-Papanastassiou, R. Herd, F. Lang, H.<br />
Maroukian, O. Nelle & D. Papanastassiou (2009): Traces of Holocene tsunamis across the Sound of<br />
Lefkada, NW Greece. In: Global and Planetary Change 66 (1-2): 112–128.<br />
Vött, A., G. Bareth, H. Brückner, C. Curdt, I. Foun<strong>to</strong>ulis, R. Grapmayer, H. Hadler, D. Hoffmeister, N. Klasen,<br />
F. Lang, P. Masberg, S.M. May, K. Ntageretzis, D. Sakellariou & T. Willershäuser (<strong>2010</strong>): Beachrock-type<br />
calcarenitic tsunamites along the shores of the eastern Ionian Sea – case studies from Akarnania, the Ionian<br />
Islands and the western Peloponnese. In: Zeitschrift für Geomorphologie N.F., Suppl. Issue 54 (3): 1–50.<br />
Whelan, F. & D. Kelletat (2005): Boulder Deposits on the Southern Spanish Atlantic Coast: Possible Evidence<br />
for the 1755 AD Lisbon Tsunami? In: Science of Tsunami Hazards 23(3): 25–38.<br />
Williams, D.M. & A.M. Hall (2007): Cliff-<strong>to</strong>p megaclast deposits of Ireland, a record of extreme waves in the<br />
North Atlantic – s<strong>to</strong>rms or tsunamis? In: Marine Geology 206: 101–117.<br />
Wortel, M.J.R. & W. Spakman (2000): Subduction and slab detachment in the Mediterranean-Carpathian region.<br />
In: Science 290 (5498): 1910–1917.<br />
Acknowledgements<br />
We gratefully acknowledge funding of this study by the German Research Foundation (Bonn, VO<br />
938/2-1).<br />
Address<br />
Dr. Simon Matthias May<br />
University of Köln - Institute for Geography<br />
Albertus-Magnus-Platz<br />
50923 Köln, Germany<br />
mays@uni-koeln.de
Estimmating<br />
tsunnami<br />
hazards<br />
betwween<br />
Lefk kada and Preveza, NW Gree ece, by<br />
mmeans<br />
of ccomputer<br />
r modelinng<br />
1 Inst<br />
UUlrich<br />
Flothh<br />
1 , Andreas Vött², Simoon<br />
Matthias May², Helm<br />
BBrockmüller<br />
r 4<br />
mut Brücknner³<br />
& Svenj ja<br />
Abstracct<br />
Thhe<br />
intention off<br />
this paper iss<br />
<strong>to</strong> outline selected<br />
results of modeling hypothetic tsuunami<br />
events for<br />
thee<br />
present coasstlines<br />
betweeen<br />
Lefkada Islland<br />
and the southernmost<br />
s<br />
areas of Epirros,<br />
NW Gree ece.<br />
Moodeling<br />
resultts<br />
are comparred<br />
<strong>to</strong> geoscieenctific<br />
field evidence of ppalaeotsunammi<br />
landfall wh hich<br />
havve<br />
been foundd<br />
during the laast<br />
years. Morreover,<br />
possib ble consequennces<br />
of modeleed<br />
extreme wa ave<br />
events<br />
on the shhores<br />
of the Leefkada-Prevezza<br />
coastal zone e are discusseed.<br />
1 Inttroduction:<br />
Tsunami iin<br />
the studyy<br />
area<br />
Within the<br />
study areaa,<br />
several hinnts<br />
for formeer<br />
tsunami im mpacts were identified duuring<br />
previou us studies<br />
(Vött et al. 2007, 20008,<br />
2009a, MMay<br />
et al. 20007).<br />
Widespr read wash-ovver<br />
fans strikke<br />
at the spit t between<br />
Lefkada Island and Akarnania. Numerous large block ks of up <strong>to</strong> 14 <strong>to</strong>ns in weight, mad de up of<br />
beachrocck,<br />
were obvviously<br />
mobiilized<br />
and diislocated,<br />
pa artly appearinng<br />
in an imbbricated<br />
asse embly. In<br />
the nearrby<br />
Lake VVoulkaria,<br />
a layer of mmarine<br />
high-e energy depoosits<br />
was iddentified,<br />
san ndwiched<br />
between units of limmnic<br />
mud ( (Vött et al. 2009b). Fur rthermore, aan<br />
evaluationn<br />
of several l tsunami<br />
cataloguues<br />
revealed the occurrennce<br />
of at leaast<br />
46 tsunam mis in the eastern<br />
Ioniann<br />
Sea within n the last<br />
2400 yeaars,<br />
eight of which were also observeed<br />
around th he study areaa<br />
(Soloviev eet<br />
al. 2000, Vött V et al.<br />
2006).<br />
Figure 1:<br />
Schwarzerr,<br />
Schrottke & Stattegger (eeds.):<br />
<strong>From</strong> Brazzil<br />
<strong>to</strong> <strong>Thailand</strong> – New Resultts<br />
in Coastal Research R<br />
<strong>Coastline</strong>e<br />
<strong>Reports</strong> <strong>16</strong> ( (<strong>2010</strong>), ISSN 00928-2734,<br />
IS SBN 978-3-9811839-9-3<br />
S. 11-14<br />
titute for Enviironmental<br />
Enngineering,<br />
Cooastal<br />
Enginee ering Group, UUniversity<br />
of RRos<strong>to</strong>ck,<br />
Germ many<br />
2<br />
Institu ute for Geograaphy,<br />
Universi ity of Köln, GGermany<br />
3<br />
Faculty of GGeography,<br />
Phhilipps-Univer<br />
rsity of Marbuurg,<br />
Germanyy<br />
4<br />
Institute of Natural Scciences<br />
and Edducation,<br />
Univ versity of Kobblenz-Landau,<br />
, Germany<br />
Situation off<br />
the study arrea<br />
showing thhe<br />
location of f the <strong>to</strong>wns off<br />
Lefkada Cityy<br />
and Preveza a (Source:<br />
NASA WorrldWind<br />
1.4, LLandsat<br />
7 ETMM<br />
Satellite Im mage, modifiedd)
12<br />
2 The<br />
Model<br />
AnuGA was develloped<br />
by thhe<br />
Australiaan<br />
National l Universityy<br />
and Geosscience<br />
Aus stralia in<br />
consequeence<br />
of the ttsunami-evennt<br />
of late Deccember<br />
2004 4 (Nielsen 20007).<br />
The foccus<br />
for the si imulation<br />
of tsunaami<br />
affectingg<br />
the coasts of the studyy<br />
area was on o generatingg<br />
a sinusoiddal<br />
wave trai in on the<br />
western boundary. TThe<br />
idea wass<br />
<strong>to</strong> computee<br />
15 scenarios<br />
on the baase<br />
of three distinct dire ections of<br />
origin (WWNW,<br />
W, WWSW)<br />
and with<br />
five qualitative<br />
degre ees of intensiity,<br />
the latterr<br />
correspondi ing <strong>to</strong> the<br />
maximumm<br />
generationn<br />
height of thhe<br />
waves at the western boundary off<br />
the studiedd<br />
area (2 m = slight, 5<br />
m = modderate,<br />
10 m = severe, 200<br />
m = strong, , 50 m = extr reme; Floth 22008,<br />
Floth eet<br />
al. 2009).<br />
3 Pottentially<br />
enndangered<br />
oobjects<br />
Within tthe<br />
study areea,<br />
two majorr<br />
<strong>to</strong>wns can bbe<br />
identified d: Lefkada CCity,<br />
lying at the northwestern<br />
end<br />
of the SSound<br />
of Lefkada<br />
with a populationn<br />
of approx. 11.000 peoople,<br />
and Preeveza,<br />
locate ed at the<br />
entrancee<br />
<strong>to</strong> the Ambbrakian<br />
Gulf with approxx.<br />
20.000 inh habitants. Fuurther<br />
villagees<br />
are situate ed around<br />
the Sounnd<br />
of Lefkadda,<br />
predominantly<br />
on the westernmos st part of Akaarnania,<br />
calleed<br />
Plaghia Peninsula. P<br />
Those shhow<br />
a numbeer<br />
of up <strong>to</strong> 10000<br />
residentss.<br />
The villag ge Aghios Nikolaos,<br />
situaated<br />
on the co oast right<br />
between the cities off<br />
Lefkada and<br />
Preveza shhows<br />
a popul lation of appprox.<br />
500 peoople.<br />
Other objects o of<br />
importannce<br />
are the ccivil-/Na<strong>to</strong>-airport<br />
of Actio<br />
Headland d with some 3000 flightts<br />
per year ju ust as the<br />
underseaa<br />
tunnel connnecting<br />
the PPreveza<br />
Peninnsula<br />
with Actio A Headlannd<br />
(Floth 20008).<br />
4 Case<br />
study Prreveza<br />
Like all other parts of the studyy<br />
area, the reegion<br />
of Pre eveza seems <strong>to</strong> be well pprotected<br />
fro om minor<br />
tsunami--events<br />
(figuure<br />
2). This iss<br />
mostly duee<br />
<strong>to</strong> the fact that t the <strong>to</strong>wnn<br />
is built on tthe<br />
shore of the inner<br />
Ambrakiian<br />
Gulf andd<br />
thus averteed<br />
from the open sea. Our O data shoow<br />
that only a severe or r stronger<br />
event woould<br />
cause ddamages<br />
or even<br />
fatalitiess<br />
in edge are eas. Surprisinngly,<br />
tsunammis<br />
from WSW W do not<br />
show thee<br />
strongest efffects,<br />
althouugh<br />
hitting thhe<br />
coast with h an almost pperpendiculaar<br />
direction. However, H<br />
they triggger<br />
highest inundation vvalues<br />
for thhe<br />
harbour ar rea. Especiallly<br />
the northh<br />
of Preveza seems <strong>to</strong><br />
remain uun<strong>to</strong>uched<br />
bby<br />
tsunami wwave<br />
action, while the simulations s sshow<br />
strongeest<br />
impact <strong>to</strong><br />
the SE<br />
quarters along the cooast.<br />
(Floth et<br />
al. 2009).<br />
Figure 2:<br />
Floth F et al.<br />
Potentially flooded areas<br />
of Preveza in case of tsunami<br />
from WWNW<br />
(Imagee<br />
based on Ik konos and<br />
Landsat 7 EETM<br />
Satellite Images) for tssunami<br />
catego ories “moderaate”,<br />
“severe” and “strong”.
Estimating tsunami hazards between Lefkada and Preveza 13<br />
Sedimentary evidence of tsunamigenic flooding was found for the entire coastal zone between the<br />
cities of Lefkada and Preveza, locally testifying <strong>to</strong> multiple tsunami landfall during the Holocene<br />
(May et al. 2007, Vött et al. 2009a). Geomorphological and geoarchaeological traces document the<br />
more or less complete inundation of Actio Headland directly opposite <strong>to</strong> city of Preveza (Vött et al.<br />
2007). These results also imply tsunami-borne damages <strong>to</strong> modern Preveza and distal areas of the<br />
nearby Louros River delta. Geo-scientific studies <strong>to</strong> the immediate NNE of the city revealed at least<br />
one major tsunami impact during the past millennia. Compared <strong>to</strong> geo-scientific field data, our<br />
modeling results strongly corroborate the tsunami hazard for the Preveza-Lefkada coastal zone<br />
concerning both flow direction and spatial dimensions of extreme wave events (Floth et al. 2009).<br />
5 Conclusion<br />
Our modeling results clearly show that all locations in the study area are well secure from minor<br />
tsunami-events. This is explained by their sheltered position behind spits and beach ridges (Aghios<br />
Nikolaos, Lefkada City) or on the lee-side of a peninsula (Preveza) and by their sheer elevation<br />
(Plaghia villages) or distance from the sea (Airport facilities).<br />
In case of major events, however, almost all inhabitated sites are endangered of peripheral <strong>to</strong> an entire<br />
flooding.<br />
References<br />
Floth, U. (2008): The tsunami hazard between Lefkada and Preveza, based on computer modelling as well as<br />
field and labora<strong>to</strong>ry evidence. Unpublished diploma thesis, Faculty of Geography, Philipps-Universität<br />
Marburg.<br />
Floth, U., A. Vött, S.M. May, H. Brückner & S. Brockmüller (2009): Geo-scientific evidence versus computer<br />
models of tsunami landfall in the Lefkada coastal zone (NW Greece). In: Marburger Geographische<br />
Schriften 145:. 140–156.<br />
May, S.M., A. Vött, H. Brückner & S. Brockmüller (2007): Evidence of tsunamigenic impact on Actio headland<br />
near Preveza, NW Greece. In: <strong>Coastline</strong> <strong>Reports</strong> 9: 115–125.<br />
Nielsen, O. (2007): ANUGA v1.0 User Manual.<br />
Soloviev, S.L., O.N. Solovieva, C. Go, K. Kim & A. Shchetnikov (2000): Tsunamis in the Mediterranean Sea<br />
2000 BC – 2000 AD. Kluwer Academic Publishers. Dordrecht.<br />
Vött, A., H. Brückner, M. Handl & A. Schriever (2006a): Holocene palaeogeographies and the<br />
geoarchaeological setting of the Mytikas coastal plain (Akarnania, NW Greece). In: Zeitschrift für<br />
Geomorphologie N.F. 142: 85–108.<br />
Vött, A., H. Brückner, S.M. May, F. Lang & S. Brockmüller (2007): Late Holocene tsunami imprint on Actio<br />
headland at the entrance of the Ambrakian Gulf. In: Méditerranée, revue géographique des pays<br />
méditerranées 108: 43–57.<br />
Vött, A., H. Brückner, M. May, F. Lang & S. Brockmüller (2008): Strong tsunami impact on the Bay of Aghios<br />
Nikolaos and its environs (NW Greece) during Classical-Hellenistic times. In: Quaternary International.<br />
Amsterdam 181: 105–122.<br />
Vött, A., H. Brückner, S. Brockmüller, M. Handl, S.M. May, K. Gaki-Papanastassiou, R. Herd, F. Lang, H.<br />
Maroukian, O. Nelle & D. Papanastassiou (2009a): Traces of Holocene tsunamis across the Sound of<br />
Lefkada, NW Greece. In: Global and Planetary Change 66: 112–128.<br />
Vött, A., H. Brückner, S.M. May, D. Sakellariou, O. Nelle, F. Lang, V. Kapsimalis, S. Jahns, R. Herd, M. Handl<br />
& I. Foun<strong>to</strong>ulis (2009b): The Lake Voulkaria (Akarnania, NW Greece) palaeoenvironmental archive – a<br />
sediment trap for multiple tsunami impact since the mid-Holocene. In: Zeitschrift für Geomorphologie N.F.,<br />
53 (1): 1-37 (in press).
14 Floth et al.<br />
Acknowledgement<br />
We express our thanks <strong>to</strong> Dr. C. Reudenbach (Philipps-Universität Marburg), the Greek Institute of<br />
Geology and Mineral Exploration (Athens), and the developers of the Anuga software for various<br />
support. Financial support by the German Research Foundation (Bonn, Az. VO 938/2-1) is gratefully<br />
acknowledged.<br />
Addresses<br />
Dipl.-Geogr. Ulrich Floth<br />
University of Ros<strong>to</strong>ck - Institute for Environmental Engineering, Coastal Engineering<br />
Justus-von-Liebig-Weg 6<br />
18059 Ros<strong>to</strong>ck, Germany<br />
ulrich.floth@uni-ros<strong>to</strong>ck.de
Shalllow<br />
waterr<br />
sedimennt<br />
structuures<br />
in a ts sunami-aaffected<br />
arrea<br />
(Paka arang<br />
Cappe,<br />
Thaila and)<br />
Peterr<br />
Feldens 1 , DDaroonwann.<br />
Sakuna 1,2 , Penjai Som mgpongchaiiyakul<br />
3 & KKlaus<br />
Schwa<br />
3 Bi<br />
Abstracct<br />
Thhe<br />
influence of<br />
tsunami on tthe<br />
seafloor iss<br />
poorly unde ers<strong>to</strong>od. Detailled<br />
hydroacouustic<br />
surveys and a<br />
seddiment<br />
samplling<br />
campaiggns<br />
were carrried<br />
out in 2007 2 and 20008<br />
offshore Pakarang Ca ape<br />
(Thhailand)<br />
<strong>to</strong> caatalogue<br />
the geomarine<br />
effeects<br />
of the 200 04 Indian Oceean<br />
tsunami. A major probl lem<br />
in determining ttsunami<br />
influeence<br />
in offshoore<br />
deposits is the lack of prre-tsunami<br />
maappings.<br />
Start ting<br />
in 15 m water ddepth,<br />
a systeem<br />
of sand riddges<br />
compose ed of coarse ssand<br />
exists offfshore<br />
Pakara ang<br />
Caape.<br />
Elongatedd<br />
sediment traansport<br />
structuures<br />
on the NW-flanks N of tthe<br />
sand ridgees,<br />
slowly fad ding<br />
duuring<br />
the annuual<br />
cycle, indiicate<br />
the pressence<br />
of a cur rrent oblique <strong>to</strong> the coastliine.<br />
This curr rent<br />
miight<br />
coincide with the 20044<br />
Indian Oceaan<br />
Tsunami. A several cm- thick event laayer<br />
found at the<br />
base<br />
of a sand riidge<br />
is compoosed<br />
of silty seediment,<br />
whic ch could be rellated<br />
<strong>to</strong> the tsuunami<br />
backwa ash<br />
or strong floodss<br />
during the mmonsoon.<br />
Thesse<br />
event depos sits are covereed<br />
by coarse ssand.<br />
They might<br />
entter<br />
the geologgical<br />
record.<br />
1 Inttroduction<br />
Schwarzerr,<br />
Schrottke & Stattegger (eeds.):<br />
<strong>From</strong> Brazzil<br />
<strong>to</strong> <strong>Thailand</strong> – New Resultts<br />
in Coastal Research R<br />
<strong>Coastline</strong>e<br />
<strong>Reports</strong> <strong>16</strong> ( (<strong>2010</strong>), ISSN 00928-2734,<br />
IS SBN 978-3-9811839-9-3<br />
S. 15-24<br />
1<br />
Kiel UUniversity,<br />
Ge ermany<br />
2<br />
PPhuket<br />
Marinee<br />
Biological Centre, C Thailannd<br />
iogeochemicaal<br />
and Environnmental<br />
Changge<br />
Research Unit, U Prince off<br />
Songkla Uniiversity,<br />
<strong>Thailand</strong><br />
arzer 1<br />
Tsunamiis<br />
are amongg<br />
the largestt<br />
catastrophic<br />
times annd<br />
numerouss<br />
investigatioons<br />
have bee<br />
release aalong<br />
coastliines.<br />
On Deccember<br />
26<br />
the northhwest<br />
coast of the Indon<br />
Indo-Auustralian<br />
platee<br />
and the Su<br />
many SEE<br />
Asian coasstlines,<br />
reach<br />
th c events in the t world. TThey<br />
are recoorded<br />
since his<strong>to</strong>rical h<br />
en done about<br />
their origgin,<br />
wave disstribution<br />
an nd energy<br />
, 2004 an M 9.3 submariine<br />
earthquaake<br />
was gene erated off<br />
nesian islandd<br />
Sumatra du ue <strong>to</strong> a compplex<br />
tec<strong>to</strong>nic activity bet tween the<br />
unda-Plate. TThis<br />
generate ed a giant tsuunami<br />
whichh<br />
had an imp pact over<br />
ing <strong>to</strong> the Eaast-coast<br />
of Africa A (Lay eet<br />
al. 2005).<br />
Compareed<br />
<strong>to</strong> the inffluence<br />
of thhe<br />
2004 Inddian<br />
Ocean Tsunami T <strong>to</strong> onshore areaas,<br />
the impa act <strong>to</strong> the<br />
offshore environmennt<br />
is not well unders<strong>to</strong>od. Only few st tudies documment<br />
tsunamii<br />
effects offsh hore (e.g.<br />
Van denn<br />
Bergh et al.<br />
(2003), Nooda<br />
et al. (20007),<br />
Abrante es et al. (20008),<br />
Feldens et al. (2009) ), Paris et<br />
al. (20099),<br />
but influeence<br />
and phyysical<br />
properrties<br />
of the se ediment-loadded<br />
tsunami backwash ar re largely<br />
unknownn.<br />
Dawson & Stewart (2007)<br />
propose<br />
that offsho ore tsunami ddeposits<br />
are more comm mon in the<br />
geologiccal<br />
record thhan<br />
onshore deposits. A secure ident tification of offshore tsuunami<br />
deposi its would<br />
thereforee<br />
be of greatt<br />
value for thhe<br />
recognitioon<br />
of paleotsu unamis. A mmajor,<br />
but commmon<br />
problem<br />
is the<br />
missing data about pre-tsunammi<br />
conditionss<br />
when wor rking on reccent<br />
tsunammigenic<br />
struc ctures on<br />
continenntal<br />
shelf areeas.<br />
It has <strong>to</strong> be carefullyy<br />
considered,<br />
if observedd<br />
structures hhave<br />
existed d before a<br />
tsunami hit the area, were createdd<br />
during the tsunami eve ent or were aaltered<br />
by thee<br />
tsunami im mpact. We<br />
present observationss<br />
and first results of selected sed dimen<strong>to</strong>logiccal<br />
and morphological<br />
features,<br />
recordedd<br />
during cruiises<br />
in the frramework<br />
off<br />
the TUNW WAT project (Tsunami deeposits<br />
in ne ear-shoreand<br />
coasstal<br />
waters off<br />
<strong>Thailand</strong>; ffunded<br />
by thhe<br />
Human Re esearch Founndation<br />
(DFGG),<br />
Grant: SC CHW/11-<br />
1) offshoore<br />
the tsunaami<br />
impactedd<br />
coastline off<br />
Khao Lak, Phang P Nga PProvince,<br />
Thhailand.
18 Feldens et al.<br />
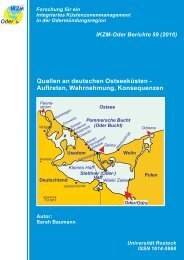
Figure 2: Side scan sonar data around Pakarang Cape. Sampling stations and the positions of fig. 3 and fig. 4<br />
are indicated. Sediment core 051207-37 is shown in fig. 7. This article is focusing on SW-NE striking<br />
sediment structures visible as lighter-coloured bands in the side-scan sonar image (a). Closer <strong>to</strong> the<br />
coastline, extended areas of fine grained sediment (b) and a small scale channels (c) are visible.<br />
Core 051207-37 (figure 7) is divided in four sedimentary units. Unit 1 (0-8 cm core depth) is mainly<br />
composed of brown sand, including some shell fragments. Between 8 and 11 cm, a layer composed of<br />
silt, containing no sand, is apparent (unit 2). The lower boundary of unit 2 is sharp, while its upper<br />
boundary is not well defined. Between app. 11 <strong>to</strong> 12 cm core depth, unit 3A is composed of well<br />
sorted sand. Below, unit 3B (12 <strong>to</strong> 20 cm core depth) contains higher amounts of clay and silt. Various<br />
shell fragments are abundant in unit 3B. <strong>From</strong> 20 cm <strong>to</strong> the base of the core, unit 4 is composed of<br />
sandy silt, and includes some shell fragments. Partly, layers containing higher amounts of sediments in<br />
the sand fraction are recognized in the x-ray images.
Shallow water sediment structures in a tsunami-affected area 19<br />
Figure 3: Side scan sonar draped over the bathymetric dataset. For position see figure 2. The length of the ridge<br />
is approx. 1500 m (perspective view). a) elongated sediment patches, consisting of fine <strong>to</strong> medium<br />
sand b) coarse sand c) carbonatic gravel and boulders (notice video image) d) sand at the surface,<br />
muddy material below e) position of short core (051207-37, fig. 7), composed of sandy material on<br />
<strong>to</strong>p and a fine grained layer at 10 cm depth.<br />
5 Discussion<br />
Sand ridges are formed due <strong>to</strong> regular hydrodynamic processes, e.g. tidal currents in inlets, ocean<br />
currents at the shelf margin or during s<strong>to</strong>rms (Ernstsen et al. 2006, Flemming 1978, Holland & Elmore<br />
2008), although moribund ridges as remnants from times with a lower sea level are known (Dyer &<br />
Huntley 1999). Goff et al. (1999) report that sand ridges on the northeast US Atlantic shelf are<br />
asymmetric, having steeper seaward flanks. Holland & Elmore (2008) report that grain sizes across<br />
sand ridges typically range from coarse <strong>to</strong> fine sand. The typical height of s<strong>to</strong>rm generated sand ridges<br />
is given with 3 <strong>to</strong> 12 m (van de Meene & van Rijn 2000). Commonly, sand ridges are oblique <strong>to</strong> the<br />
coastline, with the acute angle opening in<strong>to</strong> the prevailing flow direction (Swift et al. 1978, Holland &<br />
Elmoore 2008). Most of these features are found in the observed ridge system. The strike direction of<br />
the ridges indicates an approximately south-north directed current which was responsible for their<br />
formation. This was not the main current direction observed during the tsunami (images of the<br />
IKONOS satellite, Go<strong>to</strong> et al. 2007). Therefore, the ridge system existed prior <strong>to</strong> the tsunami, although<br />
the definite process responsible for its formation has not yet been identified.
20 Feldens et al.<br />
Figure 4: Elongated sedimentary structures offshore Phra Thong. Frequently, boulders are exposed in close<br />
vicinity <strong>to</strong> these structures. Water depth at A: 27 m. Water depth at B: 21 m.<br />
Notable are elongated sediment patches commonly found on the northern flanks of the sand ridges.<br />
While finer sediment on the steeper slope of asymmetrical sand ridges is common, in front of s<strong>to</strong>rm<br />
dominated coasts (Holland & Elmore 2008). Here fine sediments are not visible over the entire length<br />
of the flank, but instead they are deposited in small patches separated by coarser sediment. Similar<br />
bedforms on the continental shelf offshore <strong>Brazil</strong> have been formed due <strong>to</strong> s<strong>to</strong>rm events (Moscon &<br />
Bas<strong>to</strong>s <strong>2010</strong>). The comparison of side scan sonar images from 2007 and 2008 (figure 6) indicates that<br />
the general shape of the patches is preserved, but smaller parts begin <strong>to</strong> fade during one annual cycle,<br />
indicating an out-of-equilibrium event based deposition and ongoing reworking of the sediment.<br />
Additionally, the existence of identical sediment structures on the flat seafloor further indicates that<br />
their formation is not connected with the formation of the sand ridges. Therefore these elongated<br />
patches of fine grained sediment have <strong>to</strong> be interpreted as bedforms created by currents along the<br />
north-east/south-west direction. The general stability of these bedforms, combined with the slow<br />
fading of delicate structures suggests that no frequently occurring event is responsible for their<br />
formation. Since strong s<strong>to</strong>rms are rare in the area, and none occurred between the 2004 tsunami and<br />
our measurements (based on tracks published by the Regional Specialised Meteorological Centre –<br />
Tropical Cyclones (RMSC), New Delhi), it is reasonable <strong>to</strong> assume that the observed sediment pattern<br />
was influenced by the 2004 tsunami, either during the run-up or the backwash.<br />
It is assumed that the muddy material frequently found in grab samples at the base of the sand ridge<br />
corresponds <strong>to</strong> unit 2 in core 051207-37. Therefore, such material is present over a larger area at the<br />
base of the sand ridge, and not only locally in one core. Considering the silt separating two units of<br />
coarse sand, its deposition likely corresponds <strong>to</strong> a single event. Similar deposits in cores offshore the<br />
Eel River have been described by Crocket & Nittrouer (2004) as flood deposits, which could be<br />
generated in the research area by strong monsoon events. But also a tsunami backwash transports large<br />
amounts of fine-grained material offshore (Shi & Smith 2003). The process responsible for the<br />
formation cannot be determined with certainty. However, a deposition of this material during the<br />
monsoon is unlikely, as more regularly occurring structures would be expected. Regardless of the<br />
origin of their formation, these event deposits were preserved in the comparably sheltered<br />
environments at the base of the sand ridges. They are covered by coarse sand (unit 1), typical for this<br />
area of the shelf, indicating some sediment dynamics in the area. This agrees <strong>to</strong> the change of<br />
sedimen<strong>to</strong>logical boundaries observed in side scan sonar mosaics between 2007 and 2008 (figure 6). A
Shallow water sediment structures in a tsunami-affected area 21<br />
potential deposition of the sediments beneath unit 2 during an event, indicated for instance by the<br />
marked change in sand content of unit 3A compared <strong>to</strong> unit 3B, or the abundance of shell fragments in<br />
unit 3B, is uncertain. Further analysis is needed <strong>to</strong> identify the origin and the spatial extension of these<br />
potential tsunami deposits, especially closer <strong>to</strong>wards the shoreline.<br />
Interesting are frequent observations of boulders close <strong>to</strong> the elongated patches deposited at the<br />
seaward flank of the sand ridges. Many of these boulders show no connection <strong>to</strong> structures in the<br />
subsurface, and must have been transported <strong>to</strong> their current position. Potentially, this could have<br />
happened during the tsunami, either during the run-up from source areas in deeper waters, or during<br />
the backwash (compare Paris et al. 2009)<br />
Figure 5: Seismic profile crossing a sand ridge (for position see Figure 2). Clearly visible is the asymmetric<br />
form of the ridge which is indicating a transport direction from South <strong>to</strong> North. Additionally, the<br />
ridge is separated from the older surface below by an unconformity.<br />
Figure 6: Two side-scan sonar images showing a comparison of a detail of the sand ridge shown in figure 3.<br />
The left image was recorded in 2007, the right image in 2008. Small differences are visible. The<br />
con<strong>to</strong>urs of the elongated sedimentary structures are more pronounced in 2007.<br />
During the tsunami run-up, many boulders were transported <strong>to</strong>wards the intertidal area on Pakarang<br />
Cape (Go<strong>to</strong> et al. 2007). The backwash at Pakarang Cape was modelled by Go<strong>to</strong> et al. (2007). The<br />
authors show that the current speed of the backwash was in the order of 3m/s. This is strong enough <strong>to</strong><br />
move the observed boulders (Go<strong>to</strong> et al. 2007, Imamura et al. 2008), which have a diameter of less<br />
than 1 meter according <strong>to</strong> underwater images. Taking in<strong>to</strong> account a channelized backwash (Le Roux<br />
& Vargas 2005, Fagherazzi & Du 2007), it is possible that in some areas the current speed was strong<br />
enough <strong>to</strong> transport boulders downslope from the reef platform fringing Pakarang Cape back <strong>to</strong>wards
22 Feldens et al.<br />
the sea. However, this cannot explain the presence of boulders found several kilometers offshore (Fig.<br />
4).<br />
Figure 7: Properties of core 051207-37. <strong>From</strong> left <strong>to</strong> right, pho<strong>to</strong>, x-ray image, first mode in phi-degrees, sand<br />
content and sedimentary units are presented. For position, refer <strong>to</strong> Fig.2.<br />
6 Conclusion<br />
Detailed hydroacoustic surveys have been carried out offshore Phang Nga province (<strong>Thailand</strong>) in 2007<br />
and 2008 and sediment samples have been collected. Starting at 15 m water depth, a system of sand<br />
ridges, formed by coarse sand, was discovered. The sand ridges existed prior <strong>to</strong> the 2004 Indian Ocean<br />
Tsunami. Elongated sediment patches on the seaward flank of the sand ridges consist of fine <strong>to</strong><br />
medium sand, and indicate a current oblique <strong>to</strong> the coastline. They fade slowly during the annual<br />
cycle, and were potentially reworked during the 2004 Indian Ocean Tsunami. An event layer found at<br />
the base of a sand ridge is composed of silty sediment, which could be related <strong>to</strong> the tsunami<br />
backwash or floods during the monsoon. These event deposits are covered by coarse sand, and might<br />
enter the geological record.
Shallow water sediment structures in a tsunami-affected area 23<br />
References<br />
Abrantes, F., U. Alt-Epping, S. Lebreiro, A. Voelker & R. Schneider (2008): Sedimen<strong>to</strong>logical record of<br />
tsunamis on shallow-shelf areas: The case of the 1969 AD and 1755 AD tsunamis on the Portugese Shelf off<br />
Lisbon. In: Marine Geology 249: 283–293.<br />
Bell, R., H. Cowan, E. Dalziell, N. Evans, M. O`Leary, B. Rush & L. Yule (2005): Survey of impacts on the<br />
Andaman Coast, Southern <strong>Thailand</strong> following the great Sumatra-Andaman earthquake and tsunami of<br />
December 26, 2004. In: Bull. of The New Zealand Soc. For Earthquake Eng. 38 (3), 123–148.<br />
Crockett, J.S. & C.A. Nittrouer (2004): The sandy inner shelf as a reposi<strong>to</strong>ry for muddy sediment: an example<br />
from Northern California. In: Continental Shelf Research 24: 55–73.<br />
Dawson, A.G. & I. Stewart (2007): Tsunami deposits in the geological record. In: Sedimentary Geology 200:<br />
<strong>16</strong>6–183.<br />
Dyer, K.R. & D.A. Huntley (1999): The origin, classification and modelling of sand banks and ridges. In:<br />
Continental Shelf Research 19 (10), 1285–1330.<br />
Ernstsen, V.B., R. Noormets, C. Winter, D. Hebbeln, A. Bartholomä, B.W. Flemming & J. Bartholdy (2006):<br />
Qunatification of dune dynamics during a tidle cycle in an inlet channel of the Danish Wadden Sea. In: Geo-<br />
Mar Lett 26 (3): 151–<strong>16</strong>3.<br />
Fagherazzi, S. & X. Du (2007): Tsunamigenic incisions produced by the December 2004 earthquake along the<br />
coasts of <strong>Thailand</strong>, Indonesia and Sri Lanka. In: Geomorphology 99: 120–129.<br />
Feldens, P., K. Schwarzer, W. Sczcuciński, K. Stattegger, D. Sakuna & P. Sompongchaiykul (2009): Impact of<br />
2004 Tsunami on seafloor morphology and offshore sediments, Pakarang Cape, <strong>Thailand</strong>. In: Polish J. of<br />
Environ. Stud. 18: 63–68.<br />
Flemming, B.W. (1978): Underwater sand dunes along the southeast African continental margin – observations<br />
and implications. In: Mar. Geol. 26: 177–198<br />
Geronimo, I.D., M. Choowong, S. Phantuwongraj (2009): Geomorphology and superficial bot<strong>to</strong>m sediments of<br />
Khao Lak coastal area (SW <strong>Thailand</strong>). In: Polish J. of Environ. Stud. 18(1): 111–121.<br />
Holland, K.T. & P.A. Elmore (2008): A review of heterogenous sediments in coastal environments. In: Earth-<br />
Science Reviews 89: 1<strong>16</strong>–134.<br />
Goff, J.A., D.J.P. Swift, C.S. Duncan, L.A. Mayer & J. Hughes-Clarke (1999): High-resolution swath sonar<br />
investigation of sand ridge, dune and ribbon morphology in the offshore environment of the New Jersey<br />
margin. In: Marine Geology <strong>16</strong>1: 307–337.<br />
Go<strong>to</strong>, K. S.A. Chavanich, F. Imamura, P. Kunthasap, T. Matsui, K. Minoura, D. Sugawara & H. Yanagisawa<br />
(2007): Distribution, origin and transport process of boulders deposited by the 2004 Indian Ocean tsunami at<br />
Pakarang Cape, In: <strong>Thailand</strong>. Sed. Geol. 202: 821–837.<br />
Imamura, F., K. Go<strong>to</strong> & S. Ohkubo (2008): A numerical model for the transport of a boulder by tsunami. In:<br />
Journal of Geophysical Research 113, C01008, doi:10.1029/2007JC004170.<br />
Jackson, P.D., K.B. Briggs & R.C. Flint (1996): Evaluation of sediment heterogeneity using microresistivity<br />
imaging and X-radiography. In: Geo-Marine Latters <strong>16</strong>: 219–225.<br />
Jankaew, K., B.F. Atwater, Y. Sawai, M. Choowong, T. Charoentitirat, M.E. Martin & A. Prendergast (2008):<br />
Medieval forewarning of the 2004 Indian Ocean tsunami in <strong>Thailand</strong>. In: Nature 455: 1228–1231.<br />
Kelletat, D., S.R. Scheffers & A. Scheffers (2007): Field signatures of the SE-Asian Mega-Tsunami along the<br />
West Coast of <strong>Thailand</strong> compared <strong>to</strong> Holocene Paleo-Tsunami from the Atlantic Region. In: Pure appl.<br />
Geophys. <strong>16</strong>4: 413–431.<br />
Khokiattiwong, S., P. Limpsaichol, S. Petpiroon, P. Sojisuporn & B. Kjerfve (1991): Oceanographic variations<br />
in Phangnga Bay, <strong>Thailand</strong> under monsoonal effects. In: Phuket Marine Biological Center Research<br />
Bulletin, 55: 43–76.<br />
Kumar, V.S, V. Ramesh Babu, M.T. Babu, G. Dhinakaran & G.V. Rajamanickam (2008): Assessment of S<strong>to</strong>rm<br />
Surge Disaster Potential for the Andaman Islands. In: Journal of Coastal Research 24(2):171–177.<br />
Lay, T., H. Kanamori, J.C. Ammon & M. Nettles (2005): The great Sumatra-Andaman earthquake of 26<br />
December 2004. In: Science 306: 1127–1133.<br />
Le Roux, J.P. & G. Vargas (2005): Hydraulic behaviour of tsunami backflows: insights from their modern and<br />
ancient deposits. In: Environ. Geol 49: 65–75.<br />
Lur<strong>to</strong>n, X. (2002): Underwater Acoustics: An introduction. Springer (Berlin) 347 S.
24 Feldens et al.<br />
Moscon, D.M.C. & A.C. Bas<strong>to</strong>s (<strong>2010</strong>): Occurence of s<strong>to</strong>rm-generated bedforms along the inner continental<br />
shelf - southeastern <strong>Brazil</strong>. In: <strong>Brazil</strong>ian Journal of Oceanography 58: 45–56.<br />
Noda A., H. Katayama, T. Sagayama, K. Suga, Y. Uchida, K. Satake, K. Abe & Y. Okamura (2007): Evaluation<br />
of tsunami impacts on shallow marine sediments: An example from the tsunami caused by the 2003<br />
Tokachioki earthquake, northern Japan. In: Sed. Geol. 200: 314–327.<br />
Paris, R., J. Fournier, E. Poizot, S. Etienne, J. Morin, F. Lavigne & P. Wassmer (<strong>2010</strong>): Boulder and fine<br />
sediment transport and deposition by the 2004 tsunami in Lhok Nga (western Banda Aceh, Sumatra,<br />
Indonesia): A coupled offshore-onshore model. In: Marine Geology 268 (1-4): 43–54<br />
Pälike, H., N.J. Shackle<strong>to</strong>n & U. Röhl (2001): Astronomical forcing in Late Eocene marine sediments. In: Earth<br />
Planet. Sci. Lett. 193: 589–602.<br />
Shi, S. & D.E. Smith (2003): Coastal tsunami geomorphological impacts and sedimentation processes: Case<br />
studies of modern and prehis<strong>to</strong>rical events. International Conference on Estuaries and Coasts. November 9-<br />
11, 2003, Hangzhou, China<br />
Siripong, A. (2006): Andaman Seacoast of <strong>Thailand</strong> Field Survey after the December 2004 Indian Ocean<br />
Tsunami. In: Earthquake Spectra 22 (S3): 187–202.<br />
Swift, D.J.P., G. Parker, N.W. Lanfredi, G. Perillo & K. Figge (1978): Shoreface-connected Sand Ridges on<br />
American and European Shelves: A Comparison. In: Estuarine and Coastal Marine Science 7: 257–271.<br />
Synolakis, C.E. & L. Kong (2006): Runup measurements of the December 2004 Indian Ocean Tsuanmi. In:<br />
Earthquake Spectra 22 (S3): 67–91.<br />
Thampanya, U., J.E. Vermaat, S. Sinsakul & N. Panapitukkul (2006): Coastal erosion and mangrove<br />
progradation of Southern <strong>Thailand</strong>. In: Estuar., Coast. Shelf Sci. 68: 75–85.<br />
Tsuji, Y., Y. Namegaya, H. Matsumo<strong>to</strong>, S.I. Iwasaki, W. Kanbua, M. Sriwichai & V. Meesuk (2006): The 2004<br />
Indian tsunami in <strong>Thailand</strong>. Surveyed runup heights and tide gauge records. In: Earth Planets Space 58:<br />
223–232.<br />
Van Den Bergh G.D., W. Boer, H. De Haas, TJ.C.E. Van Weering & R. Van Wijhe (2003): Shallow marine<br />
tsunami deposits in Teluk Banten (NW Java, Indonesia), generated by the 1883 Krakatau eruption. In:<br />
Marine Geology 197: 13–34.<br />
Van de Meene, J.W.H. & L.C. van Rijn (2000): The shoreface-connected ridges along the central Dutch coast –<br />
part 1: field observations. In: Continental Shelf Research 20: 2295–2323.<br />
Weiss, R. & H. Bahlburg (2006): The Coast of Kenya Field Survey after the December 2004 Indian Ocean<br />
Tsunami. In: Earthquake Spectra 22 (S3): 235–240.<br />
Acknowledgement<br />
We are grateful <strong>to</strong> NRCT (National Research Council <strong>Thailand</strong>) and PMBC (Phuket Marine<br />
Biological Center) for providing us with the research vessels CHAKRATONG TONGAI and<br />
BOONLERT SOOK. We thank masters and crew of both vessels for their outstanding support during<br />
the cruise. The German part of this study was supported by DFG through research grant SCHW/11-1.<br />
Many thanks go <strong>to</strong> Wi<strong>to</strong>ld Sczcuciński and Karl Stattegger for good discussions.<br />
Address<br />
Peter Feldens<br />
University of Kiel - Institute of Geosciences<br />
Ot<strong>to</strong>-Hahn Platz 1<br />
24418 Kiel, Germany<br />
pfeldens@gpi.uni-kiel.de
Schwarzerr,<br />
Schrottke & Stattegger (eeds.):<br />
<strong>From</strong> Brazzil<br />
<strong>to</strong> <strong>Thailand</strong> – New Resultts<br />
in Coastal Research R<br />
<strong>Coastline</strong>e<br />
<strong>Reports</strong> <strong>16</strong> ( (<strong>2010</strong>), ISSN 00928-2734,<br />
IS SBN 978-3-9811839-9-3<br />
S. 25-34<br />
Use oof<br />
high ressolution<br />
ggeodata<br />
fo or inundaation<br />
moddelling<br />
as<br />
part of a tsunami<br />
risk asse essment inn<br />
Thailannd<br />
Gunilla KKaiser<br />
1 , Hannnes<br />
Römer 1<br />
, Daniela Arp A<br />
1 , Horst SSterr<br />
1 & Raalf<br />
Ludwig 2<br />
1<br />
Departm<br />
2<br />
Departme<br />
Abstracct<br />
Thhe<br />
mega-tsunaami<br />
of Dec. 226,<br />
2004 stronngly<br />
impacted d the Andamaan<br />
Sea coast of <strong>Thailand</strong> and a<br />
devvastated<br />
settlements,<br />
<strong>to</strong>urism<br />
resorts annd<br />
coastal eco osystems. In addition <strong>to</strong> thhe<br />
tragic loss s of<br />
maany<br />
lives, the destruction orr<br />
damage of liife-supporting<br />
g infrastructurre,<br />
such as buiildings,<br />
roads, , or<br />
waater<br />
& power ssupply<br />
causedd<br />
high econommic<br />
losses in th he region.<br />
Too<br />
mitigate futuure<br />
tsunami iimpacts<br />
there is a need <strong>to</strong> assess tsunammi<br />
risks in vuulnerable<br />
coas stal<br />
areeas<br />
at the Anddaman<br />
Sea coaast<br />
and <strong>to</strong> develop<br />
adequate e risk managemment<br />
strategiees.<br />
In the bilaterall<br />
German-Thhai<br />
research project TRA AIT mechanisms,<br />
impacts and long te erm<br />
connsequences<br />
of<br />
the 2004 tsuunami<br />
are inveestigated<br />
in or rder <strong>to</strong> conduuct<br />
a local riskk<br />
assessment and a<br />
<strong>to</strong> design a compprehensive<br />
rissk<br />
analysis <strong>to</strong>ool.<br />
Methods ar re developed ffor<br />
detailed haazard<br />
analysis s as<br />
weell<br />
as for vulnnerability<br />
analyysis<br />
of the soccio-economic<br />
and the ecoloogical<br />
system combining fi ield<br />
invvestigations,<br />
household annd<br />
company surveys, remote<br />
sensingg<br />
techniques and numeri ical<br />
moodelling.<br />
This paper deals wwith<br />
the hazardd<br />
analysis as one o part of a rrisk<br />
assessmennt.<br />
Haazard<br />
analysiss<br />
on a local sccale<br />
requires ddetailed<br />
knowl ledge of the <strong>to</strong>opography<br />
annd<br />
the inundat tion<br />
floow<br />
dynamics. Thus a highh<br />
resolution ddigital<br />
elevatio on model was<br />
generated bbased<br />
on rem mote<br />
sennsing<br />
data. MMoreover,<br />
<strong>to</strong> innclude<br />
the dammping<br />
effect of o vegetation on the tsunammi<br />
waves, a fi ield<br />
cammpaign<br />
was conducted <strong>to</strong>o<br />
derive roughhness<br />
parame eters for diffeerent<br />
land use<br />
classes in the<br />
reggion.<br />
Based onn<br />
an object-orriented<br />
land-uuse<br />
classificati ion these valuues<br />
were transsferred<br />
in<strong>to</strong> a site s<br />
speecific<br />
roughnness<br />
map. Inclluding<br />
a deepp<br />
sea and nea ar shore bathyymetry,<br />
mult-scale<br />
resolut tion<br />
<strong>to</strong>ppographic<br />
dataa,<br />
roughness mmaps<br />
and infoormation<br />
on str ructural patterrns<br />
like buildiings,<br />
a numeri ical<br />
tsuunami<br />
inundattion<br />
simulationn<br />
could be peerformed.<br />
A co omparison of the first resultts<br />
shows that the<br />
ressolution<br />
of thee<br />
geo basis daata<br />
strongly innfluences<br />
the accuracy of innundation<br />
simmulations<br />
and the<br />
appplicability<br />
of inundation maaps<br />
for risk asssessment<br />
and d managementt.<br />
1 Bacckground<br />
aand<br />
objectiives<br />
ment of Geoggraphy,<br />
Univer rsity of Kiel, GGermany<br />
ent of Geograpphy,<br />
Universit ty of Münchenn,<br />
Germany<br />
The Indian<br />
Ocean TTsunami<br />
on 26.12.2004 caused one of the mostt<br />
devastatingg<br />
natural dis sasters in<br />
his<strong>to</strong>ry. Triggered byy<br />
a Mw ~9.11-9.3<br />
megathhrust<br />
earthqu uake (Lay ett<br />
al. 2006, Sttein<br />
& Okal 2005) in<br />
the Summatra<br />
subducttion<br />
zone thee<br />
tsunami kiilled<br />
about 230.000 2 peopple<br />
around tthe<br />
Indian Ocean O and<br />
destroyeed<br />
buildings, , infrastructuure<br />
and coaastal<br />
ecosyste ems. Besidees<br />
Banda Acceh<br />
in Indon nesia the<br />
Andamaan<br />
Sea coast of <strong>Thailand</strong> was the nexxt<br />
most heavi ily impactedd<br />
area. The tssunami<br />
most t severely<br />
affected the provincees<br />
of Phang NNga<br />
and Phuuket<br />
1:45-2h after the earrthquake<br />
witth<br />
run-ups of f up <strong>to</strong> 15<br />
m observved<br />
near Khaao<br />
Lak (Tsujji<br />
et al. 2006) ).<br />
However<br />
not all reggions<br />
suffereed<br />
the same degree of flood<br />
impactss,<br />
some locallities<br />
were hit h harder<br />
than othhers.<br />
Thus, inn<br />
order <strong>to</strong> ddetermine<br />
thee<br />
spatial dis stribution of risk and <strong>to</strong> manage pre esent and<br />
future tsunami<br />
risk, tthere<br />
is a need<br />
<strong>to</strong> assess the tsunami hazard and vvulnerabilityy<br />
in flood pro one areas<br />
at the Anndaman<br />
Sea coast.<br />
To studyy<br />
the compleex<br />
interactioons<br />
of tsunammi<br />
related im mpacts on annd<br />
offshore in the Anda aman Sea<br />
Region the Germann-Thai<br />
Reseearch<br />
cooperration<br />
TRIA AS (Tracing Tsunami Immpacts<br />
onsh hore and<br />
offshore in the Anddaman<br />
Sea RRegion)<br />
wass<br />
initiated, funded f by thhe<br />
German RResearch<br />
Fo oundation
Use of high resolution geodata for inundation modeling 27<br />
Figure 1: The study areas Ban Nam Khem, Khao Lak, Thai Muang national park (upper right) and Pa<strong>to</strong>ng<br />
Beach (lower right) at the Andaman Sea coast of <strong>Thailand</strong><br />
3 Methodology<br />
Risk assessment and the development of a risk analysis <strong>to</strong>ol carried out in TRAIT are based on a<br />
common concept of risk, hazard and vulnerability widely applied in natural hazards research (amongst<br />
others Wisner et al. 2004, UNDP 2004), flood risk management (Schanze et al. 2006), and<br />
environmental science (Turner et al. 2003).<br />
Tsunami hazard analysis in this study includes the geophysical sources of an earthquake, the<br />
modelling of the generation and propagation of waves <strong>to</strong> the coast and its landward inundation<br />
characteristics including small scale landforms like coastal forests, buildings, rivers, tidal inlets and<br />
ponds.<br />
Vulnerability analysis is conducted by assessing the exposure of the elements at risk of the social,<br />
economic and ecological coastal system, their susceptibility <strong>to</strong> be harmed by the tsunami and their<br />
resilience, i.e. their ability <strong>to</strong> cope and recover.<br />
This means that the tsunami impacts are a function of various risk parameters which vary with time<br />
and space.
28 Kaiser et al.<br />
In TRAIT an integrated approach is applied including extensive field investigations, numerical<br />
modelling, household and company surveys as well as GIS and earth observation. Special focus is<br />
given <strong>to</strong> the application of remote sensing techniques, not only for quick assessment of damages<br />
caused by the tsunami but also for moni<strong>to</strong>ring processes. A time-series of multi-scale remote sensing<br />
data (i.e. SRTM, ASTER, IKONOS, MFC) is used <strong>to</strong> derive digital surface and elevation models, <strong>to</strong><br />
assess damages <strong>to</strong> buildings, <strong>to</strong> detect beach erosion or uprooting of vegetation, and <strong>to</strong> gain<br />
information on how the recovery process has proceeded until <strong>to</strong>day (e.g. recovery of coastal forests,<br />
res<strong>to</strong>ration of tidal inlets).<br />
As the Asian Tsunami of 2004 and its impacts are documented very well, a detailed analysis of<br />
mechanisms and consequences of this event is conducted. <strong>From</strong> this detailed analysis key parameters<br />
of tsunami risk will be derived <strong>to</strong> allow for comprehensive, quantitative risk assessment. The<br />
combination of the numerical modelling and a GIS database with quantitative vulnerability criteria<br />
provides a comprehensive GIS-based tsunami risk analysis <strong>to</strong>ol.<br />
Hazard analysis<br />
The tsunami hazard analysis, as part of the overall risk assessment, comprises modelling of the<br />
tsunami generation, propagation and inundation including the interaction of the tsunami with<br />
vegetation or buildings (figure 2). The analysis is performed for the 2004 event as well as for different<br />
scenarios for the study areas Pa<strong>to</strong>ng Beach, Khao Lak, Thai Muang national park and Ban Nam Khem.<br />
Special consideration is given <strong>to</strong> the inundation simulation as inundation depth, velocity, and<br />
expansion are crucial for risk analysis, risk management and evacuation planning.<br />
Source Pathway Recep<strong>to</strong>r<br />
Ocean > 100m depth<br />
ComMIT/MOST<br />
GEBCO 30 arc-sec<br />
Figure 2: Tsunami risk model<br />
Tsunami<br />
Ocean < 100m depth<br />
slope<br />
Reef<br />
ComMIT/MOST<br />
Thai Marine charts ~400 m<br />
Beach<br />
coastal forests<br />
Elements at risk<br />
Inundation area<br />
Risk zone<br />
ComMIT/MOST/MIKE 21FM<br />
DEM 90 m – 0.15 m<br />
As the quality of the model results strongly depends on the detail and the resolution of the input data,<br />
we check how different data sets on different scales influence the results of the tsunami modelling.<br />
The key data sets are bathymetry, <strong>to</strong>pography and a roughness maps, representing bot<strong>to</strong>m friction<br />
caused by land cover.
Use of high resolution geodata for inundation modeling 29<br />
Land use classification<br />
A detailed land use map is an important basis for hazard and vulnerability assessment as it provides<br />
information on the spatial characteristics of land cover in the area of investigation. The land use<br />
information was derived from high-resolution satellite images (IKONOS) with a horizontal resolution<br />
of 4 m in the multispectral channels. With a rule-based object-oriented classification scheme<br />
(Definiens Developer 7.0 software) land use information could be extracted very accurately from the<br />
multispectral image.<br />
The preliminary step of the object oriented classification is <strong>to</strong> segment a raster image in<strong>to</strong> image<br />
objects or segments which fulfil a user defined homogeneity criteria (Blaschke & Strobl 2001). The<br />
multi-resolution segmentation, which is a patented segmentation algorithm of Definiens AG, was<br />
realized by using two hierarchical segment levels. Subsequently the image objects could be assigned<br />
<strong>to</strong> a respective land use class by analyzing the spectral, shape-specific, textural and neighbourhoodspecific<br />
characteristics of the segments. For this, a complex system of rules (rule set) was created<br />
which incorporates both crisp and fuzzy rule definitions. Finally the quality and robustness of the<br />
developed rule set was evaluated by transferring the rule set <strong>to</strong> a different IKONOS scene.<br />
The final classification map for the coastal zone between Ban Nam Khem and Thai Muang city<br />
includes 42 different land use classes which are organized in the following nine super-classes:<br />
� Agriculture and Aquaculture: includes plantations, orchards and aquaculture<br />
� Barren land: sandy beaches, sand mining, mudflats etc.<br />
� Buildings and infrastructure<br />
� Grassland and Herbaceous vegetation: dense and sparse grassland with scattered trees<br />
� Scrubland: predominance of scrubs<br />
� Semi-open landscapes: mixture of woodland, scrubland and grassland, comparable <strong>to</strong> savannahs<br />
� Water: water surfaces like ponds, rivers, bays<br />
� Woodland: different types of natural forests, e.g. Mangroves, Casuarina forest, Primary Rain<br />
forest<br />
� Other: clouds, shadows and no data values.<br />
In connection with the hazard analysis, the land use map contributed <strong>to</strong> generating digital elevation<br />
models and <strong>to</strong> provide the spatial distribution of roughness values.<br />
Hydrological roughness<br />
Coastal forests like mangroves or beach forests are assumed <strong>to</strong> have a damping effect on the tsunami<br />
wave (Dahdouh-Guebas et al. 2005, Wolanski 2007, Danielsen et al. 2005). To prove this for the study<br />
areas, IKONOS data from 2003 and 2005 were compared with change detection techniques <strong>to</strong> identify<br />
areas with damaged vegetation and <strong>to</strong> gain rough information on the protective function of vegetation<br />
during the 2004 tsunami. To include the effect of wave attenuation in the inundation simulation a<br />
method was developed <strong>to</strong> calculate the appropriate Mannings roughness coefficients for each land use<br />
class in the study areas.<br />
To use this aforementioned method seven vegetation classes, defined as coastal habitats, were<br />
investigated in the field, which included three types of plantations with a large extent in the study<br />
areas: coconut plantations, oil palm plantations and rubber plantations as well as natural habitats:<br />
mangrove forest, beach forest (outer beach forest fringing the sandy beach and inner beach forest<br />
adjacent <strong>to</strong> the outer area), and a temporary swamp forest (Melaleuca area). For these habitats tree<br />
parameters like the “diameter at breast height” or “vegetation density” were measured and transferred<br />
in<strong>to</strong> Manning values according <strong>to</strong> Petryk & Bosmajian (1975).
30 Kaiser et al.<br />
For the remaining habitats in the study areas Manning values were estimated according <strong>to</strong> the “Guide<br />
for selecting Manning’s roughness coefficients for natural channels and flood plains” by Arcement<br />
and Schneider (1989) <strong>to</strong> avoid gaps in the final maps.<br />
Additionally an estimation of the influence of the drag coefficient was performed following the<br />
approach of Tanaka et al. (2009). Eventually a roughness map with Manning values was generated and<br />
implemented in the modelling (figure 3).<br />
Figure 3: Land use classification with Manning values for each land use class, left: Thai Muang, right: Khao<br />
Lak<br />
Generation of digital elevation models<br />
Two different elevation models were generated, processed, and applied <strong>to</strong> investigate the effect of the<br />
resolution of the <strong>to</strong>pography on inundation simulations: (1) Data from the Shuttle Radar Topography<br />
Mission (SRTM) with 90 m resolution and (2) a 0.15 m surface model derived from an airborne flight<br />
campaign conducted in the study areas with the multi- functional camera MFC-3, which contains an<br />
array of three RGB-Charge-Coupled-Device (CCD)-lines-modules (Börner et al. 2008).<br />
The SRTM is a digital surface model, including vegetation and buildings in its surface description.<br />
Hence the height information in each raster cell is a function of land surface characteristics. Thus in<br />
forest-covered areas SRTM C-band interferometric SAR measures heights within the tree canopy<br />
generating height differences of up <strong>to</strong> 20 m in the study areas due <strong>to</strong> patches of tropical forest. As this<br />
caused problems in using SRTM data for inundation modelling the surface model had <strong>to</strong> be corrected<br />
<strong>to</strong> a real ground model. Information on the vegetation structure was measured in the field <strong>to</strong> gain
32 Kaiser et al.<br />
analysis of the effect of buildings shows that including buildings as height information in the model<br />
generates a much more realistic indundation according <strong>to</strong> the measured inundation in the field.<br />
Figure 5 examplifies this in a difference image for the inundation depth with and without buildings,<br />
showing that the inundation extent increases significantly without including buildings in the model. At<br />
the same time backwater effects occur when including buildings as height values.<br />
Figure 5: Inundation depth in Pa<strong>to</strong>ng Beach showing the difference of an inundation simulation including<br />
buildings as height values and a simulation without buildings in the model grid, based on MFC data<br />
(resampled <strong>to</strong> 3 m)<br />
4 Conclusions and outlook<br />
In the German-Thai research project TRAIT research is performed on local tsunami risk assessment at<br />
the Andaman Sea coast of <strong>Thailand</strong> including a hazard analysis and a vulnerability analysis.<br />
The tsunami inundation modeling provides hazard maps including the inundation depths, the<br />
maximum inundation area and flow dynamics. They build a basis for a detailed analysis of the 2004<br />
tsunami impacts, for risk assessment and management at the Andaman Sea coast of <strong>Thailand</strong>. First<br />
outcomes of this study show that the accuracy and the resolution of the geodata used as input for the<br />
hazard analysis are crucial not only <strong>to</strong> understand the small scale mechanisms of tsunami impacts but<br />
also <strong>to</strong> provide inundation maps as a reliable basis for risk assessment, evacuation planning and risk<br />
management.<br />
Since this paper presents work in progress further analysis will be conducted on multi-scale<br />
<strong>to</strong>pography, the influence of detailed roughness information, inundation flow dynamics in urban and<br />
rural areas as well as inundation mapping.
Use of high resolution geodata for inundation modeling 33<br />
References<br />
Arcement, G. & V. Schneider (1989): Guide for Selecting Manning’s Roughness Coefficients for Natural<br />
Channels and Flood Plains. U.S. Geological Survey Water Supply Paper 2339, 67 p.<br />
Blaschke, T. & J. Strobl (2001): What’s wrong with pixels? Some recent developments interfacing remote<br />
sensing and GIS. GIS. In: Zeitschrift für Geoinformationssysteme 6: 12–17.<br />
Börner , A., H. Hirschmüller, K. Scheibe, M. Suppa & J. Wohlfeil (2008): MFC – A Modular Line Camera for<br />
3D World Modulling. International Workshop on Robot Vision (RobVis), Auckland, NZ, pp. 319–326.<br />
Dahdouh-Guebas, F., L.P. Jayatissa, D. Di Nit<strong>to</strong>, J.O. Bosire, D. Lo Seen & N. Koedam (2005): How effective<br />
were mangroves as a defence against the recent tsunami? In: Current Biology 15: 443–447.<br />
Danielsen, F., M.K. Sorensen, M.F. Olwig, V. Selvam, F. Parish, N.D. Burgess, T. Hiraishi, V.M. Karunagaran,<br />
M.S. Rasmussen, L.B. Hansen, A. Quar<strong>to</strong> & N. Suryadiputra (2005): The Asian Tsunami: A Protective Role<br />
for Coastal Vegetation. In: Science 310: 643.<br />
Lay, T., H. Kanamori, C.J. Ammon, M. Nettles, S.N. Ward, R.C. Aster, S.L. Beck, S.L. Bilek, M.L. Brudzinski,<br />
R. Butler, H.R. DeShon, G. Ekström, K. Satake & S. Sipkin (2005): The great Sumatra-Andaman<br />
earthquake of 26 December 2004. In: Science 308: 1127–1133.<br />
Paphavasit, N., S. Aksornkoae & J. De Silva (2009): Tsunami Impact on Mangrove Ecosystem. <strong>Thailand</strong><br />
Environmental Institute, Nonthaburi, 211 p.<br />
Petryk, S. & G. Bosmajian (1975): Analysis of flow through vegetation. In: Journal of the Hydraulics Division<br />
101(7): 871–884.<br />
Ti<strong>to</strong>v V. & F. Gonzalez (1997): Implementation and Testing of the Method of Splitting Tsunami (MOST)<br />
(National Oceanic and Atmospheric Administration, Washing<strong>to</strong>n, DC), Technical Memorandum ERL<br />
PMEL-112, 14 p.<br />
Tanaka, N., N.A.K. Nandasena, K.B.S.N. Jinadasa, Y. Sasaki, K. Tanimo<strong>to</strong> & M.I.M. Mowjood (2009):<br />
Developing effective vegetation bioshield for tsunami protection. In: Civil Engineering and Environmental<br />
Systems 26 (2): <strong>16</strong>3–180.<br />
Tsuji, Y., Y. Namegaya, H. Matsumo<strong>to</strong>, S.-I. Iwasaki, W. Kanbua, M. Siriwchai & V. Meesuk (2006): 2004<br />
Indian tsunami in <strong>Thailand</strong>: Surveyed runup heights and tide gauge records. In: Earth Planets Space 58:<br />
223–232.<br />
Turner, B.L., R.E. Kasperson, P.A. Matson, J.J. McCarthy, R.W. Corell, L. Christensen, N. Eckley, J.X.<br />
Kasperson, A. Luers, M.L. Martello, C. Polsky, A. Pulsipher & A. Schiller (2003): A framework for<br />
vulnerability analysis in sustainable science. In: Proceedings of the National Academy of Sciences of the<br />
United States of America 100 (14): 8074–8079.<br />
Schanze, J., E. Zernan & J. Marsalek (2006): Flood Risk Management: Hazards, Vulnerability and Mitigation<br />
Measures. Dordrecht: Springer (NATO Science Series - IV. Earth and Environmental Sciences; 67), 319 p.<br />
Stein, S. & E. Okal (2005): Speed and size of the Sumatra earthquake. In: Nature 434: 581–582.<br />
<strong>Thailand</strong> Group, International Tsunami Survey Team of Indian Ocean Tsunami Disaster (2005): The December<br />
26, 2004 Sumatra Earthquake Tsunami, <strong>Thailand</strong> Field Survey around Phuket, <strong>Thailand</strong>.<br />
(www.drs.dpri.kyo<strong>to</strong>-u.ac.jp/sumatra/thailand/phuket_survey_e.html).<br />
UNDP (2004): Reducing Disaster Risk. A challenge for Development. New York, <strong>16</strong>1 p.<br />
Wolanski, E. (2007): Synthesis of the protective functions of coastal forests and trees against natural hazards. In:<br />
Braatz, S., S. Fortuna, J. Broadhead & R. Leslie (eds.): Regional Technical Workshop on Coastal Protection<br />
in the Aftermath of the Indian Ocean Tsunami: What Role for Forests and Trees?, Khao Lak, FAO, pp. <strong>16</strong>1–<br />
183.<br />
Wisner, B., P. Blaikie, T. Cannon & I. Davis (2004): At risk. Natural hazards, people’s vulnerability and<br />
disasters. 2nd edition, 496 p.<br />
Acknowledgement<br />
The work has been carried out within the project TRAIT (Tsunami Risks, Vulnerability and Resilience<br />
in the Phang Nga and Phuket provinces, <strong>Thailand</strong>) funded by the German Research Foundation (DFG)<br />
in the period 2007-<strong>2010</strong>.
34 Kaiser et al.<br />
Address<br />
Gunilla Kaiser<br />
Christian-Abrechts University of Kiel - Department of Geography<br />
Ludewig-Meynstr. 14<br />
24098 Kiel, Germany<br />
kaiser@geographie.uni-kiel.de
Schwarzerr,<br />
Schrottke & Stattegger (eeds.):<br />
<strong>From</strong> Brazzil<br />
<strong>to</strong> <strong>Thailand</strong> – New Resultts<br />
in Coastal Research R<br />
<strong>Coastline</strong>e<br />
<strong>Reports</strong> <strong>16</strong> ( (<strong>2010</strong>), ISSN 00928-2734,<br />
IS SBN 978-3-9811839-9-3<br />
S. 35-43<br />
Zoninng<br />
instrumments<br />
forr<br />
“Coastaal<br />
and Ma arine Prottected<br />
Areeas<br />
of Mu ultiple<br />
Use” – An Exaample<br />
in Southern S Chile<br />
NNélida<br />
Ros<strong>to</strong> ock<br />
Chriistian-Albrechhts-University<br />
y of Kiel, Germmany<br />
Abstracct<br />
Chhile<br />
is a threshhold<br />
country wwhose<br />
econommic<br />
developme ent is primarilly<br />
based on thhe<br />
exploitation n of<br />
nattural<br />
resourcees.<br />
Within thaat<br />
context, the fishery sec<strong>to</strong> or and its prodducts<br />
play a mmajor<br />
role. In the<br />
couurse<br />
of appliication<br />
for mmembership<br />
inn<strong>to</strong><br />
the Orga anisation for Economic CCo-operation<br />
and a<br />
Deevelopment<br />
(OOECD),<br />
Chilee<br />
has <strong>to</strong> commmit<br />
<strong>to</strong> put 10 % of its <strong>to</strong>tal terri<strong>to</strong>ry incluuding<br />
its mar rine<br />
areeas<br />
under prootection.<br />
Howwever,<br />
until t<strong>to</strong>day,<br />
a very y small fractiion<br />
of its terrri<strong>to</strong>ry<br />
has be een<br />
resserved.<br />
The peercentage<br />
of mmarine<br />
areas iss<br />
extremely lo ow compared <strong>to</strong> the percenttage<br />
of terrestr rial<br />
areeas.<br />
In order t<strong>to</strong><br />
increase thhe<br />
percentage of marine are eas, the instruument<br />
of “Coaastal<br />
and Mar rine<br />
Prootected<br />
Areass<br />
of Multiplee<br />
Use” was eestablished.<br />
The T aim of thhis<br />
instrumennt<br />
is <strong>to</strong> comb bine<br />
ressource<br />
proteection,<br />
sustainable<br />
use, and econo omic developpment.<br />
Howwever,<br />
previo ous<br />
immplementation<br />
approaches regarding thee<br />
declaration of these areaas<br />
were not very successf ful.<br />
Thhere<br />
exists noot<br />
only a lackk<br />
of financiaal<br />
means and of acceptancce<br />
regarding the necessity of<br />
connservation<br />
annd<br />
protection of natural rresources,<br />
esp pecially marinne<br />
ones, but also a lack of<br />
sciientific<br />
experrience<br />
in thiis<br />
field. Thiss<br />
paper exam mines the exxisting<br />
categoories<br />
of zoning<br />
insstruments<br />
in Chile and coompares<br />
themm<br />
<strong>to</strong> respective<br />
internationaal<br />
categories. The result is<br />
a<br />
prooposal<br />
of a rre-categorisatiion<br />
of these instruments in i order <strong>to</strong> pprovide<br />
policyy<br />
makers in the<br />
Chhilean<br />
governmment<br />
with a uuseful<br />
conceptt<br />
for future pla anning and immplementationn<br />
of “Coastal and a<br />
Maarine<br />
Protecteed<br />
Areas of Multiple<br />
Use”.<br />
1 Bacckground<br />
aand<br />
motivaation<br />
In orderr<br />
<strong>to</strong> becomee<br />
a member of the Orgaanisation<br />
for r Economic Co-operatioon<br />
and Development<br />
(OECD) ), Chile has t<strong>to</strong><br />
achieve thhe<br />
aim of resserving<br />
10 % of its terri<strong>to</strong>ry<br />
for envirronmental<br />
pr rotection,<br />
includingg<br />
the surrounnding<br />
marine<br />
areas. Addditionally,<br />
the<br />
National CCoastal<br />
Politiic<br />
(SubSecM Mar 1995)<br />
demandeed<br />
the zoningg<br />
of the coasstal<br />
strip alonng<br />
the entire country by tthe<br />
end of MMarch<br />
2009. However, H<br />
the polittic<br />
did not prrovide<br />
the neecessary<br />
<strong>to</strong>olls<br />
which are needed <strong>to</strong> obtain<br />
this tarrget.<br />
Therefo ore, up <strong>to</strong><br />
this poinnt<br />
this aim hhas<br />
not yet been accommplished<br />
in Chile C due <strong>to</strong>o<br />
limited finnancial<br />
resou urces and<br />
because of insufficieent<br />
technical knowledge oof<br />
the execut ting authoritiies.<br />
The Coaastal<br />
and Maarine<br />
Protectted<br />
Areas off<br />
Multiple Use U constitutee<br />
one instrumment<br />
for the e Chilean<br />
Governmment<br />
<strong>to</strong> obtaain<br />
OECD mmembership.<br />
Their purp pose is <strong>to</strong> coombine<br />
the pprotection<br />
of o natural<br />
resourcees<br />
with a susttainable<br />
use oof<br />
the same aand<br />
with eco onomic devellopment<br />
(SubbSecMar<br />
199 95).<br />
2 Obbjectives<br />
The first<br />
and most important oobjective<br />
is t<strong>to</strong><br />
elaborate an approacch<br />
of zoningg<br />
instruments<br />
for the<br />
Chilean coasts. Howwever,<br />
somee<br />
aspects muust<br />
be consid dered previoously<br />
in ordder<br />
<strong>to</strong> unders stand the<br />
approachh.<br />
A zoning is necessaryy<br />
and reasonnable<br />
<strong>to</strong> inte egrate multipple<br />
uses in practice. Bu ut for the<br />
process oof<br />
developinng<br />
a zoning, a suitable cooncept<br />
or inst trument is addvisable,<br />
i.e. <strong>to</strong> be able in n the first
36 Ros<strong>to</strong>ck<br />
place <strong>to</strong> integrate different uses of resources. It is precisely the presence of such an instrument that is<br />
currently lacking in Chile.<br />
The second objective is <strong>to</strong> apply the elaborated approach accordingly in a preliminary zoning proposal<br />
for the pilot region Fresia, a commune in the Llanquihue Province in South Chile.<br />
Figure 1: The Los Lagos Region in South Chile: overview and spatial distribution of main economic activities<br />
in coastal waters. The circle indicates the location of the pilot region Fresia (Data Source: Regional<br />
Government of the Los Lagos Region; modified by the Author)
Zoning instruments for “Coastal and Marine Protected Areas of Multiple Use 37<br />
3 Regional setting<br />
The study area is located in the southern part of Chile approximately around 41°S latitude in the Los<br />
Lagos Region. This region is influenced by the west wind drift with high precipitation rates of around<br />
2,000 mm/year and relatively low differences in temperature between the seasons (Jan. 14.4°C; July<br />
6.6°C) (Mühr 2000). The adjacent marine areas are strongly influenced by the Humboldt-Current-<br />
System and the Cape Horn Current. These currents are shifting in accordance <strong>to</strong> changes in the<br />
overlying atmospheric pressure systems: the subtropical high-pressure area and the subpolar lowpressure<br />
area. In winter (July), the region is dominated by the Cape Horn current because both<br />
pressure systems are moved <strong>to</strong>wards North. During summer (Jan.) it is dominated by the Humboldt<br />
Current because of the southward movement of the pressure systems which leads <strong>to</strong> seasonal<br />
upwelling events near the coast (Thiel et al. 2007). The mountains of the Andes at this latitude are<br />
characterised by a chain of glacial lakes and active volcanoes (figure 1).<br />
The coasts of the Los Lagos Region can be divided in<strong>to</strong> two distinct sub regions with respect <strong>to</strong><br />
location, morphology and origin. The open Pacific coast is a rugged rocky shore characterised by cliffs<br />
and small bays (figure 2). It is a high energy environment where the swell and waves reach the coast<br />
nearly without previous energy dissipation. The beach material consists mainly of gravel and boulders.<br />
Few smaller sandy stretches exist only in the vicinity of river mouths or in calm and small cliff<br />
protected embayments.<br />
Figure 2: The Pacific coast in the Los Lagos Region, South Chile (Pho<strong>to</strong>: N. Ros<strong>to</strong>ck, May 31 st 2008)<br />
The second sub region is the Inner Sea, east of the Big Island of Chiloé. It is an enclosed part of the<br />
sea consisting of the Gulfs of Reloncaví, Ancud and Corcovado (figure 3). It was formed under the<br />
influence of the Pleis<strong>to</strong>cene glaciations as observed in the fjords at the eastern rim of the Inner Sea. It<br />
comprises many small islands grouped in<strong>to</strong> archipelagos which are divided by channels. The same<br />
characteristics continue <strong>to</strong> the south. The beaches are often sandy with a relatively low energy<br />
environment. Locally the formation of marshlands is in progress.<br />
Fishing and aquaculture are the main economic activities in the coastal and marine areas. These<br />
include small-scale coastal and offshore industrial fisheries as well as the cultivation of fishes, mussels<br />
and algae (figure 1). In official Management Areas (Spanish: Areas de Manejo y Explotación de<br />
Recursos Bentónicos) near the shore all kinds of benthic resources are allowed <strong>to</strong> be extracted from
38 Ros<strong>to</strong>ck<br />
their natural environment. Each Management Area comprises a strip of sea of approximately half a<br />
nautic mile in width and varying extension up <strong>to</strong> kilometres alongshore. Onshore economic sec<strong>to</strong>rs are<br />
agriculture, forestry and <strong>to</strong>urism.<br />
Figure 3: The coast of the Inner Sea in the Los Lagos Region, South Chile (Pho<strong>to</strong>: N. Ros<strong>to</strong>ck, June 7 th 2008)<br />
4 Methods<br />
The basic assumption for this method was that every activity is a use and therefore can be defined as a<br />
use category. It is a necessary prerequisite so that in the process of zoning each zone can be defined by<br />
a use category. At the end, the zoning integrates all different kinds of uses. In this approach the<br />
instruments for zoning are the suggested use categories (table 1).<br />
The basic procedure was a category assessment which was followed by analysis of the usefulness of<br />
these categories for the purpose of zoning.<br />
At first, an assessment and analysis of the legislative framework in Chile regarding marine and coastal<br />
areas was conducted. The most important law is the Fishing and Aquaculture Act (FAA) from 1991.<br />
This law defines and regulates nearly all permitted activities carried out in Chilean waters: fishing and<br />
aquaculture, the extraction of benthic resources in the Management Areas (see above) as well as<br />
environmental protection in Marine Parks and Reserves. Subsequent regulations and changes of the<br />
law are set in additional declarations such as Supreme Decrees.<br />
The second step was an assessment and analysis of international categories such as the United Nations<br />
Biosphere Reserves Programme and the Management Categories of the International <strong>Union</strong> for<br />
Conservation (IUCN). These were compared with the Chilean categories. If necessary, they were used<br />
<strong>to</strong> complete use categories which were not yet represented in the current Chilean legislation.<br />
Additional possible uses which have not been taken in<strong>to</strong> account by all these previous categories but<br />
seemed reasonable were considered. Their usefulness was analysed and if proven worthy an additional<br />
use category was defined.<br />
Finally, all worked out categories were evaluated and integrated in<strong>to</strong> one common approach of recategorisation.<br />
This re-categorisation relates especially <strong>to</strong> the contents of these categories. The<br />
categories themselves might have existed before but not necessarily in this form or context,<br />
respectively. So, only their contents and possible meanings were re-defined.
Zoning instruments for “Coastal and Marine Protected Areas of Multiple Use 39<br />
5 Results<br />
An approach for zoning instruments<br />
The categories presented here constitute an approach for zoning instruments (table 1). However, they<br />
should be considered as a concept and not as a rigid instrument. These categories are use categories<br />
which can be assigned <strong>to</strong> an area or a site inside the area <strong>to</strong> be be zoned. Then, this area is bound <strong>to</strong> a<br />
specific use according <strong>to</strong> the use category. In this way, a zoning can be obtained for the whole area<br />
needed. Thus, all multiple uses can be integrated.<br />
According <strong>to</strong> the FAA, the first category, fishery, is divided in<strong>to</strong> three subcategories: small-scale<br />
coastal fishery within the five-nautic-mile-zone; industrial fishery in the exclusive economic zone<br />
(EEZ) which in exceptional cases only are allowed <strong>to</strong> operate within the five-nautic-mile-zone, but<br />
never further onshore than one nautic mile; and last but not least the sports fishery.<br />
A similar subdivision is applied <strong>to</strong> the aquaculture activities and the extraction of benthic resources in<br />
Management Areas reported in the FAA. These last two categories are divided according <strong>to</strong> the<br />
species cultivated or extracted, respectively.<br />
Tourism is not specified in the FAA. Nevertheless, it plays an important role for coastal areas all over<br />
the world, including Chile. Therefore, it will be considered and given a separate category. This<br />
category will also be divided in<strong>to</strong> two subcategories according <strong>to</strong> the activities carried out. It is already<br />
an attractive activity <strong>to</strong> watch Blue Whales and Humpback Whales in the Inner Sea, but also sea lions,<br />
dolphins and a variety of sea birds can be seen. Regarding the rich benthic flora and fauna, they could<br />
be considered as possible basis for participative activities such as diving.<br />
Besides all that, the protection of these natural environments must be taken in<strong>to</strong> consideration. For this<br />
category the basic concepts of preservation and conservation (table 1) were provided by the FAA in<br />
terms of Marine Parks and Marine Reserves, respectively. Both concepts form the basis for a further<br />
division in<strong>to</strong> subcategories. However, a buffer area and an area with restricted access are still missing.<br />
The buffer area concept originates in the UN-Biosphere Reserves but until now it does not exist in<br />
Chile. The areas with restricted access originated from the IUCN categories and their conditions of<br />
protection degrees – another aspect which has not been considered in Chilean legislation.<br />
The next main category is transportation. After all the consideration of possible activities carried out in<br />
the coastal and marine areas in Chile, the transportation as the main supporting action has not been<br />
taken in<strong>to</strong> account. However, without marine transport none of these activities can be realised. In order<br />
<strong>to</strong> perform them there will be subcategories for each transaction, basically <strong>to</strong> conduct the associated<br />
operations and <strong>to</strong> prevent misuses of the according traffic routes. As a result, routes will be designated<br />
for <strong>to</strong>urism such as animal watching, for productive activities such as fishery, and finally for<br />
surveillance in order <strong>to</strong> moni<strong>to</strong>r all activities and <strong>to</strong> assure their correct use plus scientific moni<strong>to</strong>ring.<br />
Last but not least, a category for infrastructure installations at onshore sites of such Coastal and<br />
Marine Protected Areas of Multiple Use will be included. They are also subdivided in<strong>to</strong> the following<br />
subcategories: quays or other anchoring and landing places in order <strong>to</strong> alleviate the access <strong>to</strong> the coast<br />
and <strong>to</strong> transfer the catch; processing centres for subsequent treatment of the catch like s<strong>to</strong>rage, drying<br />
and slaughtering; and finally, buildings and other installations for scientific and administrative<br />
purposes.<br />
Proposal for a preliminary zoning in the pilot region Fresia<br />
Fresia is a coastal municipality in the Llanquihue province, located northwest of Puer<strong>to</strong> Montt. The<br />
access <strong>to</strong> the coast is relatively difficult. The single road has only one lane, it is unpaved and might<br />
temporarily be intrafficable. It leads <strong>to</strong> the southern end of Fresia, the mouth of the Llico River. The<br />
northern parts can only be reached by boat, on horseback or by foot. However, all these ways take<br />
various hours and might be impassable during bad weather conditions.
40 Ros<strong>to</strong>ck<br />
The economy of this municipality is characterised by agriculture and forestry as well as small-scale<br />
coastal fishery and the extraction of benthic resources in Management Areas (figure 2). However, no<br />
official infrastructure installations of any kind are constructed onshore.<br />
Table 1: Suggested use categories for coastal and marine areas according <strong>to</strong> the new approach<br />
Main category Subcategory Application and/or purpose <strong>to</strong> CMPA-MU<br />
Fishery Artisanal<br />
Industrial<br />
Sport<br />
Aquaculture Fishes<br />
Mussels<br />
Algae<br />
Benthic Resources Mussels<br />
Crustaceans<br />
Algae<br />
Tourism Whale and Bird<br />
Watching<br />
Participative<br />
Activities<br />
Ecosystem and Conservation<br />
Habitat Protection<br />
Transportation and<br />
Transit Traffic Routes<br />
Buildings and<br />
Infrastructure<br />
(coastal-productive<br />
and coastal-scientific)<br />
Preservation<br />
Restricted Areas<br />
Buffer<br />
Tourism<br />
Productive<br />
Surveillance<br />
Quays<br />
Processing centres<br />
Observation facilities<br />
Authorized individuals and/or users<br />
Artisanal fishermen<br />
Industrial fishermen<br />
Person with licence for sports fishing<br />
If not already present, they will not be allowed <strong>to</strong> develop,<br />
due <strong>to</strong> high potential environmental impact and alterations of<br />
the environment itself; if already present they might continue,<br />
but under conditions of ecological keeping (best practices)<br />
Permission <strong>to</strong> extract resources in a sustainable way,<br />
consequently the permissions will be granted temporarily for<br />
each economically important species, not effecting the noncommercial<br />
species<br />
Such as marine mammals and sea birds with certified and/ or<br />
licensed guides only<br />
Showing the practice of extracting benthic resources such as<br />
Loco and Algae for demonstration purposes only<br />
Keep the present state and avoid destructive or wasteful use;<br />
through management the conservation shall be granted<br />
Keep safe from harm, destruction or decay; provide access<br />
for scientific purposes only<br />
“No take zone”: neither access nor extraction is allowed in<br />
order <strong>to</strong> protect the ecosystems itself including all living<br />
species; such areas could be spawning grounds or nurseries<br />
A transitional area between the protection area and the other<br />
uses <strong>to</strong> obtain a spatial separation allowing access for<br />
scientific purposes only<br />
The routes for animal watching <strong>to</strong> get <strong>to</strong> the linger places<br />
The routes for vessels of industrial fishery <strong>to</strong> get passed the<br />
five-nautic-mile-zone, between their allowed fishing grounds<br />
and the harbour;<br />
The routes for artisanal fishermen <strong>to</strong> go <strong>to</strong> their fishing<br />
grounds, that lie within the five-nautic-mile-zone, they may<br />
be allowed <strong>to</strong> pass that zone further offshore <strong>to</strong> get there<br />
The routes for authorities <strong>to</strong> supervise and moni<strong>to</strong>r the<br />
activities, included are passages for scientific reasons<br />
Anchor places for local fishermen and <strong>to</strong> unload the catch<br />
Catch <strong>to</strong> be processed (s<strong>to</strong>rage, drying and slaughtering)<br />
Buildings and installations for scientific and administrative<br />
purposes
42 Ros<strong>to</strong>ck<br />
Commissions). At best, this future Coastal and Marine Protected Area of Multiple Use will comprise a<br />
<strong>to</strong>tal of 12 nautic miles along the entire coastline of Fresia. If possible the parts now belonging <strong>to</strong> the<br />
Management Areas (figure 4) will be included as well.<br />
The five-nautic-mile-zone shall include a buffer zone of half a nautic mile in width that surrounds the<br />
Transition or Mixed Zone in the North, East and South. In the Mixed zone, several uses of the<br />
suggested use categories shall be integrated such as small-scale fishery and <strong>to</strong>urism. The next zone<br />
<strong>to</strong>ward shore is an Ecosystem Management Zone. In this proposal a width of about one and a half<br />
nautic mile is suggested. This zone shall integrate the protection of coastal habitats and the sustainable<br />
extraction of benthic nearshore resources. Both zones, the Mixed Zone and Ecosystem Management<br />
Zone, need further subdivision according <strong>to</strong> the use categories. Unfortunately, the data available for<br />
this municipality are not sufficient <strong>to</strong> develop a more detailed zoning. Especially, specific data about<br />
ecology and the impacts of extracting benthic resources are lacking.<br />
6 Discussion and conclusion<br />
These categories are suggested <strong>to</strong> be used by policy makers in coastal and marine affairs in Chile.<br />
They shall provide a new concept or even instrument <strong>to</strong> conduct zoning at the Chilean coasts. During<br />
the process of zoning all desired uses can be combined, and undesirable uses can be excluded for<br />
certain reasons. However, final decision has <strong>to</strong> be made by persons which are competent or executing<br />
authorities. For this reason all possible uses were included in the present approach.<br />
Until now this re-categorisation has been used <strong>to</strong> elaborate the zoning of the coastal strip of Fresia by<br />
the Non-Governmental Organisation CODESOSUR-SINERGIAS as it was demanded by the National<br />
Coastal Commission. Together with the preliminary zoning presented in this paper, both proposed<br />
zonings constitute an attempt of Integrated Coastal Zone Management in Chile for the first time.<br />
It is clear that this approach still needs <strong>to</strong> prove its value in practice. But due <strong>to</strong> the lack of feasible<br />
nearshore zoning in Chile up <strong>to</strong> now, it is a step forward <strong>to</strong>ward future Integrated Coastal Zone<br />
Management.<br />
References<br />
Bundesministerium für wirtschaftliche Zusammenarbeit und Entwicklung (2007): Länderbericht Chile. Bonn.<br />
(http://chile.ahk.de/fileadmin/user_upload/28032007/Landerbericht_Chile_BMZ.pdf, June 18th 2009).<br />
Gobierno de Chile (1991): Ley General de Pesca y Acuicultura (Fishing and Aquaculture Act, FAA). Valparaíso.<br />
(http://www.navarro.cl/ambiente/pesca/doc/Ley_de_Pesca.pdf, June 19th 2009).<br />
International <strong>Union</strong> for Conservation of Nature (IUCN) (1994): Guidelines for Protected Area Management<br />
Categories. CNPPA with the assistance of WCMC. Gland, Cambridge. (http://www.unepwcmc.org/protected_areas/categories/eng/index.html,<br />
February 12th 2009).<br />
Ministerio de Defensa Nacional – Subsecretaría de Marina (SubSecMar) (1995): Establece Política Nacional del<br />
Uso del Borde Costero del Li<strong>to</strong>ral (PNUBC) de la República y Crea Comisión Nacional que indica.<br />
Santiago.<br />
(http://www.bordecostero.cl/prontus_borde/site/artic/20060801/asocfile/20060801185450/pnubc.pdf, May<br />
7th 2009).<br />
Mühr, B. (2000): Klimadiagramm Puer<strong>to</strong> Montt. (http://www.klimadiagramme.de/Samerika/puer<strong>to</strong>montt.html,<br />
June 25th 2009).
Zoning instruments for “Coastal and Marine Protected Areas of Multiple Use 43<br />
Thiel, M., E.C. Macaya, E. Acuña, W.E. Arntz, H. Bastias, K. Brokordt, P.A. Camus, J.C. Castilla, L.R. Castro,<br />
M. Cortés, C.P. Dumont, R. Escribano, M. Fernandez, J.A. Gajardo, C.F. Gaymer, I. Gomez, A.E.<br />
González, H.E. González, P.A. Haye, J.-E. Illanes, J.L. Iriarte, D.A. Lancelotti, G. Luna-Jorquera, C.<br />
Luxoro, P.H. Manriquez, V. Marín, P. Muñoz, S.A. Navarrete, E. Perez, E. Poulin, J. Sellanes, H. Hi<strong>to</strong><br />
Sepúlveda, W. S<strong>to</strong>tz, F. Tala, A. Thomas, C.A. Vargas, J.A. Vasquez & J.M. Alonso Vega (2007): The<br />
Humboldt Current System of Northern and Central Chile – Oceanographic Processes, Ecological<br />
Interactions and Socioeconomic Feedback. In: Oceanography and Marine Biology: An Annual Review 45:<br />
195–344 (http://www.ieb-chile.cl/publications/pdf/Thiel_et_al_2007_OMBAR.pdf, June 12th 2009).<br />
UNESCO (no date): The Statu<strong>to</strong>ry Framework of the World Network of Biosphere Reserves.<br />
(http://www.sovereignty.net/p/land/mab-stat.htm, March 19th 2009)<br />
Acknowledgement<br />
The work has been carried out within the project “Coastal Future for Chilean Coast” between the<br />
Christian-Albrechts-University and the Company for Environment and Coast, Kiel, Germany, and the<br />
Non-Governmental Organisation Strategic Centre for Sustainable Development (CODESOSUR-<br />
SINERGIAS) in Puer<strong>to</strong> Montt, Chile. The project also allowed me a stay in Puer<strong>to</strong> Montt <strong>to</strong> get <strong>to</strong><br />
know the situation at hand and also the wonderful people living there. Without their support this work<br />
would not have been possible. I am very thankful <strong>to</strong> all participants. Especially I want <strong>to</strong> thank<br />
Professor Horst Sterr from the University Kiel for his support and trust in my thesis, and also Dr. Kai<br />
Ahrendt for supporting the project. My very thanks also go <strong>to</strong> Dra. Marcia Morales Gómez and Sr.<br />
Aldo Palacios Courret in Puer<strong>to</strong> Montt whose support, help and guidance was very appreciated, during<br />
my stay with them in Chile.<br />
Last but not least I want <strong>to</strong> thank all my lec<strong>to</strong>rs for their attentive and thoroughly reading of this paper<br />
which resulted in very valuable comments for me.<br />
Address<br />
Nélida Ros<strong>to</strong>ck<br />
Christian-Albrechts-University of Kiel - Department of Geography<br />
Ludewig-Meyn-Str. 14<br />
24098 Kiel, Germany<br />
ros<strong>to</strong>ck@geographie.uni-kiel.de
Estimmation<br />
of PPresídio’ss<br />
Barrier IIsland<br />
(G Guamaré-NNE/Braziil)<br />
Migrat tion by<br />
Meaans<br />
of GISS<br />
and Rem mote Senssing.<br />
1 Christia<br />
Abstracct<br />
Schwarzeer,<br />
Schrottke & Stattegger (eeds.):<br />
<strong>From</strong> Brazzil<br />
<strong>to</strong> <strong>Thailand</strong>d<br />
– New Resullts<br />
in Coastal Research R<br />
<strong>Coastline</strong>e<br />
<strong>Reports</strong> <strong>16</strong> (<strong>2010</strong>), ISSN 0928-2734, IS SBN 978-3-98811839-9-3<br />
S. 45-48<br />
an Albrechts UUniversity<br />
of KKiel,<br />
Institute of Geoscienc ces, Sediemn<strong>to</strong>ology,<br />
Coastall<br />
and Continen ntal Shelf<br />
Reesearch,<br />
Germ many<br />
2<br />
Univeersidade<br />
Federral<br />
do Rio Gra ande do Nortee,<br />
<strong>Brazil</strong><br />
Cooastal<br />
zone occcupation<br />
has been increasiing<br />
in the last<br />
decades, whhich<br />
has causeed<br />
an express sive<br />
risse<br />
in the density<br />
of coastal zone populattion.<br />
A relativ ve rising in mmean<br />
sea level<br />
has provided<br />
a<br />
dimminution<br />
on the coastal zzone<br />
land areea.<br />
Barrier islands<br />
have bbeen<br />
used forr<br />
habitation and a<br />
enttertainment<br />
puurposes,<br />
and tthey<br />
also reprresent<br />
a natura al protection t<strong>to</strong><br />
the coast accting<br />
as a shel lter<br />
forr<br />
the coastlinee<br />
against wavee<br />
and tide actioon.<br />
In this sense a sspatio-temporral<br />
triennial annalysis,<br />
using g satellite imaages,<br />
was done<br />
for NE Bra azil.<br />
Thhe<br />
images were<br />
obtained from CBERRS,<br />
satellite dated from 14/08/2004, 13/08/2005 and a<br />
099/03/2006.<br />
Theey<br />
main goal oof<br />
this study is<br />
<strong>to</strong> quantify the t progradatiion<br />
of Presidioo’s<br />
barrier isla and<br />
(GGuamare-RN,<br />
NNE<br />
<strong>Brazil</strong>) duuring<br />
the periood<br />
from 2004 - 2006. Apprroximately<br />
200m/year<br />
was the<br />
proogradation<br />
obbserved<br />
for thhe<br />
referred island,<br />
pointing out high morphodynamic<br />
process for this t<br />
reggion.<br />
Attachedd<br />
<strong>to</strong> the progrradation,<br />
a shhoreline<br />
retrea at was observved<br />
at the areaa<br />
adjacent <strong>to</strong> the<br />
West<br />
extremity of the island. The <strong>to</strong>tal retreat<br />
measured was around 130m.<br />
1 Inttroduction<br />
and objectiives<br />
André GGiskard<br />
Aquuino<br />
da Silva a 1 & Heleniice<br />
Vital 2<br />
During tthe<br />
last decaades<br />
coastal erosion has been observ ved along mmany<br />
coasts around the world. w In<br />
some cases<br />
this occuurrence<br />
is linnked<br />
with risse<br />
in sea lev vel. Howeverr,<br />
in the casee<br />
of the NE-<strong>Brazil</strong>ian<br />
coast thee<br />
erosion is due <strong>to</strong> the ssedimentary<br />
budget (Dom minguez & BBittencourt<br />
11996).<br />
Low sediment<br />
availabillity<br />
is attribuuted<br />
<strong>to</strong> tec<strong>to</strong>nnic<br />
activities in this regio on (Bezerra eet<br />
al. 1998, VVital<br />
et al. 20 003, Vital<br />
et al. 2006).<br />
This staatement<br />
is suupported<br />
by data from se ea level curvves<br />
which weere<br />
reconstru ucted fort<br />
this region<br />
indicating<br />
that arounnd<br />
5000 yearrs<br />
B.P. sea le evel was a ffew<br />
meters aabove<br />
the act tual level<br />
(and shoowing<br />
a geneeral<br />
falling trrend<br />
during tthe<br />
last 5000 0 years B.P ( (Caldas et all.<br />
2006, Beze erra et al.<br />
2003, Peeltier<br />
1998).<br />
There arre<br />
a numberr<br />
of techniquues<br />
used <strong>to</strong> mmeasure<br />
coa astal erosion or coastlinee<br />
retreat and d satellite<br />
images tturned<br />
<strong>to</strong> bee<br />
very popullar<br />
during thhe<br />
past deca ade. This woork<br />
will focuus<br />
on the us se of this<br />
techniquue<br />
on the meeasurement<br />
oof<br />
the coastaal<br />
erosion oc ccurring on tthe<br />
N coast oof<br />
the RN st tate (NE-<br />
<strong>Brazil</strong>) bbetween<br />
20004<br />
and 2006 by using thhree<br />
images form the sattellite<br />
CBERRS.<br />
The ima ages were<br />
acquiredd<br />
from INPE (Institu<strong>to</strong> Brrasileiro<br />
de PPesquisas<br />
Esp paciais).<br />
2 Geographicall<br />
and geologgical<br />
settings<br />
The studdy<br />
area is loocated<br />
close <strong>to</strong> the city oof<br />
Guamaré (<strong>Brazil</strong>-NE) which is appproximately<br />
y 170 km<br />
NW of NNatal<br />
(figuree<br />
1), the cappital<br />
of the State Rio Grande G do Norte.<br />
The arrea<br />
is inserte ed on the<br />
domainss<br />
of the Potigguar<br />
Basin (BBertani<br />
et al. . 1990). It is subjected <strong>to</strong>o<br />
a semi-diurrnal<br />
mesotida al regime<br />
(Araújo et al. 2004).
48 Silva & Vital<br />
and my friends from <strong>Brazil</strong>. As well as <strong>to</strong> the Prof. Dr. Karl Stattegger, Dr. Klaus Schwarzer for the<br />
guidance and technical advises.<br />
Address<br />
André Giskard Aquino da Silva<br />
Christian Albrechts University of Kiel -<br />
Institute of Geosciences, Sedimen<strong>to</strong>logy, Coastal and Continental Shelf Research<br />
Ot<strong>to</strong>-Hahn-Platz 1<br />
24118 Kiel, Germany<br />
ag@gpi.uni-kiel.de
Schwarzerr,<br />
Schrottke & Stattegger (eeds.):<br />
<strong>From</strong> Brazzil<br />
<strong>to</strong> <strong>Thailand</strong> – New Resultts<br />
in Coastal Research R<br />
<strong>Coastline</strong>e<br />
<strong>Reports</strong> <strong>16</strong> ( (<strong>2010</strong>), ISSN 00928-2734,<br />
IS SBN 978-3-9811839-9-3<br />
S. 49-54<br />
DDynamics<br />
of mussell<br />
beds in the t Szczeccin<br />
Lagooon<br />
Christtiane<br />
Fenskee<br />
1 , Sven Daahlke<br />
1 , Phili ip Riel 1 & AAdam<br />
Woźn<br />
1<br />
Ernst MMoritz<br />
Arndt UUniversity<br />
of Greifswald, GGermany<br />
2S<br />
Sea Fisheries IInstitute,<br />
Świn noujście, Polaand<br />
niczka 2<br />
Abstracct<br />
Muussel<br />
beds plaay<br />
an importaant<br />
role as seccondary<br />
hard substrate bothh<br />
in the Northh<br />
Sea and in the<br />
Baaltic<br />
Sea. Manny<br />
species live<br />
on them, staabilise<br />
the sed diment and fooster<br />
bentho-ppelagic<br />
coupli ing.<br />
In the very eutrrophic<br />
Szczeccin<br />
Lagoon aat<br />
the German n-Polish bordder,<br />
zebra mussels<br />
(Dreisse ena<br />
poolymorpha)<br />
miight<br />
help <strong>to</strong> rees<strong>to</strong>re<br />
more naatural<br />
conditio ons by filterinng<br />
and thus cleeaning<br />
the water.<br />
In preparation fo for a pilot projject<br />
for biologgical<br />
res<strong>to</strong>ratio on methods ussing<br />
zebra muussels<br />
we wan nted<br />
<strong>to</strong> evaluate the mmussels’<br />
statuus<br />
quo. We theerefore<br />
mappe ed the currentt<br />
distribution oof<br />
zebra muss sels<br />
in the Szczecin Lagoon in suummer<br />
2007, using underw water video immaging,<br />
a sciientific<br />
SCUB BA-<br />
divving<br />
team andd<br />
benthos sampples<br />
taken witth<br />
Van Veen grabs g and box corers.<br />
Appparently<br />
the mussel beds hhave<br />
stronglyy<br />
decreased in n size over thee<br />
last 14 yearrs.<br />
This could d be<br />
duue<br />
<strong>to</strong> the highh<br />
trophic statte<br />
in combinnation<br />
with global g warminng,<br />
causing teemporal<br />
oxyg gen<br />
deficiencies.<br />
Other<br />
reasons may be stroong<br />
preda<strong>to</strong>r ry pressure oor<br />
methodicall<br />
differences in<br />
preeceding<br />
studiees.<br />
We plan t<strong>to</strong><br />
continue innvestigating<br />
th he dynamics of mussel bedds<br />
in a Germ man-<br />
Poolish<br />
interdisciiplinary<br />
projecct.<br />
1 Bacckground<br />
Mussels such as bluee<br />
mussels (MMytilus<br />
eduliss)<br />
or zebra mussels m (Dreiissena<br />
polymmorpha)<br />
are known k as<br />
“habitat engineers” ( (Jones et al. 11994)<br />
becausse<br />
they live in i clumps or bigger aggreegations<br />
(“be eds”) that<br />
offer maany<br />
niches aand<br />
hard subbstrate<br />
for a wide variet ty of other sspecies<br />
dwellling<br />
on the mussels.<br />
Mussel bbeds<br />
are therrefore<br />
often iislands<br />
of higgh<br />
biodiversity,<br />
especiallly<br />
in areas wwith<br />
muddy sediments s<br />
where onnly<br />
few speccies<br />
can livee.<br />
By enhanccing<br />
interspec cific facilitattion,<br />
a high biodiversity can thus<br />
lead <strong>to</strong> mmore<br />
effectivve<br />
resource consumption<br />
and better ec cosystem funnctioning<br />
(Caardinale<br />
et al l. 2002).<br />
Recentlyy<br />
many musssel<br />
beds in Germany aand<br />
North America A havee<br />
decreased in size and biomass<br />
(Smith eet<br />
al. 2006, BBüttger<br />
et al. 2008), raisinng<br />
the questio on of the cauuses.<br />
In the WWadden<br />
Sea, the Mytilus decrease is aattributed<br />
<strong>to</strong> 1) mild winnters<br />
causingg<br />
low recruitm ment and<br />
2) the innvasion<br />
of thhe<br />
Pacific oyster<br />
Crassosstrea<br />
gigas, a neozoon wwhich<br />
is a commpeti<strong>to</strong>r<br />
for food and<br />
space. Inn<br />
North Ameerica,<br />
a strong<br />
winter (1979/80)<br />
cause ed a massive reduction inn<br />
density and d biomass<br />
of musseels<br />
(Mytilus sspp.),<br />
causedd<br />
by ice scouur<br />
(Cousson& & Bourget 20005).<br />
The reccent<br />
decline of o mussel<br />
bed commmunity<br />
diveersity<br />
(about 60 % from 1960/70 <strong>to</strong> 2002) 2 is attriibuted<br />
<strong>to</strong> climmate<br />
warmin ng (Smith<br />
et al. 20006).<br />
Besides providing hhard<br />
substrate<br />
for many other specie es, mussels hhave<br />
anotherr<br />
important function:<br />
they filteer<br />
the water. This capacitty<br />
can be useed<br />
for biorem mediation (rees<strong>to</strong>ration<br />
of f a less eutrop phic state<br />
of a wateer<br />
body) (Reeeders<br />
& Bij de Vaate 1990).<br />
In order r <strong>to</strong> calculatee<br />
the necessarry<br />
amount of f mussels<br />
<strong>to</strong> alloww<br />
for a betteer<br />
water quaality,<br />
it is eessential<br />
<strong>to</strong> know k the sttatus<br />
quo off<br />
the existing g mussel<br />
populatioon.
50<br />
2 Obbjective<br />
The aimm<br />
of the pressent<br />
study wwas<br />
<strong>to</strong> map thhe<br />
existing mussel m beds of Dreissenna<br />
polymorph ha in the<br />
German part of the SSzczecin<br />
Laggoon<br />
(Kleinees<br />
Haff). The e distributionn<br />
and populaation<br />
composition<br />
are<br />
prerequisites<br />
<strong>to</strong> estimmate<br />
their aactive<br />
filtratiion<br />
potential l. The resultts<br />
are a basiis<br />
for calcul lating the<br />
number and biomaass<br />
of musssels<br />
necesssary<br />
<strong>to</strong> am meliorate thee<br />
water quuality.<br />
We plan an<br />
interdiscciplinary<br />
Gerrman-Polish<br />
project <strong>to</strong> ttest<br />
biological<br />
res<strong>to</strong>ration<br />
methods, especially aiding a the<br />
existing Dreissena mmussels<br />
<strong>to</strong> inccrease<br />
water clarity and enable e remessotrophicatioon.<br />
3 Loccation<br />
and Methods<br />
The studdy<br />
was carrieed<br />
out in Junne<br />
and July 2007 (4.6.-5 5.7.2007) in the Germann<br />
part of the Szczecin<br />
Lagoon, called Kleinnes<br />
Haff, whhich<br />
is situateed<br />
at the Ger rman-Polish border. Junee<br />
was chosen n because<br />
it has thhe<br />
highest viisibility<br />
in suummer<br />
accorrding<br />
<strong>to</strong> long-term<br />
monii<strong>to</strong>ring<br />
data (LUNG MV V unpubl.<br />
data) andd<br />
water tempperatures<br />
thaat<br />
enable longg<br />
diving periods.<br />
We useed<br />
the researrch<br />
vessel “B Bornhöft”<br />
of Greifs fswald Univeersity<br />
and a rrubber<br />
boat. Sediment sa amples weree<br />
taken with Van-Veen grabs g (0.1<br />
m²) and Günther boxx<br />
corers (0.066<br />
m² surface, , penetration depth: abouut<br />
20 cm).<br />
A <strong>to</strong>tal oof<br />
701 statioons<br />
were cheecked<br />
for DDreissena<br />
mu ussels. Investtigations<br />
<strong>to</strong>ook<br />
place alon ng a grid<br />
with sammpling<br />
pointts<br />
every 0.5 nautical milles.<br />
The very y deep and muddy areas<br />
were only sampled<br />
randomly<br />
because thhey<br />
do not ooffer<br />
suitablee<br />
substrate for f mussel atttachment.<br />
AAt<br />
sites with mussels,<br />
divers mmeasured<br />
the exact sizes oof<br />
the mussell<br />
beds, using g GPS, a commpass<br />
and vann<br />
Veen grab samples.<br />
As the visibility<br />
was very low, thhey<br />
often hadd<br />
<strong>to</strong> rely on haptic h insteadd<br />
of optic eviidence.<br />
On boarrd<br />
and in thee<br />
labora<strong>to</strong>ry, , the lengthss<br />
of the shel lls were meaasured<br />
with digital callip pers. The<br />
samples were sievedd<br />
(0.5 mm meesh<br />
size) andd<br />
preserved with w 10 % foormalin.<br />
Speecies<br />
were de etermined<br />
with a sttereomicrosccope<br />
in the llab<br />
after wattering<br />
the sa amples overnnight<br />
and thooroughly<br />
rins sing with<br />
tap wateer.<br />
Additionaally,<br />
the Seccchi<br />
depth annd<br />
oxygen sa aturation was<br />
measured. Water samp ples were<br />
taken foor<br />
the analyssis<br />
of nutriennts,<br />
ses<strong>to</strong>n, BOD5, and chlorophyll content (meethods<br />
and results r in<br />
Fenske eet<br />
al. (in prepp.)).<br />
Figure 1:<br />
Fen nske et al.<br />
Mussel bedds<br />
in the Kleinnes<br />
Haff, summmer<br />
2007. Th he <strong>to</strong>tal area covered<br />
by zebbra<br />
mussels is s 6.56 km²<br />
(=2.4%).
Dynamics of mussel beds in the Szczecin Lagoon 51<br />
4 Results<br />
Twelve mussel beds were found in the “Kleines Haff”, covering a <strong>to</strong>tal area of 6.56 km² (656 ha)<br />
which corresponds <strong>to</strong> 2.4 % of the area. Most of the mussel beds were found in sandy areas in 2.0-3.5<br />
m water-depth, surrounding the lagoon like a belt (figure 1). One exception is the central mussel bed<br />
(MB 3), which lies on a preli<strong>to</strong>rine elevation.<br />
The macrozoobenthos comprised 40 taxa. The average abundances of the most dominant taxa are<br />
shown in table 1. The zebra mussels (3,951 inds/m²) had a calculated <strong>to</strong>tal biomass of 8812.65 t (for<br />
calculation see Fenske 2003). The <strong>to</strong>tal average abundance of macrozoobenthic species on 7 mussel<br />
beds (26 samples) was 14,554 individuals/m².<br />
Table 1: Average abundances of the most dominant taxa on mussel beds in the Kleines Haff<br />
Taxon Average abundance (individuals/m²)<br />
Dreissena polymorpha (Mollusca, Bivalvia) 3951<br />
Oligochaeta (Tubificidae) 4543<br />
Chironomidae (Diptera) 2647<br />
Helobdella stagnalis (Annelida, Hirudinea) 486<br />
Bithynia tentaculata (Mollusca, Gastropoda) 237<br />
5 Discussion<br />
Mussel beds can persist over years or even decades, but they depend on many fac<strong>to</strong>rs:<br />
1. offspring and recruitment success (how many larvae develop successfully in<strong>to</strong> adult mussels?)<br />
2. underground (in general, hard substrate is necessary for attachment)<br />
3. currents (<strong>to</strong>o strong currents hinder settlement; low <strong>to</strong> medium current velocity secures food<br />
supply and higher chances of sufficient oxygen conditions compared <strong>to</strong> a stagnant water body)<br />
4. temperature (if <strong>to</strong>o high, mussels die)<br />
5. oxygen supply<br />
6. preda<strong>to</strong>rs<br />
7. parasites, pathogens<br />
8. pollutants<br />
9. intraspecific competition (within the same species)<br />
10. interspecific competition (between different species)<br />
No reports exist from the beginning of the 20 th century about the mussel bed cover or <strong>to</strong>tal biomass of<br />
mussels in Szczecin Lagoon. Brandt (1894) investigated the eastern part of the lagoon and found<br />
Dreissena polymorpha in typical places (about 2 m depth, in areas not <strong>to</strong>o exposed). However, there<br />
are no quantitative results.<br />
In the North Sea (Wadden Sea area near Sylt), mussel beds clearly increased in size during the 20 th<br />
century (Reise & Lackschewitz 1998). This may be due <strong>to</strong> positive effects of eutrophication providing<br />
more food (phy<strong>to</strong>plank<strong>to</strong>n) for suspension feeders. Recently, eutrophication has been considered as a<br />
negative fac<strong>to</strong>r, one reason being the potential oxygen deficiency which it can entail.<br />
Blue mussels (especially Mytilus edulis living in the euli<strong>to</strong>ral) can suffer from ice scour and strong<br />
winds. These reasons accounted for a strong decrease in the St. Lawrence River during the winter<br />
1979/80 and for high mortalities in the Sylt Wadden Sea area (Nehls et al. 1998).<br />
However, Dreissena polymorpha only lives in areas which are permanently submerged and most of<br />
them in depths of at least 2 m, so that in general, even strong winters should not cause them <strong>to</strong> die off<br />
completely.
52 Fenske et al.<br />
On the other hand, very mild winters may also affect the mussels: It has been reported that recruitment<br />
success after mild winters is particularly low (Büttger et al. 2008). However, for several bivalve<br />
species in the North Sea, post-settlement processes decide reproductive success (Straßer et al. 2001).<br />
While we found a <strong>to</strong>tal area of 6.56 km² of Dreissena mussel beds (= 2.4 % of the area of the Kleines<br />
Haff), a former mapping describes 19.2 km² (= 6.9. %) (figure 2, Andres 1993). The methods used<br />
were similar (scientific divers, underwater video camera recording, van Veen grab samples), but the<br />
former study was carried out over 2 weeks in August 1993 while our investigation <strong>to</strong>ok place for a 5<br />
weeks period in June/July. At this time of the year, far fewer juveniles can be expected. However, this<br />
does not affect the area of the existing mussel beds. Estimates based on sediment samples taken on<br />
grid points of 1 nautical mile across the Kleines Haff in 1993 and 1994 gave a <strong>to</strong>tal area of Dreissena<br />
beds of 57.0 km² (20.6 % of the area) (Günther 1998). In these last investigations, the size may have<br />
been overestimated, as the rim of the mussel beds were not confirmed by divers.<br />
Figure 2: Mussel beds mapped by Andres (1993). The <strong>to</strong>tal area in 1993 was 19.2 km², about 3 times the size of<br />
mussel beds in 2007.<br />
The “rise and fall” of mussel beds<br />
At least one living mussel bed had vanished between 1998 and 2009. It was the one in the middle of<br />
the German-Polish border which was present (and repeatedly sampled) in 1998 (Fenske 2003), while<br />
in 2007, only dead shells but no living mussels could be found (this study). At the recorded GPS<br />
positions divers searched intensively, but there was no living mussel bed anymore. A similar fate may<br />
have occurred <strong>to</strong> the field of empty mussel shells off the south shore between Ueckermünde and<br />
Mönkebude (near K25, figure 2).<br />
Some mussel beds discovered by Andres (1993) had vanished as well, e.g. K9 and K13 at the northwestern<br />
end. K70 on the south-east side had clearly decreased in size.<br />
On the other hand, at least two mussel beds found in our study (MB1 and MB3) are not mentioned by<br />
Andres (1993). They may not have searched intensively enough in the central part (which is mostly<br />
muddy and therefore an unlikely settling ground for Dreissena mussels). Still, the differences in size<br />
of the <strong>to</strong>tal mussel beds recorded are so large that we can assume a strong decrease in mussel beds<br />
over the last decade.<br />
Some Dreissena mussel populations have been reported <strong>to</strong> vary strongly. In Lake Mikolajskie<br />
(Mazurian Lakes, Poland) abundances ranged from 100 mussels/m² <strong>to</strong> 2200 mussels/m² over the time<br />
span of 31 years (1959-1989) with abrupt changes in density (Stańczykowska & Lewandowski 1993).
Dynamics of mussel beds in the Szczecin Lagoon 53<br />
A strong decrease was also observed by Wolnomiejski and Woźniczka (2008) for the Skoszewska<br />
Cove, a sheltered bay in the east of Szczecin Lagoon. Comparing the years 2001/2002 and 2005, the<br />
mussel bed area in Skoszewska Cove remained the same (10.70 km² = 51.6 % of the bay), but the<br />
average abundance (2172 mussels/m²) went down <strong>to</strong> half the number before (4691 mussels/m²).<br />
Biomass was reduced <strong>to</strong> little more than 10 % of the previous value (192 g freshweight/m², compared<br />
<strong>to</strong> 1760 g/m²). Even the high values of 2001/2002 are one order of magnitude below those from the<br />
1950s: Wik<strong>to</strong>r (1969) describes maximum densities of 114000 mussels/m² and a maximum biomass of<br />
20 kg/m²!<br />
Does this imply an internal cycle of rising and falling of mussel beds? Do they reproduce and recruit<br />
so successfully that after some years they start <strong>to</strong> cause their own (intraspecific) competition?<br />
Phy<strong>to</strong>plank<strong>to</strong>n production in the Szczecin Lagoon is still very high (polytrophic conditions) and<br />
competi<strong>to</strong>rs such as Anodonta anatina or Unio pic<strong>to</strong>rum occur in comparably low numbers (about 2/<br />
m² in our investigation). Despite their larger filtration capacity, their <strong>to</strong>tal impact is much lower than<br />
that of zebra mussels. In a semi-enclosed bay like Skoszewska Cove, it is possible that the stagnant<br />
water is filtered several times by the mussels so that in the end not enough food is left. However high<br />
densities of one single species (monoculture!) also favour parasites and illnesses. These fac<strong>to</strong>rs have<br />
not been checked in Skoszewska Cove.<br />
In Lake Zürich, internal cycles of Dreissena polymorpha abundances were positively correlated <strong>to</strong><br />
preda<strong>to</strong>r densities (birds). <strong>From</strong> 1976 <strong>to</strong> 1988 no <strong>to</strong>tal gain or loss of Dreissena was observed (Burla &<br />
Ribi 1998).<br />
One reason for a decrease or break-down of mussel populations could be oxygen deficiency caused by<br />
eutrophication in combination with warmer water temperatures. Compared <strong>to</strong> the long-term average<br />
(1975-2000), average water temperatures between 2002 and 2006 were 0.8°C higher (LUNG<br />
Gewässergütebericht 2006). Once a mussel bed has disappeared, it may take several years <strong>to</strong> reestablish,<br />
as pelagic larvae might not be drawn <strong>to</strong> that particular place. Even though larvae might be<br />
ingested by adult mussels, as suggested by Mörtl & Rothhaupt (2003), the normal settling size (200-<br />
300 µm) is above the preferred size of food particles of adult mussels (15-40 µm, Ten Winkel &<br />
Davids 1982). This suggests that the filtering activity of adult mussels should attract larvae and help<br />
them settle in suitable places.<br />
For Lake Zürich, Burla & Ribi (1998) found a positive correlation between the number of adult<br />
mussels and the number of larvae. With a small current mussel population in the Szczecin Lagoon, it<br />
might therefore take several years before the <strong>to</strong>tal population and size of mussel bed regains its<br />
potential size and filtering capacity.<br />
6 Conclusion<br />
Mussel beds in the Szczecin Lagoon decreased in size, average abundance and biomass between 1993<br />
and 2007. Whether this was caused by single fac<strong>to</strong>rs (e.g. food shortage, oxygen deficiency, mild<br />
winters and little recruitment) or whether this represents a long-term cycle remains an open question.<br />
We intend <strong>to</strong> investigate some of the influential parameters, such as predation impact and population<br />
dynamics in a joint German-Polish project on biological res<strong>to</strong>ration methods.<br />
References<br />
Andres, D. (1993): Video- und Fo<strong>to</strong>dokumentation der Bestände von Dreissena polymorpha Phallas (sic!) im<br />
Oderhaff. Aldebaran Marine research and broadcast, Kiel, 29 pp.<br />
Büttger, H., H. Asmus, R. Asmus, C. Buschbaum, S. Dittmann & G. Nehls (2008): Community dynamics of<br />
intertidal soft-bot<strong>to</strong>m mussel beds over two decades. In: Helgol Mar Res 62: 23–36.<br />
Burla, H. & G. Ribi (1998): Density variation of the zebra mussel Dreissena polymorpha in Lake Zürich, from<br />
1976 <strong>to</strong> 1988. In: Aquat. sci. 60: 145–156.
54 Fenske et al.<br />
Cardinale, B.J., M.A. Palmer & S.L. Collins (2002): Species diversity enhances ecosystem functioning through<br />
interspecific facilitation. In: Nature 415: 426–429.<br />
Cousson, M. & E. Bourget (2005): Small-scale variation in mussel (Mytilus spp.) dynamics and local production.<br />
In: Journal of Sea Research 53(4): 255–268.<br />
Fenske, C. (2003): Die Wandermuschel Dreissena polymorpha im Oderhaff und ihre Bedeutung für das<br />
<strong>Küsten</strong>zonenmanagement. PhD Thesis, University of Greifswald, 185 pp.<br />
Günther, B. (1998): Die Bedeutung des Makrozoobenthos für den Kohlens<strong>to</strong>ffumsatz im Sediment. In:<br />
Greifswalder Geographische Arbeiten <strong>16</strong>: 286–315.<br />
Jones, C.G., J.H. Law<strong>to</strong>n & M. Shachak (1994): Organisms as ecosystem engineers. In: Oikos 69: 373–386.<br />
LUNG (Landesamt für Umwelt, Naturschutz und Geologie) (2006) : Gewässergütebericht<br />
2003/2004/2005/2006: Ergebnisse der Güteüberwachung der Fließ-, Stand- und <strong>Küsten</strong>gewässer und des<br />
Grundwassers in Mecklenburg-Vorpommern. Güstrow.<br />
Mörtl, M. & K.-O. Rothhaupt (2003): Effects of adult Dreissena polymorpha on settling juveniles and associated<br />
macroinvertebrates. In: Internat. Rev. Hydrobiol. 88: 561–569.<br />
Nehls, G., I. Hertzler, C. Ketzenberg & G. Scheiffarth (1998): Die Nutzung stabiler Miesmuschelbänke durch<br />
Vögel. In: Gätje, C. & K. Reise (eds): ): Ökosystem Wattenmeer - Austausch-, Transport- und<br />
S<strong>to</strong>ffumwandlungsprozesse. Springer Verlag Berlin, pp. 421–435.<br />
Reeders, H.H. & A. Bij de Vaate (1990): Zebra mussels (Dreissena polymorpha): a new perspective for water<br />
quality management. In: Hydrobiologia 200/201: 437–450.<br />
Smith, J.R., P. Fong & R.F. Ambrose (2006): Dramatic declines in mussel bed community diversity: Response<br />
<strong>to</strong> climate change? In: Ecology 87(5): 1153–1<strong>16</strong>1.<br />
Reise, K. & D. Lackschewitz (1998): Benthos des Wattenmeeres zwischen Sylt und Rømø. In: Gätje, C. & K.<br />
Reise (eds.): Ökosystem Wattenmeer - Austausch-, Transport- und S<strong>to</strong>ffumwandlungsprozesse. Springer<br />
Verlag Berlin, pp. 55–64.<br />
Stańczykowska & Lewandowski (1993): Effect of filtering activity of Dreissena polymorpha (Pall.) on the<br />
nutrient budget of the lit<strong>to</strong>ral of Lake Mikolajskie. In: Hydrobiologia 251: 73–79.<br />
Straßer, M., A. Hertlein & K. Reise (2001): Differential recruitment of bivalve species in the northern Wadden<br />
Sea after the severe winter of 1995/96 and of subsequent milder winters. In: Helgoland Marine Research 55<br />
(3): 182–189.<br />
Ten Winkel, E.H. & C. Davids (1982): Food selection by Dreissena polymorpha Pallas (Mollusca: Bivalvia). In:<br />
Freshwater Biology 12: 553–558.<br />
Wik<strong>to</strong>r, J. (1969): Biologia Dreissena polymorpha (Pall.) i jej ekologiczne znaczenie w Zalewie Szczecińskim.<br />
(The Biology of Dreissena polymorpha (Pall.) and its ecological importance in the Firth of Szczecin). Studia<br />
i Materiały, Seria A Nr. 5: 88 pp. Morski Instytut Rybacki, Gdynia.<br />
Wolnomiejski, N. & A. Woźniczka (2008): A drastic reduction in abundance of Dreissena polymorpha Pall. in<br />
the Skoszewska Cove (Szczecin Lagoon, River Odra estuary): effects in the population and habitat. In:<br />
Ecological Questions 9: 103–111.<br />
Acknowledgement<br />
The study was supported by the International Bureau of the German Ministry of Education and<br />
Research (BMBF), Förderkennzeichen MOE 07/R58. We also acknowledge the support of the<br />
University of Greifswald.<br />
Address<br />
Dr. Christiane Fenske<br />
University of Greifswald - Institute for Biochemistry<br />
Felix-Hausdorff-Str. 4<br />
17489 Greifswald, Germany<br />
fenske@uni-greifswald.de
56<br />
Figure 1aa-c:<br />
a) Locatioon<br />
of the studdy<br />
sites along the German south-western<br />
s n Baltic Sea, nnear<br />
b) Schönh hagen and<br />
c) Heiligenhhafen.<br />
3 Meethods<br />
A small-scaled,<br />
duall<br />
channel, triiple-frequenccy<br />
(260, 330,<br />
770 kHz) SSSS<br />
(Yelloww<br />
Fin, Imagen nex) is<br />
used <strong>to</strong> mmeasure<br />
eveen<br />
in very shhallow<br />
water (< 1 m) by deployment in a fixed poosition<br />
from m a rubber<br />
boat. Thhe<br />
system hass<br />
an across-ttrack<br />
range rresolution<br />
of f 0.01 m. Higgh<br />
frequencyy<br />
is used with h a range<br />
of 20 m in water deppths<br />
< 5 m aand<br />
40 m in water depth h > 5 m. Geoographical<br />
loocations<br />
are given by<br />
Differenntial<br />
Global PPositioning.<br />
A grid resoolution<br />
of 10 0 cm is usedd<br />
for mosaiciing<br />
(Tri<strong>to</strong>n IlicsTM). I<br />
Ground--truthing<br />
is ddone<br />
by scienntific<br />
scuba ddivers.<br />
4 Ressults<br />
May M et al.<br />
Figure 22a<br />
exemplarilly<br />
shows an SSS mosaic from the sea afloor close t<strong>to</strong><br />
Schönhageen.<br />
The area bounded<br />
by dasheed<br />
lines connsists<br />
of a nnearshore<br />
barr<br />
identifiable e by wave-innduced,<br />
crosss-shore<br />
ripp ples. The<br />
distance between rippple<br />
crests deecrease<br />
<strong>to</strong>waards<br />
onshore from 95 <strong>to</strong> 10 cm. Smaaller<br />
ripples appear a as<br />
relativelyy<br />
light areas (figure 2a).<br />
Figure 2aa-b:<br />
a) Side-sccan<br />
sonar mosaic<br />
from thee<br />
near-shore zone<br />
of Schönnhagen<br />
mappeed<br />
on 23 Apri il 2009. b)<br />
Sediment mmap<br />
based on SSSS<br />
data.
62 Dolch<br />
Address<br />
Tobias Dolch<br />
Alfred Wegener Institute for Polar and Marine Research - Wadden Sea Station Sylt<br />
Hafenstr. 43<br />
25992 List, Germany<br />
Tobias.Dolch@awi.de
Abstracct<br />
S<strong>to</strong>orm<br />
surges aree<br />
often the reaason<br />
for crevaasses,<br />
flooding g, damages annd<br />
if it comes t<strong>to</strong><br />
the worst fa atal<br />
cassualities.<br />
To minimize daamages<br />
the cconstruction<br />
of stable andd<br />
high dikess<br />
is one of the<br />
necessities.<br />
Anoother<br />
importannt<br />
issue is <strong>to</strong> understand th he physical prrocesses<br />
causiing<br />
s<strong>to</strong>rm surg ges<br />
and<br />
the applicattion<br />
of this kknowledge<br />
<strong>to</strong> forecast wate er levels. Thesse<br />
forecasts ccan<br />
save life and a<br />
prootect<br />
areas likke<br />
ports or loower<br />
laying aareas<br />
where portable p floodd<br />
protection mmeasures<br />
can be<br />
insstalled.<br />
In Hammburg<br />
an apprroach<br />
<strong>to</strong> foreccast<br />
water leve els of s<strong>to</strong>rm suurges<br />
exists allready.<br />
Within<br />
a research<br />
project thee<br />
main objective<br />
is <strong>to</strong> impr rove the foreccasting<br />
water levels along the<br />
tiddal<br />
River Elbbe.<br />
Additionaally<br />
Hamburgg<br />
Port Autho ority deals wwith<br />
the analyysis<br />
of physi ical<br />
proocesses<br />
contaiined<br />
by empirrical<br />
and statisstical<br />
research h especially onn<br />
s<strong>to</strong>rm surgees,<br />
while partn ners<br />
in the project geenerate<br />
numerrical<br />
models t<strong>to</strong><br />
forecast wa ater levels indduced<br />
by tidess.<br />
The validat tion<br />
forr<br />
s<strong>to</strong>rm surgess<br />
is also basedd<br />
on statistical interpretation n.<br />
1 Bacckground<br />
aand<br />
Motivaation<br />
Hamburgg<br />
Port is thee<br />
most imporrtant<br />
port of Germany an nd one of thee<br />
most imporrtant<br />
ports in n Europe.<br />
Bulk carrgo<br />
and conttainers<br />
reachh<br />
Hamburg bby<br />
vessel via a the River EElbe.<br />
Increassing<br />
econom my during<br />
the last ccenturies<br />
resuulted<br />
in growwing<br />
length aand<br />
width of f vessels and of course deeeper<br />
draught ts. As the<br />
River Ellbe<br />
is subjeccted<br />
<strong>to</strong> the tidde<br />
it is neceessary<br />
<strong>to</strong> fore ecast the waater<br />
levels off<br />
all gauges along a the<br />
fairway as exactly ass<br />
possible.<br />
To imprrove<br />
the proognoses<br />
for s<strong>to</strong>rm surgees,<br />
Hamburg g Port Authoority<br />
(HPA) is a membe er of the<br />
research project OPTTEL<br />
– Wind set-up Studiies<br />
and Deve elopment of an Operationnal<br />
Model of f the tidal<br />
River Ellbe<br />
– fundedd<br />
by the Fedderal<br />
Ministryy<br />
of Educati ion and Reseearch.<br />
The mmain<br />
intentio on of this<br />
project is<br />
the developpment<br />
of an operational nnumerical<br />
model m which ssupplies<br />
conttinous<br />
inform mation on<br />
water levvels<br />
and currrents<br />
of the RRiver<br />
Elbe. OOPTEL<br />
receives<br />
scientifi fic support byy<br />
the German n Coastal<br />
Engineerring<br />
Researcch<br />
Council.<br />
The Fedderal<br />
Maritimme<br />
and Hydroographic<br />
Aggency<br />
(BSH) and the Fedderal<br />
Waterwways<br />
Enginee ering and<br />
Researchh<br />
Institute (BBAW)<br />
geneerate<br />
the moodels<br />
for the e forecasts ( OPTEL – A & C), the German<br />
weather Forecast Aggency<br />
“Deutsscher<br />
Wetterddienst”<br />
(DW WD) handles wwind<br />
data forr<br />
the models (OPTEL<br />
– B) andd<br />
the HPA aassumes<br />
the collection annd<br />
preparation<br />
of all reqquired<br />
data aand<br />
focuses on s<strong>to</strong>rm<br />
surges, ttheir<br />
causes aand<br />
characterristics<br />
(OPTEEL<br />
– D).<br />
In this arrticle<br />
first stuudies<br />
and ressults<br />
on the mmain<br />
<strong>to</strong>pic of f HPA - the ss<strong>to</strong>rm<br />
surges are presente ed.<br />
2 Obbjectives<br />
Schwarzerr,<br />
Schrottke & Stattegger (eeds.):<br />
<strong>From</strong> Brazzil<br />
<strong>to</strong> <strong>Thailand</strong> – New Resultts<br />
in Coastal Research R<br />
<strong>Coastline</strong>e<br />
<strong>Reports</strong> <strong>16</strong> ( (<strong>2010</strong>), ISSN 00928-2734,<br />
IS SBN 978-3-9811839-9-3<br />
S. 63-70<br />
Studies on the Deevelopmeent<br />
of Win nd set-up in the Rivver<br />
Elbe<br />
Caroline RRadegast,<br />
TThomas<br />
Stro otmann & UUlrich<br />
Ferk<br />
Hamburg PPort<br />
Authority y, Germany<br />
In 1962 a s<strong>to</strong>rm surrge<br />
caused mmany<br />
crevassses<br />
and mo ore than 3000<br />
casualities.<br />
Since then n HPA is<br />
working on the reseaarch<br />
of s<strong>to</strong>rmm<br />
surges. Duuring<br />
this s<strong>to</strong>r rm tide the wwater<br />
level reeached<br />
a value<br />
which<br />
was neveer<br />
recorded bbefore.<br />
Afterr<br />
1962 the reesearch<br />
on s<strong>to</strong> orm surges hheaded<br />
<strong>to</strong> thee<br />
establishme ent of the<br />
Hamburgger<br />
Sturmfluutwarndienst<br />
(WADI). Thhis<br />
service alerts a the porrt<br />
and the cittizens<br />
of Hamburg<br />
in
64 Radegast et al.<br />
case of a s<strong>to</strong>rm surge. An empirical and statistical approach provides forecasts of the water level in<br />
Hamburg. In most of the cases these forecasts are precise, but there are of course some s<strong>to</strong>rm surges,<br />
where forecasted and measured water levels differ more than 20 cm. Results of OPTEL – D hopefully<br />
lead <strong>to</strong> further improvement of that approach <strong>to</strong> reduce such rough results.<br />
S<strong>to</strong>rm surges are mainly caused by wind. In detail the aim of OPTEL – D is <strong>to</strong> define more precisely<br />
the influence of wind in the German Bight and the Waddensea. Are there similarities between wind<br />
directions, constancy of the wind and duration of wind velocities? Where is the major influence on the<br />
water levels by the wind: from the mouth of the River Elbe up <strong>to</strong> Hamburg, in the German Bight or<br />
further offshore in the North Sea? The analysis of the development of the rising water levels from the<br />
North Sea <strong>to</strong> Hamburg is another important component of OPTEL – D.<br />
Another <strong>to</strong>pic is the analysis of the upstream water discharge of the River Elbe, measured in Neu<br />
Darchau upstream of the weir of Geesthacht. The standardization of the water levels can show the<br />
influence of discharge on s<strong>to</strong>rm surge water levels.<br />
3 Location and Approaches<br />
The first step by the project team was <strong>to</strong> agree on the main gauges <strong>to</strong> analyse the water levels, the<br />
wind recording stations <strong>to</strong> investigate the wind set-ups and <strong>to</strong> define other important data necessary for<br />
the studies besides the upstream water discharge.<br />
The collected data for OPTEL and its s<strong>to</strong>rm surges refers <strong>to</strong> the period from 1980 <strong>to</strong> 2008. In addition<br />
<strong>to</strong> this period the s<strong>to</strong>rm surges, defined in OPTEL, needed <strong>to</strong> have the following characteristics:<br />
� the water level in Cuxhaven exceeds more than 2.0 m above high water (mean high water in<br />
Cuxhaven: + 1.5 m NN) and<br />
� the water level in Hamburg – St. Pauli is higher than + 4.0 m NN.<br />
Both characteristics are independent of the phase of the tide. These basic principles lead <strong>to</strong><br />
approximately 150 s<strong>to</strong>rm surges.<br />
In the proposal of OPTEL the names of different gauges of the River Elbe which are the basic for the<br />
research, are mentioned:<br />
Table 1: Gauges of the River Elbe considered in OPTEL<br />
Gauge Short River Elbe Station [km]<br />
Cuxhaven CUX 724<br />
Brunsbüttel BRU 697<br />
Brokdorf BRO 684<br />
Glückstadt GLÜ 674<br />
Grauerort GRA 661<br />
Schulau SCH 641<br />
Hamburg – St. Pauli STP 623<br />
Bunthaus BUN 610<br />
Zollenspieker ZOL 598<br />
Geesthacht (weir) GST 586<br />
To analyse the wind blowing from the North Sea <strong>to</strong> Hamburg the project team agreed <strong>to</strong> use the<br />
following wind recording stations: Borkum (located north of the Ems Estuary, border between<br />
Germany and the Netherlands), Scharhörn and Neuwerk (located outside of the mouth of the Elbe<br />
Estuary) and Cuxhaven, Brunsbüttel, Ruthenstrom and Finkenwerder all along the River Elbe.<br />
Figure 1 gives an overview of all relevant gauges and wind recording stations.
Studies on the Development of Wind set-up 65<br />
North Sea<br />
Figure 1: Review of the River Elbe, position of the gauges, wind recording stations<br />
and upstream water discharge (www.google.de)<br />
Wind set-up is defined as the difference between an expected and an actually reached water level. This<br />
difference is mainly produced by wind and leads <strong>to</strong> higher water levels. To estimate the difference the<br />
astronomical or the mean tide is required. The astronomical tide has been calculated by the BSH for<br />
the period from 1980 <strong>to</strong> 2008. The mean tide is calculated from the averaged water levels over five<br />
years. The discrepancy of the results will be analysed for both wind set-up graphs.<br />
To identify the causes for wind set-up is the main aim of the analysis in OPTEL – D, especially <strong>to</strong><br />
improve the forecasts. To survey a status quo for analysis of s<strong>to</strong>rm surges three different statistical and<br />
empirical approaches were used. All of them exclusively consider the peak values in Cuxhaven and<br />
Hamburg – St. Pauli at high water time.<br />
The first approach is a comparison between the forecasted water level and the measured water level<br />
for Hamburg – St. Pauli by WADI and its empirical statistical method at the moment of high tide in<br />
Cuxhaven. This comparison gives information about the accuracy of the forecast by this method.<br />
The difference between low water tide and the following high water tide is the second approach. This<br />
difference, called tidal rise, from Cuxhaven and Hamburg will be set in contrast with each other in a<br />
scatter diagram.<br />
To obtain a relation between the wind set-up during high tide (independent of high water time) of<br />
Cuxhaven and Hamburg is the third approach.<br />
Figure 2 shows two outlines <strong>to</strong> explain the calculation of the wind set-up and the tidal rise.<br />
The relation for wind set-up and tidal rise between Cuxhaven and Hamburg is presented in scatter<br />
diagrams in figure 3. The values of Cuxhaven are shown on the x-axis while on the y-axis the values<br />
of Hamburg – St. Pauli are presented. The first diagram displays the results of the wind set-up. The<br />
second diagram shows the result of tidal rise comparison as well as the linear regression.
66 Radegast et al.<br />
Mean high<br />
water CUX<br />
high water CUX<br />
wind set-up CUX<br />
real tide<br />
Mean high<br />
water STP<br />
high water STP<br />
Cuxhaven<br />
mean tide with<br />
predated<br />
astronomical<br />
times of setting in St. Pauli<br />
wind set-up STP<br />
low water CUX<br />
high water CUX<br />
Figure 2: Outlines for the explanation of wind set-up (left) and tidal rise (right)<br />
At first glance the results of the tidal rise look much better than the results of the wind set-up<br />
comparison. However, the different scaling of the axis and the standard error of these two approaches<br />
indicates that the wind set-up comparison provides better results.<br />
wind set-up Stau STP St.Pauli<br />
400<br />
350<br />
300<br />
250<br />
200<br />
150<br />
100<br />
50<br />
FPot (x) = 1,4362 x 0,9724<br />
FPot (x) = 1,4362 x ⇒ std error: 19,94<br />
FLin (x) = 1,2103 x +6,460<br />
(1,2502 x + 0)<br />
⇒ std error: 19,88<br />
0,9724<br />
⇒ std error: 19,94<br />
FLin (x) = 1,2103 x +6,460<br />
(1,2502 x + 0)<br />
⇒ std error: 19,88<br />
0<br />
0 50 100 150 200 250 300 350 400<br />
wind set-up Stau Cuxhaven CUX<br />
Figure 3: Scatter diagrams for wind set-up s (left) and tidal rise (right)<br />
low water STP<br />
high water STP<br />
Another form of presentation for these scatter diagrams is a chronological order of the s<strong>to</strong>rm surges<br />
and their results of wind set-up / tidal rise. The difference between function value and regression line<br />
is labelled by the pink scatters in figure 4 – only shown for the wind set-up approach.<br />
Additionally it is possible <strong>to</strong> show the correction of the upstream water discharge in this figure. By<br />
means of a multiple regression the effect of the upstream water discharge can be described. The white<br />
scatters show the dimension of the effect. The mean deviation for wind set-up averages here about ±<br />
7.6 cm / 1000 m 3 . For the tidal rise approach the discharge shows an influence of ± <strong>16</strong> cm / 1000 m 3 .<br />
It can be seen that the influence of the discharge in case of s<strong>to</strong>rm surges is not critical. The means are<br />
less than 20 cm which is the boundary value. This boundary value results of the WADI – approach.<br />
The forecast error should be less than 20 cm for s<strong>to</strong>rm surges.<br />
tidal Stieg rise StPauli St.Pauli<br />
tidal rise CUX<br />
700<br />
600<br />
500<br />
400<br />
300 300<br />
200<br />
100<br />
mean tide<br />
level<br />
tidal rise STP<br />
mean tide<br />
level<br />
Cuxhaven St. Pauli<br />
FPot (x) = 4,7799 x 0,7729<br />
FPot (x) = 4,7799 x ⇒ std error: 25,62<br />
FLin (x) = 1,0347 x +79,039<br />
(1,3057 x + 0)<br />
⇒ std error: 25,79<br />
0,7729<br />
⇒ std error: 25,62<br />
FLin (x) = 1,0347 x +79,039<br />
(1,3057 x + 0)<br />
⇒ std error: 25,79<br />
0<br />
0 100 200 300 400 500 600 700<br />
tidal Stieg rise Cuxhaven<br />
Cuxhaven
Studies on the Development of Wind set-up 67<br />
Difference between the function value of wind set-up and the<br />
regression line from CUX <strong>to</strong> STP<br />
100<br />
80<br />
60<br />
40<br />
20<br />
0<br />
-20<br />
-40<br />
-60<br />
-80<br />
-100<br />
Correction of the model results by considering the influence of the upstream water discharge<br />
analysis of the wind set-up without consideration of the upstream water discharge<br />
analysis of the wind set-up with consideration of the upstream water discharge<br />
138 / 18.11.1980<br />
140 / 1.1.1981<br />
142 / 8.10.1981<br />
/ 31.10.1981<br />
147 / 24.11.1981<br />
150 / 20.11.1982<br />
153 / 4.1.1983<br />
155 / 19.1.1983<br />
158 / 2.2.1983<br />
<strong>16</strong>1 / 8.1.1984<br />
<strong>16</strong>5 / 15.1.1984<br />
<strong>16</strong>7 / 21.10.1984<br />
<strong>16</strong>9 / 6.11.1985<br />
172 / 20.1.1986<br />
175 / 24.9.1988<br />
178 / 29.11.1988<br />
181 / 14.2.1989<br />
184 / 26.1.1990<br />
187 / 26.2.1990<br />
190 / 28.2.1990<br />
192 / 21.8.1990<br />
194 / 22.9.1990<br />
196 / 27.12.1990<br />
197a / 9.1.1991<br />
200 / 18.10.1991<br />
202a / 20.12.1991<br />
205 / 13.1.1993<br />
/ 22.1.1993<br />
209 / 25.1.1993<br />
/ 19.2.1993<br />
213 / 9.12.1993<br />
2<strong>16</strong> / 24.1.1994<br />
219 / 31.1.1994<br />
220a / 1.1.1995<br />
222 / 10.1.1995<br />
223 / 30.10.1996<br />
/ 4.1.1998<br />
226 / 29.10.1998<br />
/ 17.2.1999<br />
230 / 3.12.1999<br />
232a / 9.2.2000<br />
235 / 13.12.2000<br />
238 / 23.2.2002<br />
241 / 28.10.2002<br />
244 / 1.2.2004<br />
245 / 21.10.2004<br />
247a / 2.1.2005<br />
250 / 12.2.2005<br />
252 / 1.11.2006<br />
254 / 12.1.2007<br />
257 / 26.6.2007<br />
S<strong>to</strong>rm surge number / Date<br />
Figure 4: Difference between the function value of wind set-up and the regression line as well as<br />
the influence of the upstream water discharge<br />
The same form of presentation demonstrates the results of all three approaches (wind set-up, tidal rise<br />
and the WADI – approach) for every s<strong>to</strong>rm surge in figure 5. Wind set-up and tidal rise are available<br />
for every event; unfortunately the results of the WADI – approach are incomplete. Due <strong>to</strong> the<br />
enlargement of the lists of events there is no WADI – data for every s<strong>to</strong>rm surge. If there has not been<br />
made a forecast by WADI, no data have been s<strong>to</strong>red and it is very complex <strong>to</strong> reproduce the missing<br />
data. Therefore some gaps in data appear which will be filled contemporary.<br />
None the less one tendency is obvious. Since 1993 – the last optimisation after the beginning of the<br />
development in 1978 – the WADI-approach supplies very good results, except a few. The continuous<br />
advancement of this approach shows that many influencing fac<strong>to</strong>rs are already considered in this<br />
empirical and statistical procedure.<br />
The spreading of the tidal rise approach and the wind set-up approach are clearly larger than the<br />
spreading for WADI. Especially the values of the tidal rise seem <strong>to</strong> be very discontinuous, but the<br />
standard error is nearly the same as that of the WADI – approach. The standard error of the wind setup<br />
is a bit lower. To conclude, the wind set-up between Cuxhaven and Hamburg appears <strong>to</strong> be the best<br />
approach for further analysis.<br />
The next step was a research along all gauges of the River Elbe <strong>to</strong> show the development of the tidal<br />
wave in the estuary. The two different approaches, tidal rise and wind set-up, were used <strong>to</strong> analyse this<br />
effect. The tidal wave runs from Cuxhaven along Brunsbüttel, Brokdorf, Glückstadt, Grauerort and<br />
Schulau <strong>to</strong> Hamburg – St. Pauli. Figure 6 shows the relation of the wind set-up between every gauge<br />
<strong>to</strong> Hamburg – St. Pauli exemplarily for both approaches.<br />
Red circled black values give information about the forecast error. <strong>From</strong> Cuxhaven and Brunsbüttel <strong>to</strong><br />
St. Pauli the forecast errors are about 25 and 14 cm. Upstream Brokdorf the errors are less than 10 cm,<br />
which is a very good result. Therefore the progression of the s<strong>to</strong>rm surges from Brokdorf <strong>to</strong> Hamburg<br />
along the inner estuary can be described quite well as linear.
68 Radegast et al.<br />
Differences between the forecasted and<br />
messured water level [cm]<br />
120<br />
100<br />
80<br />
60<br />
40<br />
20<br />
0<br />
-20<br />
-40<br />
-60<br />
-80<br />
-100<br />
-120<br />
Flut Nr. / Datum<br />
140 / 01.01.1981<br />
WADI-approach (standard error = 24,53 cm)<br />
Wind set-up approach (standard error = 19,55 cm)<br />
Tidal rise approach (standard error = 24,82 cm)<br />
143 / 10.10.1981<br />
146 / 23.11.1981<br />
150 / 19.11.1982<br />
154a / 17.01.1983<br />
157 / 01.02.1983<br />
<strong>16</strong>1 / 07.01.1984<br />
<strong>16</strong>6 / 17.01.1984<br />
<strong>16</strong>8 / 05.11.1985<br />
172 / 20.01.1986<br />
176 / 07.10.1988<br />
180 / 24.12.1988<br />
Comparison of the approaches<br />
Figure 5: Comparison of the three analysing approaches and their standard error<br />
wind set-up Stau STP St. Pauli<br />
wind set-up Stau STP St. Pauli<br />
400<br />
350<br />
300<br />
250<br />
200<br />
150<br />
100<br />
50<br />
184 / 25.01.1990<br />
188 / 26.02.1990<br />
191a / 01.03.1990<br />
194 / 21.09.1990<br />
197 / 28.12.1990<br />
199 / 17.10.1991<br />
Figure 6: The run of the tidal wave from the mouth of the River Elbe <strong>to</strong> Hamburg – St. Pauli for the tidal rise<br />
approach<br />
202a / 20.12.1991<br />
206 / 13.01.1993<br />
208 / 24.01.1993<br />
211a / 19.02.1993<br />
214 / 19.12.1993<br />
s<strong>to</strong>rm surge number and date<br />
FPot (x) = 1,4362 x 0,9724 ⇒ Std.Fehler : 19,94 FPot (x) = 0,5<strong>16</strong>9 x 1,1518 ⇒ Std.Fehler : <strong>16</strong>,10 FPot (x) = 0,3635 x 1,2073 FPot (x) = 1,4362 x ⇒ Std.Fehler : 14,32<br />
FLin (x) = 1,2103 x +6,460<br />
(1,2502 x + 0)<br />
⇒ Std.Fehler : 19,88<br />
400<br />
FLin (x) = 1,2047 x - 11,049<br />
(1,1424 x + 0)<br />
⇒ Std.Fehler : 14,70<br />
400<br />
FLin (x) = 1,<strong>16</strong>23 x - 14,711<br />
(1,0836 x + 0)<br />
⇒ Std.Fehler : 10,84<br />
0,9724 ⇒ Std.Fehler : 19,94 FPot (x) = 0,5<strong>16</strong>9 x 1,1518 ⇒ Std.Fehler : <strong>16</strong>,10 FPot (x) = 0,3635 x 1,2073 ⇒ Std.Fehler : 14,32<br />
FLin (x) = 1,2103 x +6,460<br />
(1,2502 x + 0)<br />
⇒ Std.Fehler : 19,88<br />
400<br />
FLin (x) = 1,2047 x - 11,049<br />
(1,1424 x + 0)<br />
⇒ Std.Fehler : 14,70<br />
400<br />
FLin (x) = 1,<strong>16</strong>23 x - 14,711<br />
(1,0836 x + 0)<br />
⇒ Std.Fehler : 10,84<br />
wind Stau set-up STP St. Pauli<br />
350<br />
300<br />
250<br />
200<br />
150<br />
100<br />
50<br />
0<br />
0<br />
0<br />
0 50 100 150 200 250 300 350 400<br />
0 50 100 150 200 250 300 350 400<br />
0 50 100 150 200 250 300 350 400<br />
wind set-up Stau CUX Cuxhaven wind set-up Stau BRU Brunsbüttel wind set-up Stau BRO Brokdorf<br />
400<br />
350<br />
300<br />
250<br />
200<br />
150<br />
100<br />
50<br />
FPot (x) = 0,3890 x 1,1894 ⇒ Std.Fehler : 13,82 FPot (x) = 0,5044 x 1,1369 ⇒ Std.Fehler : 10,59 FPot (x) = 0,5876 x 1,1041 FPot (x) = 0,3890 x ⇒ Std.Fehler : 8,<strong>16</strong><br />
FLin (x) = 1,1273 x - 12,852<br />
(1,0600 x + 0)<br />
⇒ Std.Fehler : 10,51<br />
400<br />
FLin (x) = 1,0809 x - 7,542<br />
(1,0420 x + 0)<br />
⇒ Std.Fehler : 7,45<br />
400<br />
FLin (x) = 1,0406 x - 3,818<br />
(1,0214 x + 0)<br />
⇒ Std.Fehler : 4,62<br />
1,1894 ⇒ Std.Fehler : 13,82 FPot (x) = 0,5044 x 1,1369 ⇒ Std.Fehler : 10,59 FPot (x) = 0,5876 x 1,1041 ⇒ Std.Fehler : 8,<strong>16</strong><br />
FLin (x) = 1,1273 x - 12,852<br />
(1,0600 x + 0)<br />
⇒ Std.Fehler : 10,51<br />
400<br />
FLin (x) = 1,0809 x - 7,542<br />
(1,0420 x + 0)<br />
⇒ Std.Fehler : 7,45<br />
400<br />
FLin (x) = 1,0406 x - 3,818<br />
(1,0214 x + 0)<br />
⇒ Std.Fehler : 4,62<br />
wind set-up Stau STP St. Pauli<br />
350<br />
300<br />
250<br />
200<br />
150<br />
100<br />
50<br />
0<br />
0<br />
0<br />
0 50 100 150 200 250 300 350 400<br />
0 50 100 150 200 250 300 350 400<br />
0 50 100 150 200 250 300 350 400<br />
wind set-up Stau GLÜ Glückstadt wind Stau set-up GRA Grauerort wind Stau set-up SCH Schulau<br />
218 / 28.01.1994<br />
220a / 01.01.1995<br />
222b / 20.03.1995<br />
wind set-up Stau STP St. Pauli<br />
Stau STP<br />
wind set-up St. Pauli<br />
223b / 10.10.1997<br />
350<br />
300<br />
250<br />
200<br />
150<br />
100<br />
50<br />
350<br />
300<br />
250<br />
200<br />
150<br />
100<br />
50<br />
226 / 29.10.1998<br />
228a / 01.12.1999<br />
232 / 30.01.2000<br />
235 / 13.12.2000<br />
239 / 26.02.2002<br />
243 / 21.12.2003<br />
245 / 21.10.2004<br />
248 / 08.01.2005<br />
251a / 08.02.2006<br />
254 / 11.01.2007<br />
258 / 09.11.2007
Studies on the Development of Wind set-up 69<br />
The results of this effect are a very important result. This implicates that the influences on the water<br />
levels are located outside the mouth of the River Elbe. Certainly this fact is just a little help for the<br />
forecasts. The tidal wave needs about 2-3 hours from Cuxhaven <strong>to</strong> St. Pauli and it would be <strong>to</strong>o late<br />
for an alert. But this knowledge can be used for a specification of the forecasts and about ceasing the<br />
handling of cargo or not.<br />
The wind is probably the most important influence on water levels, because it causes the wind set-up.<br />
Therefore it is necessary <strong>to</strong> research the main fac<strong>to</strong>rs on that. There are three important parameters:<br />
wind direction, wind speed and the difference of wind set-up between Cuxhaven and Brokdorf. The<br />
aim is <strong>to</strong> find the main wind set-up causing direction and period of time. Is there a time period before<br />
high tide in Cuxhaven that has a great influence on the wind set-up heights and would the<br />
consideration of this result lead <strong>to</strong> better forecasts? Research of this fact is still at the beginning. Wind<br />
data from Scharhörn are currently used but probably there will be a concentration on the wind data of<br />
Cuxhaven and Brunsbüttel <strong>to</strong>o.<br />
4 Results<br />
At the beginning data collection, controlling and validation were the main part of OPTEL - D. The<br />
following data are collected: water level, wind speed and direction, degree of salinity, flow velocity<br />
and direction, water temperature, upstream water discharge, mean and astronomical tide.<br />
The water level data were used for the analysis of three different approaches. The evaluation of the<br />
approaches showed, that the wind set-up approach gives the best results. But <strong>to</strong> minimise the standard<br />
errors the understanding of the physical effects causing the increasing water levels is necessary.<br />
The fac<strong>to</strong>r of the upstream water discharge is not responsible for high variations between expected and<br />
measured water level. There is an influence but it is not essential. Another fac<strong>to</strong>r is the linear<br />
describable movement of the tidal wave from Brokdorf through the estuary up <strong>to</strong> Hamburg - St. Pauli.<br />
There is evidence <strong>to</strong> imply, that all influences causing the wind set-up are located in the German Bight<br />
and the mouth of the River Elbe. The wind along the River Elbe is not that important for the water<br />
levels, which are reached in Hamburg - St. Pauli. This increase is created by the narrowing shape of<br />
the River Elbe.<br />
At least the wind outside the estuary is the main cause for the height of the wind set-ups. But it is very<br />
difficult <strong>to</strong> apportion the different elements of the wind as direction, speed, duration and produced<br />
wind set-up height. Therefore - as a next step - all s<strong>to</strong>rm surges are needed <strong>to</strong> be analysed individually.<br />
5 Discussion and conclusion<br />
Further analyses for improved statistical and empirical models for s<strong>to</strong>rm surges are still necessary.<br />
Other appendages for the research in OPTEL - D are for example the variation of the gradient of the<br />
individual tide or the filling degree of the estuary, when a s<strong>to</strong>rm surges is expected.<br />
The co-partners of OPTEL are dealing with other components.<br />
OPTEL - A establishes a model of the River Elbe based on BSHcmod and designed by BSH. BAW<br />
also works on a model, but based on UnTRIM. This part is OPTEL - C. Both partners need <strong>to</strong> calibrate<br />
and validate their models. They also need <strong>to</strong> accomplish an interface <strong>to</strong> transfer hydrodynamic<br />
parameters like water levels, flow and degree of salinity from the model of the North Sea <strong>to</strong> the model<br />
of the River Elbe.<br />
DWD computes the roughness of the surface and the <strong>to</strong>pography along the River Elbe up <strong>to</strong> the weir<br />
Geesthacht. Additionally the production of coefficients for the correction of wind speed dependent on<br />
the direction is required. The coefficients are part of the meteorological models COSMO-DE and<br />
COSMO-EU.
72 Papenmeier et al.<br />
3 Study area<br />
The meso- <strong>to</strong> macro-tidal Weser estuary is located at the German North Sea coast (figure 1).<br />
Figure 1: Left: Overview of the Weser estuary with markings of the two sites A and B. Centre and right: study<br />
sites in detail with subsections.<br />
Site A was located at the southern end of the brackish reach and of the turbidity maximum zone<br />
(TMZ) during the experiments (figure 1). Depending on tidal phase, meteorological conditions and<br />
freshwater discharge, this zone can be shifted further up or down-stream (Grabemann & Krause 2001).<br />
The water column is well mixed due <strong>to</strong> tidal flow velocities of 1-1.3 m/s on average. SSC can reach<br />
values of up <strong>to</strong> 1.5 g/l in the water column of the TMZ (Grabemann & Krause 1989, 2001) with<br />
increasing values in the near-bed zone (Schrottke et al. 2006). Spatial distribution of SSC strongly<br />
depends on the tides. Whereas SPM is well distributed during ebb and flood phases, particle settling<br />
starts with decreasing tidal flow. Large particle aggregates of > 100 µm are formed (Wellershaus<br />
1981).<br />
Site B represents the freshwater reach (figure 1). Tidal currents, which amount <strong>to</strong> 1 m/s, are slightly<br />
lower (Schuchardt et al. 1993). SSC is mainly controlled by riverine input. Generally, SSC values do<br />
not exceed 0.05 g/l in the tidal dominated freshwater zone (Grabemann & Krause 2001, Schuchardt et<br />
al. 1993). Tidal induced SSC variation is less pronounced.<br />
Riverbed morphology in the channel sections of both sites is characterised by subaqueous dunes of up<br />
<strong>to</strong> 6 m in height and of up <strong>to</strong> 150 m in length (Schrottke et al. 2006). The dunes are mainly two- or<br />
three-dimensional, lateral orientated <strong>to</strong> the main flow direction in the navigation channel and reflect<br />
ebb dominance (Schrottke et al. 2006). Dunes are mainly consist of medium-sized sands (Stengel<br />
2006). Dune morphology and grain-size composition are frequently impact by dredging.<br />
4 Material and Methods<br />
In-situ PSD is detected by laser diffraction with a ‘Laser In-Situ Scattering & Transmissometry’<br />
system LISST-100x (type-C, Sequoia® Scientific Inc.). A collimated laser beam is scattered at small<br />
particles in the water column and processed at a multi-ring detec<strong>to</strong>r. PSD is displayed in 32<br />
logarithmically-spaced size classes, ranging from 2.5 <strong>to</strong> 500 µm (8.6 <strong>to</strong> 1.0 Phi). Particles beyond the<br />
measuring range are assigned either <strong>to</strong> the finest or largest size class, respectively (Agrawal &<br />
Pottsmith 2000). This can cause rising tails at the boundaries. There is no option for differentiation<br />
between particles and air bubbles. PSD is presented as volume concentration (VC) of each size class,<br />
summed-up <strong>to</strong> TVC. This is related <strong>to</strong> optical transmission (τ) detected with a pho<strong>to</strong>diode. Multiple<br />
scattering can appear at τ < 0.3, which leads <strong>to</strong> an overestimation of small particles (Agrawal &<br />
Pottsmith 2000). A path reduction module (50 %) was installed <strong>to</strong> reduce the optical path length and<br />
thus the sample volume. Checking the overall health of the instrument and in order <strong>to</strong> correct for
Total volume concentration and size distribution of suspended matter 73<br />
optical attenuation by water and microscopic imperfections on the optical surfaces, a background<br />
scattering was acquired in the morning of each measuring day. A full technical description of the<br />
LISST is done by Agrawal and Pottsmith (2000) and Agrawal et al. (2008). The LISST was applied<br />
from a drifting vessel in profiling mode down <strong>to</strong> the near riverbed. Minimum distance between<br />
dredging and research vessel amounted <strong>to</strong> ~30 m.<br />
TVC calibration was done by horizontal water sampling (2.2 litre, Hydro Bios©), at two different<br />
water depth. In the labora<strong>to</strong>ry, an aliquot of defined volume was vacuum-filtered (glass-fibre filters,<br />
1.2 µ). The filters were dried at 60°C for 12 hours. SSC was calculated by dry mass per unit sample<br />
volume.<br />
Measurements were done on 10 June 2008 at site A and on 24 June 2008 at site B under low river<br />
discharge (180 m³/s, Water & Shipping Authority Bremen, pers. comm.) and neap tides. Both sites<br />
were subdivided in 4-5 subsections, representing the type of dredging impact such as maintenance or<br />
constructional work or unaffected subsections (reference), displayed in figure 1. All subsections<br />
exhibited comparable hydrodynamics and sedimen<strong>to</strong>logy. Profile indexes indicate relation of<br />
measuring position <strong>to</strong> WID: a) luv-site, b) lee-site c) on-site.<br />
5 Results<br />
TVC and τ significantly correlate, as found at both sites with R²=0.89 (figure 2). Overall, τ did not<br />
exceed 0.6, more often it decreased below 0.3, as found for 80 % and 15 % of all measurements,<br />
carried out at site A and B, respectively (table 1).<br />
TVC [µl/l]<br />
1,600<br />
1,200<br />
800<br />
400<br />
0 0.2 0.4 0.6 0.8 1<br />
τ<br />
Figure 2: Correlation of optical transmission (τ) and TVC for site A and B<br />
0<br />
A �<br />
Y = exp(-6.60 * X) * 1982.73<br />
R² = 0.89<br />
B �<br />
Y = exp(-9.40 * X) * 5724.86<br />
R² = 0.87<br />
A & B<br />
Y = exp(-6.57 * X) * 2111.62<br />
R² = 0.89<br />
PSD changed within seconds from unimodal curves <strong>to</strong> the ones with rising tails at the coarse end of<br />
the size spectra. Depth-related changes of PSD and VC at site A are displayed in figure 3. Mean<br />
particles sizes range from 2.0 <strong>to</strong> 4.9 Phi (table 1) with a downward particle coarsening of 0.6 Phi on<br />
average as well as a slight increase of VC for size spectra > 8 Phi. A distinct development in mean<br />
particle size between the profiles is not obvious. Several times, water turbidity was announced <strong>to</strong> be<br />
<strong>to</strong>o high before reaching the ground at subsections b and c without specific changes of TVC or particle<br />
sizes, as found by comparing measurements 7b and 8a in figure 3. At site B, mean particle-size range<br />
with 1.9 <strong>to</strong> 3.3 Phi (table 1) was slightly smaller, but again with no depth-related change (figure 4).<br />
Mean particle size only varied among the subsections.<br />
Highest TVC at site A amounted <strong>to</strong> ~1,600 µl/l during slack-water ebb (figure 3: 7c, 8a) and ~470 µl/l<br />
for site B around slack-water flood (figure 4: 1b - 3a, 15a -18c). SSC values ranged from 22 <strong>to</strong> 320<br />
mg/l and 26 <strong>to</strong> 128 mg/l at site A and B, respectively.
74 Papenmeier et al.<br />
Figure 3: Depth-related VC and PSD at site A (brackish water zone). Solid curves represent mean particle size;<br />
dashed lines visualise TVC.<br />
Figure 4: Depth-related VC and PSD at site B (freshwater zone). Solid curves represent mean particle size;<br />
dashed lines visualise TVC.
Total volume concentration and size distribution of suspended matter 75<br />
Table 1: Measured parameter at site A and B.<br />
site A B<br />
Ø size<br />
[Phi]<br />
TVC<br />
[µl/l]<br />
τ<br />
SSC<br />
[mg/l]<br />
Ø size<br />
[Phi]<br />
TVC<br />
[µl/l]<br />
min 2.0 29.9 0.06 22 1.9 103.7 0.2 26<br />
max 4.9 1598.4 0.58 320 3.3 469.4 0.4 128<br />
Ø 2.9 650.2 0.22 113 2.8 239.2 0.3 47<br />
τ < 0.3 80% 15%<br />
6 Discussion and conclusion<br />
τ<br />
SSC<br />
[mg/l]<br />
In the Weser estuary, suspended sediment dynamics are mainly controlled by tides and riverdischarge.<br />
This is clearly reflected in data sets of TVC, PSD and SSC, especially at site A, which was<br />
located in the brackish zone, at the southern end of the TMZ. Whereas no clear indication of WID<br />
impact is given at site B, some dredging induced effects can be derived from data-sets of site A. It is<br />
assumed that WID induces temporary increase of near-bed suspended particles (Meyer-Nehls et al.<br />
2000, Stengel 2006). Based on that, TVC must consequently increase. This might have caused<br />
repeated near-bed interruption of LISST measurements at site A during WID, where background TVC,<br />
SSC and mean particle size are side-specifically higher (brackish zone) as found at site B (freshwater<br />
reach). SSC did not rise simultaneously. This seems <strong>to</strong> be reasonable, taking in<strong>to</strong> account that τ can<br />
also be considerably reduced by only few large particles or air bubbles (Mikkelsen & Pejrup 2000).<br />
Large particle-aggregates can enhance TVC without affecting mass concentration. Indeed, measured<br />
PSD indicated rising tails at the coarse particle-size spectra, repeatedly. Overall, it can be concluded<br />
that WID does not seem <strong>to</strong> have a significant impact on suspended sediment dynamics at the sites<br />
investigated with these methods.<br />
References<br />
Agrawal, Y.C. & H.C. Pottsmith (2000): Instruments for particle size and settling velocity observations in<br />
sediment transport. In: Marine Geology <strong>16</strong>8: 89–114.<br />
Agrawal, Y.C., A. Whitmire, O.A. Mikkelsen & H.C. Pottsmith (2008): Light scattering by random shaped<br />
particles and consequences on measuring suspended sediments by laser diffraction. In: Journal of<br />
Geophysical Research 113: 11.<br />
Aster, D. (1993): Der Einfluss von Wasseinjetionsbaggerung auf die Wassertrübung. In: Hansa 130: 64–65.<br />
Clausner, J.E. (1993): Water injection dredging demonstration on the Upper Mississippi River. U.S. Army Corps<br />
of Engineers, Waterways Eperiment Station. Dredging Research, DRP-93-3.<br />
Grabemann, I. & G. Krause (1989): Transport proccesses of suspended matter derived from time series in a tidal<br />
estuary. In: Journal of Geophysical Research 94: 14373–14379.<br />
Grabemann, I. & G. Krause (2001): On different time scales of suspended matter dynamics in the Weser estuary.<br />
In: Estuaries and Coasts 24: 688–698.<br />
Meyer-Nehls, R., G. Gönnert, H. Christiansen & H. Rahlf (2000): Das Wasserinjektionsverfahren: Ergebnisse<br />
einer Literaturstudie sowie von Untersuchungen im Hamburger Hafen und in der Unterelbe. Ergebnisse aus<br />
dem Baggeruntersuchungsprogramm 8: 111.<br />
Mikkelsen, O.A. & M. Pejrup (2000): In situ particle size spectra and density of particle aggregates in a dredging<br />
plume. In: Marine Geology 170: 443–459.<br />
Nasner, H. (1992): Injektionsbaggerung von Tideriffeln. In: Hansa 129: 195–196.
76 Papenmeier et al.<br />
Schrottke, K., M. Becker, A. Bartholomä, B.W. Flemming & D. Hebbeln (2006): Fluid mud dynamics in the<br />
Weser estuary turbidity zone tracked by high-resolution side-scan sonar and parametric sub-bot<strong>to</strong>m profiler<br />
In: Geo-Marine Letters 26: 185–198.<br />
Schuchardt, B.,U. Haseloop & M. Schirmer (1993): The tidal freshwater reach of the Weser estuary: riverine or<br />
estuarine? In: Netherlands Journal of Aquatic Ecology 27: 215–226.<br />
Spencer, K.L., R.E. Dewhurst & P. Penna (2006): Potential impacts of water injection dredging on water quality<br />
and eco<strong>to</strong>xicity in Limehouse Basin, River Thames, SE England, UK. In: Chemosphere 63: 509–521.<br />
Stengel, T. (2006): Wasserinjektionsbaggerung in der Unterweser: Eine ökologische und ökonomische<br />
Alternative zu Hopper Baggerung. PIANC Deutschland - Schifffahrt, Häfen, Waserstraßen, S. 204–208.<br />
Wellershaus, S. (1981): Turbidity maximum and mud shoaling in the Weser estuary. In: Archiv für<br />
Hydrobiologie 92: <strong>16</strong>1–198.<br />
Woltering, S. (1996): Einsatz eines Wasserinjektionsgerätes zur Hafenunterhaltung. In: Hansa 133: 62–66.<br />
Acknowledgement<br />
This study was funded by the Deutsche Forschungsgemeinschaft in the frame of the Cluster of<br />
Excellence‚The Future Ocean’. It was part of the interdisciplinary project ‘Weser adaptation’,<br />
coordinated by the Water & Shipping Authority (WSA) Bremen and Bremerhaven, <strong>to</strong>gether with other<br />
German partner institutions. Thanks are given <strong>to</strong> the WSA Wilhelmshaven for providing additional<br />
ship capacity and support as well as <strong>to</strong> all partners for the good cooperation.<br />
Address<br />
Svenja Papenmeier<br />
University of Kiel - Institute of Geosciences<br />
Cluster of Excellence: The Future Ocean, Sea-Level Rise & Coastal Erosion<br />
Ot<strong>to</strong>-Hahn-Platz 1<br />
24118 Kiel, Germany<br />
sp@gpi.uni-kiel.de
78 Gönnert & Thumm<br />
(Brechkriterien), so dass große Unsicherheiten auch bei der Vorhersage des Bemessungsseegangs<br />
unvermeidlich sind.<br />
3. Das Fehlen grundlegender Kenntnisse darüber, wie der Sturmflutverlauf und Seegang in einer<br />
bislang von der Natur noch nicht ausgespielten Kombination zu (Sturmflut-) Szenarien<br />
zusammengeführt werden können, bei denen es zu inakzeptablen gesamtwirtschaftlichen Schäden<br />
kommt ("Perfekte Sturmflut").<br />
Das Schließen der o.g. Wissenslücken und die Schaffung der erforderlichen grundlegenden Kenntnisse<br />
und Methoden, die es ermöglichen, wissenschaftlich fundierte Vorhersagemodelle zu entwickeln und<br />
die damit verbundenen Unsicherheiten verlässlich abzuschätzen, werden wahrscheinlich mehr als zehn<br />
Jahre in Anspruch nehmen (Oumeraci 2004).<br />
Seit dem 1. Ok<strong>to</strong>ber 2008 wird daher ein vom Bundesministerium für Bildung und Forschung<br />
(BMBF) finanziertes Verbundprojekt durchgeführt, in dem Wissenschaftler der Universitäten Siegen,<br />
Braunschweig, Hamburg - Harburg sowie des Landesbetriebs für Straßen, Brücken und Gewässer<br />
Hamburg unter der Leitung von Prof. Dr.-Ing. Hocine Oumeraci des Leichtweiß-Instituts für<br />
Wasserbau der TU Braunschweig das Auftreten und die Auswirkungen extremer Sturmfluten<br />
analysieren.<br />
Aufgrund der hohen Variabilität der Einflussparameter, der S<strong>to</strong>chastik der verschiedenen Prozesse und<br />
deren Wechselwirkungen sowie der o.g. Modell-Unsicherheiten werden neben den<br />
Unsicherheitsanalysen (z.B. Monte-Carlo-Simulation, Latin-Hypercube-Sampling) auch systematische<br />
Sensitivitätsanalysen für die Untersuchung der relativen Bedeutung der Einflussparameter sowie der<br />
praktischen Implikationen für die abzuleitenden Handlungsempfehlungen durchgeführt.<br />
Sturmflut<br />
Meer (Sturmflut)<br />
Deichbrüche<br />
Überflutung<br />
Landwirtschaft<br />
Ästuar (Sturmflut + Oberwasserzufluß)<br />
Überflutungsrisiko R = P f ·E(D)<br />
f ·E(D)<br />
Hochwasserschutzwerk<br />
Überflutung<br />
Überflutung<br />
Industr. Infrastruktur<br />
Überflutung<br />
Flutgefährdetes Gebiet<br />
Source Pathway Recep<strong>to</strong>r<br />
Abb. 1: “Source-Pathway-Recep<strong>to</strong>r” Konzept (Oumerci 2009)<br />
Städtische<br />
Infrastruktur<br />
Überflutung
80 Gönnert & Thumm<br />
kann der erhöhte Wasserstand durch die Überlagerung von Fernwellen und Windstau aus starken<br />
jedoch nicht stürmischen Winden zustandekommen. Um für die kontinuierliche Fortschreibung des<br />
Kollektivs die Auswahl der Ereignisse mit geringem Datenaufwand digital zu ermöglichen, wurde<br />
überprüft, mittels welcher Grenzwerte bezogen auf die statistischen Scheitelwerten MThw und MTnw<br />
diese physikalisch definierten Ereignisse gefiltert werden können. Die Definition für Sturmfluten am<br />
Pegel Cuxhaven ergibt sich nach diesen Auswertungen zu:<br />
Am Pegel Cuxhaven liegt eine Sturmflut vor, wenn der Wasserstand die Grenzwerte 150 cm<br />
über dem MThw oder 190 cm über dem MTnw überschreitet.<br />
Das physikalisch-phänomenologisch hergeleitete Kriterium, dass der Wasserstand 150 cm über dem<br />
MThw eintreten muß, deckt sich mit den zuvor erläuterten Definitionen des BSHs, der DIN 4049 und<br />
von Gönnert (2003). Das Verhältnis der beiden ermittelten Überschreitungsgrenzen 150 cm / 190 cm,<br />
welche dem Windstau zum entsprechenden Zeitpunkt entsprechen, beträgt 79 %. Die<br />
Länderarbeitsgruppe (1988) ermittelte durch Abgleich der eingetretenen Windstauhöhen ein mittleres<br />
Verhältnis des Windstaus von MThw zu MTnw von 73 %. Somit wird dieses Verhältnis bestätigt.<br />
Über die hier hergeleitete Definition treten nach wie vor rund 70 % der Ereignisse zusammen mit<br />
Stürmen auf. In den anschließenden Analysen werden die verbleibenden 30 % der Ereignisse mit<br />
betrachtet, da bei der Ermittlung der Extremereignisse jegliche wasserstandserhöhenden Fak<strong>to</strong>ren<br />
untersucht werden müssen. Zudem wird an dieser Stelle explizit darauf hingewiesen, dass, obwohl die<br />
Definition scheitelwertbasiert ist, im Folgenden die gesamte Windstaukurve analysiert wird, da eine<br />
Sturmflut nicht nur über ihren Scheitelwasserstand sondern auch über ihre gesamten Kurvenform<br />
charakterisiert werden muss.<br />
3 Sturmflutkomponenten<br />
Aus der Betrachtung der Sturmflutdefinitionen geht hervor, dass der Scheitelwasserstand einer<br />
Sturmflut nicht nur meteorologisch bedingt ist. Vielmehr setzt er sich aus den Komponenten<br />
vorausberechnete astronomische Tide, Fernwelle, Windstau und Seegang zusammmen (Abb. 2).<br />
Abb. 2: Komponenten einer Sturmflut
Das Risiko von Extremsturmfluten in Ästuaren angesichts globalen Klimawandels 81<br />
Bei der Untersuchung von Sturmfluten liegt der vorhergesagte Wasserstand zugrunde. Dieser kann,<br />
muss aber nicht durch eine Fernwelle aus dem Atlantik überlagert werden. Durch ein Sturmtief über<br />
der Deutschen Bucht werden die Wassermassen an die Küste gedrängt. Aufgrund der behinderten<br />
Strömung staut sich das Wasser auf. Diese Wasserstandserhöhung über den vorhergesagten<br />
Wasserstand hinaus wird Windstau genannt. Der erhöhte Wasserstand wird am Betrachtungsort von<br />
dem durch lokale Winde erzeugten Seegang überlagert.<br />
3.1 Astronomische Tidekurve<br />
Die astronomische Tidekurve gibt die periodische Schwingung des Meeres wieder, die verursacht wird<br />
durch das Zusammenwirken von Schwer- und Fliehkräften, die bei der Bewegung des Mondes um die<br />
Erde und der Erde um die Sonne entstehen. Bei Neu- und bei Vollmond verstärken sich die Gezeiten<br />
bedingt durch die Überlagerung der Gezeitenkräfte von Mond und Sonne zur Springtide. Bei<br />
Halbmond werden die Gezeitenkräfte des Mondes zum Teil von der Sonne aufgehoben, es entsteht die<br />
flachere Kurve der Nipptide.<br />
Die mittlere Tidekurve ist die Ganglinie der arithmetisch gemittelten, einander zur Tidephase<br />
entsprechenden Wasserstände mehrerer Tidekurven für einen bestimmten Ort über eine bestimmte<br />
Zeitspanne (DIN 4049-3 1994), zumeist der letzten fünf Jahre. Dabei werden Tidekurven<br />
unterschiedlicher Mondphasen gemittelt, so dass die Differenzen von Spring- und Nipptide nicht mehr<br />
erkennbar sind.<br />
Bisher wurde für Untersuchungen zu Sturmfluten am Pegel Cuxhaven die mittlere Tidekurve<br />
verwendet. Diese Auswahl wurde aus rein pragmatischen Gründen getroffen: Die mittlere Tidekurve<br />
ist eine mit relativ geringem Rechenaufwand erzeugbare statistische Größe (Siefert 1968). Daneben<br />
bilden die mittleren Verhältnisse gut die mittlere physikalische Wechselwirkung Sturmflut – Tide ab,<br />
so dass sie einen guten Anhaltswert über die Stauentwicklung im jeweiligen Gebiet geben. (Siefert<br />
1992)<br />
Die astronomische Tidekurve für jeden beliebigen Tag zu berechnen stellte in der Vergangenheit eine<br />
große Herausforderung an mathematischem Können und Zeitaufwand dar. Inzwischen stehen<br />
Programme zur Verfügung, mit denen die Berechnung der astronomischen Tidekurve mit<br />
vergleichbarem Aufwand durchgeführt werden kann. Auf diese Wiese wird es möglich, den<br />
astronomischen Einfluss von der Windwirkung formal zu trennen. Zudem erlaubt es empirische<br />
Untersuchungen zur Wechselwirkung zwischen Tide und Sturmflut. Somit besteht nun die<br />
Möglichkeit die auf Basis der mittleren Tidekurve ermittelten Anhaltswerte zum Charakter von<br />
Sturmfluten hinsichtlich der physikalischen Wechselwirkungen detaillierter zu untersuchen.<br />
Zur Berechnung der astronomischen Tidekurve gibt es zwei verschiedene Verfahren, die harmonische<br />
Synthese der Gezeiten und das nonharmonische Verfahren. Diese beiden Verfahren unterscheiden sich<br />
im Wesentlichen durch ihre räumlichen Anwendungsbereiche. Mittels der harmonischen Synthese<br />
kann der gesamte Verlauf der astronomischen Tidekurve berechnet werden. Dies ist jedoch nur für<br />
tiefes Wasser möglich, da die Flachwassereffekte nicht berücksichtigt werden können (Müller-Navarra<br />
2008). Astronomische Kenngrößen, die diese Effekte beinhalten, können mit dem nonharmonischen<br />
Verfahren berechnet werden. Es können allerdings lediglich die Höhe und die Eintrittszeit der<br />
astronomischen Hoch- und Niedrigwasser bestimmt werden.<br />
Harmonische Synthese der Gezeiten<br />
Die sichtbare Gezeitenbewegung setzt sich im Detail aus vielen einzelnen Tidekurven zusammen.<br />
Diese einzelnen Komponenten werden Partialtiden genannt. Dabei ist eine Partialtide „nichts weiteres,<br />
als eine Sinusfunktion, die über Frequenz f, Amplitude A und Phase ϕ beschrieben werden kann“<br />
(Kastens 2007). Die Frequenzen f der Partialtiden sind aus der Lehre von den Bewegungen des<br />
Mondes und der Sonne bekannt und für jeden Ort gleich. Die Amplitude und die Phase hingegen sind<br />
ortsabhängig und können aus Zeitreihen der Wasserstände mittels der Harmonischen Analyse
82 Gönnert & Thumm<br />
abgeleitet werden. Die Harmonische Analyse der Gezeiten ist eine spezielle Form der<br />
Fourierzerlegung einer Zeitreihe (BAW 2008) und beruht auf der Zerlegung der Gezeiten in ihre<br />
streng periodischen harmonischen Partialtiden (BSH 2008).<br />
Sind die Amplituden und Phasen der einzelnen Partialtiden an einem Ort bekannt, kann mittels der<br />
Harmonischen Synthese, d.h. Summation aller Partialtiden, eine Vorhersage des Wasserstandes für<br />
einen vorgegeben Zeitraum erfolgen (BAW 2008).<br />
Nonharmonisches Verfahren<br />
Mit dem Nonharmonischen Verfahren können für Orte mit halbtägiger Gezeit die Eintrittszeiten und<br />
Höhen der Hoch- und Niedrigwasser vorausberechnet werden. Hierbei werden die<br />
Meridiandurchgangszeiten des Mondes mit den mittleren Hoch- und Niedrigwasser-Intervallen sowie<br />
den Ungleichheiten in Höhe und Zeit verrechnet. Gegebenfalls können Verbesserungen zur<br />
Berücksichtigung von lokalen Besonderheiten mit einbezogen werden (BSH 2008).<br />
Zur Abschätzung von Höhen und Zeiten zwischen den nonharmonisch ermittelten Hoch- und<br />
Niedrigwassern wird zu Zwecken der Schifffahrt vom BSH zum einen eine graphische und zum<br />
anderen eine rechnerische Einspannung der mittleren Spring- und Nipptidekurven zwischen dem<br />
Hoch- und Niedrigwasser empfohlen. Verfahrensbedingt können diese Werte bis zu 10 cm<br />
voneinander abweichen (BSH 2008).<br />
Verknüpfung der Verfahren<br />
Für die wissenschaftliche Analyse von Sturmflutereignissen ist eine Ungenauigkeit von 10 cm zu<br />
hoch, so dass für die hier dargestellten Ergebnisse das harmonische mit dem nonharmonischen<br />
Verfahren mathematisch verknüpft wird. Diese Verknüpfung erfolgt dadurch, dass die harmonisch<br />
berechnete astronomische Tidekurve zwischen die nonharmonisch ermittelten Hoch- und<br />
Niedrigwasserwerte linear eingehängt wird. Hierdurch erhalten sowohl die zum jeweiligen Zeitpunkt<br />
wirkenden gezeitenverursachenden Kräfte sowie die lokalen Reibungs- und Reflektionsanteile<br />
Berücksichtigung (Thumm & Gönnert 2009).<br />
3.2 Fernwelle<br />
Fernwellen entstehen durch Änderungen des Luftdrucks, die bei schnell ziehenden Tiefdruckgebieten<br />
über dem nördlichen Atlantik in Form von stark ausgeprägten Luftdruckgradienten auftreten. Dies<br />
führt zu einer Veränderung des Wasserspiegels in Form einer sowohl an der Oberfläche sichtbaren<br />
Welle, als auch einer internen Welle im Wasserkörper. Unabhängig zur Tidephase und ohne<br />
periodische Regelmäßigkeit laufen diese Wellen, ähnlich einer Tidewelle und in Abhängigkeit der<br />
Zugbahnen der Tiefdruckgebiete in die Nordsee ein (Gönnert 2003).<br />
Das die Fernwelle auslösende Tief und das sturmflutverursachende Tief können ein und dasselbe Tief<br />
jedoch auch zwei meteorologisch von einander unabhängige Ereignisse sein. Das bedeutet, dass<br />
Fernwellen und Sturmfluten getrennt von einander aber auch zeitgleich auftreten können.<br />
Anhand von Analysen von Aufzeichnungen des BSHs aus 20 Beobachtungsjahren (1971-1995, nicht<br />
1974-1978) wurden 15 Fernwellen mit einer Höhe von 60 cm und mehr ermittelt. Die höchste<br />
Fernwelle erreichte ein Maximum von 109 cm. Jede fünfte bis sechste Sturmflut tritt zeitgleich mit<br />
einer Fernwelle größer 60 cm ein. Sie erreichen in Cuxhaven in etwa die Höhe der in Aberdeen<br />
einlaufenden Fernwellenhöhen mit Schwankungen von etwa +/- 20 % (Gönnert 2003).<br />
3.3 Windstau<br />
Für die Ermittlung extremer Sturmfluten ist es wichtig zu verstehen, wie sich eine Sturmflut zeitlich<br />
entwickelt. Dieses ist nur bedingt über den Scheitelwasserstand zu erfassen, da in diesem der<br />
windinduzierte Wasserstand von der zugrunde liegenden Tide überdeckt wird. Von Interesse ist also
Das Risiko von Extremsturmfluten in Ästuaren angesichts globalen Klimawandels 83<br />
die Betrachtung des Windstaus, der die Differenz zwischen dem eingetretenen und dem<br />
vorausberechneten Wasserstand ist. Er spiegelt den zeitlichen Verlauf und die Höhe der in den<br />
Wasserkörper eingetragenen Energie und somit den physikalischen Wert einer Sturmflut wieder. Der<br />
Windstau am Pegel Cuxhaven wird maßgeblich durch die Windverhältnisse in der Deutschen Bucht<br />
geprägt. Desweiteren enthält er Einflüsse aus dem statischen Luftdruck, Änderungen des Luftdrucks,<br />
Wassertempereatur und Temperaturdifferenz Luft-Wasser. (Siefert 1968, Gönnert 2003)<br />
Für die Charakterisierung einer Sturmflut sind drei Merkmale der Windstaukurve von Interesse: Die<br />
Höhe des Windstaumaximums, dessen Lage zur Tidephase und der Windstauverlauf. Durch die Höhe<br />
eines Windstaumaximums kann der Energieeintrag des Windes erfasst werden, durch die Eintrittszeit<br />
des Windstaumaximums und die Kurvenform die Auswirkungen auf den absoluten Wasserstand.<br />
(Gönnert 2003)<br />
Bei bisherigen Untersuchungen für den Pegel Cuxhaven basiert die Windstauberechnung auf der<br />
mittleren Tidekurve. Diese Untersuchungen umfassen ein Kollektiv, das alle Sturmfluten seit 1901<br />
beinhaltet, die 200 cm Windstau und einen Scheitelwasserstand größer MThw + 150 cm erreichten.<br />
Bis 2008 umfasst das Kollekitiv 259 Sturmflutscheitel. Sie bilden die Grundlage für die Bemessung<br />
des Hochwasserschutzes entlang der Elbe.<br />
Das diesem Projekt zugrunde liegende Kollektiv wird auf Basis der astronomischen Tidekurve<br />
berechnet, da es erklärtes Ziel des Projektes ist, nicht nur die Sturmflutkurve, die alle Einflüsse auf<br />
den Wasserstand umfasst, sondern auch die Einzelkomponenten und deren Wechselwirkungen<br />
physikalisch zu untersuchen.<br />
Werden Untersuchungen, die die Grundlage für den Schutz eines großen Lebensraumes sind, auf<br />
veränderter Basis erstellt, muss eine Gegenüberstellung der Ergebnisse erfolgen, so dass erkennbar<br />
wird, inwieweit sich maßgebende Grenzwerte bzw. Schlüsselereignisse verändert darstellen.<br />
Zum Erlangen eines ersten Überblickes über die Unterschiede zwischen den auf verschiedenen<br />
Tidekurven basierenden Windstaukurven wurden die Windstaumaxima der erfassten Sturmfluten mit<br />
einander verglichen. Es wurden für jede Sturmflut die Windstaukurve basierend auf der<br />
astronomischen und der mittleren Tidekurve berechnet und jeweils die Höhe und die Eintrittszeit des<br />
Windstaumaximums erfasst. Des Weiteren wurden die Höhenabweichungen der Windstaumaxima und<br />
die Unterschiede ihrer Eintrittszeiten ermittelt.<br />
Im Durchschnitt liegt das Maximum der Windstaukurve basierend auf der astronomischen Tidekurve<br />
6,5 cm niedriger als das Maximum der Windstaukurve basierend auf der mittleren Tidekurve. Die<br />
Abweichungen liegen insgesamt zwischen -59 cm und +51 cm. Die Hälfte der Windstaumaxima<br />
weisen eine Differenz von ±15 cm auf. Die maximalen Abweichungen treten zum einen bei<br />
Sturmfluten auf, bei denen die Windstaumaxima zeitnah zu den vorausberechneten Hoch- und<br />
Niedrigwasserzeiten eintreten, so dass die am Pegel Cuxhaven durch Spring- und Nipptide bedingten<br />
Unterschiede in den Tidekurven in den Windstaumaxima wiederzuerkennen sind. Zum anderen<br />
ergeben sich die maximalen Abweichungen im Bereich der Tideäste, da die astronomische Tidekurve<br />
bedingt durch die täglichen Ungleichheiten auch in diesen Bereichen von der mittleren Tidekurve<br />
abweicht.<br />
Die zeitliche Differenz zwischen den Eintrittszeiten der Windstaumaxima beträgt zu 90 %<br />
±90 Minuten. Bei Windstaukurven mit langen Scheitelbereichen kann ein großer zeitlicher Versatz der<br />
Windstaumaxima von bis zu 3 Tidezyklen entstehen. Detaillierte Betrachtungen zeigen jedoch, dass es<br />
sich hier um in der Höhe variierende Spitzen der Scheitelbereiche handelt, die auch jeweils in der<br />
anderen Windstaukurve zu erkennen sind. Es handelt sich nicht um neu ausgeprägte<br />
Windstauscheitelbereiche.<br />
Die beiden Sturmfluten, die bei Berücksichtigung der mittleren Tidekurve den höchsten Windstau um<br />
Tnw bzw. Thw aufwiesen, wurden aufgrund der neuen Untersuchungen nicht von anderen Ereignissen<br />
abgelöst. Das Windstaumaximum lag jedoch in beide Fällen höher als die bisher bekannten Werte, so
84 Gönnert & Thumm<br />
dass die für den derzeitigen Bemessungswasserstand relevante Windstauhöhe von 385 cm auf 400 cm<br />
angehoben werden müsste.<br />
Ergänzende statistische Analysen der beiden so entstandenen Kollektive haben gezeigt, dass sich die<br />
statistischen Verteilungsfunktionen über die Jährlichkeit nicht wesentlich voneinander unterscheiden.<br />
Dieses Ergebnis ist plausibel, da es erklärtes Ziel der Statistik ist, die mittleren Abweichungen<br />
auszugleichen, dies bedeutet, dass auch die Statitisik auf Basis der astronomischen Tidekurve<br />
Auskunft über die mittleren Verhältnisse gibt. (Mudersbach & Jensen 2009)<br />
Analysen von Gönnert (2003) haben ergeben, dass die Höhe des Windstaumaximums von der<br />
Anstiegsneigung der Windstaukurve abhängt. So können z.B. am Pegel Cuxhaven extrem hohe<br />
Windstaumaxima (> 390 cm) nur bei sehr steilem Windstauanstieg entstehen, am Pegel Helgoland<br />
sind hierfür flache, langsame Antiege nötig. Desweiteren ist bekannt, dass der maßgebende Einfluss<br />
auf die Form der Windstaukurve bei einer gewissen Windgeschwindigkeit von der Tidekurve auf den<br />
Wind übergeht (Bremer & Gönnert 2009). Zudem hat ein Vergleich der Windstaukurven auf Basis der<br />
astronomischen und der mittleren Tidekurve ergeben, dass die astronomisch basierte Windstaukurve<br />
die Windverhältnisse wesentlich besser wiederspiegelt (Abb. 3) (Gerkensmeier 2009).<br />
Diese Ergebnisse zeigen, dass es relevante Unterschiede in der Kurvenform gibt. Diese Unterschiede<br />
liefern plausible Indizien dafür, dass die Betrachtung eines Sturmflutereignisses basierend auf der<br />
astronomischen Tidekurve physikalisch exakter ist.<br />
Abb. 3: Vergleich des Windstaus auf Basis der astronomischen und mittleren Tidekurve am Beispiel der<br />
Sturmflut vom 02.11.1965 (Gerkensmeier 2009)<br />
3.4 Seegang<br />
Der Seegang wird vom lokalen Wind verursacht. Da die vorliegenden Untersuchungen am Pegel<br />
Cuxhaven die Grundlage für die Sturmfluten im 130 km elbaufwärts liegenden Hamburg sind, werden<br />
diese lokalen Effekte momentan nicht mit untersucht. Für die letztendlichen Untersuchungen der<br />
extremen Sturmfluten in Hamburg werden die dortigen Seegangsbedingungen miteinbezogen.
86 Gönnert & Thumm<br />
Bremer, J.-A. & G. Gönnert (2009): Das Zusammenwirken von Tide und Sturmflut im Ästuar. In: Vött, A. & H.<br />
Brückner (Hrsg.): Beiträge zur 26. Jahrestagung des Arbeitskreises „Geographie der Meere und <strong>Küsten</strong>“,<br />
Marburger Geographische Schriften (MGS), Band 145, Marburg.<br />
Dick, S. (2000):Die Sturmflut am 03. Dezember 1999, Fallstudien mit dem Windstaumodell des BSH, Vortrag<br />
BAW-Kolloqium November 2000, Hamburg.<br />
DIN 4049-3 (1994): Deutsche Norm: Hydrologie. Teil 3: Begriffe zur quantitativen Hydrologie.<br />
Gerkensmeier, B. (2009): Zur Interaktion von Tide und Windstau bei Starkwindlagen – Eine erste<br />
Grundlagenanalyse über Windstauvergleiche. Universität Bremen, Bachelorarbeit (unveröffentlicht).<br />
Gönnert, G. (2003): Sturmfluten und Windstau in der Deutschen Bucht. In: Die Küste 67: 185–365.<br />
IPCC (2007): Climate change (2007): The physical science basis - Summary for policymakers. Intergovermental<br />
Panel on Climate Change (IPCC), Genf, Schweiz, 21 p.<br />
Kastens, M. (2007): Gutachten Tidewasserstandsanalysen in Ästuaren am Beispiel der Unter- und Außenelbe.<br />
Bundesanstalt für Wasserbau, Hamburg, 72 S.<br />
Länder-Arbeitsgruppe (1988): Bemessungswasserstände entlang der Elbe. In: Die Küste 47: 31–50.<br />
Mayerle, R., G. Bruss & R. Osinski (2009): Zwischenbericht zur Untersuchung „Sturmflutsituationen Nordsee“<br />
(unveröffentlicht).<br />
Mudersbach, C. & J. Jensen (2009): Statistische Analysen zum Windstau am Pegel Cuxhaven, Universität<br />
Siegen (unveröffentlicht).<br />
Müller-Navarra (2008): Sturmfluten und Verfahren zur Berechnung der astronomischen Tidekurve (mündliche<br />
Auskunft).<br />
Oumeraci, H. (2004): Sustainable coastal flood defences: scientific and modelling challenges <strong>to</strong>wards an<br />
integrated risk-based design concept. Keynote lecture, Proceedings First IMA International Conference on<br />
Flood Risk Assessment, Session 1, Institute of Mathematics and its Applications, Bath, UK, pp. 9–24.<br />
Oumeraci, H. (2009): Vortrag beim XtremRisk-Workshop März 2009, Hamburg.<br />
Siefert, W. (1968): Sturmflutvorhersagen für den Tidebereich der Elbe aus dem Verlauf der Windstaukurven in<br />
Cuxhaven. In: Mitteilungen des Franzius-Institutes für Grund- und Wasserbau der TU Hannover 30: 1–142.<br />
Siefert, W. (1992): Zur Windstauentwicklung in der südöstlichen Nordsee. In: Die Küste 53: 1–28.<br />
Thumm, S. & G. Gönnert (2009): Windstauanalyse: Vergleich der Windstaumaxima basierend auf der<br />
astronomischen und der mittleren Tidekurve am Pegel Cuxhaven. Freie und Hansestadt Hamburg,<br />
Landesbetrieb Straßen, Brücken und Gewässer (unveröffentlicht).<br />
Addresse<br />
Dr. habil. Gabriele Gönnert<br />
Landesbetrieb Strassen, Brücken und Gewässer<br />
Sachsenkamp 1-3<br />
20007 Hamburg, Germany<br />
gabriele.goennert@lsbg.hamburg.de
Abstracct<br />
GGIS-gestüützte<br />
Anallyse<br />
des ÜÜberflutun<br />
ngsrisikoss<br />
in Hambburg<br />
unte er<br />
BBerücksichtigung<br />
dder<br />
EG-H Hochwasseerrichtliniie<br />
Thhe<br />
“Directive of the Euroopean<br />
Parliamment<br />
and of the Council of 23 Oc<strong>to</strong>bber<br />
2007 on the<br />
asssessment<br />
and management of flood riskss”<br />
contitutes st tandardized annd<br />
coordinateed<br />
action in flo ood<br />
rissk<br />
managemennt.<br />
It intends beside a preliminary<br />
flood<br />
risk assessmment<br />
the prodduction<br />
of flo ood<br />
hazard<br />
maps annd<br />
flood risk maps for extrreme<br />
event sc cenarios and eevents<br />
of meddium<br />
likelihood.<br />
Fuurthermore<br />
it ddemands<br />
the eestablishing<br />
off<br />
flood risk ma anagement plaans.<br />
In this study ann<br />
analysis of f the s<strong>to</strong>rm suurge<br />
risk – co onsisting of hhazard<br />
analyssis,<br />
vulnerabil lity<br />
analysis<br />
and rissk<br />
assessmennt<br />
– is carriedd<br />
out for Ha amburg in resspect<br />
of the DDirective<br />
of the<br />
Euuropean<br />
Commmunity.<br />
Thhe<br />
damage pottential<br />
evaluattion<br />
is based oon<br />
the digital cadastral c mapp<br />
and official sstatistics.<br />
A GIS- G<br />
based<br />
inundationn<br />
model is useed<br />
for the simmulation<br />
of s<strong>to</strong> orm surge evennts<br />
and possibble<br />
burstings of o a<br />
dikke<br />
in Hamburgg.<br />
Thhe<br />
procedure’ss<br />
suitability foor<br />
the implemmentation<br />
of th he Directive is<br />
examined inn<br />
regard <strong>to</strong> flo ood<br />
rissk<br />
managemennt<br />
plans. Moreeover<br />
drafts have<br />
been prep pared for hazaard<br />
and risk mmaps<br />
according g <strong>to</strong><br />
thee<br />
Directive.<br />
1 Einnleitung<br />
Schwarzerr,<br />
Schrottke & Stattegger (eeds.):<br />
<strong>From</strong> Brazzil<br />
<strong>to</strong> <strong>Thailand</strong> – New Resultts<br />
in Coastal Research R<br />
<strong>Coastline</strong>e<br />
<strong>Reports</strong> <strong>16</strong> ( (<strong>2010</strong>), ISSN 00928-2734,<br />
IS SBN 978-3-9811839-9-3<br />
S. 87-96<br />
KKristina<br />
Sosssidi<br />
1 , Gabriiele<br />
Gönner rt 2 & Dieter Ackermann<br />
1<br />
Univers<br />
2<br />
Landesbetrie<br />
sität Hamburgg,<br />
Fachbereich h Geographie, Germany<br />
eb Straßen, Brrücken<br />
und Ge ewässer Hambburg,<br />
Germanyy<br />
Die EG--Richtlinie<br />
2007/60/EG<br />
vvom<br />
23. Okt<strong>to</strong>ber<br />
2007 über ü die Bewwertung<br />
und ddas<br />
Managem ment von<br />
Hochwaasserrisiken<br />
legt ein EUU-weit<br />
einheeitliches<br />
un nd koordinieertes<br />
Vorgehhen<br />
im Ber reich des<br />
Hochwaasserrisikomaanagements<br />
fest. Die Riichtlinie<br />
ist in drei aufeinander<br />
aufbbauende<br />
Teilbereiche<br />
unterglieedert.<br />
Sie sieeht<br />
neben einner<br />
vorläufiggen<br />
Bewertu ung des Hochhwasserrisikoos<br />
bis Ende 2011 die<br />
Erstellunng<br />
von Hocchwassergefaahren-<br />
und Hochwasser rrisikokartenn<br />
bis Ende 2013 vor, in i denen<br />
Ereignisse<br />
mit mitttlerer<br />
Wahrsscheinlichkeit<br />
und Extr remereignissee<br />
berücksichhtigt<br />
werden n sollen.<br />
Darauf aufbauend soll bis Ennde<br />
2015 ddie<br />
Erstellun ng von Hocchwasserrisikkomanageme<br />
entplänen<br />
erfolgenn.<br />
Da die RRichtlinie<br />
zwwar<br />
die einzzelnen<br />
Schriitte<br />
des Risi ikomanagemments<br />
vorgibtt,<br />
inhaltlich aber nur<br />
minimale<br />
Festlegunggen<br />
trifft, wwird<br />
über diee<br />
Möglichke eiten zur Ummsetzung<br />
derr<br />
Richtlinie und eine<br />
Festleguung<br />
von einheeitlichen<br />
Vorrgehensweisen<br />
viel disku utiert.<br />
Unter deem<br />
Begriff „ „Hochwasseer“<br />
ist laut dder<br />
Richtlinie<br />
die „zeitliich<br />
beschrännkte<br />
Überflutung<br />
von<br />
Land, daas<br />
normalerwweise<br />
nicht mit Wasserr<br />
bedeckt ist t“ zu verstehhen<br />
(Artikell<br />
2 Absatz 1). Diese<br />
Überfluttung<br />
kann sowohl durrch<br />
Flüsse oder Gebirg gsbäche als auch durcch<br />
in Küste engebiete<br />
eindringendes<br />
Meerwwasser<br />
hervoorgerufen<br />
weerden.<br />
Das Hochwasserr<br />
H risiko wird iin<br />
Artikel 2 Absatz 2<br />
der Richhtlinie<br />
als „KKombination<br />
der Wahrschheinlichkeit<br />
des d Eintritts eines Hochwwasserereign<br />
nisses und<br />
der hochhwasserbediingten<br />
potennziellen<br />
nachhteiligen<br />
Fo olgen auf diie<br />
menschliche<br />
Gesund dheit, die<br />
Umwelt, , das Kultureerbe<br />
und wirttschaftliche<br />
TTätigkeiten“<br />
definiert.<br />
n 2
88 Sossidi et al.<br />
Die durchgeführte Analyse soll einen Beitrag zu dieser Diskussion leisten, indem sie am Beispiel<br />
Hamburgs untersucht, wie die Vorgaben der Richtlinie umgesetzt werden könnten. Dabei liegt der<br />
Fokus auf dem Sturmflutrisiko.<br />
Der Schwerpunkt der Untersuchung liegt auf der Entwicklung einer GIS-gestützten Methodik zur<br />
Abschätzung der Schäden in verschiedenen Sturmflutszenarien, die auch als Grundlage für die<br />
Maßnahmenplanung im Risikomanagement herangezogen werden kann. Diese soll möglichst genau<br />
und dabei schnell durchführbar und aktualisierbar sein. Ein weiteres Ziel ist die Entwicklung eines<br />
möglichen Vorgehens zur Erstellung von Gefahren- und Risikokarten. Dafür wird auf die im<br />
Landesbetrieb Straßen, Brücken und Gewässer (LSBG) der Stadt Hamburg zur Verfügung stehenden<br />
Daten und Programme zurückgegriffen und deren Eignung für die Umsetzung der Richtlinie<br />
untersucht.<br />
2 Untersuchungsgebiete<br />
Um im Rahmen dieser Untersuchung möglichst unterschiedlich strukturierte Gebiete berücksichtigen<br />
zu können, wurden als Untersuchungsgebiete zum einen der dicht bebaute Stadtteil Veddel und zum<br />
anderen das vergleichsweise ländlich geprägte Überschwemmungsgebiet der Dove-Elbe ausgewählt.<br />
Abb. 1 zeigt die Lage der beiden Untersuchungsgebiete (schwarz umrandete Flächen) innerhalb der<br />
tief liegenden Gebiete (hellgraue Fläche).<br />
Abb. 1: Lage der Untersuchungsgebiete in Hamburg (Datenquelle: LSBG)<br />
Der Stadtteil Veddel hat eine Fläche von 4,37 km 2 . Er liegt östlich des Hamburger Hafens und umfasst<br />
die Insel Peute, den östlichen Teil der Insel Veddel sowie einen schmalen Streifen im Norden der Insel<br />
Wilhelmsburg. Im Westen des Stadtteils Veddel befindet sich ein vollständig eingedeichtes<br />
Wohngebiet, das an seinem westlichen Rand durch den S-Bahn-Damm begrenzt wird. Die Au<strong>to</strong>bahn<br />
255 trennt das Wohngebiet vom Industrie- und Gewerbegebiet auf der Peute im Osten der Veddel.<br />
Das Überschwemmungsgebiet der Dove-Elbe ist 5,31 km 2 groß und wird durch Deiche begrenzt. Im<br />
Westen ist es durch die Tatenberger Schleuse von der Elbe abgetrennt. Das Überschwemmungsgebiet<br />
der Dove-Elbe liegt in den Vier- und Marschlanden, die für den Blumen- und Gemüseanbau bekannt<br />
sind. Im Nordwesten des Gebietes befindet sich ein Wohngebiet; an mehreren Stellen im östlichen
GIS-gestütze Analyse des Überflutungsrisikos in Hamburg 89<br />
Teil des Untersuchungsgebiets wird Erdöl gefördert. Der landschaftliche Charakter des Gebietes wird<br />
allerdings durch Weide-, Acker- und sonstige Grünflächen geprägt.<br />
3 Methodik<br />
Die in der EG-Hochwasserrisikomanagementrichtlinie festgelegte Definition des Risikos als Produkt<br />
aus Eintrittswahrscheinlichkeit und potentiellen Schäden entspricht dem Risikobegriff, wie er in der<br />
naturwissenschaftlich-technischen Risikoanalyse verwendet wird. Daher erfolgte die Untersuchung<br />
des Sturmflutrisikos in Hamburg nach dem grundsätzlichen Vorgehen der Risikoanalyse, die aus den<br />
Teilschritten Vulnerabilitätsanalyse, Gefährdungsanalyse und Risikoabschätzung besteht.<br />
Im Folgenden werden das Vorgehen zur Wertermittlung, die im Rahmen der Vulnerabilitätsanalyse<br />
durchgeführt wurde, und die in der Gefährdungsanalyse betrachteten Sturmflut-Szenarien vorgestellt.<br />
Durch die Zusammenführung der Ergebnisse aus der Vulnerabilitäts- und der Gefährdungsanalyse im<br />
GIS kann das Sturmflutrisiko abgeschätzt werden. Die Ergebnisse der Risikoabschätzung werden<br />
dargestellt, bevor abschließend geschildert wird, welcher weitere Forschungsbedarf sich aus den<br />
Teilschritten der Risikoanalyse ergibt und inwieweit sich das Verfahren als Grundlage zur Umsetzung<br />
der Richtlinie eignet.<br />
4 Wertermittlung<br />
Für die Ermittlung des Schadenspotentials in den Untersuchungsgebieten wird eine Wertermittlung<br />
vorgenommen. Sie ist Teil der im Rahmen der Risikoanalyse durchgeführten Vulnerabilitätsanalyse,<br />
mit deren Hilfe die in den zu untersuchenden Szenarien voraussichtlich betroffenen Menschen und<br />
Werte identifiziert werden können.<br />
Die im Rahmen der Wertermittlung betrachteten Schadenskategorien sind in Tabelle 1 aufgeführt.<br />
Einwohner und Arbeitsplätze wurden quantitativ, die übrigen Kategorien monetär erfasst (Sossidi<br />
2009). Der Schwerpunkt der Untersuchung liegt auf den direkten tangiblen Werten.<br />
Tab. 1: Untersuchte Schadenskategorien<br />
Schadenskategorie Datenquelle Bezugsjahr Verortung<br />
Einwohner Amtliche Statistik 2006 Gebäude (Wohnnutzung)<br />
Arbeitsplätze Amtliche Statistik 2006<br />
Gebäude<br />
Standardisierte Methodik zur<br />
Gebäudewertermittlung (Reese 2003),<br />
modifiziert<br />
2006 Gebäude<br />
Gebäude (wirtschaftliche<br />
Nutzung)<br />
Hausrat Versicherungen 2008 Gebäude (Wohnnutzung)<br />
Kfz Amtliche Statistik, DAT-Report 2007 Gebäude (Wohnnutzung)<br />
Verkehrsflächen Expertenbefragungen 2008 Verkehrsflächen<br />
Ausrüstungsvermögen Amtliche Statistik 2005<br />
Vorratsvermögen<br />
Relationen zwischen Vorratsvermögen<br />
und Ausrüstungsvermögen (Reese<br />
2003)<br />
2003<br />
Brut<strong>to</strong>wertschöpfung Amtliche Statistik 2006<br />
Gebäude (wirtschaftliche<br />
Nutzung)<br />
Gebäude (wirtschaftliche<br />
Nutzung)<br />
Gebäude (wirtschaftliche<br />
Nutzung)
90 Sossidi et al.<br />
Die Methodik greift zu einem großen Teil auf Daten der amtlichen Statistik zurück, um eine einfache<br />
Aktualisierbarkeit der Wertermittlung zu gewährleisten. Diese Daten lagen allerdings in<br />
unterschiedlicher Genauigkeit vor. So wird beispielsweise das Ausrüstungsvermögen für 14<br />
Wirtschaftsbereiche getrennt aufgeführt, die Anzahl der Erwerbstätigen und die Höhe der<br />
Brut<strong>to</strong>wertschöpfung dagegen werden nur für sechs übergeordnete Wirtschaftsbereiche angegeben.<br />
Während diese Daten sich auf ganz Hamburg beziehen, gab es für die Anzahl der Einwohner und<br />
Pkws Daten auf Stadtteilbasis. Waren keine Daten aus der Statistik verfügbar, wurden diese durch<br />
Expertenbefragungen gewonnen oder wissenschaftlichen Veröffentlichungen entnommen.<br />
Die ermittelten Werte werden in ArcGIS in Gebäuden unterschiedlicher Nutzung verortet bzw. den<br />
Verkehrsflächen zugeordnet. Als Grundlage hierfür dient die Digitale Stadtgrundkarte (DSGK)<br />
1:1.000. In ihr sind neben anderen thematischen Layern auch die Gebäude Hamburgs als Polygone<br />
enthalten. Zu jedem Gebäude finden sich in der Attributtabelle u.a. Angaben zur Adresse, der<br />
Grundfläche, der Anzahl der Geschosse und der Gebäudenutzung. Die Verkehrsflächen werden aus<br />
der Digitalen Karte 1:5.000 (DK5) übernommen.<br />
5 Sturmflut-Szenarien<br />
Die Untersuchung von Sturmflut-Szenarien fällt in den Bereich der Gefährdungsanalyse. Durch die<br />
Verknüpfung der Ergebnisse der hier vorgenommenen Sturmflutsimulation mit den Ergebnissen der<br />
Wertermittlung im GIS können die in den Szenarien zu erwartenden Schäden abgeschätzt werden. Die<br />
Simulation der Szenarien erfolgte mit dem Programm HWSIM, das im Folgenden vorgestellt wird.<br />
Anschließend erfolgt eine Beschreibung der betrachteten Szenarien und der getroffenen Annahmen<br />
zur Identifizierung möglicher Deichbrüche.<br />
Das Programm HWSIM<br />
Das Programm HWSIM wurde als Erweiterung unter ArcGIS für die Durchführung von<br />
Hochwassersimulationen für die Elbmarsch entwickelt. Im Programm wurde die öffentliche<br />
Hochwasserschutzlinie Hamburgs berücksichtigt, so dass es möglich ist, Deichbrüche und ihre<br />
Auswirkungen in der Simulation zu untersuchen. Da die öffentlichen Hochwasserschutzanlagen in<br />
Hamburg im Rahmen des “Bauprogramm Hochwasserschutz” laufend bis voraussichtlich 2012 an die<br />
Bemessungswasserstände angepasst werden, spiegeln die in der Programmdatenbank enthaltenen<br />
Informationen allerdings nicht immer den aktuellen Ausbauzustand der Hochwasserschutzanlagen<br />
wider. Im Rahmen des Bauprogramms werden alle Hochwasserschutzanlagen um durchschnittlich 1 m<br />
erhöht (Landesbetrieb Straßen, Brücken und Gewässer 2007). An der Aktualisierung der Datenbank<br />
wird zur Zeit gearbeitet.<br />
Sturmflutwasserstände am Pegel St. Pauli<br />
Sturmflutscheitelwasserstände einer bestimmten Jährlichkeit können mit Hilfe statistischer Analysen<br />
von Pegelaufzeichnungen bestimmt werden. Für die Ermittlung von seltenen und sehr seltenen<br />
Scheitelwasserständen in Tideästuaren wie dem Elbeästuar ist die Anwendung von statistischen<br />
Verfahren allerdings nicht geeignet, da die Zeitreihen an diesen Pegelstandorten stark durch<br />
Ausbaumaßnahmen beeinflusst sind (Gönnert & Ferk 1996) und daher nicht den Anforderungen für<br />
Zeitreihenuntersuchungen genügen. Hinzu kommt die Problematik der Tidedynamik im Ästuar und<br />
der Einfluss des Oberwasserzuflusses (Jensen et al. 2003).<br />
Scheitelwasserstände mit einem Wiederkehrintervall von 100 Jahren wurden dagegen sowohl für<br />
<strong>Küsten</strong>pegel als auch für die Pegel im Elbeästuar mit statistischen Verfahren ermittelt und durch<br />
umfangreiche Untersuchungen verifiziert. Am Pegel St. Pauli beträgt dieser Scheitelwasserstand NN +<br />
6,60 m (Jensen & Frank 2003).<br />
Zur Abschätzung eines Scheitelwasserstandes für ein Extremereignis am Pegel St. Pauli wurden die im<br />
MUSE-Projekt (Jensen & Mudersbach 2005) für den Pegel Cuxhaven berechneten extremen
GIS-gestütze Analyse des Überflutungsrisikos in Hamburg 91<br />
Scheitelwasserstände herangezogen. Anhand der Differenz der für ein 100-jährliches Sturmflutereignis<br />
ermittelten Scheitelwasserstände an den Pegeln Cuxhaven und St. Pauli wurde aus den Angaben für<br />
den Pegel Cuxhaven ein seltener Sturmflutscheitelwasserstand für den Pegel St. Pauli abgeleitet.<br />
Dieser entspricht mit NN + 7,22 m in etwa dem Bemessungswasserstand, auf den die<br />
Hochwasserschutzanlagen im Rahmen des Bauprogramms angepasst werden (Gönnert 2007).<br />
In der Datenbank des verwendeten Simulationsprogramms sind bislang nicht für alle Deiche die<br />
Sollhöhen entsprechend der neuen Bemessungswasserstände enthalten. Daher ist zu erwarten, dass es<br />
bei der Simulation von Sturmfluten mit Scheitelwasserständen in der Größenordnung des<br />
Bemessungswasserstands in HWSIM an den noch zu aktualisierenden Deichabschnitten zu<br />
Deichbrüchen kommen kann. Ein solcher Sturmflutscheitelwasserstand eignet sich somit gut, um das<br />
im nächsten Abschnitt dargestellte Verfahren zur Identifizierung möglicher Deichbrüche anzuwenden.<br />
Auf Grundlage dieser Überlegungen wurden folgende Szenarien berechnet:<br />
� Szenario 1<br />
Scheitelwasserstand Pegel St. Pauli: 6,60 m NN<br />
Oberwasserzufluss: 1000 m 3 /s<br />
� Szenario 2<br />
Scheitelwasserstand Pegel St. Pauli: 7,22 m NN<br />
Oberwasserzufluss: 1000 m 3 /s<br />
Deichbrüche<br />
Da während der Sturmfluten 1962 und 1976 Deichbrüche meist an Stellen auftraten, die vorher bereits<br />
durch Überströmen oder Wellenüberlauf beschädigt worden waren (Freistadt 1962, Traeger 1962,<br />
Zitscher et al. 1979), wurden in der Simulation von Strumflutereignissen diese beiden<br />
Schadensmechanismen als mögliche Ursachen eines Deichbruchs in den Mittelpunkt gestellt.<br />
Für die Szenarioberechnungen wurden folgende Annahmen getroffen (Sossidi 2009):<br />
� Ein Deichbruch durch Wellenüberlauf erfolgt bei einer Überlaufmenge > 0,03 m 3 pro s pro m; er<br />
beginnt 5 Minuten nach Überschreiten dieses Grenzwertes, hat nach 30 Minuten seine maximale<br />
Tiefe (die Deichsohle) und nach 60 Minuten seine maximale Breite (100 m) erreicht.<br />
� Ein Deichbruch durch Überströmen erfolgt bei einer Überströmmenge > 0,0005 m 3 pro s pro m; er<br />
beginnt auf der gesamten Breite des betroffenen Deichabschnitts, sobald diese zulässige<br />
Überströmrate überschritten wird, und hat nach 30 Minuten seine maximale Tiefe (die Deichsohle)<br />
erreicht.<br />
� Der Bruch einer Hochwasserschutzwand erfolgt bei einer Überlauf- bzw. Überströmmenge > 0,2<br />
m 3 pro s pro m sofort auf maximaler Breite und Tiefe (abhängig von den Maßen der<br />
Hochwasserschutzwand).<br />
6 Auswertung<br />
Unter den genannten Annahmen ist in Szenario 1 die Deichsicherheit nicht gefährdet. In Szenario 2<br />
kommt es an zwei Deichabschnitten zu Deichbrüchen. Ein Vergleich der Deichhöhen aus der<br />
HWSIM-Datenbank mit den in der vom Landesbetrieb Straßen, Brücken und Gewässer der Stadt<br />
Hamburg herausgegebenen Karte “Tiefliegende Gebiete in Hamburg mit Hochwasserschutzanlagen“<br />
(Stand: Januar 2007) angegebenen Sollhöhen der Hochwasserschutzanlagen zeigt, dass die<br />
Deichabschnitte, an denen es in der Szenarioberechnung zu Deichbrüchen kommt, inzwischen um bis<br />
zu 0,9 m erhöht worden sind. Es kann also davon ausgegangen werden, dass eine Sturmflut mit einem<br />
Scheitelwasserstand von 7,22 m NN am Pegel St. Pauli unter Berücksichtigung des heutigen<br />
Ausbauzustandes der Hochwasserschutzanlagen nicht zu Deichbrüchen führt.
92 Sossidi et al.<br />
Abbildung 2 zeigt den jeweiligen Anteil der in den Szenarien betroffenen Landfläche der<br />
Untersuchungsgebiete. Das Überschwemmungsgebiet der Dove-Elbe ist in keinem der Szenarien von<br />
Überflutung betroffen. Dies ist auf die Tatenberger Schleuse zurückzuführen, welche die Dove-Elbe<br />
von der Elbe und der Gezeiteneinwirkung im Ästuar abtrennt. Solange die Schleuse während einer<br />
Sturmflut geschlossen ist, muss in diesem Gebiet also nicht mit Überflutungen gerechnet werden.<br />
Abb. 2: Anteil der in den Szenarien betroffenen Landfläche<br />
In Szenario 1 sind auf der Veddel 55 der 755 Gebäude von Überflutungen betroffen, in Szenario 2 sind<br />
es 505 Gebäude. Abbildung 3 zeigt, dass in beiden Szenarien der größte Teil der betroffenen Gebäude<br />
(Szenario 1: 48 Gebäude, Szenario 2: 388 Gebäude) nur über ein S<strong>to</strong>ckwerk verfügt. Betrachtet man<br />
nun die Wohngebäude gesondert, zeigt sich, dass in Szenario 1 von den acht betroffenen<br />
Wohngebäuden fünf keine Rückzugsmöglichkeit in ein höher gelegenes S<strong>to</strong>ckwerk bieten. In Szenario<br />
2 sind 27 Wohngebäude betroffen, von denen 13 nur ein S<strong>to</strong>ckwerk besitzen.<br />
Abb. 3: Betroffene Gebäude auf der Veddel nach S<strong>to</strong>ckwerkszahl<br />
In Szenario 1 wurden ca. 73 Einwohner im überfluteten Gebiet lokalisiert; dies entspricht 1,5 % der<br />
Einwohner des Stadtteils. In Szenario 2 leben ca. 539 Personen (bzw. 10,9 % der Einwohner des<br />
Stadtteils) im potentiell überfluteten Gebiet.<br />
Das direkte tangible Schadenspotential im betroffenen Gebiet liegt in Szenario 1 bei 31.272.200 €. In<br />
Szenario 2 beträgt der Wert 3.791.969.600 €. Diese Angaben beziffern nicht den zu erwartenden<br />
Schaden, sondern den Wert des direkten tangiblen Schadenspotentials im überfluteten Gebiet.<br />
Abbildung 4 und 5 zeigen den Anteil der einzelnen Schadenskategorien an diesen Gesamtwerten.
GIS-gestütze Analyse des Überflutungsrisikos in Hamburg 93<br />
Abb. 4: Anteil der Schadenskategorien am monetären Schadenspotential der betroffenen Gebiete in Szenario 1<br />
In Szenario 1 werden ca. 107 Arbeitsplätze (0,6 % der Arbeitsplätze im Stadtteil) im betroffenen<br />
Gebiet lokalisert. Mit diesen ist eine jährliche Brut<strong>to</strong>wertschöpfung in Höhe von 7.374.412 €<br />
verbunden. In Szenario 2 sind es 15.272 Arbeitsplätze (84,8 %) und eine Brut<strong>to</strong>wertschöpfung von<br />
jährlich 1.307.798.659 €.<br />
Abb. 5: Anteil der Schadenskategorien am monetären Schadenspotential der betroffenen Gebiete in Szenario 2<br />
Auf Grundlage der in dieser Untersuchung erzielten Ergebnisse konnten Entwürfe für<br />
Hochwassergefahren- und Hochwasserrisikokarten entsprechend den Mindestanforderungen der EG-<br />
Hochwasserrisikomanagementrichtlinie erstellt werden. Abbildung 6 zeigt die Hochwasserrisikokarte<br />
für das Szenario 2. In dieser wird die Überflutungshöhe in 5 Klassen angegeben. Als weitere<br />
Informationen sind die Scheitelwasserstände an nahe gelegenen Pegeln sowie die Lage der<br />
öffentlichen Hochwasserschutzanlagen eingezeichnet Als Kartengrundlage wird die Digitale<br />
Stadtgrundkarte (DSGK) mit dem Basismaßstab 1:1.000 verwendet.<br />
In der Risikokarte (Abb. 7) ist die Landnutzung in den in Szenario 2 betroffenen Gebieten dargestellt.<br />
Straßenflächen sind in den verwendeten Landnutzungsdaten nicht berücksichtigt, so dass diese in der<br />
Karte nicht dargestellt werden, obwohl sie im überfluteten Gebiet liegen. Als weitere Informationen<br />
sind die Standorte von Anlagen eingezeichnet, die bei Überflutung Wasserverschmutzungen verursachen<br />
können. Diese wurden aus der Online-Datenbank des Europäischen Schads<strong>to</strong>ffemissionsregisters<br />
(EPER) übernommen. Die Anzahl der potentiell betroffenen Einwohner wird durch die Zahl der<br />
Einwohner in den einzelnen Stadtteilen repräsentiert, die aus der Amtlichen Statistik (Statistisches<br />
Amt für Hamburg und Schleswig-Holstein 2008) übernommen wurden. Diese Angabe bezieht sich<br />
somit nicht speziell auf die im von Überflutung betroffenen Gebiet lebenden Menschen. Als<br />
Kartenhintergrund wurde die Digitale Stadtkarte (DK) mit dem Basismaßstab 1:20.000 verwendet.
94 Sossidi et al.<br />
Abb. 6: Entwurf einer Hochwassergefahrenkarte (Veddel): Szenario Pegel St. Pauli 7,22 m NN<br />
Abb. 7: Entwurf einer Hochwasserrisikokarte (Veddel): Szenario Pegel St. Pauli 7,22 m NN<br />
7 Fazit<br />
Die im Rahmen der Hochwasserrisiko-Analyse vorgenommene Wertermittlung sollte auf der einen<br />
Seite möglichst genau erfolgen, auf der anderen Seite schnell und kostengünstig durchführbar sowie<br />
aktualisierbar sein. Die Aktualisierbarkeit ist durch die Verwendung von Statistiken gewährleistet, da<br />
diese jährlich erstellt und veröffentlicht werden. Auch die verwendeten Kartengrundlagen werden in<br />
regelmäßigem Abstand aktualisiert, so dass Veränderungen des Baubestandes oder der Gebäudenutzung<br />
ohne großen Aufwand Rechnung getragen werden kann. Für die Überprüfung der Werte, die<br />
nicht auf Statistiken beruhen, kann eine erneute Expertenbefragung durchgeführt werden. Für eine
96 Sossidi et al.<br />
generiert werden. Aufgrund der groben Auflösung der berechneten Ergebnisse ist die Darstellung der<br />
überfluteten Flächen in Gefahrenkarten in einem Maßstab größer als 1:15.000 nicht zu empfehlen. Für<br />
die Darstellung der wirtschaftlichen Tätigkeiten in den betroffenen Gebieten wurden die von Überflutung<br />
betroffenen Gebiete im GIS mit Landnutzungsinformationen verschnitten. Da diese nicht alle<br />
erforderlichen Informationen enthielten, sollte für die Erstellung von Risikokarten der Empfehlung der<br />
LAWA (Länderarbeitsgemeinschaft Wasser 2008) gefolgt werden, auf die Flächennutzungsinformationen<br />
des Amtlichen Topographisch-Kar<strong>to</strong>graphischen Informationssystems (ATKIS-Basis-<br />
DLM) zurückzugreifen.<br />
Literatur<br />
Buck, W. (2006): Zweckorientierte Aufstellung von Wasserstand-Schadensfunktionen. In: Jüpner, R. (Hrsg.):<br />
Beiträge zur Konferenz „Strategien und Instrumente zur Verbesserung des vorbeugenden<br />
Hochwasserschutzes“, 23.-25. November 2006 in Tangermünde. Aachen, S. <strong>16</strong>5–172.<br />
Freistadt, H. (1962): Die Sturmflut vom <strong>16</strong>./17. Februar in Hamburg. In: Die Küste 10 (1): 81–-92.<br />
Gönnert, G. & U. Ferk (1996): Natürliche und anthropogen beeinflusste Entwicklung von Sturmfluten in der<br />
Deutschen Bucht und der Unterelbe. In: Vechtaer Studien zur Angewandten Geographie und<br />
Regionalwissenschaft 18: 13–31.<br />
Gönnert, G. (2007): Sturmfluten und der Umgang mit ihrem Risiko im Elbeästuar. In: Berichte zur Deutschen<br />
Landeskunde 81 (3): 247–266.<br />
Jensen, J. & T. Frank (2003): Zur Abschätzung von Sturmflutwasserständen mit sehr kleinen<br />
Überschreitungswahrscheinlichkeiten. In: Die Küste 67: 367–405.<br />
Jensen, J., T. Frank, C. Zimmermann, S. Mai, W. Rosenhauer, R. Meiswinkel & G. Barg (2003): Neue<br />
Verfahren zur Abschätzung von seltenen Sturmflutwasserständen. In: Hansa 140 (1): 68–79.<br />
Jensen, J. & C. Mudersbach (2005): Modellgestützte Untersuchungen zu Sturmfluten mit sehr geringen<br />
Eintrittswahrscheinlichkeiten (MUSE) – Teilprojekt 3: Statistisch-probabilistische Extremwertanalyse.<br />
Siegen, 94 S.<br />
Landesbetrieb Straßen, Brücken und Gewässer der Freien und Hansestadt Hamburg (2007): Hochwasserschutz<br />
in Hamburg. Bauprogramm 2007. Hamburg, <strong>16</strong> S.<br />
Länderarbeitsgemeinschaft Wasser (2008): Strategie zur Umsetzung der Hochwasserrisikomanagement-<br />
Richtlinie in Deutschland vom 15. September 2008. 15 S. (http://www.hochwassernotgemeinschaftrhein.de/pdf/LAWA%20Strategiepapier%20EU-HWRM-RL.pdf;<br />
21. Februar 2009).<br />
Reese, S. (2003): Die Vulnerabilität der schleswig-holsteinischen <strong>Küsten</strong>raumes durch Sturmfluten – Fallstudien<br />
von der Nord- und Ostsee. Kiel, 305 S.<br />
Sossidi, K. (2009): GIS-gestützte Analyse des Überflutungsrisikos in Hamburg unter Berücksichtigung der EU-<br />
Hochwasserrichtlinie dargestellt am Beispiel der Veddel und Teilen der Vier- und Marschlande. (unv.)<br />
Diplomarbeit. Hamburg, 125 S.<br />
Statistisches Amt für Hamburg & Schleswig-Holstein (2008): Hamburger Stadtteilprofile 2008. Hamburg, 258 S.<br />
Traeger, G. (1962): Die Sturmflut vom <strong>16</strong>./17. Februar 1962 im Lande Bremen. In: Die Küste 10 (1): 93–112.<br />
Zitscher, F.-F., R. Scherenberg & U. Varow (1979): Die Sturmflut vom 3. und 21. Januar 1976 an den <strong>Küsten</strong><br />
Schleswig-Holsteins. In: Die Küste 33: 71–100.<br />
Address<br />
Kristina Sossidi<br />
KSossidi@hotmail.com
Effeccts<br />
of Chaanges<br />
in Sea<br />
Level oon<br />
the Tid dal Dynammics<br />
of thhe<br />
River Weser W<br />
Abstracct<br />
A system study was conducteed<br />
with the aiid<br />
of a 3D hydrodynamic<br />
nnumerical<br />
moddel<br />
<strong>to</strong> enable the<br />
immpact<br />
of changges<br />
in sea leveel<br />
on the estuary<br />
of the Riv ver Weser <strong>to</strong> bbe<br />
estimated mmore<br />
accurate ely.<br />
Duuring<br />
the studdy<br />
the mean tide level annd<br />
mean tida al range weree<br />
raised and tthe<br />
results were w<br />
subbsequently<br />
annalysed<br />
with regard <strong>to</strong> the tide-related characteristic values. The results show an<br />
inccrease<br />
in the tidal range in the estuaryy<br />
along with h an increase in the curreent<br />
velocities, in<br />
parrticular<br />
in thee<br />
flood current<br />
velocity. In addition, an intrusion i of hiigh<br />
salt conceentrations<br />
further<br />
uppstream<br />
was oobserved.<br />
Witthin<br />
the rangee<br />
of values examined, e thee<br />
system variaables<br />
within the<br />
esttuary<br />
reacted llinearly<br />
<strong>to</strong> thee<br />
changes introoduced<br />
at the boundaries off<br />
the model.<br />
1 Bacckground<br />
Schwarzerr,<br />
Schrottke & Stattegger (eeds.):<br />
<strong>From</strong> Brazzil<br />
<strong>to</strong> <strong>Thailand</strong> – New Resultts<br />
in Coastal Research R<br />
<strong>Coastline</strong>e<br />
<strong>Reports</strong> <strong>16</strong> ( (<strong>2010</strong>), ISSN 00928-2734,<br />
IS SBN 978-3-9811839-9-3<br />
S. 97-100<br />
Federal Waterways EEngineering<br />
annd<br />
Research In nstitute, Hambburg<br />
Branch, GGermany<br />
The rise in mean seaa<br />
level (IPCCC<br />
2007) is ddirectly<br />
affec cting the meaan<br />
tide levell<br />
in the estua ary of the<br />
River WWeser.<br />
In adddition,<br />
the ammphidromic<br />
ppoints<br />
in the North Sea aare<br />
likely <strong>to</strong> be influence ed so that<br />
changes in the phasees<br />
and ampliitudes<br />
of the partial tides s can be expeected<br />
(Plüß 22004).<br />
This in turn is<br />
affectingg<br />
the tidal rannge<br />
which deetermines<br />
hoow<br />
much ene ergy enters thhe<br />
estuary.<br />
As a staarting<br />
point ffor<br />
modellinng<br />
climate chhange<br />
scenar rios it is impportant<br />
<strong>to</strong> bee<br />
able <strong>to</strong> esti imate the<br />
reaction of the estuuary<br />
<strong>to</strong> suchh<br />
changes aand<br />
<strong>to</strong> unde erstand theirr<br />
causes annd<br />
relationsh hips. The<br />
parameteers<br />
“mean tidde<br />
level” (MMTL)<br />
and “tiddal<br />
range” (T TR) were theerefore<br />
varieed<br />
and the ch hanges in<br />
the meann<br />
conditions in the estuarry<br />
analysed inn<br />
the system m study described<br />
in this ppaper.<br />
2 Moodel<br />
and cooncept<br />
of thhe<br />
investigaation<br />
IIngrid<br />
Holzzwarth<br />
& Fr rank Kösters<br />
The inveestigations<br />
wwere<br />
conducted<br />
with thee<br />
combined UnTRIM-Se<br />
U ediMorph moodelling<br />
system.<br />
The<br />
UnTRIMM<br />
numerical method wass<br />
used <strong>to</strong> sollve<br />
non-stead dy state, nonn-linear<br />
equaations<br />
for fre ee surface<br />
flow prroblems<br />
(Caasulli<br />
& Zaanolli<br />
2002) . The morp phodynamic modelling method Se ediMorph<br />
(Malcherek<br />
et al 20005)<br />
was used <strong>to</strong> calculate the bot<strong>to</strong>m friction. f<br />
The moddel<br />
covered the entire arrea<br />
of the Jaade-Weser<br />
es stuary, for wwhich<br />
the hyddrodynamics<br />
s and salt<br />
transportt<br />
were calcuulated<br />
in a hiigh<br />
resolutioon<br />
3D data set. s The moddel<br />
was validdated<br />
for pre esent-day<br />
conditionns<br />
using measured<br />
data and it deliveers<br />
realistic results. r It waas<br />
steered viia<br />
the water levels on<br />
the seawward<br />
boundaary<br />
and the ffresh<br />
water inflow from m the Weser on the landdward<br />
bound dary. The<br />
period of<br />
time selected<br />
for the annalysis<br />
was a spring-neap p cycle.<br />
The boundary<br />
condittions<br />
for MTTL<br />
and TR wwere<br />
varied bo oth separatelly<br />
and jointlyy<br />
in the syste em study.<br />
The channges<br />
in MTLL<br />
ranged fromm<br />
-20 cm <strong>to</strong> + +80 cm and those in TR from -20 cmm<br />
<strong>to</strong> +40 cm. All other<br />
boundaryy<br />
conditionss<br />
in the modeel<br />
were identtical.<br />
Thus th he freshwateer<br />
inflow wass<br />
a constant 180 m³/s<br />
in all varriations<br />
of thhe<br />
model andd<br />
was therefoore<br />
in the ran nge of the moost<br />
frequent ffreshwater<br />
in nflow.
98<br />
3 Ressults<br />
– Tidee-related<br />
chharacteristtic<br />
values of<br />
water level,<br />
current and salt co ontent<br />
An increease<br />
in the ttwo<br />
parameters<br />
TR and MTL in the e seaward booundary<br />
condditions<br />
resulted<br />
in an<br />
increase in the high wwater<br />
elevatiion<br />
(HW) aloong<br />
the Wese er estuary (FFigure<br />
1, left panel). The specified<br />
changes in the bounddary<br />
values wwere<br />
sustaineed<br />
virtually unaltered u in HHW<br />
up <strong>to</strong> thee<br />
tidal limit.<br />
Increasinng<br />
TR in thhe<br />
boundary conditions rresulted<br />
in a lowering oof<br />
the low wwater<br />
elevati ion (LW)<br />
while, bby<br />
contrast, raising MTLL<br />
led <strong>to</strong> an increase in n LW. Figurre<br />
1 shows that changes<br />
in LW<br />
introduced<br />
at the seeaward<br />
bounndary<br />
decreassed<br />
<strong>to</strong>wards the tidal limmit,<br />
in contrrast<br />
<strong>to</strong> HW. TR thus<br />
increasedd<br />
in the direection<br />
of thee<br />
tidal limit. At the same e time, the dduration<br />
of thhe<br />
ebb tide increased i<br />
between W-km 20 annd<br />
W-km 100<br />
compared with the dur ration of the fflood<br />
tide.<br />
It is notiiceable<br />
that tthe<br />
tide-relatted<br />
characterristic<br />
values reacted r apprroximately<br />
linearly<br />
<strong>to</strong> the e changes<br />
in the booundary<br />
valuues.<br />
Thus thee<br />
changes in the tide-rela ated characteeristic<br />
valuess<br />
can be expr ressed by<br />
varying MTL and TTR<br />
by meanss<br />
of regression<br />
equations s. In particular,<br />
there waas<br />
a good co orrelation<br />
between the characteeristic<br />
valuess<br />
of the water<br />
level obtain ned in this wway<br />
and the vvalues<br />
obtain ned in the<br />
simulatioon<br />
(Figure 1,<br />
right panel) ).<br />
Furthermmore,<br />
an inccrease<br />
in TRR<br />
and MTL in the seaw ward boundarry<br />
conditionns<br />
resulted in n greater<br />
current vvelocities.<br />
Thhe<br />
increase iin<br />
the flood current veloc cities was mmore<br />
pronounnced<br />
than the e increase<br />
in the ebbb<br />
current veelocities<br />
so thhat<br />
several oof<br />
the areas previously p doominated<br />
by the ebb curr rent were<br />
subsequeently<br />
dominaated<br />
by the fl flood current (Figure 2).<br />
An increease<br />
in MTL and TR at thhe<br />
seaward bboundary<br />
of the model allso<br />
resulted iin<br />
saltwater intruding<br />
further uupstream.<br />
Thhus,<br />
for exammple,<br />
water with a mea an salt contennt<br />
of 5 psu intruded up <strong>to</strong> 5 km<br />
further uupstream<br />
for MTL +55 cmm<br />
and TR +330<br />
cm.<br />
Figure 1:<br />
Holzwarth & Kösters<br />
High waterr<br />
(HW) and loow<br />
water (LWW)<br />
along the Weser W navigaation<br />
channel with km-0 cl lose <strong>to</strong> the<br />
tidal limit aand<br />
km-125 aat<br />
the end of tthe<br />
navigation n channel in tthe<br />
North Seaa.<br />
The left panel<br />
shows<br />
depth-averaaged<br />
results off<br />
the referencee<br />
run, two run ns with variatioon<br />
only of tidaal<br />
range (TR) and mean<br />
tide level ( (MTL) respecctively<br />
and onne<br />
with variat tion of TR annd<br />
MTL. Thee<br />
right panel shows the<br />
change (rellative<br />
<strong>to</strong> the reference<br />
run) in HW and LW L for MTLL<br />
+55 cm and TR +30 cm calculated<br />
with the hellp<br />
of linear reggression<br />
equaations<br />
and com mpared <strong>to</strong> simuulated<br />
values.
Effects off<br />
Changes in SSea<br />
Level on tthe<br />
Tidal Dynaamics<br />
of the River R Weser<br />
Figure 2:<br />
Ratio of mmean<br />
flood currrent<br />
velocityy<br />
<strong>to</strong> mean ebb b current veloocity.<br />
Values above 1 indic cate flood<br />
current domminated<br />
sectionns.<br />
4 Disscussion<br />
annd<br />
conclusioon<br />
The inveestigations<br />
deescribed<br />
aboove<br />
show thaat<br />
the reaction ns in the system<br />
caused bby<br />
a rise in mean m tide<br />
level aree<br />
basically siimilar<br />
<strong>to</strong> thosse<br />
caused byy<br />
a deepening g of the estuary.<br />
Thus chhanges<br />
in wa ater levels<br />
at high water are suustained<br />
virtuually<br />
unchannged<br />
through hout the estuuary<br />
while cchanges<br />
in the t water<br />
level at llow<br />
water deecrease<br />
in the<br />
upstream ddirection.<br />
Th he resultant inncrease<br />
in thhe<br />
tidal range e leads <strong>to</strong><br />
higher current<br />
velocities,<br />
with thhe<br />
flood currrent<br />
velocitie es increasingg<br />
<strong>to</strong> a greateer<br />
extent than n the ebb<br />
current vvelocities<br />
owwing<br />
<strong>to</strong> the leess<br />
pronounceed<br />
effect of bot<strong>to</strong>m b friction.<br />
The strengthening<br />
off<br />
the flood ccurrent<br />
is siggnificant<br />
for the transporrt<br />
of suspendded<br />
matter. If I the ebb<br />
current bbecomes<br />
weaaker<br />
than thee<br />
flood curreent<br />
it will no o longer be ccapable<br />
of reemoving<br />
the sediment<br />
transportted<br />
upstreamm<br />
by the floodd<br />
current. Thhis<br />
can result t in greater siltation<br />
of thhe<br />
areas dominated<br />
by<br />
the floodd<br />
current.<br />
The intruusion<br />
of watter<br />
with a hiigher<br />
salt coontent<br />
further<br />
inland owiing<br />
<strong>to</strong> the risse<br />
in the me ean water<br />
level priincipally<br />
affeects<br />
the floraa<br />
and fauna in those area as and has aan<br />
impact onn<br />
the suitabili ity of the<br />
river watter<br />
for agricuulture.<br />
Finally, it should bee<br />
pointed outt<br />
that the aimm<br />
of the syst tem study deescribed<br />
aboove<br />
was not <strong>to</strong> model<br />
climate sscenarios<br />
buut<br />
<strong>to</strong> analyse the behaviouur<br />
of certain state variables<br />
under twwo<br />
modified boundary b<br />
conditionns.<br />
Climate scenarios wwould<br />
cover<br />
additional l boundary conditions, such as ch hanges in<br />
temperatture,<br />
wind sppeed,<br />
wind direction and<br />
freshwater r inflow. Thhe<br />
system stuudy<br />
describe ed in this<br />
paper waas<br />
conductedd<br />
with a fixedd<br />
fresh waterr<br />
inflow, i.e. the quantitattive<br />
statemennts<br />
made in this t study<br />
only appply<br />
<strong>to</strong> the seleected<br />
fresh wwater<br />
inflow situation.<br />
Referennces<br />
Casulli, VV.<br />
& P. Zanollli<br />
(2002).: Semmi-Implicit<br />
Nuumerical<br />
Mod deling of Nonhhydrostatic<br />
Frree-surface<br />
Flo ows for<br />
Enviironmental<br />
Prooblems.<br />
In: MMathematical<br />
aand<br />
Computer Modeling 36: : 1131–1149.<br />
IPCC (20007):<br />
Climate Change 2007:<br />
Synthesis Reeport.<br />
Contrib bution of Workking<br />
Groups II,<br />
II and III <strong>to</strong> the<br />
Fourrth<br />
Assessmennt<br />
Report of thhe<br />
Intergovernnmental<br />
Panel on Climate CChange<br />
[Core WWriting<br />
Team m, Pachuri,<br />
R.K. and A. Reisinnger<br />
(eds.)]. GGeneva,<br />
Switzzerland,<br />
104 pp p.<br />
Malchereek,<br />
A., F. Piechotta<br />
& D. Knnoch<br />
(2005): MMathematical<br />
Module SediMMorph<br />
- Standdard<br />
Validatio on<br />
Docuument<br />
Versionn<br />
1.1, Techniccal<br />
Report. Buundesanstalt<br />
fü ür Wasserbau. .<br />
Plüß, A. ( (2004): Nichtllineare<br />
Wechsselwirkungen<br />
der Tide auf Änderungen Ä ddes<br />
Meeresspiiegels<br />
im<br />
Überrgangsbereichh<br />
Küste/Ästuarr<br />
am Beispiel der Elbe. In: Gönnert, G G., HH.<br />
Grassl, D. KKelletat,<br />
H. Kunz, K B.<br />
Probst,<br />
H. von S<strong>to</strong>orch<br />
& J. Sünddermann<br />
(Hrsgg.):<br />
Klimaänd derung und Küüstenschutz.<br />
HHamburg.<br />
99
100 Holzwarth & Kösters<br />
Address<br />
Ingrid Holzwarth<br />
Bundesanstalt für Wasserbau Dienststelle Hamburg<br />
Wedeler Landstraße 157<br />
22559 Hamburg, Germany<br />
Ingrid.Holzwarth@baw.de
Abstracct<br />
CCosts<br />
of seea-level<br />
riise<br />
under different t climatic and socioo-economic<br />
scenarios:<br />
an appplication<br />
of o the DIVVA<br />
modell<br />
Thhe<br />
world’s coaastal<br />
zones aree<br />
due <strong>to</strong> a higgh<br />
population and a high cooncentration<br />
onn<br />
material ass sets<br />
ammong<br />
the mostt<br />
vulnerable aareas<br />
in the wworld<br />
<strong>to</strong> a, thro ough climate change altered,<br />
sea-level ri ise.<br />
Too<br />
better proteect<br />
these poteential<br />
endanggered<br />
areas vulnerability v<br />
aassessments<br />
aare<br />
necessary <strong>to</strong><br />
evaluate<br />
the pottential<br />
risks, impacts and ccosts<br />
of clima ate change. Inn<br />
this work thhe<br />
DIVA mo odel<br />
verrsion<br />
2.0.2 was<br />
applied <strong>to</strong> indentify the potential costs<br />
of sea-leveel<br />
rise under ddifferent<br />
clima atic<br />
and<br />
socio-econoomic<br />
scenarioos.<br />
The DIVAA<br />
runs were made m for Germmany,<br />
the Nethherlands<br />
and the<br />
Unnited<br />
Kingdomm<br />
with the IPCCC<br />
SRES scennarios<br />
A1FI, A2 A and B2. TThe<br />
results outtline<br />
the need for<br />
adaptation<br />
undeer<br />
all three sccenarios<br />
withh<br />
highest valu ues in the A1FI<br />
and the loowest<br />
in the B2<br />
sceenario.<br />
They clearly showw<br />
that the coosts<br />
will rapi idly increase at least afteer<br />
2070 without<br />
adaptation.<br />
The results also outline<br />
the hugge<br />
benefit of proactive p adapptation<br />
comparred<br />
with react tive<br />
adaptation.<br />
Evenn<br />
if the DIVAA<br />
model is a global model l the results aare<br />
in a logicaal<br />
context <strong>to</strong> the<br />
ph hysical and socio-economic<br />
conditions of<br />
the countrie es and scenarios<br />
applied annd<br />
provide use eful<br />
inssights<br />
on the vvulnerability<br />
ffor<br />
long-term ccoastal<br />
manag gement even oon<br />
smaller scaales.<br />
1 Inttroduction<br />
The coasstal<br />
zones coontain<br />
a largge<br />
part of thee<br />
world’s population.<br />
Daaschkeit<br />
and Sterr (2003) ) indicate<br />
that arouund<br />
50 % of the world’s population llives<br />
within 50 5 km of thee<br />
shoreline. TThese<br />
areas also a have<br />
a high cooncentrationn<br />
on material assets with large socio-e economic rellevance.<br />
Theerefore<br />
and due d <strong>to</strong> an,<br />
through climate channge<br />
altered, ssea-level<br />
risee<br />
the coastal regions are among the mmost<br />
vulnera able areas<br />
in the woorld.<br />
New esstimates<br />
abouut<br />
sea-level rrise<br />
indicate that t it possibbly<br />
could risee<br />
between 0. 55 m and<br />
1.40 m until 2100 (Rahms<strong>to</strong>rff<br />
et al. 20077).<br />
To bette er protect thhese<br />
potentiial<br />
endanger red areas<br />
vulnerabbility<br />
assessmments<br />
are neecessary<br />
<strong>to</strong> eevaluate<br />
the potential rissks,<br />
impacts and costs of o climate<br />
change. Until now tthere<br />
are nummerous<br />
conccepts<br />
of vuln nerability asssessments<br />
aavailable<br />
but they are<br />
mostly sstatic<br />
and doo<br />
not take inn<strong>to</strong><br />
account tthe<br />
dynamic feedback beetween<br />
varioous<br />
coastal processes, p<br />
their soccio-economicc<br />
consequencces<br />
as well ass<br />
the way hu umans responnd<br />
in form off<br />
adaptation. They are<br />
also mosstly<br />
performeed<br />
<strong>to</strong> inform local and naational<br />
decisi ion-makers rrather<br />
than <strong>to</strong>o<br />
provide com mparable<br />
data for regional annd<br />
global puurposes.<br />
Thee<br />
relatively new DIVA model addrresses<br />
some of these<br />
limitatioons<br />
as it is a global and ddynamic<br />
<strong>to</strong>oll<br />
<strong>to</strong> assess th he vulnerabillity<br />
on differrent<br />
scales ta aking in<strong>to</strong><br />
account adaptation.<br />
2 Meethodology<br />
Schwarzerr,<br />
Schrottke & Stattegger (eeds.):<br />
<strong>From</strong> Brazzil<br />
<strong>to</strong> <strong>Thailand</strong> – New Resultts<br />
in Coastal Research R<br />
<strong>Coastline</strong>e<br />
<strong>Reports</strong> <strong>16</strong> ( (<strong>2010</strong>), ISSN 00928-2734,<br />
IS SBN 978-3-9811839-9-3<br />
S. 101-1033<br />
Heeike<br />
Munder rloh<br />
Chriistian-Albrechhts-University<br />
y of Kiel, Germmany<br />
In this wwork<br />
the DIVVA<br />
(Dynamiic<br />
Interactivee<br />
Vulnerabili ity Assessmeent)<br />
global immpact<br />
and adaptation<br />
model vversion<br />
2.0.22<br />
was applied.<br />
This moddel<br />
is part of o the DIVAA<br />
<strong>to</strong>ol which consists of f a global<br />
coastal ddatabase,<br />
thee<br />
integrated model (figuure<br />
1) and a graphical uuser<br />
interfacce.<br />
The DIV VA model<br />
consists of various mmodules<br />
whicch<br />
provide kknowledge<br />
ab bout the coastal<br />
sub-systtems.<br />
They are a linked<br />
<strong>to</strong> each oother<br />
as well as <strong>to</strong> the dattabase.
102 Munderloh<br />
Figure 1: Schematic overview of the DIVA model<br />
The cases in DIVA are a combination of the selected SRES based scenarios (A1FI, A2 and B2) in land<br />
use, population and economic concerns, the climate scenario, the input data and the selected<br />
adaptation option. Next <strong>to</strong> the three SRES scenarios three different adaptation options have been<br />
applied: Costs-benefit-analyse based adaptation, full adaptation and no adaptation.<br />
Within this work the following output parameter are used:<br />
1. Total costs compounded of <strong>to</strong>tal adaptation costs and <strong>to</strong>tal residual damage costs.<br />
2. Total adaptation costs compounded of sea-and river dike costs, and costs for beach-, wetland-, and<br />
tidal basin nourishment.<br />
3. Total residual damage costs compounded of costs for land loss, migration, salinity intrusion as<br />
well as sea- and river floods.<br />
4. Number of people actually endangered by flooding.<br />
These output parameters were applied for Germany, the Netherlands and the United Kingdom and for<br />
a time frame from 2000 until 2100.<br />
3 Results<br />
The results clearly show that without any adaptation the costs and the number of people at risk will<br />
increase rapidly at least after 2070 (figure 2). This applies for all countries and in all scenarios. With<br />
adaptation however the damage costs and the number of people at risk will decrease significantly. The<br />
two adaptation scenarios are used as a proactive adaptation option and the no adaptation scenario as a<br />
reactive adaptation option. The results show the benefit of proactive adaptation versus reactive<br />
adaptation (figure 3).<br />
Fig. 2: Trends of <strong>to</strong>tal costs in Germany in A1FI Fig. 3: Proactive versus reactive adaptation
Costs of sea-level rise under different climatic and socio-economic scenarios 103<br />
The main trends between the scenarios are nearly the same but the costs will be highest in the A1FI<br />
scenario and lowest in the B2 scenario. The main contribu<strong>to</strong>rs <strong>to</strong> the damage costs are salinity<br />
intrusion in<strong>to</strong> deltas and estuaries, sea flood costs and within the no adaptation scenario migration<br />
costs. The main contribu<strong>to</strong>rs <strong>to</strong> the adaptation costs are sea dike costs, beach and tidal basin<br />
nourishment. The percentage distribution of the contribu<strong>to</strong>rs is extremely different between the<br />
countries reflecting the different physical conditions and main hazards.<br />
The A2 scenario is not the most vulnerable scenario for the three countries studied in this thesis<br />
despite its high population growth because these countries have a declining population.<br />
The most vulnerable country in this work based on size, population and GDP compared <strong>to</strong> the costs is<br />
the Netherlands followed by the UK and lastly Germany.<br />
4 Discussion and conclusion<br />
The results reflect how the projected future the socio-economic- and the climatic development in the<br />
countries <strong>to</strong>gether with climate change contribute <strong>to</strong> the impacts <strong>to</strong> climate change. They outline the<br />
large impact of different socio-economic developments and show that the impacts of sea-level rise are<br />
only detectable after 2030. The results also show that even if a country have a high adaptive capacity<br />
like all three countries used in this work the protection level will fall over time if they are not adjusted<br />
<strong>to</strong> climate change which will lead <strong>to</strong> an increase of impacts and costs.<br />
For the interpretation of the DIVA results there are three key limitations <strong>to</strong> be aware of. Firstly, the<br />
DIVA model is a global model. Due <strong>to</strong> a spacious data resolution DIVA is not suitable <strong>to</strong> be used on<br />
smaller scales than on country level. Secondly, there are more adaptation options available than<br />
implemented in DIVA and thirdly, the assessment of DIVA is limited because it only represents a subset<br />
of possible impacts. Besides these limitations the results are in a logical context <strong>to</strong> the physical and<br />
socio-economic conditions of the countries and scenarios applied and yield information about the<br />
nature of the most serious impacts, about the possible affected land area, and about the number of<br />
people at risk as well as about vulnerable hotspots.<br />
References<br />
Daschkeit, A. & H. Sterr (2003): Klimawandel in <strong>Küsten</strong>zonen. In: UWSF 2003b (3): 199–207.<br />
Rahms<strong>to</strong>rf, S., A. Cazenave, J. Church, J. Hansen, R. Keeling, D. Parker & R. Sommerville (2007): Recent<br />
climate observations compared <strong>to</strong> projections. In: Science 315: 1529–1532.<br />
Acknowledgement<br />
The work has been carried out within my diploma thesis supervised by Prof. Dr. A. Vafeidis.<br />
Address<br />
Heike Munderloh<br />
Christian-Abrechts University of Kiel - Department of Geography<br />
Ludewig-Meyn-Str. 14<br />
24098 Kiel, Germany<br />
heike_munderloh@web.de
106 Hofstede<br />
Implementing CFRM through controlling the damage expectations in coastal lowlands is increasingly<br />
getting attention in science and administration (CPSL 2005, Hofstede 2007a). So far, such options<br />
have only exceptionally been implemented in Germany. In contrast <strong>to</strong> technical flood defences, these<br />
solutions may cause development constraints in the coastal lowlands and result in more personal<br />
responsibilities and higher efforts for the affected population. The possible consequences of climate<br />
change for maintaining the existing safety standards and other possible constraints of flood defences<br />
justify the evaluation of alternative and complementary options for CFRM.<br />
In this paper, after a short discussion of sea level rise scenarios, possible constraints of technical flood<br />
defences are described. Further, the CFRM cycle as a holistic and integrated approach is elaborated in<br />
detail. The paper ends with an outlook.<br />
2 Sea level rise scenarios<br />
Anthropogenic sea level rise (SLR) will result in higher s<strong>to</strong>rm surge water levels and, therewith, in<br />
higher coastal flood risks. The fourth assessment report of the Integovernmental Panel on Climate<br />
Change (IPCC 2007) delivered a range of global SLR scenarios. Depending on the models and<br />
emission scenarios, the values range from 0.19 <strong>to</strong> 0.58 m of SLR between 1980/99 and 2090/99<br />
Accelarated melting of the Greenland icecap may contribute up <strong>to</strong> 0.2 m of extra SLR <strong>to</strong> these values.<br />
In its report of 2007, IPCC pinpoints a number of uncertainties and unknown fac<strong>to</strong>rs that may cause<br />
deviations from the published values. For example, IPCC states that dynamical processes related <strong>to</strong> ice<br />
flow on Greenland and the West Antarctic Peninsula that are not included in current models but<br />
suggested by recent observations could increase the vulnerability of the ice sheets <strong>to</strong> warming, thereby<br />
increasing future SLR (Shepard and Wingham 2007). Understanding of these processes is limited and<br />
there is no consensus on their magnitude. Other unknown fac<strong>to</strong>rs that are recently discussed are the<br />
possibly reduced capacity of the oceans and tropical rain forests <strong>to</strong> s<strong>to</strong>re carbon dioxide as well as<br />
possible emissions of nitrous oxides (laughing gas) from the ocean floors and the permafrost regions.<br />
Laughing gas is a highly effective greenhouse gas. Both meachnisms may result in increased SLR. On<br />
the other hand, if fresh water input in the North Atlantic Ocean from the melting icecap on Greenland<br />
increases substantially, a blocking off of the Gulf Stream could occcur. Previous models (on the basis<br />
of moderate fresh water input) suggest that this hazard only has a very low probability in this century.<br />
An expert judgement from leading climate researchers (Zickfeldt et al. 2007) yielded the following<br />
result. If global temperature increases by 4o C, two third of the respondents estimated the probability<br />
of a collaps of the Gulf Stream in this century among 10 and 60 %. A collaps could result in a<br />
reduction in SLR, at least in the North Atlantic region (as well as in a recovery of the Arctic marine<br />
ice cover). Finally, SLR will not terminate at the end of this century but is expected <strong>to</strong> continue for<br />
centuries. Quantification is highly uncertain as it includes even more unknown fac<strong>to</strong>rs.<br />
The unknown fac<strong>to</strong>rs give way <strong>to</strong> a number of alternative SLR scenarios (table 1).<br />
Table 1: Sea level rise scenarios (in m) from different authors<br />
Author Regional (2100) Global (2100) Global (2200) Global (2300)<br />
IPCC (2007) - 0.19 - 0.58 - -<br />
Rahms<strong>to</strong>rf (2007) - 0.5 - 1,4 - -<br />
MPI (2006) 0.41 – 0.48 (North Sea) -<br />
WBGU (2006) - - - 2.5 – 5.1<br />
Hor<strong>to</strong>n et al. (2008) - 0.54 - 0.89 - -<br />
Delta Commissie (2008) 0.65 - 1.30 (NL coast) 0.55 - 1,10 1.5 - 3.5 -<br />
Grinsted et al. (2009) - 0.9 - 1.3 (A1B) - -
<strong>From</strong> coastal flood defence <strong>to</strong>wards coastal flood risk management 107<br />
Rahms<strong>to</strong>rf (2007) published a semi-empirical approach <strong>to</strong> estimate SLR among 1990 and 2100. His<br />
relationship connects observed global SLR <strong>to</strong> observed global mean surface temperature rise during<br />
the 20th century. Applying this relationship for the IPCC temperature scenarios, Rahms<strong>to</strong>rf delivered<br />
SLR projections until 2100 among 0.5 and 1.4 m. His approach is controversially discussed in the<br />
scientific community. The Max-Planck-Institute for Meteorology (MPI 2006) delivered global SLR<br />
projections among 0.21 and 0.28 m until 2100. They calculated that changes in the ocean circulation<br />
may lead <strong>to</strong> an extra SLR of about 0.2 m in the North Sea. If global temperature increase is limited <strong>to</strong><br />
3°C, the Scientific Advisory Board of the German Government on Global Environmental Changes<br />
(WBGU 2006) expects a long-term SLR until 2,300 among 2.5 and 5.1 m, mainly due <strong>to</strong> melting of<br />
the large icesheets on Greenland and the West Antarctic Peninsula. Hor<strong>to</strong>n et al. (2008) applied the<br />
semi-empirical relationship from Rahms<strong>to</strong>rf <strong>to</strong> the coupled global climate models that were used for<br />
the fourth IPCC report. With a mean of 0.71 m, the resulting global scenario values ranged among<br />
0.54 and 0.89 m. Hor<strong>to</strong>n et al. (2008) states that: “Both the IPCC values and the semi-empirical SLR<br />
projections are likely <strong>to</strong> underestimate future SLR if recent trends in the Polar Regions accelerate.”<br />
Grinsted et al. (2009) used a physically plausible four parameter linear response equation <strong>to</strong> relate<br />
2,000 years of global temperatures and sea level. Future sea level was projected from IPCC<br />
temperature scenarios and past sea level from multi-proxy reconstructions (assuming that the<br />
established relationship between temperature and sea level holds from 200 <strong>to</strong> 2100). In result, SLR<br />
until 2090/99 was projected <strong>to</strong> be 0.9 <strong>to</strong> 1.3 m for the IPCC A1B scenario, with low probability of the<br />
rise being within IPCC confidence limits. In 2007, the Dutch Government installed an independent<br />
Delta Commission with the merit <strong>to</strong> evaluate and recommend possible flood risk adaptation strategies<br />
and measures (Delta Commissie 2008). The Commission decided <strong>to</strong> apply regional “worst-case<br />
scenarios” varying among 0.65 and 1.3 m of SLR until 2100 and among 2 and 4 m until 2200.<br />
<strong>From</strong> this discussion it becomes clear that SLR will probably be higher than the lower IPCC values; a<br />
range among 0.5 and 1.4 m may be more realistic. Apart from the magnitude, the large range calls for<br />
flexible and sustainable (i.e., no-regret) adaptation measures and strategies. With respect <strong>to</strong> the starting<br />
date for most SLR projections (1990), it is interesting <strong>to</strong> note that, at least along the Dutch and<br />
German coasts, in 2008 (i.e., after 20 % of projection period) no indications of an accelerating SLR<br />
could be observed (figure 2; Hofstede 2007b).<br />
1900 1920 1940 1960 1980 2000<br />
Jahre<br />
Figure 2: Development of mean sea level since 1900 AD along the Baltic and North Sea coastlines of Germany<br />
and the Netherlands, averaged from 17 long-term tidal gauge stations (Hofstede 2007b)<br />
Apart from SLR, meteorological processes control the height of future s<strong>to</strong>rm surge water levels and,<br />
therewith, the necessary dimensions of flood defences. According <strong>to</strong> Woth et al. (2006), s<strong>to</strong>rm surges<br />
10<br />
5<br />
0<br />
-5<br />
-10<br />
-15<br />
-20<br />
Mittlerer Meeresspiegel (NN +cm)
108 Hofstede<br />
in the Inner German Bight may become up <strong>to</strong> 0.4 m higher in the period 2071-2100 compared <strong>to</strong> 1980-<br />
1999. Grosmann et al. (2006) included projections for SLR and came with a mean extreme water level<br />
projection of 0.50 m in 2085 for the city of Cuxhaven at the mouth of the Elb-estuary. Depending on<br />
the models and emission scenarios applied, the values range from 0.42 <strong>to</strong> 0.61 m. For Hamburg, the<br />
corresponding values amount <strong>to</strong> 0.48, 0.63 (mean) and 0.82 m. As with the SLR projections, these<br />
values include many uncertainties and assumptions. Further, due <strong>to</strong> the governing meteorological<br />
processes, the projections show strong local variations. For the German Baltic Sea coast, no<br />
projections are available.<br />
3 Constraints of the present approach<br />
CFRM in Germany focusses mainly on flood defences. Due <strong>to</strong> the fact that almost 2.5 million<br />
inhabitants of the coastal lowlands rely upon flood defences, maintaining and adapting these defences<br />
will remain a corner s<strong>to</strong>ne of CFRM in Germany. Dike relocation on a large scale would be financially<br />
unfeasible and ecologically unfavourable (e.g., huge costs and vast energy consumption <strong>to</strong> relocate<br />
people and activities, creation of extensive – former natural – areas for housing, infrastructure and<br />
other purposes). It is highly probable that such a massive migration would cause major economic and<br />
social disruption. Finally, at least for administration, it is clear that acceptance of the affected cannot<br />
be expected. On a local scale, dike relocations may be attractive, especially when they increase coastal<br />
resilience against climate change, when they have positive ecological effects and when the area is<br />
uninhabited. Some successful examples of dike relocation in Germany exist, for example on the<br />
barrier island Langeoog, at Geltinger Birk outer Flensburg Fjord and at the Karrendorfer Wiesen near<br />
Greifswald.<br />
Technical flood defences underly a number of constraints.<br />
� Flood defences are designed <strong>to</strong> withstand a defined maximum s<strong>to</strong>rm surge water level (figure 3).<br />
This level does not only result from technical elaborations, but also includes financial and social<br />
considerations. The result is a safety standard that is accepted by society. Higher water levels and<br />
other loading cases (e.g. terror attack, ice load) may result in failure of the structure and flooding.<br />
Hence, technical flood defences cannot guarantee absolute safety. The residual risk needs <strong>to</strong> be<br />
managed (Oumeraci 2005).<br />
Figure 3: Dimensions of a State dike in Schleswig-Holstein
<strong>From</strong> coastal flood defence <strong>to</strong>wards coastal flood risk management 109<br />
� The safety level directly depends on the willingness of society <strong>to</strong> spend money on flood defence.<br />
This willingness is governed by the awareness for coastal flood risks that rapidly sinks with time<br />
passing by since the last flooding event. Low public budgets <strong>to</strong>gether with low risk awareness may<br />
reduce the funds available for flood defences. Although it is questionable that a (politically) fixed<br />
safety standard will officially be reduced, a cut in financial means may lead <strong>to</strong> this. Examples are<br />
neglected maintenance or delayed strengthening of the defences (determined by SLR).<br />
� Climate change and its consequences may reveal the financial limits of technical flood defences.<br />
Above a certain threshold the necessary financial efforts <strong>to</strong> maintain safety standards could<br />
become unacceptable for society. In this case, alternative and additional coastal risk management<br />
options become inevitable. It should be stated that technical solutions <strong>to</strong> counteract a SLR of<br />
several meters in a long-term perspective exist.<br />
� Technical flood defences interfere with nature and may reduce the natural resilience of the coasts<br />
with respect <strong>to</strong> SLR. Examples are the fixation of the coastline in an unfavourable and artificial<br />
location or the interruption of natural sand redistribution patterns. Hence, wherever possible,<br />
natural hydromorphological processes should be allowed or furthered. In this case, however,<br />
alternative measures <strong>to</strong> reduce the risk of flooding (i.e., the damage expectations) of the hinterland<br />
may become necessary.<br />
Apart from these constraints, focussing on (ever higher) dikes has some inherent disadvantages. The<br />
higher the dike, the stronger the inundation processes (currents, water depths) after dike breach, and<br />
the more severe the consequences will be. Further, high and strong dikes may lead <strong>to</strong> the (false)<br />
impression of absolute safety. Hence, the dependence on one single measure or dike line makes<br />
society more vulnerable.<br />
4 The coastal flood risk management cycle<br />
<strong>From</strong> the above considerations it becomes clear that a sec<strong>to</strong>ral approach <strong>to</strong>wards CFRM that only<br />
focuses on technical measures is not sufficient. The challenges arising from climate change as well as<br />
the constraints of technical structures imply that the classical flood defence schemes should be an<br />
integral part of a holistic management that combines technical measures with non-structural methods<br />
(Hofstede et al. 2005a). Sustainable CFRM may be defined as a cycle (control loop) that consists of<br />
six integral components: prevention, protection, preparedness, emergency response, recovery, and<br />
review (figure 4).<br />
Recovery<br />
Review<br />
Emergency<br />
response<br />
Coastal Coastal<br />
Risk Risk<br />
Management<br />
Management<br />
Cycle Cycle<br />
Figure 4: The coastal risk management cycle (Hofstede 2007a)<br />
Prevention<br />
Preparedness<br />
Awareness<br />
Protection
110 Hofstede<br />
Prevention <strong>to</strong> avoid or minimize damages from flooding. As stated in the introduction, coastal<br />
flooding is a natural event. Some environments like salt marshes depend on regular inundations.<br />
Flooding becomes a hazard when society starts <strong>to</strong> utilize the flood-prone area for infrastructure,<br />
housing, etc. Controlling the development in flood-prone coastal lowlands is, thus, the first step in the<br />
CFRM cycle.<br />
Main <strong>to</strong>ol <strong>to</strong> control utilization of coastal lowlands is spatial planning. It constitutes a formalized and<br />
systematic way <strong>to</strong> influence (regulate) the distribution of people and activities geographically. The<br />
guiding principle of spatial plans and programs is a sustainable spatial utilization and development<br />
which balances the social and economic requests upon a region with its ecological functions (ROG<br />
1998). Spatial planning in Germany is realized at regional, State and national levels. At the local level,<br />
municipalities are responsible for building or <strong>to</strong>wn planning. The local and regional levels have the<br />
most potential for CFRM.<br />
On a local level, specific regulations for building areas may substantially reduce damage expectations<br />
due <strong>to</strong> coastal flooding. For example, in the 1970ies, a new building area was established near the<br />
Baltic Sea in Germany. Flood defence consisted of relatively low dikes. To keep damage expectations<br />
low, in the local building code, it was regulated that living room should be realized in the upper floors.<br />
On ground-floor level, only garages and/or s<strong>to</strong>rage rooms were allowed. Three decades later, these<br />
stipulations are not abided anymore. The absence of flooding events and lacking risk communication<br />
resulted in very low risk awareness and corresponding behaviour. Another actual example is the<br />
“Hafencity Hamburg”. This new building area lies outside the public flood defence line in the harbour<br />
area of Hamburg. In the building code for the area it is stipulated that the whole area has <strong>to</strong> be raised<br />
up <strong>to</strong> a level that cannot be reached by extreme floods. This regulation became well-known as the<br />
“dwelling-mound-principle”. In order <strong>to</strong> control the residual risks (see chapter 3), houses at the<br />
waterfront should have special arrangements for flooding, and evacuation routes are foreseen.<br />
On a regional level, the identification of buffer zones and flood hazard zones constitute promising<br />
non-structural measures <strong>to</strong> control coastal flood risks (CPSL 2005). Coastal buffer zones, demarcated<br />
by setback lines in spatial plans may provide protected zones between the sea and the hinterland,<br />
where human utilization and development are strongly restricted. As the term “buffer” already implies,<br />
this measure provides a zone that allows for retreat of the coastal flood defence line or reserves space<br />
for necessary flood defence measures. In this way, the natural resilience of the coast is enhanced as<br />
well. In coastal flood hazard zones, human activities can be managed (regulated) in such a way that<br />
the vulnerability of the area is reduced. This could be realized by specific requirements or<br />
recommendations defined in the spatial plans. For example, certain roads could be constructed in<br />
elevated position (like dams) <strong>to</strong> allow for evacuation and <strong>to</strong> limit the inundated area. In specific high<br />
hazard zones, the “dwelling-mound-principle” for new building areas could be prescribed. The simple<br />
fact that flood hazard zones are depicted in the spatial plans could already increase the awareness of<br />
the risk.<br />
Protection constitutes the second element of the CFRM cycle. It becomes necessary when flood-prone<br />
lowlands are utilized or, rather, when potential flooding is perceived by society as a threat <strong>to</strong> life and<br />
property. As stated before, with respect <strong>to</strong> the 2.5 million inhabitants of coastal lowlands, protection<br />
by technical flood defences will remain a corner s<strong>to</strong>ne in future CFRM in Germany. With reference <strong>to</strong><br />
climate change and SLR, reserving space for strengthening campaigns by depicting buffer zones in<br />
regional plans is a sustainable measure.<br />
Necessary measures may be implemented in a more sustainable way that minimizes the impacts on<br />
ecology and the natural resilience of the coasts. CPSL (2005) list a number of such solutions like<br />
performing sand nourishments (figure 5) <strong>to</strong> balance SLR as well as dune management techniques <strong>to</strong><br />
stabilize and sustain the dune systems as natural flood defences. Necessary dike maintenance and<br />
strengthening may be performed in a sustainable way that minimizes the ecological interferences.<br />
Coastal defence administration already implements this minimizing principle, e.g. by performing dike
<strong>From</strong> coastal flood defence <strong>to</strong>wards coastal flood risk management 111<br />
relocations where appropriate (see above), by strengthening dikes <strong>to</strong> the landward side and by taking<br />
the necessary clay from the inland (wherever possible). Unavoidable interferences with nature are<br />
compensated.<br />
Figure 5: Sand nourishment on the island of Sylt (Germany)<br />
With respect <strong>to</strong> the large uncertainties in the scenarios, more flexible (no-regret) flood defence<br />
measures are investigated and implemented. Sand nourishments balance the observed SLR or, rather,<br />
the sediment deficit resulting from SLR (figure 5). If SLR increases, more sand may be deposited and<br />
vice versa. Nourihments, thus, present a flexible no-regret measure. Further, they increase the natural<br />
resilience of the coast and pose a relatively low impact on nature. On the other hand, strengthening a<br />
dike for an expected SLR of 1.5 m may turn out <strong>to</strong> be highly ineffective, namely if SLR takes two<br />
centuries <strong>to</strong> reach this level. In this case, it is much more cost-effective <strong>to</strong> spread the costs over the<br />
centuries by performing two or three strengthening campaigns. Considering building reserves (for<br />
extra heighthening) may be more appropriate and flexible. In its almost finished strengthening<br />
campaign, the city of Hamburg included a static building reserve of 0.8 m <strong>to</strong> allow for future<br />
heighthening of its flood defences (sheet pile walls, sluices, etc.).<br />
Preparedness, being the third component in the CFRM cycle, is closely related <strong>to</strong> risk awareness.<br />
Aware people are prepared <strong>to</strong> personally undertake preventive and emergency actions. Further, they<br />
(are prepared <strong>to</strong>) accept the high costs for flood defences and other possible constraints of CFRM like<br />
flood-proof housing or living in the upper floor. In consequence, appropriate coastal risk awareness or,<br />
rather, a high level of preparedness may significantly reduce the damages resulting from flooding. The<br />
main <strong>to</strong>ol <strong>to</strong> achieve coastal risk awareness (apart from flooding) is risk communication.<br />
A public opinion poll consisting of 2,000 questionnaires that were distributed in five coastal <strong>to</strong>wns<br />
around the North Sea showed that the awareness for coastal risks is not well developed (Hofstede et al.<br />
2005b). Although the cities are situated in protected coastal lowlands, 30 % of the 411 respondents<br />
thought that their house could not be flooded after dike-breach (figure 6). Furthermore, 90 % of the<br />
respondents who estimated the probability of flooding in their region <strong>to</strong> be very high had not taken any<br />
precautionary measures. This indicates that the information flow about the risk <strong>to</strong>wards the population<br />
is either insufficient, does not reach the recipients or is not taken seriously (ignored or disclaimed).<br />
The study concluded that there is an apparent deficit in coastal risk communication.
<strong>From</strong> coastal flood defence <strong>to</strong>wards coastal flood risk management 113<br />
administration is the next chain that guarantees a certain safety standard in the utilized flood-prone<br />
lowlands (protection). Disaster management – the third administrative body in the chain – starts with<br />
preparation, mainly through risk communication (but also by training and exercising). Conducting<br />
emergency response measures (from warnings till aftercare) is the second and main task of disaster<br />
management. Rebuilding society after the disaster (recovery) is not a public responsibility and, last but<br />
not least, the reviewing process is a task for all responsible authorities.<br />
<strong>From</strong> the above elaborations it becomes clear that all CFRM elements complement one another. For<br />
example, depicting buffer zones in spatial plans facilitates the long-term implementation of coastal<br />
flood defence. Raising awareness by effective information or “intelligent” recovery inceases the<br />
acceptance of necessary planning measures like living in the second floor. Vice versa, the depiction of<br />
flood hazard zones in spatial plans increases the awareness and preparedness. Finally, an appropriate<br />
reviewing process is prerequisite for developing optimal information <strong>to</strong>ols like travel exhibitions.<br />
Hence, in combination, the six integral components present a holistic approach <strong>to</strong>wards CFRM.<br />
5 Outlook<br />
Justified by the common goal (controlled coastal flood risks), the complementary character of and the<br />
interactions among the elements, holistic implementation of the cycle is a precondition <strong>to</strong> achieve<br />
sustainable CFRM. This fact is acknowledged by the EU-Flood Directive. Purpose of this Directive is<br />
<strong>to</strong> establish a framework for the assessment and management of flood risks, aiming at the reduction of<br />
the adverse consequences for human health, the environment, cultural heritage and economic activity<br />
associated with floods in the Community. Based upon a preliminary flood risk assessment, flood risk<br />
areas shall be delineated. For these areas, flood hazard and risk maps as well as flood risk management<br />
plans shall be established. Focussing on prevention, protection and preparedness, all aspects of the<br />
CFRM cycle should be addressed in these plans. In order <strong>to</strong> achieve tailor-made solutions and <strong>to</strong> raise<br />
risk awareness, Member States shall make all products available <strong>to</strong> the public. Further, active<br />
involvement of interested parties in the production, review and updating of the flood risk management<br />
plans shall be encouraged. Concordingly, the implementation requires close coordination among<br />
competent authorities (coastal flood defence, disaster management, spatial planning) and active<br />
involvement of the affected parties. In Germany, where public procedures still show sec<strong>to</strong>ral aspects,<br />
the Flood Directive may be seen as a chance.<br />
This paper focusses on public-administrational aspects of CFRM. It is evident <strong>to</strong> realize that the most<br />
important partners in CFRM are the affected; the inhabitants and private inves<strong>to</strong>rs in the coastal<br />
lowlands. Only if they adequately perceive the risks, accept their personal responsibility, and act<br />
accordingly, coastal flood risks remain manageable and a long-term sustainable development in the<br />
coastal lowlands is possible.<br />
References<br />
Alexander, D. (2002): Principles of emergency planning and management. Terra publishing, Harpenden, p. 3<strong>16</strong>.<br />
CPSL (2005): Solutions for a sustainable coastal protection in the Wadden Sea region. Wadden Sea Ecosystem<br />
21, 47 p.<br />
Delta Commissie (2008): Samen werken met water – een land dat leeft, bouwt aan zijn <strong>to</strong>ekomst. Den Haag, 134<br />
p. (www.deltacommissie.com).<br />
Grinsted, A., J.C. Moore & S. Jevrejeva (2008): Reconstructing sea level from paleo and projected temperatures<br />
200 <strong>to</strong> 2100 AD. In: Climate Dynamics 34 (4): 461–472.<br />
Grossmann, I.; K. Woth, H. v. S<strong>to</strong>rch (2006): Localization of global climate change: s<strong>to</strong>rm surge scenarios for<br />
Hamburg in 2030 and 2085. In: Die Küste 71: <strong>16</strong>9–182.
114 Hofstede<br />
Hofstede, J.L.A. et al. (2005a): COMRISK - Common strategies <strong>to</strong> reduce the risk of s<strong>to</strong>rm floods in coastal<br />
lowlands: a synthesis. In: Hofstede (ed.): COMRISK – common strategies <strong>to</strong> reduce the risk of s<strong>to</strong>rm floods<br />
in coastal lowlands. Die Küste special edition 70: 133–150.<br />
Hofstede, J.L.A. et al. (2005b): Risk perception and public participation – COMRISK subproject 3. In: Hofstede<br />
(ed.): COMRISK – common strategies <strong>to</strong> reduce the risk of s<strong>to</strong>rm floods in coastal lowlands. Die Küste<br />
special edition 70: 33–46.<br />
Hofstede, J.L.A. (2007a): <strong>Küsten</strong>schutz im <strong>Küsten</strong>risikomanagement. In: Hansa 2007 (6): 102–104.<br />
Hofstede, J.L.A. (2007b): Entwicklung des Meeresspiegels und der Sturmfluten: ist der anthropogene<br />
Klimawandel bereits sichtbar? In: <strong>Coastline</strong> <strong>Reports</strong> 9: 139–148.<br />
Hor<strong>to</strong>n, R. et al. (2008): Sea level rise projections for current generation CGCMs based on the semi-empirical<br />
method. In: Geophysical Research Letters 35, L02715, doi: 10.1029/2007GL032486.<br />
IPCC – Intergovernmental Panel on Climate Change (2001): Climate Change 2001: the scientific basis –<br />
summary for policy makers. (http:\\www.ipcc.ch).<br />
IPCC – Intergovernmental Panel on Climate Change (2007): Climate Change 2007: the Physical Science base -<br />
summary for policy makers. (http:\\www.ipcc.ch).<br />
MPI – Max-Planck-Institut für Meteorologie (2006): Klimaprojektionen für das 21. Jahrhundert. Hamburg, 32 p.<br />
Oumeraci, H. (2005): Integrated risk-based design and management of coastal defences. In: Hofstede (ed.):<br />
COMRISK – common strategies <strong>to</strong> reduce the risk of s<strong>to</strong>rm floods in coastal lowlands. Die Küste special<br />
edition 70: 151–172.<br />
Probst, B. (1994): <strong>Küsten</strong>schutz 2000 - neue <strong>Küsten</strong>schutzstrategien erforderlich? In: Wasser und Boden 11: 54–<br />
59.<br />
Rahms<strong>to</strong>rf, S. (2007): A semi-empirical approach <strong>to</strong> projecting future sea level rise. In: Science 315: 368–370.<br />
ROG (1998): Raumordnungsgesetz Deutschland. Berlin, 14 p.<br />
Shepard, A. & D. Wingham (2007): Recent sea-level contributions of the Antarctic and Greenland ice sheets. In:<br />
Science 315: 1529–1532.<br />
WBGU – Wissenchaftliche Beirat der Bundesregierung, Globale Umweltveränderungen (2006): Die Zukunft der<br />
Meere – zu warm, zu hoch, zu sauer. Berlin, 130 p.<br />
Woth, K., R. Weisse & H. v. S<strong>to</strong>rch (2006): Climate change and North Sea s<strong>to</strong>rm surge extremes: an ensemble<br />
study of s<strong>to</strong>rm surge extremes expected in a changed climate projected by four different regional climate<br />
models. In: Ocean Dynamics, doi: 10.1007/s10236005-0024-3.<br />
Zickfeldt, K. et al. (2007): Expert judgement on the response of the Atlantic meridional overturning circulation<br />
<strong>to</strong> climate Change. In: Climate Change 82:235–265.<br />
Address<br />
Jacobus Hofstede<br />
Schleswig-Holstein State Ministry for Agriculture, the Environment and Rural Areas<br />
Merca<strong>to</strong>rstraße 3,<br />
D-24106 Kiel, Germany<br />
jacobus.hofstede@mlur.landsh.de
1<br />
Lan<br />
2<br />
La<br />
Abstracct<br />
Schwarzerr,<br />
Schrottke & Stattegger (eeds.):<br />
<strong>From</strong> Brazzil<br />
<strong>to</strong> <strong>Thailand</strong> – New Resultts<br />
in Coastal Research R<br />
<strong>Coastline</strong>e<br />
<strong>Reports</strong> <strong>16</strong> ( (<strong>2010</strong>), ISSN 00928-2734,<br />
IS SBN 978-3-9811839-9-3<br />
S. 115-1266<br />
NNeue<br />
Heraausforderrungen<br />
im m Datenmanagemennt<br />
für daas<br />
europääische<br />
Meeresmonii<strong>to</strong>ring<br />
ndesbetrieb fürr<br />
<strong>Küsten</strong>schuttz,<br />
Nationalpaark<br />
und Meere esschutz Schleeswig-Holsteinn<br />
(LKN), Germ many<br />
andesamt für LLandwirtschafft,<br />
Umwelt undd<br />
ländliche Rä äume Schleswwig-Holstein<br />
(LLLUR),<br />
Germ many<br />
Thhe<br />
increasing ppressure<br />
on thhe<br />
intensively used coastal and a marine areeas<br />
demands a thematic cro oss-<br />
analysis<br />
of all required dataa<br />
for the conservation<br />
of habitats, theirr<br />
functioning and protecti ion.<br />
Addditional<br />
needds<br />
for a commmon<br />
marine data<br />
infrastructu ure are the inccreasing<br />
compplexity<br />
of curr rent<br />
quuestions<br />
targetting<br />
anthropoggenic<br />
changess<br />
in marine ec cosystems, gloobal<br />
change aand<br />
the result ting<br />
challenges<br />
for coastal proteection.<br />
Not leeast<br />
the repo orting obligations<br />
for the main Europe ean<br />
dirrectives<br />
in thee<br />
marine area,<br />
as for the EUU<br />
Water Fram mework Direcctive,<br />
the Florra-Fauna-Habitat<br />
Diirective<br />
and inn<br />
particular thhe<br />
Marine Strrategy<br />
Framew work Directive,<br />
recently enntered<br />
in<strong>to</strong> for rce,<br />
strrongly<br />
require a certain dataa<br />
managementt.<br />
Att<br />
the same timme<br />
data of the mmarine<br />
moni<strong>to</strong>oring<br />
accordin ng <strong>to</strong> the INSPPIRE<br />
Directivve<br />
(Infrastruct ture<br />
forr<br />
Spatial Infoormation<br />
in EEurope)<br />
shouuld<br />
be provid ded for a commmon<br />
use. TThis<br />
requires an<br />
inffrastructure<br />
aand<br />
appropriaate<br />
software <strong>to</strong>ols, which join the tecchnical<br />
capabbilities<br />
with the<br />
reqquirements<br />
of f EU directivess.<br />
Immportant<br />
netwoorking<br />
compoonents<br />
have allready<br />
been developed d withhin<br />
the Northh-<br />
and Baltic Sea S<br />
Cooastal<br />
Informaation<br />
Systemm<br />
(NOKIS) annd<br />
also at th he participatinng<br />
data nodes<br />
of the cent tral<br />
goovernment<br />
andd<br />
the federal states<br />
by develloping<br />
local data d infrastructtures.<br />
Since thhese<br />
do not meet m<br />
alll<br />
requirements,<br />
the projectt<br />
"MDI DE - Marine dat ta infrastructuure<br />
in Germaany"<br />
will play y a<br />
decisive<br />
role <strong>to</strong> support the inntegration<br />
of ddifferent<br />
techn nical infrastrucctures<br />
and disstributed<br />
skills s of<br />
expperts<br />
on marinne<br />
and coastall<br />
data.<br />
1 Kuurzfassung<br />
und Einleittung<br />
Das Projekt<br />
MD DI-DE<br />
Marine DDaten-Inffrastruktu<br />
ur in Deuutschland<br />
Jörnn<br />
Kohlus 1 & Hans-Chr ristian Reim<br />
mers 2<br />
Der steiggende<br />
Druckk<br />
auf die inteensiv<br />
genutzten<br />
<strong>Küsten</strong>re egionen und Meere erforrdert<br />
zunehm mend eine<br />
themenüübergreifendee<br />
Auswertunng<br />
aller für dden<br />
Erhalt de er Lebensräuume,<br />
ihrer Fuunktionsfähig<br />
gkeit und<br />
den Schhutz<br />
erforderrlicher<br />
Datenn.<br />
Weitere GGründe<br />
für eine e übergreiifende<br />
marinne<br />
Dateninfr rastruktur<br />
sind in der zunehmmenden<br />
Koomplexität<br />
aaktueller<br />
Fra agestellungen<br />
im Zusammenhang<br />
mit den<br />
anthropoogenen<br />
Veräänderungen<br />
mariner Ökkosysteme,<br />
in n der globaalen<br />
Klimavveränderung<br />
und den<br />
daraus rresultierendeen<br />
Anforderuungen<br />
an deen<br />
<strong>Küsten</strong>sc chutz zu sehhen.<br />
Nicht zzuletzt<br />
erfor rdern die<br />
gesetzlicchen<br />
Anfoorderungen<br />
der euroopäischen<br />
Berichtspflichten,<br />
wiee<br />
die de er EU-<br />
Wasserraahmenrichtliinie,<br />
der Floora-Fauna-Haabitat-Richtl<br />
linie sowie iinsbesonderee<br />
der jüngst in Kraft<br />
getretenee<br />
Meeresstraategie-Rahmeenrichtlinie<br />
eein<br />
spezielles s Datenmanaagement.<br />
Dabei soollen<br />
Fachdaten<br />
aus dem<br />
Meeresmmoni<strong>to</strong>ring<br />
na ach Maßgabbe<br />
der überggreifenden<br />
IN NSPIRE-<br />
Richtliniie<br />
(Infrastruucture<br />
for Spatial Infoormation<br />
in n Europe) ffür<br />
eine geemeinsame<br />
Nutzung<br />
herangezzogen<br />
werdeen<br />
können. HHierzu<br />
bedarf f es einer Infr rastruktur unnd<br />
geeigneterr<br />
Softwarewe erkzeuge,<br />
die diesee<br />
technischenn<br />
Möglichkeiten<br />
mit den Anforderung gen aus den EEU-Richtlinien<br />
verbinde et.
1<strong>16</strong><br />
Wichtigee<br />
Bausteinee<br />
zur notwwendigen<br />
VVernetzung<br />
konnten ddurch<br />
das Nord-Ostsee e-<strong>Küsten</strong>-<br />
Informattionssystem<br />
NOKIS mit den beteiligtten<br />
Datenknoten<br />
des Bunndes<br />
und derr<br />
Länder sow wie durch<br />
den Auufbau<br />
lokaleer<br />
Dateninfrrastrukturen<br />
bereits ent twickelt weerden.<br />
Da ddiese<br />
den gestellten g<br />
Anforderungen<br />
ebennfalls<br />
noch nnicht<br />
gerechtt<br />
werden, ko ommt dem Projekt<br />
„MDII-DE<br />
- Marine<br />
Daten<br />
Infrastruuktur<br />
für Deeutschland“<br />
eine wichtigge<br />
unterstütz zende Rollee<br />
bei der Zuusammenfüh<br />
hrung der<br />
technischhen<br />
Infrastruukturen<br />
und verteilten KKompetenzen<br />
n der Expertten<br />
für Meerres-<br />
und Küs stendaten<br />
zu.<br />
2 Aufbau<br />
und ZZiele<br />
der MMDI-DE<br />
Einen wwesentlichen<br />
Ans<strong>to</strong>ß zumm<br />
Aufbau einner<br />
Marinen Dateninfrasttruktur<br />
in Deutschland<br />
haben h die<br />
nachfolggend<br />
beschhriebene<br />
Abbkommen<br />
und EU-R Richtlinien und die damit verb bundenen<br />
Berichtspflichten<br />
geggeben.<br />
Abkommmen<br />
und RRichtlinien<br />
zum Schuttz<br />
der Meer resumwelt<br />
Generelll<br />
muss zwiscchen<br />
den tradditionellen<br />
MMeeresschutz<br />
zabkommen wwie<br />
HELCOOM,<br />
OSPAR und dem<br />
TMAP ssowie<br />
den voon<br />
der Europäischen<br />
Unioon<br />
erlassenen n Richtlinienn<br />
(s. u.) unterrschieden<br />
we erden. Im<br />
Gegensaatz<br />
zu den EEU-Richtlinieen<br />
können ddurch<br />
die Ab bkommen nuur<br />
Empfehluungen<br />
ausges sprochen,<br />
jedoch kkeine<br />
gesetzliich<br />
wirksameen<br />
Beschlüssse<br />
verabschie edet werden. .<br />
HELCOOM<br />
HELCOM<br />
selbst ist eine zwischhenstaatlichee<br />
Kommissio on, die für dden<br />
Schutz dder<br />
Meeresuumwelt<br />
im OOstseeraum<br />
aagiert.<br />
Gegrüündet<br />
wurde die Kommission<br />
von deen<br />
Ostsee-AAnrainern.<br />
DDas<br />
entsprechhende<br />
Abkommmen<br />
wurde<br />
1992 veraabschiedet<br />
unnd<br />
trat im Jaahre<br />
2002 inn<br />
Kraft.<br />
OSPARR<br />
OSPAR (auch OSPPARCOM)<br />
iist<br />
die Abküürzung<br />
für das Übereinnkommen<br />
zuum<br />
Schutz dder<br />
Meeresummwelt<br />
des Noordost-Atlanntiks.<br />
Es ist nach n den beidden<br />
Vorläufeern<br />
benannt, , der Oslo-KKonvention<br />
(OSCOM) von 1972 und u der Parris-Konventiion<br />
(PARCOOM)<br />
von 19774.<br />
Vertragsaabschluss<br />
waar<br />
am 22. Se eptember 19992<br />
in Paris DDer<br />
Begriff wwird<br />
für denn<br />
Vertrag ann<br />
sich und fü für die exeku utive OSPARR-Kommissiion<br />
verwenddet.<br />
Kohlus & Reimers<br />
Trilaterrales<br />
Moni<strong>to</strong>ring-<br />
undd<br />
Bewertunngsprogram<br />
mm (TMAPP)<br />
Im Rahhmen<br />
des trilateral abbgestimmtenn<br />
Beobachtu ungs- und Bewertungss<br />
programmms<br />
(TMAPP;<br />
CWSS 20008),<br />
das seit<br />
1994 ge emeinsam inn<br />
Dänemarkk,<br />
Deutschlland<br />
sowie iin<br />
den Niedeerlanden<br />
im WWattenmeer<br />
umgesetzt wwird,<br />
sind diie<br />
Anforderungen<br />
an ddas<br />
Moni<strong>to</strong>riing<br />
bereits ssehr<br />
konkret t festgelegt worden. Auuf<br />
Basis deer<br />
dringlichenn<br />
Problemfelder<br />
und denn<br />
bereits bek kannten Wirkkungsgefügen<br />
wurde eeine<br />
Auswahhl<br />
der zu errfassenden<br />
PParametern<br />
festgelegt. f DDies<br />
sind voor<br />
allem öko ologische<br />
Parameteer,<br />
wie die zeitliche unnd<br />
räumlichee<br />
Verteilung von Vogel-<br />
und Robbenbeständen<br />
n und die<br />
chemischhen<br />
Belastuungen<br />
z. BB.<br />
in Sedimmenten,<br />
abe er auch sozzioökonomissche<br />
Parameter<br />
wie<br />
Besucheerzahlen.<br />
Diee<br />
Daten werrden<br />
nach aabgestimmten<br />
n Methodenn<br />
erhoben unnd<br />
in einer trilateral<br />
einheitlicchen<br />
Datensstruktur<br />
gesppeichert.<br />
Siee<br />
werden all le fünf bis ssechs<br />
Jahre ausgewertet t und die<br />
Ergebnissse<br />
in einemm<br />
Qualitätszuustandsbericht<br />
veröffentlicht<br />
(z. B. Essink et al.<br />
2005). Di ieser gibt<br />
einen Übberblick<br />
überr<br />
die Entwickklung<br />
der erffassten<br />
Param meter, die AAuswirkungenn<br />
z. B. von Nähr- N und<br />
Schads<strong>to</strong>offeinträgen<br />
auf das Ökoosystem<br />
und bietet eine Bilanz B über ddas<br />
Erreichenn<br />
der wattenm meerweit<br />
gemeinsam<br />
formulieerten<br />
Ziele (TTargets)<br />
sowiie<br />
Empfehlun ngen (Recommmendationss)<br />
für ein ver rbessertes
Das Projekt MDI-DE - Marine Daten-Infrastruktur in Deutschland 117<br />
Management. Im Gegensatz zu den Moni<strong>to</strong>ring-Anforderungen und Datenformaten ist die<br />
Berichtsform wenig formalisiert.<br />
Natura2000<br />
Natura 2000 ist ein EU-weites Netz von Schutzgebieten zum Erhalt der in der<br />
EU gefährdeten Lebensräume und Arten. Es setzt sich zusammen aus den<br />
Schutzgebieten der Vogelschutz-Richtlinie und denen der Flora-Fauna-Habitat-<br />
Richtlinie.<br />
Flora-Fauna-Habitat-Richtlinie (FFH)<br />
Die FFH-Richtlinie (Richtlinie 92/43/EWG) sieht nicht nur die Einrichtung eines einheitlichen,<br />
europaweiten Schutzgebietsnetzes vor, in denen ein Mindestschutz gewährleistet und Eingriffe und<br />
Veränderungen zuvor auf ihre Verträglichkeit mit den Schutzzielen hin geprüft werden. Es sollen auch<br />
Schutzregelungen für europaweit gefährdete Arten mit großräumig genutzten Lebensräumen getroffen<br />
werden, die nicht durch Schutzgebiete geschützt werden können.<br />
Die Mitgliedstaaten müssen regelmäßig alle sechs Jahre über den Stand der Umsetzung, die Situation<br />
der Lebensraumtypen und Arten in und außerhalb der FFH-Gebiete sowie über ergriffene<br />
Schutzmaßnahmen berichten. Die Berichtsform ist EU-weit standardisiert vorgeschrieben.<br />
Vogelschutz-Richtlinie (VSR)<br />
Bereits in der 1979 in Kraft getretenen Vogelschutzrichtlinie (Richtlinie 79/409/EWG) ist eine<br />
regelmäßige Berichtspflicht im Abstand von drei Jahren vorgesehen. Die Richtlinie ist mit dem Ziel<br />
des Schutzes wildlebender Vogelarten und ihrer Lebensräume innerhalb der EU erlassen worden. Sie<br />
schreibt die Einschränkung und Kontrolle der Jagd sowie die Einrichtung von Vogelschutzgebieten als<br />
wesentliche Maßnahme zur Erhaltung der Lebensräume von Arten vor und beinhaltet gleichzeitig ein<br />
Verschlechterungsverbot. Seit 1983 wurde aufgrund der herausragenden Bedeutung für viele Watt-<br />
und Wasservogelarten das Gebiet des Schleswig-Holsteinischen Wattenmeers und Nationalparks zum<br />
Vogelschutzgebiet erklärt.<br />
Abb. 1: Moni<strong>to</strong>ring der NATURA2000 Programme
118<br />
Europääische<br />
Wassserrahmennrichtlinie<br />
( (EU-WRRL L)<br />
Die EUU-Wasserrahmmenrichtliniee<br />
(Richtliniee<br />
2000/60/EG)<br />
hat denn<br />
holistischeen<br />
Schutz aaller<br />
Gewässser<br />
inkl. der Fließ- und <strong>Küsten</strong>gewä ässer sowie dder<br />
Seen unnd<br />
des GGrundwasserrs<br />
zum Ziel. MMaßgabe<br />
ist i ein allgemeinees<br />
Verschleechterungsveerbot<br />
und ddas<br />
Erreichhen<br />
eines guten g ökoloogischen<br />
unnd<br />
chemischhen<br />
Zustanddes<br />
bis zum JJahr<br />
2015. AAls<br />
wichtiges s Kontrollinsstrument<br />
wirrd<br />
von denn<br />
Mitgliedstaaaten<br />
wie beei<br />
den bei den<br />
zuvor ge enannten Ricchtlinien<br />
die Durchführu ung eines<br />
Moni<strong>to</strong>riings<br />
verlanggt<br />
(Art. 8, WWRRL).<br />
Im GGegensatz<br />
zu ur FFH-Richhtlinie<br />
liegt dder<br />
Schwerpunkt<br />
hier<br />
weniger auf der Errfassung<br />
undd<br />
Bewertungg<br />
des Zusta andes von AArten<br />
und LLebensraumty<br />
ypen, als<br />
vielmehrr<br />
auf der EErfassung<br />
uund<br />
Bewertuung<br />
von ab bgegrenzten Wasserkörppern<br />
mit Hilfe H von<br />
biologiscchen,<br />
physikalisch-chemmischen<br />
unnd<br />
hydro-m morphologiscchen<br />
Parammetern.<br />
Auc ch diese<br />
Richtliniie<br />
findet im Bereich dess<br />
Schleswig-Holsteinisch<br />
hen Wattenmmeeres<br />
Anweendung.<br />
Dies<br />
hat zur<br />
Folge, ddass<br />
das besttehende<br />
Monni<strong>to</strong>ring<br />
an ddie<br />
spezifisch hen Erforderrnisse<br />
dieserr<br />
Richtlinie angepasst a<br />
werden mmuss.<br />
Wie bei<br />
der FFH-RRichtlinie<br />
gibbt<br />
es Vorgab ben für die Erfassungen<br />
uund<br />
Bewertungen,<br />
die<br />
derzeit nnational<br />
wie internationall<br />
im Detail aausgearbeitet<br />
t, abgestimmmt<br />
und operationalisiert<br />
werden. w In<br />
festgeleggten<br />
Zeitabbständen<br />
vvon<br />
maximmal<br />
6 Ja ahren sindd<br />
thematiscche<br />
Berich hte und<br />
Bewirtscchaftungsplääne<br />
an das WWater<br />
Informaation<br />
System for Europe ( (WISE) zu liiefern.<br />
Abb. 2:<br />
Moni<strong>to</strong>ringg<br />
und Datenmanagemennt<br />
für die<br />
Rahmenrichhtlinie<br />
und INNSPIRE<br />
Europääische<br />
Meerresstrategiee-Rahmenrrichtlinie<br />
(M MSRL)<br />
Die im Jahr 20088<br />
in Kraftt<br />
getretene Meeresstrat tegie-Rahmeenrichtlinie<br />
(Richtlinnie<br />
2008/56/EEG)<br />
verknüppft<br />
die Anforderungen<br />
au us der FFH-Richtlinie,<br />
der EU-WWRRL<br />
und dder<br />
INSPIREE-Richtlinie,<br />
deren Vorga aben und Verrfahren<br />
für<br />
die Bericchtsaufgabenn<br />
im Rahmenn<br />
der MSRL zu verwende en sind.<br />
Kohlus & Reimers<br />
EU-Wasseerrahmenrichtllinie,<br />
Meere esstartegie
Das Projekt MDI-DE - Marine Daten-Infrastruktur in Deutschland 119<br />
Inhaltlich ist wie in den zuvor genannten Richtlinien die Analyse der wesentlichen Kennzeichen und<br />
Merkmale der marinen Gewässer unter Berücksichtigung der verschiedenen Lebensraumtypen,<br />
biologischen Komponenten, physikalisch-chemischen Merkmale und der Hydromorphologie<br />
vorgeschrieben. Auch hier soll ein guter Umweltzustand erzielt werden. Qualitative Deskrip<strong>to</strong>ren für<br />
die Beschreibung des guten Umweltzustandes sind z. B. die Verbreitung und Populationsdichte von<br />
Arten wie Seevögeln und Meeressäugern, das Vorkommen nicht-heimischer Arten sowie der Zustand<br />
kommerziell befischter Fisch- und Schalentierbestände. Überwachungsprogramme sind für die<br />
laufende Bewertung des Umweltzustandes der Meeresgewässer auch außerhalb des Hoheitsgebietes<br />
im Bereich der ausschließlichen Wirtschaftszone durchzuführen.<br />
Die Meeresstrategie-Rahmenrichtlinie geht über die anderen Richtlinien hinaus, da sie nicht nur die<br />
Bereitstellung von Umweltdaten sondern auch die von Daten mit Umweltbezug (Anhang I, II, III)<br />
verlangt und mit dieser Anforderung dem Ansatz von INSPIRE entspricht (Abb. 2).<br />
INSPIRE-Richtlinie<br />
Im Gegensatz zu den anderen bisher genannten Richtlinien wird durch INSPIRE (Richtlinie<br />
2007/2/EG) nicht die Erfassung und Bewertung von Daten, sondern deren Bereitstellung geregelt.<br />
Diese EU-Richtlinie ist im Mai 2007 in Kraft getreten und verpflichtet die Mitgliedstaaten,<br />
stufenweise interoperable Geobasisdaten wie Karten und Luftbilder sowie bereits vorhandene<br />
Geofachdaten - zunächst zur Umwelt und Landwirtschaft - bereit zu stellen. Als erster Schritt ist die<br />
Erstellung einheitlicher Metadaten (Informationen über Herkunft, Inhalt, Erhebungszeitraum,<br />
Zugriffsrechte usw.) vorgesehen. Bei der Nationalparkverwaltung in Schleswig-Holstein wird hierfür<br />
die Software des Nord- und Ostsee <strong>Küsten</strong>informationssystems NOKIS (Lehfeldt et al. 2006)<br />
eingesetzt, mit dem bereits ein Großteil der Metadaten über Geodaten aus dem schleswigholsteinischen<br />
Wattenmeer EU-kompatibel bereitgestellt wird. Ziel ist es, alle verfügbaren und<br />
entsprechend aufbereiteten Daten Nutzern aller EU-Staaten über Portale bereitzustellen. Um dies zu<br />
erreichen, wird die strenge Ausrichtung an bestimmten technischen Vorgaben vorgeschrieben. Durch<br />
die Veröffentlichung der Daten soll den Bürgern ein sehr umfassendes Instrument an die Hand<br />
gegeben werden, um sich über räumliche Vorgänge (z.B. Planungen und Bauvorhaben) zu<br />
informieren.<br />
Die Bereitstellung von Geo- und Fachdaten im Internet wird als Pilotprojekt von der Nationalparkund<br />
Umweltverwaltung Schleswig-Holsteins mit dem Tool Cadenza der Firma disy durchgeführt. Es<br />
ist auch ein Werkzeug zur Recherche, Analyse und Auswertung von Daten, mit der Möglichkeit, PDF-<br />
Berichte dynamisch zu erzeugen. Ein direkter Zugriff von NOKIS-Metadaten auf die Geodaten wurde<br />
testweise bei der Nationalparkverwaltung erfolgreich umgesetzt.<br />
Besondere Anforderungen im <strong>Küsten</strong>- und Meeresgebiet<br />
Geodateninfrastrukturen entstehen in den letzten Jahren für die unterschiedlichsten Aufgaben. Deren<br />
Ansprüche und Regeln gelten auch für eine Marine Dateninfrastruktur. Allerdings bestehen im<br />
Bereich der <strong>Küsten</strong>- und Meere besondere Bedingungen, aus denen sich veränderte Schwerpunkte und<br />
zusätzliche Erfordernisse für den Aufbau einer Dateninfrastruktur ergeben. Dies ist allein schon<br />
aufgrund der hohen Dynamik in diesem Gebiet ersichtlich: Alle sechs Stunden fallen mehrer tausend<br />
Quadratkilometer Watten trocken oder werden überflutet. Sände, Watten und Inseln werden verlagert,<br />
verschwinden oder entstehen neu, so dass Schiffsrouten teilweise mehrmals im Jahr angepasst werden<br />
müssen.<br />
Bei einem zur Infrastruktur gehörenden Gazetteer, einem Instrument zur Verknüpfung von Ortsnamen<br />
mit ihrer Ortslage (Kohlus 2009), ist daher nicht nur die Zeitgültigkeit bei den Namen zu<br />
berücksichtigen sondern auch dass die benannten Objekte temporären Charakter haben, sich ihre Form<br />
und Lage verändert oder sie gar zerstört werden. Ob Messungen der Algendichte, der<br />
Wassertemperatur oder Beobachtungen des Verhaltens von Vögeln, sie gelten nur für ein kurzes
120 Kohlus & Reimers<br />
Zeitfenster. Die Beschreibung von Messwerten und Zeitreihen, von Messzeitpunkten und<br />
Periodizitäten nimmt damit einen anderen Stellenwert als im terrestrischen Gebiet ein.<br />
Um diese dynamischen Prozesse zu verstehen oder Wirkung von Eingriffen abschätzen zu können,<br />
werden zunehmend hydro- und morphodynamische Modelle benötigt. Daher müssen beim Aufbau<br />
einer marinen Dateninfrastruktur Anknüpfungspunkte und Einbindungsmöglichkeiten für<br />
Computermodelle berücksichtigt werden.<br />
Die Wandelbarkeit des Raumes schlägt sich auch direkt bei den rechtlich-organisa<strong>to</strong>rischen Aufgaben<br />
nieder. So werden die unter Hoheit und Recht der Bundesländer stehenden Wattenmeernationalparke<br />
während der Flut zu großen Teilen zu einer Bundeswasserstrasse. Die Verknüpfung von Aufgaben der<br />
Länder und des Bundes sind im marinen Milieu komplexer miteinander verwoben und unterliegen oft<br />
Sonderbedingungen. So ist z. B. abweichend vom gesamten nationalen Hoheitsgebiet der Bundesstaat<br />
im Bereich der Ausschließlichen Wirtschaftszone für den Naturschutz zuständig.<br />
Architektur der MDI-DE<br />
Um den Anforderungen verschiedener Zielsysteme und bestehender Berichtspflichten bei der<br />
Bereitstellung von Fachdaten und Informationen besser zu entsprechen, werden die unabhängig<br />
voneinander entwickelten Systeme NOKIS und GDI-BSH in einer neuen „Marinen Daten<br />
Infrastruktur“ für Daten und Informationen der deutschen <strong>Küsten</strong>zone und dem angrenzenden<br />
Meeresbereich verknüpft. Mit dieser neuen technischen Grundlage wird die notwendige integrative<br />
und harmonisierte Vernetzung von weiteren Informationssystemen durchgeführt und deren effiziente<br />
Nutzung unterstützt.<br />
NOKIS und die Geodateninfrastruktur des BSH<br />
Die Produkte aus den Projekten NOKIS (2001-2004) und NOKIS++ (2004-2008) bilden den ersten<br />
wichtigen Schritt zu einer konsistenten Informationsinfrastruktur. Sie werden inzwischen in den<br />
meisten <strong>Küsten</strong>dienststellen im Routinebetrieb eingesetzt.<br />
Speziell für die Dokumentation von Daten aus der <strong>Küsten</strong>zone wurde das NOKIS Metadatenprofil aus<br />
dem ISO 19115 abgeleitet. Es kann durch standard-konforme Erweiterungen für alle Fragestellungen<br />
im <strong>Küsten</strong>raum verwendet werden. Das <strong>Küsten</strong>zonenprofil enthält das Profil der<br />
Geodateninfrastruktur Deutschland (GDI-DE). So können die Metainformationssysteme PortalU und<br />
GeoPortal.Bund auf Bundes- wie auf Länderebene (z.B. SH-MIS in Schleswig-Holstein, Kohlus et al.<br />
2009b) bedient werden. Das <strong>Küsten</strong>zonenprofil hat darüber hinaus drei weitere Ausprägungen, mit<br />
denen sich Forschungsprojekte, Simulations-Szenarien und Modelle sowie Messstellen und<br />
Messplattformen (z.B. Forschungsschiffe) beschreiben lassen.<br />
Die Metadatenerfassung und -pflege erfolgt mit dem browserbasierten NOKIS Metadaten-Edi<strong>to</strong>r, der<br />
bei allen Datenlieferanten im Einsatz ist. Interaktive Online-Visualisierungen von numerischen<br />
Simulationen sind mit digitalen Atlanten für Wind, Strömungen und Seegang implementiert. Mit den<br />
Datendiensten für Zeitreihen, flächenhafte Verteilungen und Bewertungen liegen exemplarisch<br />
implementierte Web-Services vor, die für weitere Datenbestände genutzt werden können<br />
(www.nokis.org).
Das Projeekt<br />
MDI-DE - MMarine<br />
Daten-Infrastruktur<br />
iin<br />
Deutschland d<br />
Abb. 3:<br />
Bestandteile<br />
und Aufbauu<br />
der Marinen Dateninfrastru uktur Deutschhland<br />
(MDI-DDE).<br />
In der GGeodateninfraastruktur<br />
des Bundesamtees<br />
für Seesch hifffahrt undd<br />
Hydrographhie<br />
(BSH) werden<br />
die<br />
Geobasiss-<br />
und Geoffachdaten<br />
dees<br />
BSH (Meelles<br />
& Soe etje 2006) zuur<br />
Verfügunng<br />
gestellt. Über Ü den<br />
Internetzzugang<br />
des GeoSeaPortal<br />
(www.bshh.de/de/Mee<br />
eresdaten/Geoodaten/indexx.jsp)<br />
können<br />
Nutzer<br />
nach Daaten<br />
und Infformationen<br />
suchen, dieese<br />
auf vers schiedene AArten<br />
kombinnieren<br />
und in einem<br />
interaktiven<br />
Web-GIIS<br />
darstellenn.<br />
Für eine Vielzahl vo on Fachsysteemen<br />
wurdenn<br />
Web-Karte endienste<br />
eingerichhtet,<br />
die im IInternet<br />
als OOGC-konformme<br />
WMS verfügbar<br />
sind.<br />
Das BSSH<br />
liefert mmit<br />
seiner GGeodateninfrrastruktur<br />
ei inen wichtiggen<br />
Bausteiin<br />
für die nationale<br />
Geodatenbasis<br />
von DDeutschland<br />
(NGDB). GGleichzeitig<br />
werden w überr<br />
das Geodattenportal<br />
des s Bundes<br />
(GDI-DEE)<br />
die Daten des BSH fürr<br />
INSPIRE bbereitgestellt.<br />
Integraation<br />
in die nationalenn<br />
und internnationalen<br />
Infrastrukkturen<br />
Die MDDI-DE<br />
stelllt<br />
Informatiionen<br />
und Werkzeuge zur Verfüügung,<br />
die zur Erfüllu ung von<br />
Dauerauufgaben<br />
im Zusammennhang<br />
mit den EU-R Richtlinien notwendig sind und die bei<br />
wasserbaaulichen,<br />
raaumplaneriscchen,<br />
natursschutzfachlic<br />
chen, wissennschaftlichenn<br />
und ökol logischen<br />
Systemaanalysen<br />
sowwie<br />
zur Unnterstützung<br />
der Schifff fahrt verwenndet<br />
werdenn.<br />
Sie fügt sich als<br />
Informattionsplattformm<br />
für die NNord-<br />
und Osstsee<br />
in bestehende<br />
Infraastrukturen<br />
wwie<br />
der GDI I-DE und<br />
dem PorrtalU<br />
(Krusee<br />
et al. 20099)<br />
ein und errgänzt<br />
und harmonisiert<br />
h den Informmationsfluss<br />
in i idealer<br />
Weise. DDie<br />
MDI-DEE<br />
unterstützt den Reportinngprozess<br />
fü ür die EU-Richtlinien<br />
durrch<br />
die Bereitstellung<br />
von Servvices,<br />
die Berichtsdaten<br />
aauf<br />
dem Wegg<br />
zum Berich htsportal „WWasser“<br />
(wwww.wasserblick<br />
k.net) bei<br />
der Bunndesanstalt<br />
für Gewässserkunde<br />
aaggregieren<br />
und harmoonisieren.<br />
Innsbesondere<br />
für die<br />
Umsetzuung<br />
der MSSRL<br />
kommt der MDI-DDE<br />
bei der gefordertenn<br />
Bereitstelluung<br />
von Da aten eine<br />
besonderre<br />
Rolle zu.<br />
Weiter Einnbindungen<br />
in bestehen nde Infrastruukturen<br />
und Netzwerke sind der<br />
Abbildunng<br />
4 zu entnehmen.<br />
121
Das Projeekt<br />
MDI-DE - MMarine<br />
Daten-Infrastruktur<br />
iin<br />
Deutschland d<br />
Abb. 5:<br />
Semanttik<br />
Flexible Inffrastruktur<br />
durrch<br />
kaskadierbbares<br />
Knotenp prinzip<br />
Die größßte<br />
Hürde beei<br />
der gemeinnsamen<br />
Nutzzung<br />
von Dat ten liegt in dder<br />
Semantikk.<br />
Ein Feld, das d bisher<br />
nur zögeerlich<br />
angeggangen<br />
wird. Entscheidennd<br />
für die gemeinsame<br />
g Nutzung voon<br />
Daten ist, dass für<br />
qualitativve<br />
Bezeichnner<br />
Synonymme<br />
auffindbar,<br />
übersetzba ar, kategorissierbar<br />
und vvergleichbar<br />
definiert<br />
sind. Ihrre<br />
Nutzung aals<br />
Stichwortt<br />
wird durchh<br />
Thesauri un nterstützt, die<br />
die Verweendung<br />
von Begriffen B<br />
in einen semantisch hhierarchischeen<br />
Zusammeenhang<br />
stelle en und damitt<br />
z. B. eine Suche<br />
mit Syn nonymen<br />
oder hieerarchisch<br />
veerwandten<br />
AAusdrücken<br />
eermöglichen.<br />
Für die Auufgaben<br />
der MMDI-DE<br />
sin nd zudem<br />
Schlüsseelbegriffe<br />
derr<br />
Hydrologiee,<br />
Morphologgie<br />
und des <strong>Küsten</strong>zonen<br />
K nmangementss<br />
zu erschließ ßen.<br />
Eine übeergreifende,<br />
besonders annspruchsvollle<br />
Aufgabe ergibt e sich duurch<br />
das bioologische<br />
Mo oni<strong>to</strong>ring.<br />
Für mannche<br />
Arten giibt<br />
es zahlreiiche<br />
Synonymme<br />
und konk kurrierende ssystematischhe<br />
Ansätze. In n einigen<br />
Fällen kkönnen<br />
Lebewwesen<br />
nicht mit akzeptaablem<br />
Aufwand<br />
bis auf das Artniveau<br />
bestimmt t werden.<br />
Thesaurii<br />
können dazzu<br />
beitragenn,<br />
verwandte oder synony yme Bezeichhner<br />
miteinaander<br />
oder ab bstrahiert<br />
als überggeordnete<br />
Grruppe<br />
zu nutzzen.<br />
Ein Gazzetteer<br />
schaffft<br />
ein ähnliiches<br />
begriff ffliches Sche ema für Ortsnamen,<br />
gibbt<br />
ihnen zud dem eine<br />
räumlichhe<br />
Referenz mmittels<br />
Erdkooordinaten<br />
uund<br />
sollte im marinen Berreich<br />
zeitlichhe<br />
Bezüge so owohl für<br />
die Bennnungsformenn<br />
als auch fürr<br />
die Georefeerenz<br />
ermögl lichen (Kohlus<br />
2009).<br />
Semantissche<br />
Problemme<br />
liegen niicht<br />
nur in dder<br />
Terminologie.<br />
So sind<br />
Messwertee<br />
nur im Ko ontext der<br />
verwenddeten<br />
Methooden,<br />
derenn<br />
Beschreibuung<br />
und der d Definitioon<br />
den Daaten<br />
nachvo ollziehbar<br />
zuzuordnnen.<br />
Die VVerwendungg<br />
unterschieedlicher<br />
Ma aße lässt ssich<br />
meist vollständig g mittels<br />
Transforrmationen<br />
auuflösen.<br />
Um eine gemeinnsame<br />
Nutzu ung zu ermööglich,<br />
könnnen<br />
Transform mationen<br />
aber aucch<br />
auf Daten<br />
angewenddet<br />
werden, die nach un nterschiedlicchen<br />
Methodden<br />
erhoben wurden.<br />
Lösungeen<br />
hierfür siind<br />
allerdinggs<br />
meist auuf<br />
beschränk kte Werteberreiche<br />
und die Ausdeu utung der<br />
Messwerrte<br />
für spezifizierte<br />
Frragestellungeen<br />
unter Berücksichtiggung<br />
weitereer<br />
Randbedingungen<br />
beschrännkt.<br />
Somit bbilden<br />
Servvices,<br />
die eiine<br />
Transfor rmation vonn<br />
Werten füür<br />
eine gem meinsame<br />
Verwenddung<br />
leisten, , notwendigee<br />
Bestandteilee<br />
einer Daten ninfrastruktuur.<br />
3 Einnsatz<br />
im Ummweltbericchtswesen<br />
Vom MMoni<strong>to</strong>ring<br />
zzum<br />
Berichht<br />
Von deer<br />
Felderhebbung<br />
bis zuur<br />
Erstellunng<br />
von Date enproduktenn<br />
und Bericchten<br />
gibt es einen<br />
charakteeristischen<br />
Verarbeitungssablauf<br />
(Kohlus<br />
et al. 200 09 a, Reimers<br />
2008, 20099).<br />
Messdaten<br />
werden<br />
in der Reegel<br />
grafischh<br />
als Karten ooder<br />
Diagrammme<br />
dargestellt,<br />
wobei mmeist<br />
eine speezifische<br />
Au uswertung<br />
der Datten<br />
hinsichtllich<br />
der Fragestellung<br />
der Berichtsanforderunngen<br />
erfolgtt.<br />
Bewertung gen sind<br />
123
Das Projekt MDI-DE - Marine Daten-Infrastruktur in Deutschland 125<br />
Zu bedenken ist auch, dass wenn Verfahren angepasst und verbessert werden müssen, die technische<br />
Umsetzung erneut zu fassen ist. Kostensparend und effektiv sind au<strong>to</strong>matische Verfahren nur dann,<br />
wenn Beurteilungsregeln längerfristig gelten und eine Kontinuität bei den verwendeten<br />
Bewertungsfak<strong>to</strong>ren besteht.<br />
Für die Umsetzung au<strong>to</strong>matisierter Services zur Bewertung heißt dies, dass die Ergebnisse von den<br />
jeweiligen Experten interaktiv kommentierbar und veränderbar sein müssen. Zudem muss eine<br />
explizite Freigabe einer solchen au<strong>to</strong>matisierten Vorbewertung erfolgen.<br />
Trotz dieser Schwierigkeiten sollen für einige Parameter testweise Umsetzungen auch von<br />
bewertenden Services im Rahmen des den Aufbau der MDI-DE tragenden Projektes entwickelt<br />
werden.<br />
Literatur<br />
CWSS – Common Wadden Sea Secretariat (2008): TMAP Moni<strong>to</strong>ring Handbook. (http://www.waddenseasecretariat.org/TMAP/Moni<strong>to</strong>ring.html).<br />
Essink, K., C. Dettmann, H. Farke, K. Laursen, G. Lüerßen, H. Marencic & W. Wiersinga (2005): Wadden Sea<br />
Quality Status Report 2004. Wadden Sea Ecosystem No. 19. Trilateral Moni<strong>to</strong>ring and Assessment Group,<br />
Common Wadden Sea Secretariat, Wilhelmshaven.<br />
Kohlus, J. (2005): North Sea and Baltic Sea Coastal Information System - Nord- und Ostsee<br />
<strong>Küsten</strong>InformationsSystem, Posterpresentation, CoastGIS 2005, Aberdeen.<br />
Kohlus, J. (2009): Ein Gazetteer für die deutsche Küste. In: Vött, A. & H. Brückner (Hrsg.): Ergebnisse aktueller<br />
<strong>Küsten</strong>forschung - Beiträge der 26. Jahrestagung des Arbeitskreises 'Geographie der Meere und <strong>Küsten</strong>',<br />
25.-27. April 2008 in Marburg, In: Marburger geographische Schriften 145: 50–65.<br />
Kohlus, J., B. Diederichs, W. Kazakos & C. Heidmann (2009a): Von den Metadaten zum Bericht. In: Traub, K-<br />
P., J. Kohlus & T. Lüllwitz (Hrsg.): Geoinformationen für die <strong>Küsten</strong>zone - Band 2, Beiträge des 2.<br />
Hamburger Symposiums zur <strong>Küsten</strong>zone und Beiträge des 7. Strategie-Workshops zur Nutzung der<br />
Fernerkundung im Bereich der BfG/Wasser- und Schifffahrtsverwaltung, Norden, Halmstad S. 137–152.<br />
Kohlus, J., N. Ruhe, R. Bayer & M. Bellin (2009b): Geodateninfrastruktur Schleswig-Holstein und NOKIS. In:<br />
Traub, K-P., J. Kohlus & T. Lüllwitz (Hrsg.): Geoinformationen für die <strong>Küsten</strong>zone - Band 2, Beiträge des<br />
2. Hamburger Symposiums zur <strong>Küsten</strong>zone und Beiträge des 7. Strategie-Workshops zur Nutzung der<br />
Fernerkundung im Bereich der BfG/Wasser- und Schifffahrtsverwaltung, Norden, Halmstad S. 137–152.<br />
Kruse F., S. Uhrich, M. Klenke, H. Lehmann, C. Giffeia & S. Töpker (2009): PortalU®, a Tool <strong>to</strong> Support the<br />
Implementation of the Shared Environmental Information System (SEIS) in Germany. In Hřebíček, J., J.<br />
Hradec, E. Pelikán, O. Mírovský, W. Pillmann, I.Holoubek & T. Bandholtz (eds.): Proceedings of the<br />
European conference TOWARDS eENVIRONMENT - Opportunities of SEIS and SISE: Integrating<br />
Environmental Knowledge in Europe. Masaryk University, March 25–27 2009, Prague, pp. 637–642.<br />
Lehfeldt, R., H.-C. Reimers, F. Simmering & F. Sellerhoff (2006): The use of metadata in coastal engineering<br />
and the protection of coastal waters. In: German Coastal Engineering Research Council - GCERC<br />
newsletter, 6th year Edition, 2/2006, Hamburg, pp. 4–5.<br />
Melles, J. & K.C. Soetje (2006): Die GDI-BSH und das Nautisch-Hydrographische Informationssystem<br />
(NAUTHIS). In Traub, K.-P. & J. Kohlus (Hrsg.): Geoinformationen für die <strong>Küsten</strong>zone. Beiträge des 1.<br />
Hamburger Symposiums zur <strong>Küsten</strong>zone. Heidelberg, S. 118–124.<br />
Reimers, H.-C. (2008): New Approaches for operational Sediment Moni<strong>to</strong>ring – A Workflow based on<br />
Metadata. International Conference on Coastal Engineering, 31st ICCE 2008, 31.8.-5.9., Hamburg,<br />
Germany. Abstract 406.<br />
Reimers, H.-C. (2009): Vom Messwert zum Moni<strong>to</strong>ring am Beispiel des operativen Sediment- und<br />
Habitatmoni<strong>to</strong>rings. In Traub, K.-P., J. Kohlus & T. Lüllwitz (Hrsg.) Geoinformationen für die <strong>Küsten</strong>zone<br />
Band 2, Points Verlag Norden- Halmstad, pp. 45–50.<br />
Reise K. & J. Kohlus (2008a): Seagrass, an indica<strong>to</strong>r goes astray. In: Colijn, F., R. Doerffer & J. Beusekom<br />
(eds.): Observing the Coastal Sea. An Atlas of Advanced Moni<strong>to</strong>ring Techniques. Helmholtz Centres -<br />
GKSS Research Centre and Alfred Wegner Institute for Polar and Marine Research, Geesthacht, 1/2008, pp.<br />
64–67.
Abstracct<br />
Water<br />
managemment<br />
at the cooasts<br />
secures tthe<br />
drainage of o the marsh rregion<br />
along tthe<br />
North Sea a as<br />
parrt<br />
of flood prootection<br />
and t<strong>to</strong><br />
guarantee a productive agriculture. a Chhanges<br />
in coaastal<br />
morpholo ogy<br />
succh<br />
as silting of the outer deep and cliimatic<br />
change es such as thhe<br />
sea level rrise<br />
will lead d <strong>to</strong><br />
degradation<br />
or renunciation of natural drrainage.<br />
A co onventional ssolution,<br />
replaacing<br />
sluices by<br />
coastal<br />
pumpingg<br />
stations reppresents<br />
an inntervention<br />
wi ith a high ennergy<br />
demandd.<br />
This results s in<br />
greeat<br />
financial bburdens<br />
for thhe<br />
drainage asssociations<br />
sin nce the cost off<br />
energy is inccreasing<br />
rapid dly.<br />
Thhe<br />
aim of this study is <strong>to</strong> annalyse<br />
sustainnable<br />
solution ns in order <strong>to</strong> optimise the land drainage e in<br />
coastal<br />
regions bby<br />
using renewwable<br />
energy. .<br />
Thhe<br />
his<strong>to</strong>rical development<br />
oof<br />
drainage meethods<br />
shows that wind-drivven<br />
pumps aree<br />
highly relev vant<br />
forr<br />
the drainagee<br />
of the land. For this reasoon,<br />
analyses of o the energy demand of a pumping stat tion<br />
and<br />
the supply oof<br />
wind energgy<br />
were carrieed<br />
out over a period of threee<br />
years in thee<br />
coastal regio ons<br />
of the North Seea<br />
in Dithmarrschen.<br />
It wass<br />
found that th here is a relattion<br />
between the investiga ated<br />
quuantities<br />
and aas<br />
a result it ccould<br />
be showwn<br />
that the en nergy demandd<br />
of a coastal pumping stat tion<br />
couuld<br />
be predomminantly<br />
supplied<br />
by a windd<br />
energy plant t. In addition a feasibility study<br />
was carr ried<br />
ouut<br />
for an investigation<br />
area iin<br />
Dithmarschhen<br />
in Norther rn Germany. TThree<br />
alternattives<br />
<strong>to</strong> use wind w<br />
and/or<br />
hydro poower<br />
were reeviewed<br />
for feeasibility<br />
and d evaluated onn<br />
the basis off<br />
calculations s of<br />
ecoonomic<br />
efficiiency.<br />
The annalysis<br />
indicaated<br />
that elec ctric wind puumping<br />
systemms<br />
were highly<br />
apppropriate<br />
for uuse<br />
in sustainaable<br />
drainage systems.<br />
1 Inttroduction<br />
Schwarzerr,<br />
Schrottke & Stattegger (eeds.):<br />
<strong>From</strong> Brazzil<br />
<strong>to</strong> <strong>Thailand</strong> – New Resultts<br />
in Coastal Research R<br />
<strong>Coastline</strong>e<br />
<strong>Reports</strong> <strong>16</strong> ( (<strong>2010</strong>), ISSN 00928-2734,<br />
IS SBN 978-3-9811839-9-3<br />
S. 127-1333<br />
Motivation<br />
and OObjectives<br />
Feaasibility<br />
Sttudy<br />
for OOptimisat<br />
tion of Laand<br />
Drainnage<br />
bby<br />
Using Renewab ble Energyy<br />
1 L<br />
Marie Naullin<br />
1 & Thorsten<br />
Albers<br />
Leichtweiss-Innstitute<br />
for Hyydraulic<br />
Engin neering and WWater<br />
Resourcees,<br />
Tecchnische<br />
Universität<br />
Brauns schweig, Germmany<br />
2<br />
Institute off<br />
River and Cooastal<br />
Engineeering,<br />
Hambu urg University of Technologgy,<br />
Germany<br />
Water mmanagement<br />
aat<br />
the coasts secures the drainage of the marsh reegion<br />
along the North Se ea as part<br />
of flood protection aand<br />
<strong>to</strong> guaranntee<br />
a produuctive<br />
agricul lture. Thereffore<br />
in the hiinterland<br />
the e run-offs<br />
are drainned<br />
off in a system of ditches<br />
and chhannels<br />
that leads the wwater<br />
<strong>to</strong> eitheer<br />
sluices or pumping<br />
stations in order <strong>to</strong> pass the dike.<br />
Sluices are preferred<br />
as drainagge<br />
structuress<br />
since no additional a<br />
energy ssupply<br />
for drainage<br />
is reqquired<br />
since tthe<br />
sluice ga ates close at hhigh<br />
tide resppectively<br />
open<br />
at low<br />
tide due <strong>to</strong> the wateer<br />
level diffeerences.<br />
Nowwadays<br />
natur ral drainage using sluicees<br />
is becoming<br />
more<br />
problemmatic<br />
due <strong>to</strong> cchanges<br />
in cooastal<br />
morphhology<br />
where e the slope oof<br />
the outer ddeep<br />
is reduc ced. As a<br />
result theere<br />
is a shorttening<br />
of thee<br />
sluice time at low tide and a the amouunt<br />
of water discharge th hat passes<br />
the dikee<br />
is reduced which leadss<br />
<strong>to</strong> a higherr<br />
risk of flo ooding since the run-offs fs are not su ufficiently<br />
drained. Moreover, cclimatic<br />
channges<br />
such ass<br />
the rise of the sea leveel<br />
will also leead<br />
<strong>to</strong> degra adation or<br />
renunciaation<br />
of naturral<br />
drainage (Maniak et aal.<br />
2005). A conventional<br />
c l solution, suuch<br />
as pumpi ing water<br />
beyond the dike throough<br />
the usee<br />
of coastal pumping sta ations repressents<br />
an inteervention<br />
wit th a high<br />
energy ddemand.<br />
This<br />
results in ggreat<br />
financiial<br />
burdens for f the drainaage<br />
associatiions<br />
since th he cost of<br />
energy iss<br />
increasing rapidly.<br />
2
128<br />
A new cconcept<br />
for ooptimisation<br />
of land drain<br />
this purppose,<br />
wind eenergy<br />
repreesents<br />
one a<br />
pumpingg<br />
stations. TThe<br />
his<strong>to</strong>ricaal<br />
importanc<br />
documennted.<br />
For example<br />
wind-driven<br />
wate<br />
areas inn<br />
The Netheerlands<br />
sincce<br />
the 15<br />
represennts<br />
hydro powwer<br />
that coul<br />
the wateer<br />
discharge iis<br />
increased b<br />
analyse sustainable solutions in<br />
renewabble<br />
energy.<br />
th<br />
nage by usin ng renewablee<br />
energy is thherefore<br />
requ uired. For<br />
appropriate alternative a ass<br />
a possiblee<br />
energy reso ource for<br />
e of using wind w energyy<br />
for the draainage<br />
of the<br />
land is<br />
er pumps hav ve been usedd<br />
in order <strong>to</strong>o<br />
drain the low l lying<br />
century. An nother possiible<br />
renewaable<br />
energy resource<br />
ld be utilizedd<br />
within the process p of a cascading drrainage<br />
syste em where<br />
by a high lyiing<br />
polder. Therefore T thee<br />
main objecttive<br />
of this st tudy is <strong>to</strong><br />
n order <strong>to</strong> ooptimise<br />
the land drainaage<br />
in coasttal<br />
regions by using<br />
Investiggation<br />
Areaa<br />
Dithmarrschen<br />
is a coounty<br />
on thee<br />
North Sea coast of the federal statee<br />
Schleswig-Holstein<br />
in Northern<br />
Germanyy<br />
(figure1). The coast arrea<br />
consists of polder su urrounded byy<br />
dikes as fl flood defence es. In the<br />
hinterlannd<br />
the run-offfs<br />
are draineed<br />
off in a syystem<br />
of ditch hes and channnels<br />
that leaads<br />
the water r <strong>to</strong> either<br />
sluices oor<br />
pumping sstations<br />
in orrder<br />
<strong>to</strong> pass the dike. Th his water mannagement<br />
is important <strong>to</strong> o prevent<br />
floods fr from inland discharges aand<br />
<strong>to</strong> mainntain<br />
an effi icient agricuulture<br />
which represents the main<br />
economiic<br />
sec<strong>to</strong>r of thhis<br />
region.<br />
For the feasibility sttudy,<br />
the pummping<br />
statioon<br />
Hillgroven n with a pummping<br />
capaccity<br />
of <strong>16</strong>0 kW k and a<br />
catchment<br />
area of 1.2200<br />
ha and thhe<br />
sluice Steeertloch<br />
with h a catchmentt<br />
area of 6.3000<br />
ha are inv vestigated<br />
in more detail. Due <strong>to</strong> changes of the coasttal<br />
morpholo ogy the slope<br />
of the outter<br />
deep of the t sluice<br />
Steertlocch<br />
is reducedd<br />
and thereffore<br />
gravity ddrainage<br />
bec comes insuffficient.<br />
For tthis<br />
reason, the t water<br />
managemment<br />
of this area has <strong>to</strong> bbe<br />
improvedd<br />
and sustainable<br />
solutionns<br />
were anallysed.<br />
The da ata of the<br />
pumpingg<br />
station Hilllgroven<br />
weree<br />
used as a first estimati ion of the puumping<br />
timees<br />
since the boundary b<br />
conditionn<br />
in form off<br />
water levell<br />
differences of high and d low tide aree<br />
assumed <strong>to</strong>o<br />
be almost equal for<br />
the nearbby<br />
sites.<br />
Figure 1:<br />
Investigatioon<br />
Area in Ditthmarschen,<br />
NNorthern<br />
Germ many<br />
2 Annalysis<br />
of ennergy<br />
demaand<br />
of a puumping<br />
stat tion and supply<br />
of winnd<br />
energy<br />
Naulin n & Albers<br />
As windd<br />
energy was identified ass<br />
being highlly<br />
relevant fo or drainage mmethods<br />
(IPAAT<br />
1989), an nalyses of<br />
the energgy<br />
demand oof<br />
a pumpinng<br />
station and<br />
the energy y supply of a wind energgy<br />
plant (WE EP) were<br />
carried oout<br />
in more detail over a period of tthree<br />
years in<br />
the coastaal<br />
regions of the North Sea S in the<br />
county DDithmarschenn.
Feasibilityy<br />
Study for Opptimisation<br />
of LLand<br />
Drainage<br />
Energyy<br />
Balance wwith<br />
Monthly<br />
Data<br />
In order <strong>to</strong> compare the distribution<br />
in time oof<br />
the energy y demand of a pumping sstation<br />
and th he energy<br />
production<br />
of WEP aan<br />
energy baalance<br />
with mmonthly<br />
data a was carriedd<br />
out. Therefoore<br />
the electr ric power<br />
consumpption<br />
of a cooastal<br />
pumpinng<br />
station wiith<br />
monthly values over a period fromm<br />
2005 till 2007 2 was<br />
analysedd.<br />
The data were providded<br />
for the ppumping<br />
sta ation Hillgrooven<br />
by the drainage as ssociation<br />
Deich- uund<br />
Hauptsieelverband<br />
Diithmarschen.<br />
Furthermor re, the wind data were taaken<br />
from an n analysis<br />
of the CChamber<br />
of f Agriculturee<br />
Schleswig-Holstein<br />
La andwirtschafftskammer<br />
SSchleswig<br />
- Holstein<br />
(LKSH 22008)<br />
wheree<br />
the productiion<br />
of wind energy was investigated i for the coasttline<br />
of the North N Sea<br />
in Schlesswig-Holsteiin.<br />
Figure 2:<br />
Comparisonn<br />
of energy deemand<br />
of a puumping<br />
station n and wind ennergy<br />
productiion<br />
along the west w coast<br />
of Schleswiig-Holstein<br />
(AAverage<br />
monthhly<br />
values of the annual deemand/<br />
producction<br />
for the years y 2005<br />
till 2007)<br />
The resuults<br />
show seaasonal<br />
fluctuuations<br />
of thee<br />
annual dist tribution of tthe<br />
energy ddemand<br />
of a pumping<br />
station aas<br />
well as off<br />
the producction<br />
of winnd<br />
energy (fi igure2). Durring<br />
summerr<br />
time from April till<br />
Septembber<br />
a very loww<br />
energy demand<br />
with mmonthly<br />
valu ues of 3 % <strong>to</strong>o<br />
5 % and inn<br />
<strong>to</strong>tal a percentage<br />
of<br />
22 % of f the mean annnual<br />
need iss<br />
required. LLikewise<br />
during<br />
summer the productiion<br />
of wind energy is<br />
lower annd<br />
amounts 39 % of thee<br />
mean annual<br />
output. During D winterr<br />
time higheer<br />
values are reached.<br />
Especiallly<br />
during thhe<br />
months JJanuary<br />
till March almo ost half (46 %) of the mean annua al energy<br />
demand is recorded. In the samee<br />
time periodd<br />
the product tion of wind energy is allso<br />
slightly larger<br />
(33<br />
%). Duriing<br />
the montths<br />
Oc<strong>to</strong>ber till Decembeer<br />
the energy y demand ammounts<br />
32 % and the win nd energy<br />
production<br />
28 % of tthe<br />
annual deemand<br />
respecctively<br />
produ uction.<br />
Energyy<br />
Balance wwith<br />
Hourlyy<br />
Data<br />
The resuults<br />
of the fiirst<br />
energy bbalance<br />
on thhe<br />
basis of monthly m dataa<br />
show the aannual<br />
distrib bution of<br />
energy ddemand<br />
of a pumping sstation<br />
and wwind<br />
energy y productionn.<br />
<strong>From</strong> thesse<br />
results of f monthly<br />
averagess<br />
it is not possible<br />
<strong>to</strong> conclude<br />
wheether<br />
the wi ind energy ssupply<br />
woulld<br />
be sufficient<br />
for a<br />
pumpingg<br />
station sincce<br />
there is a great variation<br />
in wind speed s with siignificant<br />
chhanges<br />
in sho orter time<br />
periods such as houurs.<br />
For this reason, the temporal re esolution of the calculattion<br />
is incre eased and<br />
hourly ddata<br />
of the eenergy<br />
demaand<br />
of a pummping<br />
station n and the ennergy<br />
producction<br />
of a WEP W were<br />
analysedd<br />
over a perriod<br />
of threee<br />
years fromm<br />
2005 until 2007. The main goal oof<br />
this analy ysis is <strong>to</strong><br />
investigaate<br />
the perceentage<br />
of ennergy<br />
supplyy<br />
of a pumpi ing station thhat<br />
can be ddirectly<br />
cove ered by a<br />
WEP and<br />
how high tthe<br />
percentagge<br />
of the remmaining<br />
energ gy is that hass<br />
<strong>to</strong> be taken from the loc cal power<br />
supply syystem.<br />
For the energy demmand<br />
the dataa<br />
of pumpinng<br />
times of the t coastal ppumping<br />
stattion<br />
Hillgrov ven were<br />
providedd<br />
by the drainnage<br />
associaation<br />
Deich- und Hauptsi ielverband DDithmarschenn.<br />
In order <strong>to</strong> o consider<br />
129
130<br />
a variannce<br />
in pumping<br />
power tthe<br />
<strong>to</strong>tal enggine<br />
power of the pumpps<br />
was rangged<br />
with valu ues from<br />
220 kW <strong>to</strong> 660 kW. IIt<br />
should be noted that foor<br />
the following<br />
calculatiions<br />
the pummping<br />
power is i set <strong>to</strong> a<br />
constantt<br />
value, viz. 220 kW or 660 kW for each calcula ation. This ccould<br />
be an overestimati ion if the<br />
constantt<br />
value is equualized<br />
<strong>to</strong> thee<br />
rate of the required pum mp capacity depending on<br />
the catchm ment area.<br />
In realityy<br />
the pump ccapacity<br />
is diivided<br />
in<strong>to</strong> seeveral<br />
pumps s which are ooperated<br />
as rrequired.<br />
Figure 3:<br />
Naulin n & Albers<br />
Electrical ppower<br />
supply of a pumping station with a constant pummp<br />
capacity oof<br />
220 kW for r the years<br />
2005, 20066<br />
and 2007 diifferentiated<br />
inn<br />
energy supp ply by a WEPP<br />
(800 kW) aand<br />
by the local<br />
power<br />
system
Feasibilityy<br />
Study for Opptimisation<br />
of LLand<br />
Drainage<br />
For the pproduction<br />
oof<br />
wind energgy<br />
the data wwere<br />
estimate ed using a poower<br />
curve oof<br />
a wind turb bine. The<br />
power cuurve<br />
relates wind speed t<strong>to</strong><br />
the electriical<br />
power output<br />
of a WWEP.<br />
As an eexample<br />
of a possible<br />
WEP thee<br />
model Enerrcon<br />
E 48 wiith<br />
800 kW wwind<br />
turbine e was appliedd.<br />
As input data<br />
of this ca alculation<br />
using the<br />
power currve<br />
of the moodel<br />
E 48 hoourly<br />
data of f the mean wwind<br />
speed wwere<br />
used. The T wind<br />
data werre<br />
measuredd<br />
by the Gerrman<br />
Meteorrological<br />
Service<br />
Deutsccher<br />
Wetterddienst<br />
at the e weather<br />
station BBüsum<br />
in Ditthmarschen.<br />
As an exxample<br />
the rresults<br />
in formm<br />
of the elecctrical<br />
suppl ly of a pumpping<br />
station wwith<br />
an engin ne power<br />
of 220 kkW<br />
for the yeears<br />
2005 tilll<br />
2007 are shhown<br />
with monthly m valuees<br />
in figure 33.<br />
The diagra ams show<br />
that the eenergy<br />
demaand<br />
of the puumps<br />
can be ppredominant<br />
tly supplied bby<br />
a WEP. Inn<br />
<strong>to</strong>tal the pe ercentage<br />
of WEP supply wass<br />
calculated from 83.7 % (2006) up <strong>to</strong> 89.8 % (22007)<br />
of thee<br />
annual nee ed for the<br />
pumpingg<br />
station. Fuurthermore,<br />
inn<br />
this calcullation<br />
the pu ump capacityy<br />
was rangedd<br />
from 220 kW k up <strong>to</strong><br />
660 kW. . As a resultt<br />
the mean aannual<br />
powerr<br />
supply by the WEP waas<br />
estimatedd<br />
between 86 6.5 % for<br />
220 kW pumps and 772.1<br />
% for 6660<br />
kW pumpps.<br />
3 Feaasibility<br />
Stuudy<br />
for Draainage<br />
Metthods<br />
Using g Renewabble<br />
Energy<br />
In order <strong>to</strong> analyse ddifferent<br />
draiinage<br />
methoods<br />
using ren newable enerrgy<br />
three alteernatives<br />
<strong>to</strong> use wind<br />
and/or hhydro<br />
powerr<br />
were revieewed<br />
for feasibility<br />
and d evaluated on the basiis<br />
of calcula ations of<br />
economiic<br />
efficiencyy<br />
for the sluuice<br />
Steertlooch<br />
in Dithm marschen as follows (figure<br />
4): (1) pumping<br />
station wwith<br />
WEP, (22)<br />
reservoir wwith<br />
wind-ddriven<br />
pump with a mechhanical<br />
(a) orr<br />
electrical (b) ( power<br />
transfer and (3) cascaading<br />
drainaage<br />
system ussing<br />
WEP an nd hydro powwer.<br />
Figure 4:<br />
Sketches off<br />
the alternativves<br />
analysed inn<br />
the feasibility<br />
study (withh<br />
M = mo<strong>to</strong>r aand<br />
G = genera<strong>to</strong>r)<br />
Alternaative<br />
1: pummping<br />
statiion<br />
with WWEP<br />
The firstt<br />
alternativee<br />
is composeed<br />
of a pummping<br />
station n combined with a WEPP.<br />
Between the wind<br />
turbine and the pummps<br />
there iss<br />
an electricc<br />
power tran nsfer. Durinng<br />
windless periods there<br />
is the<br />
possibiliity<br />
<strong>to</strong> receivee<br />
energy fromm<br />
the power supply syste em. This alteernative<br />
is allready<br />
realise ed by the<br />
waterboaard<br />
Bremischher<br />
Deichverrband<br />
am rechten<br />
Weser rufer for the pumping staation<br />
Wasserh horst and<br />
is well aapproved.<br />
In Bremen thee<br />
energy supply<br />
of a WE EP (600 kW) ) for the pummps<br />
with a <strong>to</strong> otal rated<br />
power of<br />
560 kW avverages<br />
50 % of the annuual<br />
demand (DVR-Bremmen<br />
2008). AAs<br />
the energy y balance<br />
with houurly<br />
data showed<br />
for the site in Dithmmarschen<br />
a higher h wind eenergy<br />
supplyy<br />
from abou ut 72 % <strong>to</strong><br />
86 % deepending<br />
on tthe<br />
pumpingg<br />
capacity caan<br />
be expecte ed since the capacity of tthe<br />
WEP (80 00 kW) is<br />
131
<strong>Coastline</strong> <strong>Reports</strong> 8 (2007)<br />
Coastal Development: The Oder Estuary and beyond<br />
G. Schernewski, B. Glaeser, R. Scheibe, A. Sekścińska & R. Thamm (eds.)<br />
(In English and German)<br />
<strong>Coastline</strong> <strong>Reports</strong> 9 (2007)<br />
Von der Geoarchäologie über die <strong>Küsten</strong>dynamik zum <strong>Küsten</strong>zonenmanagement (<strong>From</strong><br />
Geoarchaeology via Coastal Dynamic <strong>to</strong> Coastal Zone Management)<br />
G. Gönnert, B. Pflüger & J.-A. Bremer (Hrsg./eds.):<br />
(Mostly in German with English abstracts)<br />
<strong>Coastline</strong> <strong>Reports</strong> 10 (2007)<br />
The Benefits of Inter-linking Coastal and River Management<br />
Twenty case studies world-wide indicate opportunities and constraints<br />
A. Pickaver & D. Sadacharan (eds.)<br />
(In English)<br />
<strong>Coastline</strong> <strong>Reports</strong> 11 (2008)<br />
The INTERREG IIIB ToLearn Project<br />
Developing Sustainable Tourism in the North Sea Region<br />
G. von Rohr, C. Corves & H. Sterr (eds.)<br />
(In English)<br />
<strong>Coastline</strong> <strong>Reports</strong> 12 (2009)<br />
Coastal Change in the southern Baltic Sea Region<br />
G. Schernewski, H. Janßen & S. Schumacher (eds.)<br />
(Mostly in German with English abstracts)<br />
<strong>Coastline</strong> <strong>Reports</strong> 13 (2009)<br />
International approaches of coastal research in theory and practice<br />
EUCC – Die <strong>Küsten</strong> <strong>Union</strong> Deutschland e.V.<br />
(In English and German)<br />
<strong>Coastline</strong> <strong>Reports</strong> 14 (2009)<br />
Klimawandel und Raumplanung – Flächen- und Risikomanagement<br />
überschwemmungsgefährdeter Gebiete am Beispiel der Hamburger Elbinsel (Climate<br />
change and urbanism – urban management and risk management of flood-prone areas using<br />
the example of the Elbinsel Hamburg)<br />
J. Knieling, M. Schaerffer & S. Tressl<br />
(In German)<br />
<strong>Coastline</strong> <strong>Reports</strong> 15 (<strong>2010</strong>)<br />
Forschung für ein Integriertes <strong>Küsten</strong>zonenmanagement: Fallbeispiele<br />
Odermündungsregion und Offshore-Windkraft in der Nordsee (Research for an Integrated<br />
Coastal Zone Management: case studies Odra Lagoon and Offshore-wind power in the<br />
North Sea)<br />
A. Kannen, G. Schernewski, I. Krämer, M. Lange, H. Janßen & N. Stybel<br />
(In German)
<strong>Coastline</strong> <strong>Reports</strong> <strong>16</strong> (<strong>2010</strong>)<br />
<strong>From</strong> <strong>Brazil</strong> <strong>to</strong> <strong>Thailand</strong> – New Results in Coastal Research<br />
K. Schwarzer, K. Schrottke & K. Stattegger (eds.)<br />
(In English and German)