Create successful ePaper yourself
Turn your PDF publications into a flip-book with our unique Google optimized e-Paper software.
MAN WAH HOLDINGS LIMITED<br />
(1999.HK)<br />
ANNUAL RESULTS 2012<br />
CORPORATE PRESENTATION1<br />
MAY 2012
DISCLAIMER AND FORWARD-LOOKING STATEMENTS<br />
� This document carries the information and the opinion is not for the purpose of <strong>com</strong>prehensive<br />
research, financial services or legal opinion. Man Wah Holdings Ltd. does not guarantee its<br />
accuracy and integrity. This document contains the information only to provide reference. They<br />
can not be<strong>com</strong>e or deemed to be sold or bought or subscribe for securities or other part for the<br />
invitation.<br />
� This document contains information, opinion can only reflect Man Wah Holdings Ltd’s opinion<br />
on the date of the presentation. Man Wah Holdings Ltd. can change anything on this<br />
document without notices. Man Wah holdings Ltd. will not liable on any loss which is caused<br />
by the information, opinion from this document. Recipient should be replaced personal<br />
independent judgment by trust on this document.<br />
� This document contains information and advice are confidential data. You can only use or<br />
copy for the personal reference purposes. In addition, this document cannot be transmitted or<br />
transferred to any other person or in any way be incorporated into other files or data.<br />
Therefore, you agree to this document should keep safe and prevent the data be leaked out.<br />
� This document and the related discussion may include forward-looking statement with risk and<br />
uncertain factors. These expression normally used forward-looking wording, such as believe,<br />
expect, planning, forecast, target, possible, hope, will, may and etc. You should not<br />
excessively rely on such forward-looking statement that only used for this presentation. This<br />
forward-looking statements are based on our own <strong>com</strong>pany and other sources that we believe<br />
is reliable.<br />
2
PRESENTATION OUTLINE<br />
Business Review<br />
Financial Highlights<br />
Future Plans and Strategies<br />
Q & A Session<br />
4<br />
15<br />
23<br />
29<br />
3
BUSINESS REVIEW<br />
MANWAH HOLDINGS LIMITED FY2012<br />
4
FINANCIAL SUMMARY<br />
Revenue Growth : 13.9%<br />
GP Margin : 34.0%<br />
EBITDA Margin : 10.0%<br />
Net Profit Margin : 7.0%<br />
Dividend Payout Ratio : 41.0%<br />
5
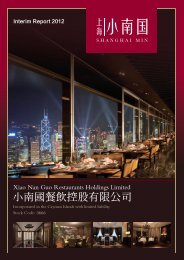
PRODUCT MIX<br />
ENLANDA<br />
5.1%<br />
FY2012<br />
Others<br />
5.7%<br />
CHEERS<br />
89.2%<br />
- Customized recliner, home theatre sofa,<br />
Recliner Sofas with various swivel,<br />
rocking or extending footrest functions,<br />
and stationary sofas<br />
- Mattresses and bedding accessories,<br />
targeting the medium-high end<br />
consumers<br />
- Cabinets, tables and chairs<br />
- HK “Morewell” stores<br />
6
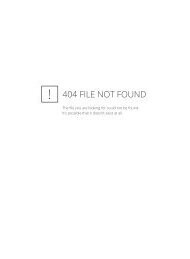
MOTION RECLINER MARKET IN THE US<br />
Upgraded to 4 th largest Motion Recliner<br />
<strong>man</strong>ufacturer with 8.5% market share in 2011<br />
from 5 th in 2010 with 7.3% market share<br />
Company-level retail sales value market share(%) of<br />
the top 5 <strong>com</strong>panies, 2011<br />
Company Name Market share (%)<br />
1 La-Z-Boy Inc 20.4%<br />
2 Furniture Brands International 13.0%<br />
3 Ashley Furniture Industries 10.3%<br />
4 Man Wah Holdings 8.5%<br />
5 Jackson Furniture 7.7%<br />
Source: Euromonitor International 2012<br />
Market share calculated by revenue<br />
Ranked as 4 th largest Motion Recliner brand in the<br />
U.S. with 8.5% market share in 2011<br />
Brand-level retail sales value market<br />
share(%) of the top 10 brands, 2011<br />
Brand Name Market share (%)<br />
1 La-Z-Boy Inc 20.4%<br />
2 Lane (Furniture Brands ) 10.8%<br />
3 Ashley Furniture Industries 10.3%<br />
4 Cheers (Man Wah Holdings) 8.5%<br />
5 Catnapper(Jackson Furniture) 7.7%<br />
6 Franklin Furniture Corporation 6.3%<br />
7 Klaussner Furniture Ind 5.5%<br />
8 Best Home Furnishings 3.4%<br />
9 Southern Motion Inc. 2.2%<br />
10 Flexsteel Industries Inc. 2.0%<br />
7
SUSTAINED STRONG MARKET POSITION IN THE US<br />
Rank<br />
Rank last<br />
year<br />
Top 10 Sources for the U.S. Furniture Market<br />
Company<br />
Name<br />
Estimated U.S. furniture<br />
shipment in 2011 (USD<br />
in mn)<br />
% change<br />
yr-on-yr<br />
1 1 Ashley Furniture Inds. 3,338.3 10.1%<br />
2 3 La-Z-Boy Inc 975.0 6.1%<br />
3 2 Furniture Brands Int’l 932.9 -5.0%<br />
4 4 Klaussner Furniture Inds. 490.0 0.0%<br />
5 5 Dorel 450.5 1.8%<br />
6 6 Sauder Woodworking 430.0 0.0%<br />
7 7 Lacquer Craft 376.9 -5.3%<br />
8 8 Ethan Allen 344.8 7.0%<br />
9 9 Flexsteel Inds. 308.3 0.5%<br />
10 10 Man Wah Holdings 276.9 7.2%<br />
Source: Furniture/Today, Survey in May in 2012 (Furniture/Today is a leading publication in furniture industry in the USA)<br />
8
MOTION RECLINER MARKET IN MAINLAND CHINA<br />
Company-level retail sales value market share(%)<br />
of the top 5 <strong>com</strong>panies, 2011<br />
Company Name Market share (%)<br />
1 Man Wah Holdings 20.1%<br />
2<br />
3<br />
Maintained the Leading Motion Recliner <strong>man</strong>ufacturer position in Mainland China,<br />
market share increased to 20.1% in 2011 from 19.8% in 2010<br />
Kuka Technic Sofa<br />
Manufacture<br />
Fuli Farrell Furniture<br />
Manufacture<br />
Source: Euromonitor International 2012<br />
4.8%<br />
2.0%<br />
4 Beijing Tiantan 1.6%<br />
5 Beijing Aris Furniture 1.5%<br />
Brand-level retail sales value market<br />
share(%) of the top 5 brands, 2011<br />
Brand Name Market share (%)<br />
1 Cheers 20.1%<br />
2 Kuka 4.8%<br />
3 Farrell 2.0%<br />
4 Tiantan 1.6%<br />
5 Aris 1.5%<br />
9
OVERVIEW OF THE US AND PRC MOTION RECLINER MARKET<br />
USD in<br />
million<br />
10,000<br />
8,000<br />
6,000<br />
4,000<br />
2,000<br />
0<br />
7,447<br />
Retail sales value of recliner sofas<br />
in the U.S., 2007-2014<br />
7,132<br />
6,512<br />
7,185<br />
7,971<br />
Source: Euromonitor International 2012<br />
8,349<br />
8,850<br />
9,248<br />
RMB in million<br />
10,000<br />
8,000<br />
6,000<br />
4,000<br />
2,000<br />
0<br />
1,657<br />
Retail sales value of recliner sofas<br />
In Mainland China, 2007-2014<br />
2,106<br />
2,835<br />
3,963<br />
5,441<br />
6,909<br />
8,358<br />
9,869<br />
10
MOTION RECLINER AS PERCENTAGE OF TOTAL SOFA MARKET<br />
50.0%<br />
40.0%<br />
30.0%<br />
20.0%<br />
10.0%<br />
0.0%<br />
39.0%<br />
Source: Euromonitor International 2012<br />
Motion Recliner as percentage of total sofa market<br />
37.5%<br />
35.2%<br />
36.7%<br />
4.6% 4.9% 5.8% 6.8%<br />
38.8% 38.9% 39.0% 39.1%<br />
8.1% 9.1% 9.8% 10.4%<br />
2007 2008 2009 2010 2011 2012E 2013E 2014E<br />
In US In Mainland China<br />
11
EXTENSIVE GLOBAL DISTRIBUTION NETWORK<br />
Revenue by geographical segments<br />
5.2% 4.9%<br />
9.5%<br />
FY2012<br />
51.5%<br />
26.6%<br />
2.3%<br />
US Europe Canada Others Mainland China HK<br />
8.5%<br />
Revenue<br />
Ratio %<br />
100%<br />
75%<br />
50%<br />
25%<br />
Market Segments Analysis<br />
29.7% 28.2% 28.9%<br />
70.3% 71.8% 71.1%<br />
FY2011 Customer Base Analysis<br />
4.6% 4.4%<br />
54.3%<br />
25.0%<br />
3.2%<br />
US Europe Canada Others Mainland China HK<br />
0%<br />
FY2010 FY2011 FY2012<br />
Overseas Mainland China & HK<br />
High Quality customer base, our top 5 retailers<br />
includes : Flexsteel, Steinhoff, American Signature, RTG<br />
Furniture, Haverty’s<br />
Macy’s became our top 10 customers<br />
12
NETWORK EXPANSION IN MAINLAND CHINA<br />
600<br />
500<br />
400<br />
300<br />
200<br />
100<br />
0<br />
400<br />
300<br />
200<br />
100<br />
0<br />
CHEERS – Self-operated vs. distributed stores<br />
Distributor Self-operated<br />
213<br />
37<br />
Distributor Self-operated<br />
121<br />
25<br />
96<br />
265<br />
44<br />
175<br />
33<br />
296<br />
74<br />
176 221 222<br />
213<br />
43<br />
405<br />
121<br />
284<br />
255<br />
70<br />
505<br />
174<br />
331<br />
FY2008 FY2009 FY2010 FY2011 FY2012<br />
ENLANDA – Self-operated vs. distributor stores<br />
237<br />
75<br />
142 170 185 162<br />
FY2008 FY2009 FY2010 FY2011 FY2012<br />
The Self-operated store network covers 22<br />
major cities in Mainland China<br />
Chendu<br />
Chongqing<br />
Xi’an<br />
Beijing<br />
Xianghe<br />
Wuhu<br />
Wuhan<br />
Tianjin<br />
Nanchang<br />
Dalian<br />
Shanghai<br />
Hangzhou<br />
Ningbo<br />
Guangzhou<br />
Quanzhou<br />
Foshan<br />
Xiamen<br />
Zhongshan<br />
Dongguan<br />
Zhuhai Shenzhen<br />
Huizhou<br />
Note: Store numbers as at 31 March 2012<br />
13
AWARDS & RECOGNITIONS<br />
Ranked by Forbes magazine as “Asia’s 200 Best Under A Billion” in 2011<br />
“Cheers” has been awarded “Chinese Well Known Mark”<br />
Ranked top 10 sources for the U.S. furniture market by “Furniture Today”<br />
with estimated shipment of USD 277 million in 2011<br />
Man Wah has been awarded “Special Support Award” by CNR Changchun<br />
Railway Vehicles Co., Ltd.<br />
14
MAN WAH HOLDINGS LIMITED FY2012<br />
15
FINANCIAL HIGHLIGHT<br />
(HK$ million) FY2012 FY2011 Change<br />
Revenue 4,336.4 3,808.2 13.9%<br />
Gross Profit 1,474.9 1,617.4 -8.8%<br />
Gross Profit Margin (%) 34.0% 42.5% -8.5pts<br />
EBITDA Margin (%) 10.0% 19.4% -9.4pts<br />
Net Profit for year 302.2 621.3 -51.4%<br />
Net Profit Margin 7.0% 16.3% -9.3pts<br />
Basic EPS (HK cents) 31.5 64.5 -51.2%<br />
Diluted EPS (HK cents) 31.5 64.5 -51.2%<br />
Full Year Dividend per Ordinary Share (HK cents) 13.0 26.4 -50.8%<br />
Comprising : Final Dividend (HK cents) 7.0 13.0 -46.2%<br />
Interim Dividend (HK cents) 6.0 13.4 -55.2%<br />
Dividend Payout Ratio 41.0% 40.9% +0.1pts<br />
16
STEADY FINANCIAL POSITION<br />
(HK$ million) FY2012 FY2011 Change<br />
Average Inventory Turnover Days 59 days 59 days -<br />
Average Receivable Turnover Days 30 days 25 days 5 days<br />
Average Payable Turnover Days 32 days 32 days -<br />
Current Ratio 2.40 5.81 -<br />
Total Bank Borrowings 582.8 17.5 565.3<br />
Debt Gearing Ratio 13.0% 0.5% -<br />
Cash and Cash Equivalents 1,190.1 1,611.2 -26.1%<br />
17
REVENUE BREAKDOWN<br />
HK$ (Million )<br />
5000<br />
4000<br />
3000<br />
2000<br />
1000<br />
0<br />
93.1<br />
107.7<br />
35.3<br />
648.8<br />
125.2<br />
67.3<br />
267.4<br />
1,083.1<br />
113.2<br />
117.1<br />
368.7<br />
1,364.8<br />
121.4<br />
193.4<br />
557.0<br />
2,060.4<br />
121.3<br />
193.0<br />
760.5<br />
2,733.4<br />
FY2007 FY2008 FY2009 FY2010 FY2011 FY2012<br />
98.2<br />
202.5<br />
951.7<br />
3,084.0<br />
Sofa Export Sales Sofa Mainland China Sales Bedding Mainland China Sales HK Retail & Wholesale Sales<br />
HK$<br />
in million<br />
FY2012 FY2011<br />
% of<br />
Turnover<br />
HK$<br />
in million<br />
% of<br />
Turnover<br />
Yr- on- yr<br />
Change<br />
Sofa Export Sales 3,084.0 71.1% 2,733.4 71.8% 12.8%<br />
Sofa Mainland China Sales 951.7 22.0% 760.5 20.0% 25.1%<br />
Bedding Mainland China Sales 202.5 4.7% 193.0 5.0% 4.9%<br />
HK retail & wholesale Sales 98.2 2.2% 121.3 3.2% -19.0%<br />
Total Turnover 4,336.4 100.0% 3,808.2 100.0% 13.9%<br />
18
SALES VOLUME AND ASP BREAKDOWN<br />
For the year<br />
ended 31 March<br />
Export Sofa<br />
(wholesale price)<br />
Mainland China<br />
Sofa (wholesale &<br />
retail price)<br />
HK Sofa (wholesale<br />
& retail price)<br />
Mainland China &<br />
HK Bedding<br />
(wholesale & retail<br />
price)<br />
Volume sold<br />
in FY2012<br />
Volume sold<br />
in FY2011<br />
Change<br />
yr-on-yr<br />
ASP in FY<br />
2012<br />
(in HKD)<br />
ASP in FY<br />
2011<br />
(in HKD)<br />
Change<br />
yr-on-yr<br />
476,633 446,600 6.7% 6,470 6,100 6.1%<br />
55,938 51,800 8.0% 13,022 12,200 6.7%<br />
4,703 5,200 -9.6% 11,490 10,100 13.8%<br />
49,919 46,500 7.4% 4,477 4,600 -2.7%<br />
19
GROSS PROFIT MARGIN BREAKDOWN<br />
HK$ (Million)<br />
1500<br />
1200<br />
900<br />
600<br />
300<br />
0<br />
Overall Gross Profit and Margin<br />
35.70%<br />
701<br />
42.9% 42.5%<br />
1,257<br />
1,617<br />
34.0%<br />
1,475<br />
FY2009 FY2010 FY2011 FY2012<br />
Gross Profit Gross Profit Margin<br />
60%<br />
50%<br />
40%<br />
30%<br />
20%<br />
10%<br />
0%<br />
70%<br />
60%<br />
50%<br />
40%<br />
30%<br />
20%<br />
63.5%<br />
63.4%<br />
44.7%<br />
GP Margin by Category<br />
28.6%<br />
64.5%<br />
60.5%<br />
39.7%<br />
56.5%<br />
43.2% 46.6%<br />
44.7%<br />
40.7%<br />
FY2009 FY2010 FY2011 FY2012<br />
Mainland China Bedding Export Sofa<br />
HK Retail & Wholesale Mainland China Sofa<br />
49.5%<br />
48.8%<br />
44.0%<br />
29.5%<br />
20
PRODUCT COST ANALYSIS<br />
Labour<br />
7.1%<br />
Wood 8.1%<br />
PVC<br />
2.9%<br />
Others 9.7%<br />
FY2012<br />
Metal<br />
18.9%<br />
Fabric 6.9%<br />
Chemicals<br />
10.6%<br />
Leather<br />
35.8%<br />
Wood<br />
PVC<br />
7.7%<br />
2.5%<br />
Others<br />
5.6%<br />
Labour<br />
8.0%<br />
Metal<br />
15.0%<br />
FY2011<br />
Fabric 5.4%<br />
Chemicals<br />
9.7%<br />
Leather<br />
46.1%<br />
Major Raw Material Average Unit Cost Compared Change in FY2012 (% )<br />
Leather 17.8%<br />
Foam 10.6%<br />
Metal 1.0%<br />
PVC 15.1%<br />
Wood -4.4%<br />
Fabric -3.6%<br />
21
SHAREHOLDER STRUCTURE<br />
Chair<strong>man</strong><br />
63.83%<br />
Chair<strong>man</strong><br />
61.33%<br />
Shareholder Structure<br />
Manageme<br />
nt 2.73%<br />
In FY2012, Company bought back total 27,988,400<br />
shares, which was 2.88% of total issued share<br />
capital. All shares bought back have been cancelled<br />
Company<br />
Shareholder<br />
Structure<br />
Management<br />
0.15%<br />
Old<br />
Shareholders<br />
3.4%<br />
Public<br />
36.02%<br />
Public<br />
32.54%<br />
In FY2012, Chair<strong>man</strong> Mr. Wong Man Li bought back<br />
total 6,355,200 shares<br />
22
FUTURE PLANS & STRATEGIES<br />
MAN WAH HOLDINGS LIMITED FY2012<br />
23
EXPANSION STRATEGIES IN OVERSEAS MARKETS<br />
U.S. Market<br />
•Product development- new materials, new structures<br />
Europe Market<br />
•Customer expansion in new market such as France, Ger<strong>man</strong>y,<br />
Finland<br />
Exhibitions in U.S. and Europe<br />
24
EXPANSION STRATEGIES IN THE PRC MARKET<br />
Continue to expand “CHEERS” and “ENLANDA” retail network<br />
Further improve existing store perfor<strong>man</strong>ce<br />
Develop new products-new store format and products series<br />
In FY2012, more than 200 new models have been launched.<br />
25
SPONSORSHIP & PROMOTION EVENTS<br />
Promotion events<br />
�Airplane Showcase for potential clients to<br />
experience our products<br />
Advertisement<br />
�advertising on CCTV<br />
�outdoor advertisements: on the highway<br />
26
FACILITY UTILISATION<br />
Recliner Sofa production capacity and utilisation<br />
Sofa sets<br />
(‘000)<br />
900<br />
800<br />
700<br />
600<br />
500<br />
400<br />
300<br />
200<br />
100<br />
0<br />
90.8%<br />
19<br />
184<br />
50.7%<br />
247<br />
254<br />
57.6%<br />
212<br />
288<br />
78.9%<br />
109<br />
407<br />
313 279<br />
61.7% 65.8%<br />
503<br />
Utilisation (%)<br />
537<br />
FY2007 FY2008 FY2009 FY2010 FY2011 FY2012<br />
100%<br />
75%<br />
50%<br />
25%<br />
Utilised capacity Unused capacity Utilisation rate<br />
0%<br />
Bedding production capacity and utilisation<br />
Mattresses (‘000)<br />
100<br />
80<br />
60<br />
40<br />
20<br />
0<br />
71.4%<br />
8<br />
21<br />
68.9%<br />
13<br />
29<br />
74.4%<br />
11<br />
32<br />
68.3%<br />
19<br />
41<br />
78.3%<br />
13<br />
47<br />
Utilisation (%)<br />
83.3%<br />
FY2007 FY2008 FY2009 FY2010 FY2011 FY2012<br />
10<br />
50<br />
100%<br />
75%<br />
50%<br />
25%<br />
Utilised capacity Unused capacity Utilisation rate<br />
0%<br />
27
PRODUCTION FACILITIES<br />
Shenzhen Huizhou Wujiang Tianjin<br />
• Capacity to<br />
<strong>man</strong>ufacture<br />
approximately<br />
50,000 sets of<br />
reclining sofas per<br />
annum<br />
• Current capacity is<br />
766,000 sets of<br />
reclining sofas in<br />
Huizhou<br />
•The factory in<br />
Wujiang, Jiangsu<br />
province with capacity<br />
of 300,000 sets of<br />
reclining sofas will<br />
start operations in July<br />
2012<br />
•Reduce transportation<br />
cost in mainland China<br />
market<br />
•Increase “CHEERS”<br />
popularity in Central<br />
China<br />
• Signed a contract<br />
to acquire a piece<br />
of land in Tianjin<br />
• Support the<br />
Group's revenue<br />
growth within the<br />
next 5-8 years<br />
• Further strengthen<br />
the leading<br />
position in the<br />
recliner sofa<br />
industry<br />
28
Q&A<br />
MAN WAH HOLDINGS LIMITED FY2012<br />
29