- Page 1 and 2:
TABLE OF CONTENTS i Pages Symposium
- Page 3 and 4:
iii Pages Production of YY Male Til
- Page 5 and 6:
v Pages Special Session 2 - Volunte
- Page 7 and 8:
into the grow-out tanks. The airlif
- Page 9 and 10:
one above the other, reducing the
- Page 11 and 12:
nutritional requirements of summer
- Page 13 and 14:
Pump Functions The AMI Multi-Functi
- Page 15 and 16:
Introduction Commercial Application
- Page 17 and 18:
System Performance: Nine of these r
- Page 19 and 20:
electrical costs reduced by more th
- Page 21 and 22:
Nitrate, as the final product of th
- Page 23 and 24:
Culture conditions On August 1, 199
- Page 25 and 26:
surface area 740 m 2 /m 3 ). The co
- Page 27 and 28:
achieved a 750 mg/l decline in the
- Page 29 and 30:
ecomes possible without water repla
- Page 31 and 32:
tropical countries for tropical fis
- Page 33 and 34:
fastest absorption of nutrients fro
- Page 35 and 36:
Recirculation System Design; The KI
- Page 37 and 38:
The Japanese Aquaculture Market and
- Page 39 and 40:
Entrepreneurial and Economic Issues
- Page 41 and 42:
Our largest error though was in not
- Page 43 and 44:
Before You Invest. In my role as a
- Page 45 and 46:
are 590,000 kg/year. Prices, deprec
- Page 47 and 48:
Twenty-One Years of Commercial Reci
- Page 49 and 50:
have projects in the planning stage
- Page 51 and 52:
As the upward trend for seafood dem
- Page 53 and 54:
and the World Health Organization (
- Page 55 and 56:
Abstract not available at time of p
- Page 57 and 58:
increase the potential for bottlene
- Page 59 and 60:
Figure 1: Comparison of First, Seco
- Page 61 and 62:
Ecological and Resource Recovery Ap
- Page 63 and 64:
Acid mine drainage (AMD) is widespr
- Page 65 and 66:
and the polyphenol content (Northup
- Page 67 and 68:
References CAST. 1996. Integrated A
- Page 69 and 70:
Tilapia and Fish Wastewater Charact
- Page 71 and 72:
In comparison of gravity separation
- Page 73 and 74:
NY DEC Interaction. The owners of F
- Page 75 and 76:
O 2 Feed CO 2 Ammonia Figure 1. Gen
- Page 78 and 79:
The Hatchery The hatchery supports
- Page 80 and 81:
in crayfish populations, disappeara
- Page 82 and 83:
Table 2. Summary of average flows a
- Page 84 and 85:
depth decreases. Improvements in tr
- Page 86 and 87:
Perspective on the Role of Governme
- Page 88 and 89:
unprecedented in the growth of a ne
- Page 90 and 91:
with siting and the special equipme
- Page 92 and 93:
disease. We need to create environm
- Page 94 and 95:
Introduction Implications of Total
- Page 96 and 97:
The NOAA/DOC Aquaculture Initiative
- Page 98 and 99:
Future Directions for the NOAA/DOC
- Page 100 and 101:
’ Conduct research and help devel
- Page 102 and 103:
Information sources for aquaculture
- Page 104 and 105:
Tilapia is an important fish specie
- Page 106 and 107:
To determine the RSE of the examine
- Page 108 and 109:
Fig.1(a) Typical integrated olfacto
- Page 110 and 111:
Table 1. Relative stimulatory effic
- Page 112 and 113:
feeder control algorithms on a PC s
- Page 114 and 115:
Durant, M. D., Summerfelt, S. T., H
- Page 116 and 117:
The Effects of Ultraviolet Filtrati
- Page 118 and 119:
Table 1. The mean (N = 20) initial
- Page 120 and 121:
Introduction Evaluation of UV Disin
- Page 122 and 123:
Figure 1 Schematic of the experimen
- Page 124 and 125:
Table 1 Summary of the tested resul
- Page 126 and 127:
similar disinfection efficiency. Th
- Page 128 and 129:
(2) UV254 transmittance was an impo
- Page 130 and 131:
Materials and Method Schematic draw
- Page 132 and 133:
the amount of added increase by pro
- Page 134 and 135:
Oxygen Management at a Commercial R
- Page 136 and 137:
the outlet and inlet DO concentrati
- Page 138 and 139:
daylight hours averaged 0.5 kg DO/k
- Page 140 and 141:
At this time, the control (both tan
- Page 142 and 143:
yellow color, while the water in th
- Page 144 and 145: Case Study: Genetic improvement of
- Page 146 and 147: and human effort. This commitment m
- Page 148 and 149: - Harold Kincaid works for the US F
- Page 150 and 151: Figure 1. Production and selection
- Page 152 and 153: Performance Comparison of Geographi
- Page 154 and 155: Abstract Issues in the Commercializ
- Page 156 and 157: The Salmon Example Salmon farming i
- Page 158 and 159: Second, as the salmon farming indus
- Page 160 and 161: Devlin, R.H., Yesaki, T.Y., Biagi,
- Page 162 and 163: Introduction Removal of Protein and
- Page 164 and 165: higher superficial air velocity gre
- Page 166 and 167: Hydrodynamics in the ‘Cornell-Typ
- Page 168 and 169: The ideal mean residence time was a
- Page 170 and 171: A sample pellet-flushing test is sh
- Page 172 and 173: tank’s dead time. When fish were
- Page 174 and 175: Partial-Reuse Systems Ideally, the
- Page 176 and 177: Figure 1. The partial-recirculating
- Page 178 and 179: Table 1. Mean values (± standard e
- Page 180 and 181: dioxide (1) and un-ionized ammonia
- Page 182 and 183: Comparative Growth of All-Female Ve
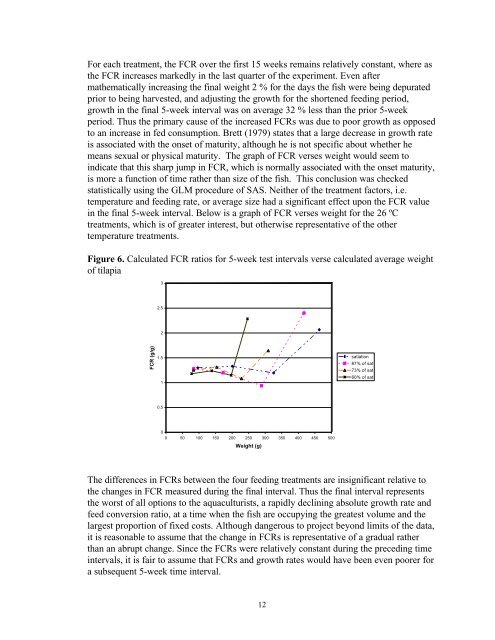
- Page 184 and 185: Effects of Temperature and Feeding
- Page 186 and 187: aquaculture systems, where the envi
- Page 188 and 189: Figure 2. Growth relationships of y
- Page 190 and 191: greater than the desired temperatur
- Page 192 and 193: Figure 3. Cumulative feed consumpti
- Page 196 and 197: C. Maximum specific feed consumptio
- Page 198 and 199: of the fish used in this experiment
- Page 200 and 201: Coche, A.G. Cage culture of tilapia
- Page 202 and 203: Predictive Computer Modeling of Gro
- Page 204 and 205: new studies begun. Daily water qual
- Page 206 and 207: Development Rationale for the Use o
- Page 208 and 209: Further, reduction in operating cos
- Page 210 and 211: The operation of the MRBF is domina
- Page 212 and 213: equired a high frequency of washing
- Page 214 and 215: Several dramatically different hull
- Page 216 and 217: support airlift applications. These
- Page 218 and 219: Enhancing Nitrification in Propelle
- Page 220 and 221: The last filter media used in this
- Page 222 and 223: Table 2. Water quality analyses wer
- Page 224 and 225: 1193.67 g-NO2 m -3 d -1 with the ni
- Page 226 and 227: Biofilters Used in Recirculating Fi
- Page 228 and 229: The Cyclone Sand Biofilter: A New D
- Page 230 and 231: Marine Biotech (Beverly, MA) 2 has
- Page 232 and 233: 120.0% 100.0% 80.0% 60.0% 40.0% 20.
- Page 234 and 235: Nitrification Potential and Oxygen
- Page 236 and 237: diffused aeration. The experiments
- Page 238 and 239: It needs to be pointed out that the
- Page 240 and 241: ammonia removal rate was low in the
- Page 242 and 243: Tanaka, H. and Dunn, I. 1982. Kinet
- Page 244 and 245:
Ammonia removal activity was increa
- Page 246 and 247:
Ammonia Conc. (mg/NH 4 + -N/L) 12 1
- Page 248 and 249:
Antifouling Sensors and Systems for
- Page 250 and 251:
The Vic Thomas Striped Bass Hatcher
- Page 252 and 253:
Introduction In the Central Valley
- Page 254 and 255:
Each of the two recirculation syste
- Page 256 and 257:
Body injury rates (% of fish) to th
- Page 258 and 259:
usiness expectations and limited te
- Page 260 and 261:
needs of the endemic Murray-Darling
- Page 262 and 263:
sold (Gooley et al. 1999). The dist
- Page 264 and 265:
In response to the large levels of
- Page 266 and 267:
planning at the outset will, more t
- Page 268 and 269:
Table 1 Summaries of selected speci
- Page 270 and 271:
a) Photo courtesy of Neil Armstrong
- Page 272 and 273:
Information flow 1. Initial concept
- Page 274 and 275:
achieve continuous production, faci
- Page 276 and 277:
Solids Removal (9.71%) Electricity
- Page 278 and 279:
The Effect of Fish Biomass and Deni
- Page 280 and 281:
Marine Denitrification of Denitrifi
- Page 282 and 283:
(a) (b) (c) Nitrate conc. (mg NO 3
- Page 284 and 285:
6. Poxton, M. G. and S. R. Allouse.
- Page 286 and 287:
control unit. Two distinct advantag
- Page 288 and 289:
the many variables that are involve
- Page 290 and 291:
Filtration Recirculation systems re
- Page 292 and 293:
6. AERATION DEVICE: 6” airstones
- Page 294 and 295:
Piper, R.G., I.B. McElwain, L.E. Or
- Page 296 and 297:
carried out for both the 50 m 3 and
- Page 298 and 299:
possible to predict mean monthly ta
- Page 300 and 301:
Recirculation Systems for Farming E
- Page 302 and 303:
of this pilot-system will be evalua
- Page 304 and 305:
Figure 2. The main screen of the en
- Page 306 and 307:
What: What is your business structu
- Page 308 and 309:
should more than offset the costs o
- Page 310 and 311:
• Any other documents indicating
- Page 312 and 313:
production projects. Once these par
- Page 314 and 315:
A single discharge pipe works to re
- Page 316 and 317:
1. Oxygen recharge rates or the abi
- Page 318 and 319:
2.9.1.2. Measure ammonia. 2.9.1.3.
- Page 320 and 321:
Discharge pipe Number used within e
- Page 322 and 323:
Previous efforts by the Illinois De
- Page 324 and 325:
media. The water enters the filter
- Page 326 and 327:
Table 3: Summary of pro forma cash
- Page 328 and 329:
References Moss, S.M. (1999) “Bio
- Page 330 and 331:
Propagation and Culture of Endanger
- Page 332 and 333:
at a rate of 2 ft 3 /kg feed/d. Sod
- Page 334 and 335:
Modification of D-Ended Tanks for F
- Page 336 and 337:
MATERIALS AND METHODS All tests wer
- Page 338 and 339:
The single 100 ppm hydrogen peroxid
- Page 340 and 341:
The Potential for the Presence of B
- Page 342 and 343:
The main advantage for microorganis
- Page 344 and 345:
organism causes disease in humans,
- Page 346 and 347:
Bacteria No. of Facilities No. of D
- Page 348 and 349:
Assanta, M.A., Roy, D. and Montpeti
- Page 350 and 351:
Jones, K. and Bradshaw, S.B. (1996)
- Page 352 and 353:
Wilderer, P.A. and Characklis, W.G.
- Page 354 and 355:
systems (Egusa, 1981; Mellergaard a
- Page 356 and 357:
ecirculating system after mortality
- Page 358 and 359:
Fish Health Monitoring and Maintena
- Page 360 and 361:
disease problems. For tilapia, a sp
- Page 362 and 363:
The Role of Fish Density in Infecti
- Page 364 and 365:
This apparent interaction between t
- Page 366:
References Banks, J.L. (1994) Racew