TABLE OF CONTENTS Pages Symposium 1 - the National Sea ...
TABLE OF CONTENTS Pages Symposium 1 - the National Sea ...
TABLE OF CONTENTS Pages Symposium 1 - the National Sea ...

You also want an ePaper? Increase the reach of your titles
YUMPU automatically turns print PDFs into web optimized ePapers that Google loves.
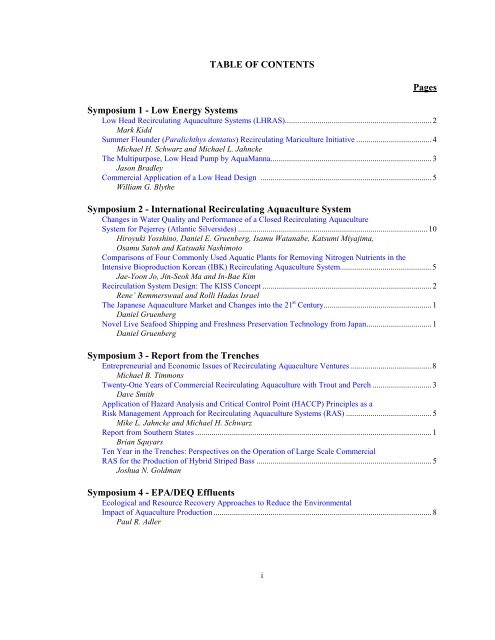
<strong>TABLE</strong> <strong>OF</strong> <strong>CONTENTS</strong><br />
i<br />
<strong>Pages</strong><br />
<strong>Symposium</strong> 1 - Low Energy Systems<br />
Low Head Recirculating Aquaculture Systems (LHRAS)........................................................................ 2<br />
Mark Kidd<br />
Summer Flounder (Paralichthys dentatus) Recirculating Mariculture Initiative ..................................... 4<br />
Michael H. Schwarz and Michael L. Jahncke<br />
The Multipurpose, Low Head Pump by AquaManna............................................................................... 3<br />
Jason Bradley<br />
Commercial Application of a Low Head Design .................................................................................... 5<br />
William G. Bly<strong>the</strong><br />
<strong>Symposium</strong> 2 - International Recirculating Aquaculture System<br />
Changes in Water Quality and Performance of a Closed Recirculating Aquaculture<br />
System for Pejerrey (Atlantic Silversides) ............................................................................................. 10<br />
Hiroyuki Yosshino, Daniel E. Gruenberg, Isamu Watanabe, Katsumi Miyajima,<br />
Osamu Satoh and Katsuaki Nashimoto<br />
Comparisons of Four Commonly Used Aquatic Plants for Removing Nitrogen Nutrients in <strong>the</strong><br />
Intensive Bioproduction Korean (IBK) Recirculating Aquaculture System............................................. 5<br />
Jae-Yoon Jo, Jin-Seok Ma and In-Bae Kim<br />
Recirculation System Design: The KISS Concept ................................................................................... 2<br />
Rene’ Remmerswaal and Rolli Hadas Israel<br />
The Japanese Aquaculture Market and Changes into <strong>the</strong> 21 st Century..................................................... 1<br />
Daniel Gruenberg<br />
Novel Live <strong>Sea</strong>food Shipping and Freshness Preservation Technology from Japan................................ 1<br />
Daniel Gruenberg<br />
<strong>Symposium</strong> 3 - Report from <strong>the</strong> Trenches<br />
Entrepreneurial and Economic Issues of Recirculating Aquaculture Ventures ........................................ 8<br />
Michael B. Timmons<br />
Twenty-One Years of Commercial Recirculating Aquaculture with Trout and Perch ............................. 3<br />
Dave Smith<br />
Application of Hazard Analysis and Critical Control Point (HACCP) Principles as a<br />
Risk Management Approach for Recirculating Aquaculture Systems (RAS) .......................................... 5<br />
Mike L. Jahncke and Michael H. Schwarz<br />
Report from Sou<strong>the</strong>rn States .................................................................................................................... 1<br />
Brian Squyars<br />
Ten Year in <strong>the</strong> Trenches: Perspectives on <strong>the</strong> Operation of Large Scale Commercial<br />
RAS for <strong>the</strong> Production of Hybrid Striped Bass ...................................................................................... 5<br />
Joshua N. Goldman<br />
<strong>Symposium</strong> 4 - EPA/DEQ Effluents<br />
Ecological and Resource Recovery Approaches to Reduce <strong>the</strong> Environmental<br />
Impact of Aquaculture Production ........................................................................................................... 8<br />
Paul R. Adler
ii<br />
<strong>Pages</strong><br />
Tilapia and Fish Wastewater Characterization and Regulatory Experiences in New York...................... 7<br />
Michael Timmons and Shulin Chen<br />
Michigan’s Platte River State Fish Hatchery Case History.................................................................... 10<br />
Harry Westers<br />
Perspective on <strong>the</strong> Role of Government, Industry, and Research in Advancing <strong>the</strong><br />
Environmental Compatibility and Substainability of Aquaculture........................................................... 8<br />
Joseph A. Hankins<br />
Implication of Total Maximum Daily Load (TMDLs) on Aquaculture ................................................... 2<br />
Charles H. Martin<br />
Technical Session 1 - Volunteered Papers<br />
The NOAA/DOC Aquaculture Initiative and Policy and Its Implication for<br />
Recirculation Systems.............................................................................................................................. 7<br />
Jim McVey<br />
Olfactory Sensitivity of <strong>the</strong> Nile Tilapia, Oreochromis Niloticus, to Amino Acids................................. 8<br />
M. Fares, T. Shoji, R. El-S Saleh, M.A. Sobeih, Z.H. Anmed and H. Ueda<br />
Development of a Third Generation Acoustic Waste Feed Monitor........................................................ 4<br />
Scott Tsukuda, Roger Wallace, Steven Summerfelt, John Davidson and Joseph Hankins<br />
Effect of Different Protein/Energy Ratios on Growth Response of Tilapia ............................................. 1<br />
Fatma A. Hafez<br />
Technical Session 2 - RAS Supplementation and Disinfection<br />
The Effects of Ultraviolet Filtration on <strong>the</strong> Production of <strong>the</strong> Gold Fish Carassius auratus in<br />
Recirculating Systems .............................................................................................................................. 4<br />
Donald I. Anadu<br />
Evaluation of UV Disinfection Performance in Recirculating Systems ................................................... 9<br />
Songming Zhu, Brooks Saucier, James Durfey and Shulin Chen<br />
Effects of Baffle Depth on Oxygenation at <strong>the</strong> Pumping Station of Intensive Bioproduction<br />
Korean (IBK) Recirculating Aquaculture System.................................................................................... 5<br />
Jae-Yoon Jo, In-Bae Kim, Jeonghwan Park, Jin Hwan Lee and Kuen-Hack Suh<br />
Oxygen Management at a Commercial Recirculating Aquaculture Farm Producing Atlantic<br />
Salmon (Salmo salar) Smolts................................................................................................................... 5<br />
Edward Parker, Michel Couturier and Tillmann Benfey<br />
Ozone Dose and Equilibrium TOC in Recirculating Systems.................................................................. 4<br />
Valdis Krumins, James Ebeling and Fred Wheaton<br />
Technical Session 3 - Genetics for Recirculating Aquaculture System<br />
Genetic Improvement of Fishes for Commercial Recirculating Aquaculture Systems:<br />
A Case Study Involving Tilapia ............................................................................................................... 8<br />
Eric M. Hallerman<br />
Strain Evaluation and Selective Breeding of Striped Bass....................................................................... 1<br />
Scott Lindell<br />
Performance Comparison of Geographically Distinct Strains of White Bass to Produce<br />
Sunshine Bass .......................................................................................................................................... 1<br />
Christopher C. Kohler, Robert J. Sheehan, Joseph J. Myers, James B. Rudacille,<br />
M. Lizabeth Allyn and A. Victor Suresh
iii<br />
<strong>Pages</strong><br />
Production of YY Male Tilapia ............................................................................................................... 1<br />
Robert Abernathy<br />
Issues in <strong>the</strong> Commercialization of Transgenic Fish................................................................................ 8<br />
Elliot Entis<br />
Technical Session 4 - RAS Operation<br />
Removal of Protein and TSS From <strong>Sea</strong> Water by Foam Separator.......................................................... 4<br />
Kuen-Hack Suh, Byong-Jin Kim, Sung-Koo Kim and Jae-Yoon Jo<br />
Hydrodynamics in <strong>the</strong> ‘Cornell-Type’ Dual-Drain Tank ......................................................................... 7<br />
Steven T. Summerfelt, John Davidson and Michael B. Timmons<br />
A Partial-Reuse System for Coldwater Aquaculture ................................................................................ 9<br />
Steve Summerfelt, John Davidson, Thomas Waldrop and Scott Tsukuda<br />
Comparative Growth of All-Female Versus Mixed Sex Yellow Perch (Perca Flavescens)<br />
in Recirculating Systems.......................................................................................................................... 2<br />
Mark H. Schmitz<br />
Effects of Temperature and Feeding Rates Upon Growth and Feed Conversion<br />
Ratios in Tilapia..................................................................................................................................... 18<br />
Stephen P. Kirkup, Lori S. Marsh, George S. Libey, Alan G. Heath, Charles W. Coale<br />
and C. Gene Haugh<br />
AES Session 1 - Volunteered Papers<br />
Predictive Computer Modeling of Growth and Feeding Rates for Pacific White Shrimp,<br />
Penaeus vanammei, in Hard Freshwater.................................................................................................. 4<br />
Anthony F. Pegel and J. Richard Booth<br />
Development Rationale for <strong>the</strong> Use of Marine Recirculating BioFilters to Simplify<br />
Management Strategies and Reduce Costs Associated with Marine Aquaculture Systems.................... 12<br />
Ronald F. Malone, Douglas G. Drennan, Christopher J. Stahl and Lance E. Beecher<br />
Enhancing Nitrification in Propeller-Washed Bioclarifiers with Modified Floating Bead Media ......... 10<br />
Christopher J. Stahl, Douglas G. Drennan, Lance E. Beecher and Ronald F. Malone<br />
The Cyclonic Sand Biofilter: A New Design Concept and Field Evaluation........................................... 5<br />
Michael B. Timmons, Neil Helwig and Steven T. Summerfeilt<br />
AES Session 2 - Volunteered Papers<br />
U.S. EPA’s Development of Aquaculture Effluent Limitation Guideline Regulations and<br />
<strong>the</strong> Role of <strong>the</strong> Joint Subcommittee on Aquaculture and O<strong>the</strong>r Stakeholders.......................................... 1<br />
Michael L. Clipper<br />
Nitrification Potential and Oxygen Limitation in Biofilters..................................................................... 9<br />
Brooks Saucier, Songming Zhu and Shulin Chen<br />
Nitrification Performance of Nitrifiers Immobilized in PVA (Polyvinyl alcohol) for Marine<br />
Recirculating Aquarium System............................................................................................................... 4<br />
Sung-Koo Kim, Jae-Koan Seo, Eun-Ju Park and Kuen-Hack Suh<br />
Recirculating Systems for Maintenance and Propagation of Freshwater<br />
Mussels (Unionidae) .............................................................................................................................. .1<br />
William F. Henley, Lora L. Zimmerman, Mark R. Kidd and Richard J. Neves<br />
Antifouling Sensors and Systems for Continuous Dissolved Oxygen, Ph, and<br />
Temperature Measurements ..................................................................................................................... 1<br />
<strong>Sea</strong>n M. Christian, Paul Grems Duncan and John A. Schroeder
iv<br />
<strong>Pages</strong><br />
AES Session 3 - Volunteered Papers<br />
Intensive Recirculation Aquaculture Facility at <strong>the</strong> Hackettstown State Fish Hatchery<br />
Warren County, New Jersey..................................................................................................................... 1<br />
Thomas L. Johnson<br />
The Vic Thomas Striped Bass Hatchery at Brookneal, Virginia.............................................................. 1<br />
Thomas L. Johnson<br />
Use of a Recirculating Aquaculture System to Hold Sacramento Splittail and Native<br />
Fish Species ............................................................................................................................................. 6<br />
Louis A. Helfrich, Brent Bridges, Lloyd Hess, Don Ferris, Diana L. Weigmann and<br />
Charles Liston<br />
Recirculating Aquaculture Systems in Australia: A Syn<strong>the</strong>sis of Systems, Species,<br />
and <strong>the</strong> Networking Approach ............................................................................................................... 15<br />
Brendan Larkin<br />
Program to Facilitate <strong>the</strong> Preliminary Design of Land-Based Recirculating Aquaculture<br />
Facilities................................................................................................................................................... 5<br />
T. McCallum, M. Rifai, M. Couturier and T. Pugsley<br />
AES Session 4 - Volunteered Papers<br />
The Effect of Fish Biomass and Denitrification on <strong>the</strong> Energy Balance in African<br />
Catfish Farms ........................................................................................................................................... 2<br />
E.H. Eding, O. Schneider, E.N.J. Ouwerkerk, A. Klapwijk, J.A.J. Verreth and<br />
A.J.A. Aarnink<br />
Marine Denitrification of Denitrifer Consortium Immobilized in Polyvinyl Alcohol .............................. 5<br />
Sung-Koo Kim, Eun-Ju Park, Jae-Koan Seo and Kuen-Hack Suh<br />
Basic Design Considerations for Small Fish Holding Facilities: For <strong>the</strong> Biologist/Aquarist................. 10<br />
Todd S. Harmon<br />
Heat Budget Model for Predicting Water Temperature in Outdoor Intensive Fish Tanks<br />
Under Greenhouse Cover......................................................................................................................... 5<br />
Arik Ashkenazil, Noam Mozes and Ido Seginer<br />
Recirculation Systems for Farming Eel in Western Europe; Towards a Certified Environmental<br />
Performance ............................................................................................................................................. 5<br />
Andries Kamstra, Peter Rand, Kees Kloet and Andre Aarnink<br />
Special Session 1 - Economics/Computers<br />
Business Planning for Urban Aquaculture ............................................................................................... 6<br />
Lawrence D. Tagrin<br />
Designing A Research Protocol for Economic and Financial Analysis Phase 1 .................................... 10<br />
Alice T. Spradlin, Ryan A<strong>the</strong>arn, Charlie Coale, Mark Kidd, George Libey,<br />
Greg Boardman, George Flick, Stephen Smith, Eric Herbst and Simonel Sandu<br />
Economic Viability of an Aquaculture Producer/Processor COOP (APPC) in a North<br />
Central Location....................................................................................................................................... 2<br />
Patrick D. O’Rourke, Kerry Tudor and Patrick Foley<br />
Economics of Shrimp Culture in a Freshwater Recirculating Aquaculture System.................................. 6<br />
Peter Van Wyk
v<br />
<strong>Pages</strong><br />
Special Session 2 - Volunteered Papers<br />
Role of Biological Filters in <strong>the</strong> Maintenance of Water Quality in <strong>the</strong><br />
Recirculation System................................................................................................................................1<br />
JaiGopal Sharma, Sunil Kumar and Rina Chakrabarti<br />
Propagation and Culture of Endangered Freshwater Juvenile Mussels in a Recirculating<br />
Aquaculture System ................................................................................................................................. 1<br />
Jess W. Jones and Richard J. Neves<br />
Use of Recirculating Aquaculture Systems (RAS) for Eel (Anguilla rostrata)<br />
Production in Virginia.............................................................................................................................. 2<br />
Scott Smith<br />
Use of Bead Filter Backwash to Enhance Shrimp Growth....................................................................... 1<br />
Shaun M. Moss, Clete A. Otoshi and Anthony D. Montgomery<br />
Modification of D-Ended Tanks for Flat Fish Culture ............................................................................. 1<br />
Greg Beckman<br />
Special Session 3 - Fish Health Issues<br />
Effects of Chloramine-T and Hydrogen Peroxide on Nitrification in Fluidized-Sand<br />
Biofilters for Cold Water Fish Production ............................................................................................... 5<br />
Michael F. Schwartz, Graham L. Bullock, Joseph A. Hankins, Steven T. Summerfelt<br />
and Jay A. Mathias<br />
The Potential for <strong>the</strong> Presence of Bacterial Pathogens in Biofilms of Recirculating<br />
Aquaculture Systems.............................................................................................................................. 13<br />
Robin K. King and George J. Flick<br />
Transmission of Furunculosis and Enteric Redmouth by Means of Fluidized Sand Biofilters ................ 5<br />
G.L. Bullock, W.B. Schill and E.Burchard<br />
Fish Health Monitoring and Maintenance of Small Scale Recirculating Systems in Virginia ................. 4<br />
David Crosby<br />
The Role of Fish Density in Infectious Disease Outbreaks...................................................................... 5<br />
Julie Bebak, Phil McAllister, Ray Boston and Gary Smith
Low Head Recirculating Aquaculture Systems (LHRAS)<br />
Mark Kidd<br />
Laboratory Specialist Senior<br />
Virginia Tech Aquaculture Center<br />
1 Plantation Road<br />
Blacksburg, VA 24060-0321<br />
Energy can be one of <strong>the</strong> largest variable costs in <strong>the</strong> operation of a recirculating<br />
aquaculture system. One way to reduce pumping costs is to utilize low head equipment.<br />
For <strong>the</strong> purpose of this presentation, low head will be construed as less than 8 inches (20<br />
cm) total head for <strong>the</strong> system. Total head can be defined as <strong>the</strong> sum of <strong>the</strong> head required<br />
by each component in <strong>the</strong> recycle path.<br />
A low head recirculating aquaculture system has been designed, constructed, and is<br />
being tested at <strong>the</strong> Vriginia Tech Aquaculture Lab. Each recirculating system contains<br />
two grow-out tanks; a filtration vessel containing a microscreen drum filter; and four<br />
rotating biological contactor (RBC) biofilters; sixteen airlift pumps (eight per tank); a<br />
regenerative blower with air lines, vacuum lines, and air distribution manifold; a<br />
discharge pipe; and a fresh water supply. Each grow-out tank (20 feet [6.1 m] long, 5<br />
feet [1.5 m] wide, and 3.3 feet [1 m] deep) holds 2468 gallons (9342 liters). The filtration<br />
vessel is 22 feet [7 m] long, 2 feet [0.7 m] wide, and 2.25 feet [0.68 m] deep and contains<br />
740 gallons (2802 liters). The microscreen drum filter consists of a 22 inches (56 cm)<br />
diameter drum covered with 120µ stainless steel mesh screen, a 10 inch (25 cm) diameter<br />
pipe/axel, a stainless steel frame, vacuum head, and a 0.05 hp (38 kW) gearmotor.<br />
Each tank has a 6-inch airlift distribution manifold with eight, two inch airlift pumps<br />
evenly distributed across <strong>the</strong> width of <strong>the</strong> tank. Each airlift provides 25 gallons per<br />
minute (G.P.M.) for a total flow of 200 G.P.M. (95 lpm) per tank. Each of <strong>the</strong> four RBCs<br />
are 4 feet (1.2 m) in diameter, 20 inches (50.8 cm) wide, with approximately fifteen<br />
hundred square feet (140 square meters).<br />
A regenerative blower provides air and vacuum for two systems (four tanks). The blower<br />
has a 1.5 horsepower (1.1 KW) electric motor and supplies 96 SCFM (standard cubic feet<br />
per minute) (2.7 cubic meters per minute) of air at 30 inches (76 cm) of water pressure.<br />
The single regenerative blower produces energy for water movement (airlift pumps),<br />
rotation of <strong>the</strong> RBCs, and vacuum for solids removal from <strong>the</strong> drum filter. A single<br />
discharge pipe removes effluent from <strong>the</strong> microscreen drum filter vacuum head and<br />
discharges <strong>the</strong> waste into <strong>the</strong> sewer system. The fresh water supply line is used for water<br />
replacement.<br />
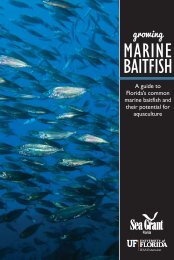
In operation water flows from each grow-out tank through an 8-inch (20 cm) PVC pipe<br />
into <strong>the</strong> first section of <strong>the</strong> filtration vessel (Figure 1), through <strong>the</strong> 120 µ screen on <strong>the</strong><br />
drum filter, across <strong>the</strong> four RBCs, through a 6-inch (15 cm) PVC pipe to <strong>the</strong> eight 2 inch<br />
(5 cm) diameter airlift pumps. The airlift pumps lift <strong>the</strong> water from <strong>the</strong> filtration vessel<br />
1
into <strong>the</strong> grow-out tanks. The airlift pumps also add oxygen to <strong>the</strong> water and remove<br />
carbon dioxide. All of <strong>the</strong> system water passes through <strong>the</strong> filtration vessel six times per<br />
hour.<br />
FIGURE 1: Schematic of <strong>the</strong> Low Head Recirculating Aquaculture System being<br />
tested at <strong>the</strong> Virginia Tech Aquaculture Center, Blacksburg, VA.<br />
Growout<br />
tank<br />
Fresh water<br />
supply<br />
6-inch pipe<br />
8-inch<br />
pipe<br />
Biofilter vessel<br />
Microscreen drum filter<br />
2<br />
Airlift header w/ 8 airlifts pumps<br />
Vacuum line<br />
Biofilter (4)<br />
Discharge pipe<br />
Air lines<br />
Regenerative blower
Summer Flounder (Paralichthys dentatus) Recirculating<br />
Mariculture Initiative<br />
Michael H. Schwarz<br />
Aquaculture Specialist<br />
Virginia <strong>Sea</strong>food Agricultural Research and<br />
Extension Center<br />
102 South King Street<br />
Hampton, Virginia 23669<br />
Introduction<br />
1<br />
Michael L. Jahncke<br />
Director/Associate Professor<br />
Virginia <strong>Sea</strong>food Agricultural Research and<br />
Extension Center<br />
102 South King Street<br />
Hampton, Virginia 23669<br />
According to <strong>the</strong> Food and Agriculture Organization (FAO), total world fish production<br />
reached 122 million tons in 1997. Of this amount, over 28.8 million tons (> 20 %), was<br />
derived from aquaculture (Anonymous, 2000). Unfortunately, production has been<br />
limited mostly to foreign countries, and is overshadowed by an even greater decrease in<br />
wild capture fisheries. The world’s fisheries supplies have stabilized at approximately 80<br />
million metric tons, and projected demand for seafood by 2010 is 110 to 120 million<br />
metric tons. As <strong>the</strong> upward trend for seafood increases, <strong>the</strong> U.S. must develop alternative<br />
seafood supplies or suffer increasing trade imbalances in fishery products (Garrett et al.,<br />
2000).<br />
These trends have resulted in economic hardship to coastal states and adds to <strong>the</strong> growing<br />
US trade deficit. In addition, over <strong>the</strong> past 15 years flounder catches in this country have<br />
declined significantly (Waters, 1996). Landings of flounder on <strong>the</strong> Atlantic coast dropped<br />
from 185 million pounds in 1984 to 53 million pounds in 1994 (Waters, 1996). Virginia is<br />
severely impacted by <strong>the</strong> loss of natural fisheries stocks. Boat landings of summer flounder<br />
in Virginia dropped from 9.6 million pounds in 1984 to 3 million pounds in 1994, and are<br />
regulated by a quota of approximately 2 million pounds per year (VMRC, 1998).<br />
In September of 1997, <strong>the</strong> Virginia <strong>Sea</strong>food Agricultural Research and Extension Center<br />
(VSAREC), Hampton, VA, initiated a marine recirculating aquaculture. This initiative was<br />
designed to foster Virginia’s fledging marine commercial aquaculture industry. Summer<br />
flounder (Paralichthys dentatus), an emerging aquaculture species, is <strong>the</strong> focus of research<br />
at <strong>the</strong> VSAREC. Summer flounder was chosen as <strong>the</strong> primary species for <strong>the</strong> mariculture<br />
program. Our research program is focused on isolation and quarantine, production<br />
systems, diet optimization and genetic selection.<br />
Isolation and Quarantine<br />
In June 1998, flounder were purchased from outside sources and stocked into a special<br />
isolation and quarantine room. The isolation facility incorporates <strong>the</strong> use of lobster<br />
holding vessels. These tanks lend <strong>the</strong>mselves to flatfish production as <strong>the</strong>y can be stacked
one above <strong>the</strong> o<strong>the</strong>r, reducing <strong>the</strong> ‘footprint” or floor space requirement of <strong>the</strong> system. A<br />
¾ HP pump and upflow bead filter with enhanced media provides primary mechanical<br />
filtration. Water leaving <strong>the</strong> bead filter, flows through an air-driven rotating biological<br />
contactor (RBC). Following biological filtration, <strong>the</strong> water falls into <strong>the</strong> top tank<br />
providing aeration, off gassing and a self-cleaning circular flow pattern for <strong>the</strong> top tank.<br />
Water overflows <strong>the</strong> center drain of <strong>the</strong> top tank and falls by gravity, into <strong>the</strong> bottom tank.<br />
Water is removed via <strong>the</strong> center drain using a pump and flows to <strong>the</strong> bead filter. A<br />
customized countercurrent protein skimmer utilizes ozone injection and oxidation<br />
reduction potential (ORP) monitoring to regulate ozonation. Results indicate survival<br />
rates of 64%, and food conversion ratios (FCR) of 1.21 on a mean fish size of 235 grams.<br />
The low average weight is because survival was emphasized, allowing many poor<br />
performing fish to remain in <strong>the</strong> system.<br />
Production Systems<br />
In June 1999, a second facility was constructed for <strong>the</strong> production systems. These<br />
production systems are designed to minimize construction and operating costs while<br />
maximizing growth and survival. Utilizing double-drain technology in conjunction with<br />
swirl separators and RBC’s, <strong>the</strong>se systems incorporate airlift technology for water flow,<br />
aeration, and degassing. Low total suspended solids (TSS) water from <strong>the</strong> double drain<br />
flows directly to air-driven RBC’s, via airlift manifolds. Solids laden water from <strong>the</strong><br />
double drains flows into swirl separators, through custom designed protein skimmers,<br />
returning to <strong>the</strong> systems via <strong>the</strong> RBC vessels. Skimmers are operated via injected ozone.<br />
Low moisture feed gas is provided using a small air compressor and refrigerated air dryer.<br />
Ozone generation is controlled using ORP controllers, maintaining <strong>the</strong> systems between<br />
200 and 300 mV. Within this range, adequate oxidation is maintained, while minimizing<br />
buildup of hyperbromous acid and o<strong>the</strong>r byproducts formed by ozonating natural<br />
seawater. With <strong>the</strong> application of swirl separators and increased flocculation<br />
characteristics provided by highly efficient ozonated protein skimmers, <strong>the</strong> systems are<br />
performing beyond expectation. The systems were initially operated at five percent<br />
exchange per day, and are presently stocked at 0.25 pounds per gallon, and operating at<br />
less than two percent exchange per week.<br />
Diet Optimization<br />
Considering Virginia's climate, environmental requirements of summer flounder and <strong>the</strong><br />
necessity of operating environmentally responsible grow-out facilities, on-shore culture of<br />
marine summer flounder will probably be limited to intensive RAS. Fish grown in RAS<br />
are totally dependent on artificial feeds for <strong>the</strong>ir nourishment (Lovell, 1989). In RAS,<br />
feeds are required to supply all essential nutrients required for cultured fish, including<br />
metabolism, respiration, immune response, locomotion and growth. Since <strong>the</strong>re are no<br />
secondary nutritional inputs as exist in pond aquaculture, a complete understanding of <strong>the</strong><br />
nutrient requirements of a species for commercial culture in RAS is essential.<br />
2
To date, <strong>the</strong> U.S. summer flounder industry, utilizing RAS is confronted with limited<br />
knowledge on <strong>the</strong> nutritional requirements of summer flounder (pers. comm., George<br />
Nardie, Great Bay Aquafarms; Kathy Downey, Trio Algarvio; Dr. David Bengtson, URI;<br />
Dr. Harry Daniels, UNC; and Dr. Wade Watanabe, UNCW). In that regard, scientists<br />
have begun implementation of a nutrition program at <strong>the</strong> VSAREC. The overall objective<br />
of this program is to implement nutrition studies necessary to determine <strong>the</strong> nutritional<br />
requirements of summer flounder. Based on nutrition studies conducted on o<strong>the</strong>r species<br />
(i.e. red drum and hybrid striped bass; Gatlin, 1992, 1995) scientists intend to streamline<br />
<strong>the</strong> process of determining key nutritional requirements for summer flounder.<br />
To date, a replicated research nutrition system has been constructed, and an initial lipid<br />
nutrition study is underway. The nutrition system is comprised of 18 – 20L aquaria<br />
operated in parallel. The aquaria are fed by a single distribution manifold which is<br />
operated at 3 PSI. For each aquarium, a PVC spigot valve is connected to a 3/16” ID 90 o<br />
hose barb to assure identical flow into each aquarium. The aquaria drain via a U-shaped<br />
external ¾” PVC standpipe into a common PVC rain-gutter. Tank effluent traverses <strong>the</strong><br />
rain gutter and discharges into a 750L reservoir, which contains 3 cubic feet of suspended<br />
media allowing it to act simultaneously as a biofilter. Water is withdrawn from <strong>the</strong> bottom<br />
center of <strong>the</strong> reservoir, by a ¾ HP pool pump, pumped through a 1 Hp titanium chiller,<br />
and <strong>the</strong>n into an upflow bead filter for solids removal and secondary biofiltration. Upon<br />
exiting <strong>the</strong> bead filter, <strong>the</strong> water flow reenters <strong>the</strong> distribution pipe feeding water to all <strong>the</strong><br />
aquaria. A side-loop reservoir pumps water through a venturi driven protein skimmer.<br />
The protein skimmer venturi is fed by ozonated dry air. Ozonated effluent from <strong>the</strong><br />
skimmer returns directly to <strong>the</strong> reservoir. Food grade sodium bicarbonate is added to <strong>the</strong><br />
systems on an as needed basis to maintain a pH above 7.5.<br />
For <strong>the</strong> lipid study, four experimental diets were formulated to contain 55% crude protein<br />
on a dry weight basis made from a combination of herring meal and casein. Lipid was<br />
added in <strong>the</strong> form of herring oil to levels of 8, 12, 16 and 20% (dry weight basis). Dextrin<br />
was added in place of lipid to maintain isocaloric diet. The control diet was composed of<br />
55 % protein (from 100% herring meal) and 16% dietary lipid, which mimicks current<br />
commercial summer flounder diets.<br />
Initial results from <strong>the</strong> study indicate that weight gain of fish fed a diet with 8% lipid was<br />
20% higher than for fish fed a 16% lipid diet. The increased weight gain of fish fed diets<br />
containing 8 and 12% dietary lipid compared with fish fed a 16% lipid diet may suggest<br />
that current commercial diets for summer flounder may contain higher lipid levels<br />
necessary for optimum growth. It was also observed that <strong>the</strong> inclusion of high levels of<br />
casein did not adversely affect diet palatability. Summer flounder fed diets with casein<br />
outperformed fish fed <strong>the</strong> control diet without casein.<br />
Fish fed <strong>the</strong> lowest lipid level diet and diets with <strong>the</strong> highest level of dextrin<br />
(approximately 23% of dry diet) had <strong>the</strong> greatest weight gain. These results suggest <strong>the</strong><br />
possible formulation of experimental diets using semi-purified ingredients without<br />
negatively effecting performance. This is a distinct advantage in determining quantifiable<br />
3
nutritional requirements of summer flounder. Preliminary data from this study suggest<br />
that summer flounder may have difficulty utilizing high levels of fishmeal in <strong>the</strong> presence<br />
of 16% lipid (i.e., fish fed this control diet had <strong>the</strong> lowest weight gain).<br />
Genetic Selection<br />
A hatchery initiative is underway, incorporating <strong>the</strong> use of microsatellite DNA marking to<br />
identify genetically selected broodstock. With this technology, f-1 progeny can be<br />
analyzed to determine genetic contribution from individual broodstock. In this fashion,<br />
“best performing” broodstock can be identified, and genetic heterozygosity can be<br />
maintained.<br />
Literature Cited<br />
Anonymous. “Status of World Aquaculture.” Aquaculture Magazine Buyers Guide<br />
6(2000):42<br />
Garrett, E.S., M.L. Jahncke, and R.E. Martin. “Applications of HACCP principles to<br />
address food safety and o<strong>the</strong>r issues in aquaculture: An overview.” J. of Aquatic Food<br />
Prod. Technol. (In Press). 2000.<br />
Gatlin, D.M., III. 1992. Development of Nutrition and Feeding Programs for Marine Fish.<br />
Proceedings of FOID 1992. First International Conference on Fisheries and Ocean<br />
Development. <strong>National</strong> Fisheries University of Pusan. February, 1992.<br />
Gatlin, D.M., III. Nutrition and Utilization Technology in Aquaculture. Champaign, IL:<br />
AOCS Press. 1995.<br />
Lovell, R. T. 1989. Nutrition and feeding of Fish. Van Nostrand Reinhold. New York,<br />
NY.<br />
Waters, D. “Sustainable flounder culture and fisheries.” North Carolina <strong>Sea</strong> Grant<br />
Publication UNC-SG-96-14. (1996):12.<br />
VMRC. 1998. Virginia Commercial Summer Flounder Landings 1980-1998, VMRC-<br />
Planning and Statistics Department.<br />
4
Introduction<br />
The Multipurpose, Low Head Pump by AquaManna<br />
Jason Bradley<br />
Aqua-Manna<br />
Ladoga, IN<br />
The AMI Multi-Functional Pump (patent pending) is a low head, low energy axial flow<br />
pump. It is unique to o<strong>the</strong>r pumps in <strong>the</strong> industry because of <strong>the</strong> four main distinct<br />
functions that it performs. Several years of research in <strong>the</strong> private sector with private<br />
funds is what makes this pump a practical and intricate part in fish production. It’s<br />
development and testing occurred on two working, for profit private farms. The first of<br />
which is Aqua-Manna Inc.(AMI). AMI developed, tested , manufacturers and has this<br />
pump in use on its farm in Ladoga, Indiana. The second farm that played an intricate part<br />
in <strong>the</strong> development and testing of <strong>the</strong> pump was HiBred Aquaculture Inc. in Vandalia,<br />
Illinois. HiBred uses this pump in its day to day fish production as well. This energy<br />
efficient pump plays a very important role in <strong>the</strong> growth and development of <strong>the</strong><br />
Aquaculture industry and will play a very large part in Agriculture as a whole.<br />
Research and Development<br />
It took several years of research to develop <strong>the</strong> AMI Multi-Functional Pump by Aqua-<br />
Manna Inc. Jim Bradley, President of Aqua-Manna has been involved in Aquaculture for<br />
15 years. In those 15 years, Jim has been in constant pursuit of efficient, reliable<br />
equipment. The AMI Multi-Functional Pump’s development began in <strong>the</strong> fall of 1998. It<br />
was developed on Aqua-Manna’s farm in Ladoga, Indiana. Most of <strong>the</strong> testing and actual<br />
day to day use came from HiBred Aquaculture in Vandalia, Illinois.<br />
There was three criteria that were always considered during <strong>the</strong> pump’s development.<br />
Efficiency, reliability and user friendliness. Since <strong>the</strong> pump uses an impressive 5-7 amps of<br />
energy, depending on voltage, to perform its four functions of pumping 500 gallons/<br />
minute, oxygenating, foam fractionation and carbon dioxide stripping, it is obvious<br />
efficiency has been achieved. The pumps wash-down duty electric motor and stainless<br />
steel and plastic components make it less likely to be affected by corrosion and breakdown<br />
in <strong>the</strong> harsh environments of indoor Aquaculture facilities. Even though <strong>the</strong> pump itself<br />
has no day to day maintenance, its true user friendliness comes from <strong>the</strong> fact that <strong>the</strong><br />
Pump eliminates <strong>the</strong> reliance on liquid oxygen and <strong>the</strong> various apparatuses used to inject<br />
oxygen. It also eliminates <strong>the</strong> necessity of ozone and additional foam fractionators. If an<br />
individual has had to use any of <strong>the</strong>se various components, <strong>the</strong>y will understand <strong>the</strong> appeal<br />
to rid a facility of <strong>the</strong>se components.<br />
7
Pump Functions<br />
The AMI Multi-Functional Pump is unique in <strong>the</strong> fact that it performs four distinct<br />
functions; pumping 500 gallon/ minute, oxygenating, foam fractionating, and stripping<br />
carbon dioxide. The capacity to pump a great amount of water in a short period of time<br />
allows several possibilities in <strong>the</strong> production of fish. It is important to note that gallons<br />
per minute, or any o<strong>the</strong>r measurement to water flow, is always relative to <strong>the</strong> number of<br />
gallons in a given system. Every system is different, and some components cannot handle<br />
high flow rates at relatively low pressures. This pump was developed using only<br />
components that can work with such a high flow rate.<br />
The second function, oxygenating, is possibly <strong>the</strong> most important function of <strong>the</strong> pump.<br />
Several oxygen tests have been performed where <strong>the</strong> oxygen has been completely driven<br />
out of a column of water with sodium sulfite, and <strong>the</strong>n <strong>the</strong> pump is turned on and readings<br />
are taken to see how quickly <strong>the</strong> pump regenerates <strong>the</strong> oxygen in <strong>the</strong> system. Although<br />
<strong>the</strong> results were very good (approximately 1.5# of O2 per Hour) and somewhat helpful,<br />
Aqua-Manna felt <strong>the</strong> true test was using <strong>the</strong> pump in actual production with high stocking<br />
densities of fish and high feed rates. These tests were performed at Aqua-Manna’s farm,<br />
as well as, HiBred Aquaculture’s farm.<br />
The third function of <strong>the</strong> pump is foam fractionation. There are several benefits to<br />
removing foam from a fish culture system. The ability to foam fractionate <strong>the</strong> water<br />
comes as a part of <strong>the</strong> oxygenation and pumping of <strong>the</strong> water with <strong>the</strong> pump. Therefore,<br />
<strong>the</strong> foam is almost a ‘byproduct’ of <strong>the</strong> pumping process. There is no mechanical devices,<br />
moving parts or extra energy expended to produce <strong>the</strong> protein laden foam.<br />
The fourth and final main function of <strong>the</strong> pump is <strong>the</strong> stripping of Carbon Dioxide. The<br />
same function that is injecting <strong>the</strong> oxygen into <strong>the</strong> water, is in turn releasing Carbon<br />
Dioxide into <strong>the</strong> atmosphere. The benefits of ridding <strong>the</strong> water of CO2 are numerous.<br />
The CO2 rich atmosphere that is a result of <strong>the</strong> stripping, can be very essential to plants in<br />
a greenhouse or an aquaponics facility.<br />
Disadvantages<br />
The very attributes of this pump that make it advantageous, also could be considered<br />
disadvantages. The extensive testing of <strong>the</strong> pump in actual production facilities , was done<br />
with a certain set of components developed and manufactured by Aqua-Manna. The only<br />
places <strong>the</strong> pumps are being used to date, are systems where <strong>the</strong> pump was developed with<br />
only certain components in mind. As an example, <strong>the</strong> o<strong>the</strong>r components that allow for <strong>the</strong><br />
high flow rates used by <strong>the</strong> pump are AMI Rotating Microscreen Drum Filters and<br />
Rotating Biological Contactors (RBC). It is not to say <strong>the</strong> pump wouldn’t work in o<strong>the</strong>r<br />
systems or situations, but <strong>the</strong>re has not been extensive use in actual production facilities<br />
using various o<strong>the</strong>r components.<br />
8
Conclusion<br />
In conclusion, it is obvious that <strong>the</strong> AMI Multi-Functional Pump has great promise in<br />
making <strong>the</strong> Aquaculture Industry what it has <strong>the</strong> potential to become. As of now <strong>the</strong><br />
industry has done very well, but if <strong>the</strong>re is going to be any major progress in <strong>the</strong> industry,<br />
it will be done ‘down on <strong>the</strong> farm’ with innovative products and ideas such as <strong>the</strong> AMI<br />
Multi-Functional Pump.<br />
9
Introduction<br />
Commercial Application of a Low Head Design<br />
William G. Bly<strong>the</strong><br />
President, HiBred Aquaculture, Inc.<br />
RR # 1 Box 402A<br />
Vandalia, IL 62471<br />
Traditionally, recirculating systems have been designed to filter <strong>the</strong> entire tank volume<br />
one to two times/hour. The cost of filtering and pumping large volumes of water (6-8<br />
tank volumes/hour) was restrictive. The main advantage of a low head design system is<br />
<strong>the</strong> ability to recirculate a large volume of water with minimal energy expenditure. This<br />
allows all <strong>the</strong> water to be filtered and oxygenated seven to eight times/hour. For this to<br />
be accomplished all system components must not require any pressure and allow for large<br />
volumes of water. The system and its components discussed here were designed and<br />
manufactured by Aqua-Manna, Inc (AMI).<br />
System Description<br />
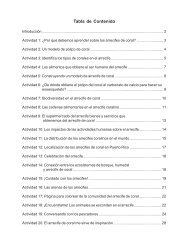
Culture/Filtration Tank: The tank design is rectangular (8’w x 32’l x 4’h. 6,400 gal.),<br />
with <strong>the</strong> culture area 6’ and <strong>the</strong> remaining 2’ for filtration (Figure 1). The<br />
culture/filtration tank is made of a snap toge<strong>the</strong>r metal frame, with <strong>the</strong> bottom and side<br />
support supplied by plywood, and a 35mil PVC line inside. An agitating pump is placed<br />
at both ends and water flows toward <strong>the</strong> center. Solids are swept toward <strong>the</strong> center where<br />
<strong>the</strong>y are pulled off <strong>the</strong> bottom into <strong>the</strong> solids filter.<br />
Solids Filtration: This system uses a rotating drum filter designed by AMI. The rotating<br />
drum filter is a vacuum style drum filter and can filter up to 800 gpm. This is a device<br />
which requires no pressure to operate and can filter large volumes of water in a limited<br />
space (2’w x 3’ l x 2' x h). The rotating drum filter has three speed settings, 4 rpm, 8<br />
rpm, and 16 rpm, which allow for a 5%/day, 10%/day, and 20%/day water replacement<br />
rate, respectively. Water flows through <strong>the</strong> drum filter screen and exits from both ends to<br />
<strong>the</strong> biofilters.<br />
Biofiltration: Rotating Biological Contactors (RBC) provide <strong>the</strong> biofiltration. Three<br />
RBCs are placed lengthwise on both sides of <strong>the</strong> center of <strong>the</strong> rotating drum filter. The<br />
RBCs are turned using air blown into a paddled air collection device at <strong>the</strong> center of <strong>the</strong><br />
biofilter. Water flows from <strong>the</strong> rotating drum filter, through <strong>the</strong> turning RBCs and back<br />
into <strong>the</strong> culture tank through <strong>the</strong> multifunctional pump.<br />
1
Figure 1: Aqua-Manna, Inc. Growout Recirculating Raceway System<br />
Multifunctional Pump: The multifunctional pump is an axial flow style pump with an<br />
upper prop designed to agitate <strong>the</strong> water. Agitated water is <strong>the</strong>n forced downward by <strong>the</strong><br />
pump shroud, allowing for an extended contact zone for air and water. The shroud is<br />
designed with an outer ring that collects foam produced by <strong>the</strong> agitation, which <strong>the</strong>n exits<br />
<strong>the</strong> shroud and tank through a pipe. This low head pump is capable of pumping 400 gpm.<br />
using a 1/3 hp motor at 6 amps, and can transfer 1 ½ lb. of oxygen/hr. Not only does it<br />
move and aerate a large volume of water, but also creates and acts as a foam fractionator.<br />
Additional aeration is added by <strong>the</strong> use of 1/3 hp. agitator in <strong>the</strong> center of <strong>the</strong> tank, which<br />
is mainly used as a backup device.<br />
The large volumes of water moved through <strong>the</strong> tank, 7.5 complete water exchanges/hour,<br />
and pumping at both ends of <strong>the</strong> tank allow for an even distribution of oxygen throughout<br />
<strong>the</strong> tank and a strong flow to move waste to <strong>the</strong> pick up point for solids collection. This<br />
high recirculation rate, passing through all components more than seven times/hour,<br />
allows for adequate water quality without adding extra oxygen, ozone or pressurized<br />
solids removal devices.<br />
2
System Performance:<br />
Nine of <strong>the</strong>se recirculating systems have been used since March 1999 at <strong>the</strong> HiBred<br />
Aquaculture, Inc. facility. Tilapia were <strong>the</strong> main species reared during this period,<br />
although Yellow Perch (Perca flavescens), have also been cultured. Rearing capacity for<br />
<strong>the</strong>se systems was expected to be 5,000 lb. (2264 kg), a density of 0.78 lb./gal. for<br />
Tilapia.<br />
The following data is taken from a batch of Tilapia, which were reared in <strong>the</strong>se systems.<br />
9000 Tilapia (.45 g) were stocked into a nursery tank (800gal.) at day 28 <strong>the</strong>y weighed<br />
5.2 g and were transferred to a larger nursery system (1,400gal.). At day 84, 8500<br />
Tilapia, 58.3 g, were transferred from <strong>the</strong> nursery to <strong>the</strong> one of <strong>the</strong> grow-out recirculating<br />
systems. At day 172 <strong>the</strong>se Tilapia, 232.2 g, were split into two systems. Before<br />
removing half of <strong>the</strong> fish, <strong>the</strong> density was 0.68 lb./gal. Once <strong>the</strong> fish reached an average<br />
weight of 550 g, on day 271, weekly harvests of fish over 580g began. At this time <strong>the</strong><br />
tanks averaged a density of 0.80 lb./gal. Total weight of fish harvested from <strong>the</strong> tanks at<br />
day 298 was 10,532 lb.<br />
During <strong>the</strong> grow-out period Tilapia were fed a 32% protein diet (Purina Mills, Inc., St.<br />
Louis, MO), at an average rate of 51.2 lb./day (Table 1). Tilapia had a feed conversion<br />
rate of 1.41 over <strong>the</strong> entire culture time. Temperature was maintained at 27.5 C, with an<br />
average oxygen concentration of 5.2 mg/l. As shown in table 1, TAN and nitrite levels<br />
were 4.2 mg/l and 1.6 mg/l, respectively. 10 % of <strong>the</strong> water was replaced daily.<br />
The desired fish density was reached, although <strong>the</strong> time period to reach this capacity was<br />
longer than anticipated. Biofiltration, not oxygen, appeared to be <strong>the</strong> main limiting factor<br />
to maintaining higher levels of feeding. Due to <strong>the</strong> design of <strong>the</strong> filter media, <strong>the</strong><br />
biofilters used in <strong>the</strong>se systems developed problems rotating at high levels of loading. As<br />
bacterial loading increased <strong>the</strong>ir rotational rate decreased. As <strong>the</strong>y slowed down <strong>the</strong>ir<br />
ability to sluff bacteria decreased, this eventually decreased <strong>the</strong>ir nitrification efficiency.<br />
Newly designed RBCs are now being tested by Aqua-Manna, Inc. which should eliminate<br />
this problem of slowing due to bacterial loading.<br />
Table 1: Average water quality for Tilapia and Yellow Perch through <strong>the</strong> grow-out<br />
period.<br />
Parameter Unit Tilapia Yellow Perch<br />
Oxygen mg/l 5.2 7.3<br />
Temperature C 27.5 21.5<br />
Feed lb./day 51.2 18.8<br />
pH mg/l 7.1 7.4<br />
Ammonia –N (TAN) mg/l 4.2 1.1<br />
Nitrite mg/l 1.6 0.8<br />
3
One group of Yellow Perch has been reared in <strong>the</strong>se systems. 10,000 Yellow Perch (1 g)<br />
were stocked into a nursery tank (800gal.) at day 28 <strong>the</strong>y weighed 4.2 g and were<br />
transferred to a cage in <strong>the</strong> grow-out system (1,400gal.). At day 102, 9000 Yellow Perch,<br />
at 25.6 g, were transferred from <strong>the</strong> cage to <strong>the</strong> open recirculating system. Shortly after<br />
releasing <strong>the</strong> fish from <strong>the</strong> cage approximately 3,000 were lost when pump screens failed<br />
and <strong>the</strong> pump propellers killed <strong>the</strong> fish. At day 240 <strong>the</strong>se Yellow Perch averaged, 129g,<br />
and weekly harvests of fish over 8 inches began. Tanks density was 0.27lb./gal, and a<br />
total weight of fish harvested from <strong>the</strong> tank at day 270 was 1,855 lb.<br />
During <strong>the</strong> grow-out period Yellow Perch were fed a 45% protein diet (Purina Mills, Inc.,<br />
St. Louis, MO), and 42% protein diet at an average rate of 15.6 lb./day (Table 1). Yellow<br />
Perch had a feed conversion rate of 1.54 over <strong>the</strong> entire culture time. Temperature was<br />
maintained at 21.5 C, with an average oxygen concentration of 7.3 mg/l. As shown in<br />
table 1, TAN and nitrite levels were 1.1 mg/l and 0.6 mg/l, respectively.<br />
Unfortunately, <strong>the</strong> Yellow Perch were not stocked at a density high enough to determine<br />
<strong>the</strong> limiting factor that may have decreased <strong>the</strong>ir feeding or growth rate. From <strong>the</strong>ir<br />
performance in this initial grow-out <strong>the</strong> system should handle stocking as high as 20,000<br />
Yellow Perch with a maximum feeding rate of 40lb./day.<br />
Cost Analysis:<br />
The main emphasis of <strong>the</strong> design of this recirculating system is to decrease electrical cost.<br />
This is <strong>the</strong> second complete recirculating system designed by AMI, <strong>the</strong> first one also<br />
utilized a high recirculation rate but required three two horsepower pumps to move <strong>the</strong><br />
water (Bradley and Bly<strong>the</strong>, 1998). Table 2 shows estimates of <strong>the</strong> variable operating cost<br />
for Tilapia reared in <strong>the</strong> system described in this paper, <strong>the</strong> older AMI system and ano<strong>the</strong>r<br />
recirculating system (Lasorda, et. al. 1991). The new recirculating raceway does have<br />
Table 2: Variable operating expenses for Tilapia culture in three different recirculating<br />
systems.<br />
AMI New System AMI Old System Lasorda, et. al. 1991<br />
Direct Operating Exp. Cents/lb. % of Cost Cents/lb. % of Cost Cents/lb. % of Cost<br />
Feed 30 38 26 30 26.1 24<br />
Electricity 8 10 20 23 16.8 15<br />
Heating 1 1 1.5 2 3.3 3<br />
Liquid Oxygen 0 0 0 0 0 0<br />
Labor 5 6 5 6 16.9 15<br />
Fry 11 14 10 11 9.6 9<br />
Depreciation 15 19 15 17 18.2 1<br />
Maintenance 5 6 5 6 9.4 9<br />
Miscellaneous 5 6 5 6 10 9<br />
Total Cost per lb. $ 0.80 $ 0.88 $ 1.10<br />
4
electrical costs reduced by more than half compared to <strong>the</strong> older system. Both AMI<br />
systems are able to reduce costs of production by reducing labor, because <strong>the</strong> system can<br />
be operated by one person and weekly harvesting requires only two personnel, and liquid<br />
oxygen and fur<strong>the</strong>r filtering are not required.<br />
Conclusion:<br />
This low head – high volume, recirculating system design successfully rears fish at high<br />
densities (0.8 LB./gal). AMI has designed a simple, easily maintained, high efficiency<br />
system that is capable of maintaining water quality suitable for both Tilapia and Yellow<br />
Perch. All of this accomplished with a vacuum style drum filter, air-turned RBCs, and<br />
two multifunctional pumps. The addition of <strong>the</strong> newly designed biofilters should allow<br />
for an increase in <strong>the</strong> feeding rate, increasing <strong>the</strong> total production.<br />
References:<br />
Bradley, J. and W. G. Bly<strong>the</strong>. 1998. The Aqua-Manna Experience. Presented at <strong>the</strong><br />
Second International Conference on Recirqulating Aquaculture, July 16-19, 1998,<br />
Virginia Polytechnic and State University.<br />
Lasorda, T. M. and P. W. Westerman. 1991. An Analysis of Biological, Economic, and<br />
Engineering Factors Effecting <strong>the</strong> Cost of Fish Production in Recirculating Aquaculture<br />
Systems. Presented at Workshop on Design of High Density Recirculating Aquaculture<br />
Systems, Sept. 25-27, 1991, Louisiana State University.<br />
5
Changes in Water Quality and Performance of a Closed<br />
Recirculating Aquaculture System for<br />
Pejerrey (Atlantic Silversides)<br />
Hiroyuki Yoshino<br />
Chief of R & D Dept.<br />
Hokkaido Industrial<br />
Technology Center, Japan<br />
Isamu Watanabe<br />
Resercher of R & D Dept.<br />
Hokkaido Industrial<br />
Technology Center, Japan †2<br />
Osamu Satoh<br />
Professor Emeritus<br />
Faculty of Fisheries<br />
Hokkaido University, Japan<br />
†1 Currently President, Ecologic Consulting., Tokyo, Japan<br />
†2 Currently R & D Dept. Hokkaido Electric Power Co., Inc., Japan<br />
Introduction<br />
1<br />
Daniel E. Gruenberg<br />
R&D Director<br />
Japan International Food<br />
and Aquaculture Society, Japan †1<br />
Katsumi Miyajima<br />
Director of R & D Dept.<br />
Hokkaido Industrial<br />
Technology Center, Japan<br />
Katsuaki Nashimoto<br />
Professor<br />
Faculty of Fisheries<br />
Hokkaido University, Japan<br />
Terminology for recirculating systems is ambiguous. As used in this paper, “Closed”<br />
means no continuous drainage, and water addition was restricted to <strong>the</strong> replacement of<br />
evaporation and water removed along with <strong>the</strong> sludge only.<br />
Closed recirculating aquaculture is desireable due to limited environmental impact and<br />
expanded number of possible production sites. For example, economic water temperature<br />
and water quality management are possible, and <strong>the</strong> culture environment fitted to many<br />
different species can be created easily in any locale.<br />
Japan has some of <strong>the</strong> highest energy costs in <strong>the</strong> developed world, hence energy cost<br />
reduction is particularly important here. However, if water can be recirculated, production<br />
sites far from oceans and rivers, on cheap land which wasn't available for aquaculture<br />
production thus far can be made into fine production areas. Waste heat from refuse<br />
incineration and geo<strong>the</strong>rmal energy are widely available in Japan. If this can be<br />
harvested, it is believed that economic land-based production of many species will<br />
become possible in Japan.
Nitrate, as <strong>the</strong> final product of <strong>the</strong> nitrification process, accumulates continuously in<br />
closed systems and can reach quite high concentrations if unchecked. The nitrate toxicity<br />
level for pejerrey is still unclear. However, high levels are reported to impact growth rates<br />
with o<strong>the</strong>r species (Muir and Roberts, 1982), and high concentration inculture water of<br />
low alkalinity and low pH were shown to adversely affect octopus respiration (Hirayama,<br />
1966). Therefore, denitrification is necessary for long term stability in a closed<br />
recirculating aquaculture systems. However, even without a specialized denitrification<br />
unit, if local anaerobic conditions occur in <strong>the</strong> system, denitrification bacteria may grow<br />
and some denitrification may occur. This often results in undesirable by-products such as<br />
hydrogen sulfide production so this isn't desirable in commercial systems.<br />
In this experiment we attempted to decrease <strong>the</strong> nitrate concentration via a denitrification<br />
unit while keeping <strong>the</strong> rearing environment optimal for <strong>the</strong> fish with advanced solids<br />
removal technology and an aerobic nitrification filter with stable operation for 1 year.<br />
This paper reports on <strong>the</strong> water treatment processes for this system, and on <strong>the</strong> relation of<br />
<strong>the</strong> accumulation of <strong>the</strong> nitrate and water exchange rate.<br />
Materials and Methods<br />
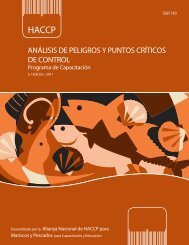
System and its operation<br />
The system consisted of two particle-trap equipped octagonal tanks (0.75 m 3 ) for <strong>the</strong><br />
rapid collection of feces and uneaten feed, a mechanical filter, two UV units (40 W), a<br />
biological filter which provided nitrification, two hollow-fiber oxygen injection systems,<br />
two pumps (0.2 kw) and an alarm device (Fig.1). A foam fractionation unit and drum<br />
filter were used for mechanical filtration. A rotating biological contactor (RBC) and<br />
Foam<br />
Separation<br />
unit<br />
UV<br />
BP<br />
Electric heater O 2<br />
Settling<br />
tank<br />
Drum<br />
filter<br />
Tank Tank<br />
Sludge<br />
collector<br />
Fig. 1. Schematic view of closed recirculating aquaculture system.<br />
fluidized bed filter were used for <strong>the</strong> biological filter. The denitrification unit (0.12 m 3 )<br />
was connected to <strong>the</strong> system on day 180. Water temperature regulation was done via<br />
electric heater (2 kw). Total system volume was about 2.1 m 3 . The flow rate was fixed at<br />
2<br />
Pump<br />
RBC<br />
Pump<br />
FBF<br />
Denitrification<br />
unit
2.1 m 3 /h.<br />
At <strong>the</strong> bottom of each tank a particle trap (ECO-TRAP, AquaOptima A/S, Norway.) was<br />
used to remove solid waste promptly from <strong>the</strong> rearing environment. The effluent is <strong>the</strong>n<br />
divided into two streams, a low volume/ high solids stream and a high volume/ low solids<br />
stream. The latter flows to <strong>the</strong> drum filter from <strong>the</strong> tank center. Uneaten feed that settled<br />
in <strong>the</strong> tank, and excrement are carried to <strong>the</strong> sludge collector, where it sediments, and <strong>the</strong><br />
clarified flow from <strong>the</strong> sludge collector flows to <strong>the</strong> drum filter. Uneaten feed and<br />
excrement that were deposited in <strong>the</strong> sludge collector were discharged from <strong>the</strong> basin<br />
daily. The drum filter (0.1 m 3 , Harry Fischer, Inc., USA) was a self-cleaning screen filter<br />
with a 45 µm mesh screen. The captured solids were sucked from <strong>the</strong> filter with a<br />
vacuum pump and carried to settling tank (0.02 m 3 , 0.03 m 3 /h). The clarified flow from<br />
<strong>the</strong> settling tank was led to <strong>the</strong> RBC. Solids beyond 45 m were eliminated by <strong>the</strong> drum<br />
filter, and <strong>the</strong> screened water flowed by gravity in order into <strong>the</strong> foam separation unit, <strong>the</strong><br />
UV unit and <strong>the</strong> biological filter.<br />
The foam fractionation unit operated from <strong>the</strong> culture initiation until <strong>the</strong> 305th day. But, it<br />
we discontinued operation after day 306 because stable foam didn't arise and <strong>the</strong><br />
elimination of waste was not observed.<br />
The RBC media was interlocked fiber (SaranLock OM-150, Asahi Chemical Industry,<br />
Inc.). The specific area of <strong>the</strong> media was 410 m 2 /m 3 . The fluidized bed filter media was<br />
sand (0.01 m 3 ). The specific area of <strong>the</strong> media was 8000 m 2 /m 3 . Fritz-Zyme NO.9 (Fritz<br />
Chemical, Inc.) that contained <strong>the</strong> marine nitrification bacteria was added both in <strong>the</strong><br />
RBC and <strong>the</strong> fluidized bed filter on day 45, and operated prior to <strong>the</strong> culture initiation.<br />
The denitrification unit was designed as a submerged filter (0.16 m 3 /day). The media was<br />
fiber (SaranLock CS-100, Asahi Chemical Industry, Inc.). The specific area of <strong>the</strong> media<br />
was 740 m 2 /m 3 . A denitrification unit was connected to <strong>the</strong> RBC after <strong>the</strong> preliminary<br />
operation for 6 days on day 180. Glucose was added to <strong>the</strong> denitrification unit inflow<br />
water as a 5 % (w/v) aqueous solution from day 190 until day 265, and <strong>the</strong> glucose<br />
concentration of <strong>the</strong> inflow water was controlled as an organic carbon source in <strong>the</strong> range<br />
of 0-270 mg/l. From day 280 to 365, 10 % (w/v) methanol solution were added, and <strong>the</strong><br />
methanol concentration of <strong>the</strong> inflow water was controlled in <strong>the</strong> range of 0-666 mg/l.<br />
Inoculation of denitrification bacteria used <strong>the</strong> marine denitrifying bacteria Alcaligenes<br />
sp. Ab-A-1 strain (Watanabe et al., 1991).<br />
Dechlorinated tap water was used to make culture water by mixing with artificial<br />
seawater formulation (New MarineArt, Tomita Pharmaceuticals Co., Ltd.) to 7 ‰. Tap<br />
water was used to replenish evaporation losses and artificial seawater was used to<br />
replenish losses of water with sludge disposal. No continuous water replacement was<br />
undertaken. The water was pumped and processed through two hollow-fiber oxygen<br />
injection columns before re-entering <strong>the</strong> tank, and dissolved oxygen levels of each tank<br />
were individually controlled to 100 % saturation. 5 % (w/v) NaHCO3 solution and 5 %<br />
(v/v) hydrochloric acid solution were added as needed for pH adjustment to maintain pH<br />
7-8.2. Culture water temperature in <strong>the</strong> tank was set to 24 °C.<br />
3
Culture conditions<br />
On August 1, 1997, 383 Pejerrey (Odon<strong>the</strong>stes bonariensis, average weight 1.57 g) were<br />
stocked in <strong>the</strong> tank, and were reared for 1 year. Commercial feed for flounder was used<br />
for <strong>the</strong> majority of <strong>the</strong> experiment, and pellet size was changed in accordance with <strong>the</strong><br />
growth. Feeding was controlled at intervals of 10-20 minutes every day from AM 4:00<br />
until PM 22:00 and feeding amount was measured by a load cell everyday. Feeding to<br />
just above satiation level was maintained. Culture conditions for <strong>the</strong> year are shown in<br />
table 2. At <strong>the</strong> end of experiment, <strong>the</strong> average weight was 109.1 g, and <strong>the</strong> survival rate<br />
was high at 92.2 % and <strong>the</strong> final culture density (<strong>the</strong> rate of <strong>the</strong> fish total weight toward<br />
<strong>the</strong> water weight of <strong>the</strong> tank) was 2.7 %.<br />
Sample analysis<br />
Measurements of water temperature were taken every two hours by temp. logger (Type<br />
0610.1720, Test term Inc.). pH readings were taken with a pH meter (GP-1D, Pasolina<br />
Inc.) daily. Dissolved oxygen was measured continuously with a DO meter (OXY2100,<br />
Danfoss Inc., TOX-90, Toko Chemical Laboratories Inc.). The water samples were<br />
analyzed for NH4-N (Indophenol method), NO2-N (Diazotization method), NO3-N<br />
(Cadmium Reduction method), salinity (Silver Nitrate Standard Solution) and alkalinity,<br />
and a spectrophotometer SP-20 (Shimadzu Inc.) was used for analysis. The Water for<br />
analyses was sampled from <strong>the</strong> tank effluent at 9 o'clock every morning, and analyzed in<br />
our daytime.<br />
To characterize <strong>the</strong> performance of <strong>the</strong> system's treatment units, a series of efficiency<br />
tests were conducted. The units included <strong>the</strong> tank’s particle traps, <strong>the</strong> RBC, <strong>the</strong> fluidized<br />
bed filter, and <strong>the</strong> denitrification unit. For <strong>the</strong>se efficiency tests, inflow and outflow<br />
samples were taken at each unit, and were analyzed for NH4-N. The NH4-N removal rates<br />
were calculated from <strong>the</strong> flow rates. Sediments in <strong>the</strong> sludge collector and <strong>the</strong> drum filter<br />
settling tank were filtered with <strong>the</strong> screen mesh of 1.5 mm size to eliminate uneaten feed,<br />
and were analyzed for Total Kjeldahl Nitrogen (TKN). After uneaten feed was removed<br />
with a mesh screen, dry weight was determined. Food consumption weight of <strong>the</strong> fish<br />
was calculated by deducting uneaten feed weight from <strong>the</strong> feeding weight, allowing for<br />
pellet moisture content and <strong>the</strong> nitrogen consumption was calculated from <strong>the</strong> nitrogen<br />
content of <strong>the</strong> feed.<br />
Results<br />
Average body weight was 109.2 g, average total length was 22.9 cm and <strong>the</strong> density of<br />
<strong>the</strong> total weight per tank water volume reached 26.5 kg/m 3 at <strong>the</strong> end of experiment.<br />
Survival rate remained very high, exceeding 92 % at <strong>the</strong> end of one year.<br />
The water temperature was kept stable at 23.8± 0.7 °C (n=4372, 21.2-28.2 °C), near <strong>the</strong><br />
objective water temperature (24.0 °C). The pH was mean 7.60±0.26 (n=265, 7.00-8.18),<br />
<strong>the</strong> alkalinity was mean 2.15±1.6 meq/l (n=274, 0.65-7.27). The cumulative added<br />
amount of NaHCO3 was 14.1 kg, <strong>the</strong> cumulative added volume of <strong>the</strong> hydrochloric acid<br />
4
ecame 2.47 l. Dissolved oxygen (DO) averaged 103.5±3.0 % (n=365, 95.7-135.1 %) of<br />
<strong>the</strong> saturation values, and well controlled to <strong>the</strong> target level. (100 %). Salinity<br />
concentration became mean 7.4±0.3 ‰ (n=162, 6.8-8.6 ‰). The mean total ammonia<br />
nitrogen NH4-N concentration was 0.18±0.07 mg/l (n=358, ND (no detection)-0.36 mg/l,<br />
ND
surface area 740 m 2 /m 3 ). The concentration relationship was 0.47 mg-N/mg-CH3OH and<br />
alkalinity production was 0.045 meq/mg-NO3-N (Yoshino et al., 1999).<br />
Intensive replacement of water was not undertaken with this system. However, an<br />
average of 10 l (0.5 % of <strong>the</strong> total water volume) were added per day as make-up for<br />
water lost with <strong>the</strong> dumping of <strong>the</strong> sludge from <strong>the</strong> sludge collectors and evaporation.<br />
The nutrient process rate of each unit<br />
The average food consumption weight per hour, and nitrogen process volume as<br />
ammonia and excrement with each unit are shown in Table 1. As for total food<br />
consumption weight per day mean 188.5±11.7 g (n=4175, 5-203.3 g), provisioning time<br />
was 18 hours/day. The food consumption rate was 10.5g/h, and <strong>the</strong> nitrogen ingestion rate<br />
of 744±46 mg-N/h was calculated. Of ingested nitrogen, 12 % was trapped in solids such<br />
as excrement. 28 % was oxidized to nitrate in <strong>the</strong> biofilter and ano<strong>the</strong>r 7 % in pipes/ tank<br />
walls, and both were eventually removed as nitrogen gas.<br />
Table 1. Mass balance of nitrogen, production and consumption rates in <strong>the</strong> closed<br />
recirculating aquaculture system for pejerrey* 1<br />
Parameter Consumed<br />
nitrogen* 2<br />
Feed Feces Ammonia<br />
Sludge<br />
collector<br />
Drum filter RBC<br />
6<br />
Fluidizedbed<br />
filter<br />
O<strong>the</strong>rs<br />
Nitrogen<br />
3 744±46 66±36 23±9 133±52 77±42 50±38<br />
(mg-N/h) *<br />
( % ) 100 9 3 18 10 7<br />
* 1 Total body weight : 38.5kg, body weight : 109.1 37.8g (Mean S.D., n=353) .<br />
* 2 Feed consumption rates : 10.5 0.65g/h (Mean S.D., n=4), protein content in feed : 48%, nitrogen<br />
content in feed : 7.1% (Nippon Formula Feed MFG. EP NO.4 for juvenile Japanese flounder).<br />
* 3 Mean S.D., n=4.<br />
Discussion<br />
The nitrogen purification mechanism of this system<br />
Major nitrogenous matter that it is excreted into <strong>the</strong> water by fish is ammonia, urea and<br />
solid excrement of undigested feed. Then, urea is degraded promptly in <strong>the</strong> water, where<br />
it becomes ammonia and carbon dioxide (Colt and Tchobanoglous, 1976). 47 % of<br />
ingested nitrogen was excreted and <strong>the</strong> remaining 53 % was assumed to taken up in fish<br />
and bacterial biomass.<br />
The purification mechanism of this system was considered from <strong>the</strong> trapped amount of
nitrogen with each unit and <strong>the</strong> nitrification volume. Of <strong>the</strong> total nitrogen that was<br />
excreted by <strong>the</strong> fish, 60 % was oxidized to nitrate in <strong>the</strong> biofilter (38 % in <strong>the</strong> RBC, and<br />
22 % in <strong>the</strong> fluidized bed filter) and ano<strong>the</strong>r 14 % in pipes/ tank walls. In total 74 % was<br />
completely nitrified from ammonia to nitrate, and was eventually removed as nitrogen<br />
gas in <strong>the</strong> denitrification unit (Fig.3).<br />
Fig. 3. The process rate of <strong>the</strong> nitrogen (excrement, ammonia nitrogen) that a fish<br />
excreted.<br />
Fur<strong>the</strong>rmore, <strong>the</strong> remaining 26 % was trapped as solids (excrement) of which 19 %<br />
through <strong>the</strong> ECO-TRAP sludge collector and 7 % from <strong>the</strong> drum filter settling tank, and<br />
eliminated from <strong>the</strong> system. Uneaten feed and <strong>the</strong> solid excrement will not affect water<br />
quality immediately. However, after some time, decomposition of <strong>the</strong> organic and protein<br />
material will produce noxious substances. Therefore, <strong>the</strong> early elimination of uneaten<br />
feed and excrement is clearly shown to reduce <strong>the</strong> load to <strong>the</strong> biofilter.<br />
Denitrification<br />
Fluidized bed<br />
filter<br />
22%<br />
O<strong>the</strong>r<br />
14%<br />
Tap water was used as <strong>the</strong> source for this experiment, and so <strong>the</strong>re may have been few<br />
denitrification bacteria available in <strong>the</strong> system water. Also <strong>the</strong> system condition was kept<br />
completely aerobic with few organic deposits via stringent solids and mechanical<br />
filtration. In this environment anaerobic denitrification bacteria will not breed easily.<br />
(Dissolved oxygen concentration of <strong>the</strong> RBC influent, 7.61±0.13mg/l, n=4) Therefore,<br />
until a denitrification unit was installed, it was considered that denitrification didn't occur.<br />
Though glucose was added after denitrification unit installation and small bacterial<br />
colonies appeared in <strong>the</strong> denitrification unit, denitrification did not proceed.<br />
Heterotrophic bacteria, o<strong>the</strong>r than denitrification bacteria multiplied with <strong>the</strong> addition of<br />
<strong>the</strong> glucose. Therefore, it was assumed that <strong>the</strong> preferential growth of denitrification<br />
bacteria was obstructed. Eventually, with <strong>the</strong> addition of methanol, NO3-N concentration<br />
7<br />
RBC<br />
38%<br />
Sludge<br />
collector<br />
19%<br />
Drum filter<br />
7%
achieved a 750 mg/l decline in <strong>the</strong> last 65 days, and pH and alkalinity increased greatly,<br />
requiring pH adjustment. It is already known that alkalinity rises from denitrification<br />
(Jeris and Owens, 1975). If <strong>the</strong> denitrification unit was installed since <strong>the</strong> culture<br />
initiation, <strong>the</strong> total consumption of pH adjusting chemicals can reduces and <strong>the</strong><br />
denitrification unit can be miniaturized more.<br />
The relation of <strong>the</strong> accumulation of <strong>the</strong> nitrate and <strong>the</strong> water interchange<br />
The change of <strong>the</strong> nitrate nitrogen concentration when denitrification isn't done, and<br />
effect by <strong>the</strong> replacement water were modeled by using <strong>the</strong> excretory rate of <strong>the</strong> nitrogen<br />
obtained from this experiment. A calculation condition is shown in table 2. The nitrogen<br />
volume that it is excreted by a fish is shown as follows.<br />
Wfi<br />
Fri<br />
× Fcri<br />
× Pf × Nf × Eer × Ednr × Nr<br />
Wni<br />
=<br />
×<br />
1000<br />
100<br />
Table 2. Characteristics and value of calculation condition<br />
Parameters Value Unit<br />
Total body weight on day i Wfi<br />
Wf1=10<br />
Wf365=5000<br />
kg<br />
Feeding rate on day i Fri 1 %<br />
Food consumption rate on day i Fcri 100 %<br />
Protein content in feed Pf 48 %<br />
Nitrogen content in Protein Nf 16 %<br />
Excretory rate of <strong>the</strong> nitrogen Eer 47 %<br />
Dissolved nitrogen rate of <strong>the</strong> excrement Ednr 74 %<br />
Nitrification rate for one day Nr 100 %<br />
Weight of nitrate nitrogen on day i Wni g<br />
Total volume of system water Tw 130,000 l<br />
Nitrogen concentration on day i Cni mg/l<br />
Replacement water rate per day X 0-10 %<br />
When <strong>the</strong> replacement water rate was X per day, Nitrate nitrogen concentration on i day is<br />
shown at <strong>the</strong> next equation.<br />
8<br />
(1)
( 100 − X )<br />
⎛ Cni−<br />
⎞<br />
= ⎜ × Tw × + Wn ⎟ × Tw<br />
⎝ 1000 100 ⎠<br />
1 −1<br />
Cni i ×<br />
It was calculated about <strong>the</strong> case that it was reared in <strong>the</strong> commercial facilities size of <strong>the</strong><br />
total volume of water 130 m 3 for 1 year. Fig.4 is <strong>the</strong> change of <strong>the</strong> nitrate nitrogen<br />
concentration when <strong>the</strong> replacement water rate was 0-10 % per day. A calculation is when<br />
<strong>the</strong> density of <strong>the</strong> fish per <strong>the</strong> tank increases linearly to 5 % from 0.01 % for 1 year, in a<br />
total system volume of 130 m 3 (Table 2). The feeding rate was 1, and all <strong>the</strong> feed<br />
containing 50 % protein containing rates was consumed. We postulate when 35 % of <strong>the</strong><br />
nitrogen content of that was excreted as dissolved nitrogen such as ammonia. For this<br />
calculation we fixed <strong>the</strong> rates of nitrogen absorption and of excretion, though in reality<br />
<strong>the</strong>se values vary according to species and growth stage.<br />
When 10 % (13 m 3 /day) of <strong>the</strong> total system volume is replaced per day, nitrate nitrogen<br />
concentration reaches 100 mg/l for 1 year. In this case, water with <strong>the</strong> nitrate nitrogen<br />
concentration of 100 mg/l is discharged at a rate of 13 m 3 per day. With zero water<br />
exchange, nitrate nitrogen accumulates to a concentration of nearly 2000 mg/l after 1<br />
year.<br />
NO 3-N (mg/l)<br />
2000<br />
1500<br />
1000<br />
500<br />
0<br />
Fig. 4. The change of <strong>the</strong> nitrate nitrogen concentration in <strong>the</strong> culture water when <strong>the</strong><br />
replacement water rate was 0-10 % per day. Calculated for <strong>the</strong> case where <strong>the</strong> total<br />
volume of water was 130 m 3 for 1 year.<br />
The nitrate concentration of <strong>the</strong> culture water is greatly affected by <strong>the</strong> metabolic rate of<br />
<strong>the</strong> fish, and exchange rate of new water. And, <strong>the</strong> decrease of <strong>the</strong> nitrate concentration<br />
9<br />
1000<br />
0 50 100 150 200 250 300 350<br />
Culture period (day)<br />
(2)<br />
replacement<br />
water rate<br />
0%<br />
0.5%<br />
2%<br />
10%
ecomes possible without water replacement if denitrification is done. Denitrification is<br />
considered necessary when closed recirculating aquaculture systems are used though<br />
<strong>the</strong>re is little study of fish tolerance toward <strong>the</strong> nitrate. Current design practices should<br />
consider an acceptable nitrate nitrogen concentration, a water exchange rate based on site<br />
conditions and <strong>the</strong> denitrification filter sized accordingly.<br />
Acknowledgement<br />
This work was supported by Japan International Food and Aquaculture Society. The<br />
authors would like to thank Inlandwater Experimental Station Kanagawa Pref. Fisheries<br />
Research Institute for give pejerrey eyed eggs and Abiko Research Laboratory Central<br />
Research Institute of Electric Power Industry for give denitrification bacteria, and <strong>the</strong><br />
staff at R & D Dept. Hokkaido Industrial Technology Center for sample analysis.<br />
References<br />
Bower, C. E. and Bidwell, J. P. "Ionization of Ammonia in Aeawater:Effects of<br />
Temperature, pH, and Salinity." J. Fish. Res. Board Can. 35 (1978) :1012-1016.<br />
Colt, J. and Tchobanoglous, G. "Evaluation of <strong>the</strong> short-term toxicity of nitrogenous<br />
compounds to channel catfish." Aquaculture 8(3) (1976) : 209-224.<br />
Hirayama, K. "Influences of nitrate accumulated in culturing water on Octopus vulgaris."<br />
Bulletin of Japanese Society of Scientific Fisheries 32(2) (1966) : 105-111.<br />
Jeris, J. S. and Owens, R. W. Pilot-scale, high rate biological denitrification. J. Water<br />
Pollut. Control Fed., 47 1975 : 2043-2057.<br />
Muir, J. F. and Roberts, R. J. Recirculated water systems in aquaculture. Recent Advances<br />
in Aquaculture. Westview Press : Boulder. 1982.<br />
Yoshino, H., Gruenberg, D. E., Watanabe, I., Miyajima, K., and Satoh, O. "Denitrification<br />
in a Closed Recirculating <strong>Sea</strong>water Aquaculture System." Suisanzoushoku 47(3)<br />
(1999) : 445-451.<br />
Watanabe, Y., Kikuchi, K., Takeda, S. and Kiyono, M. "Development of Water<br />
Purification Technologies for Intensive Fish Culture, 7.Removal of Nitrate<br />
Accumulating in Cultural <strong>Sea</strong>water and Some Factors Affecting <strong>the</strong> Denitrification<br />
of Marine Denitrifying Bacteria." Abiko Research Laboratory Rep. No.U91002<br />
(1991) : 1-21.<br />
10
Comparisons of Four Commonly Used Aquatic Plants for<br />
Removing Nitrogen Nutrients in <strong>the</strong> Intensive Bioproduction<br />
Korean (IBK) Recirculating Aquaculture System<br />
Introduction<br />
Jae-Yoon Jo<br />
Professor of Aquaculture<br />
Department of Aquaculture<br />
Pukyong <strong>National</strong> University, Pusan 608-737, Korea<br />
Jin-Seok Ma In-Bae Kim<br />
Graduate Student Professor Emeritus<br />
Department of Aquaculture Department of Aquaculture<br />
Pukyong <strong>National</strong> University Pukyong <strong>National</strong> University<br />
Pusan 608-737 Korea Pusan 608-737, Korea<br />
In a high density recirculating aquaculture system, nitrate accumulation is unavoidable<br />
(Honda et al. 1993) because excreted ammonia from fish is oxidized to nitrates through<br />
nitrification process in <strong>the</strong> biofilter (Sawyer and McCarty 1978; Colt and Armstrong 1981).<br />
Though nitrate-nitrogen is not as toxic as ammonia or nitrite (Russo and Thurston 1991) it<br />
affects <strong>the</strong> pH of rearing water and is known to stress fish at high concentration (Hrubec et al.<br />
1996).<br />
There are a few methods to remove accumulated nitrates from recirculating aquaculture<br />
systems. Denitrification by anaerobic bacteria is one of <strong>the</strong> common methods for this but it<br />
needs anaerobic condition in <strong>the</strong> system and <strong>the</strong> water from denitrification chamber must be<br />
well aerated before flowing into <strong>the</strong> system. It also needs external carbon sources (Payne<br />
1973) and pump or diversion from main flow pipe system. Increasing <strong>the</strong> water exchange rate<br />
with new water is ano<strong>the</strong>r common method but it has some constraint if rearing water is ei<strong>the</strong>r<br />
heated or cooled. The bigger <strong>the</strong> temperature difference between rearing water and new water<br />
<strong>the</strong> more energy is needed. Using aquatic plants or vegetable is ano<strong>the</strong>r common method of<br />
denitrification. Dunigan et al. (1975) reported that Eichhornia crassipes absorbs nitrates and<br />
phosphate from <strong>the</strong> pond aquaculture system. This plant was also tested to reduce pollution<br />
level from <strong>the</strong> industrial effluent and river and stream (Lee 1993). Aquatic plants do not need<br />
much energy (Reed et al. 1988) for denitrification and <strong>the</strong>y grow well under proper water<br />
temperature and light conditions. Hydroponics with vegetables or o<strong>the</strong>r valuable plants is not<br />
only pursuing denitrification in <strong>the</strong> system (Rakocy 1994) but also enhance <strong>the</strong> income of fish<br />
farmers (Watten and Busch 1984).<br />
Four different aquatic plants, Eichhornia crassipes, Hydrocotyle leucocephala,<br />
Hygrophila angustifolia, and Pistia stratiotes, were originally introduced into Korea from<br />
1
tropical countries for tropical fish aquaria and have been used for denitrification process in<br />
recirculating aquaculture systems by some farmers in Korea. However, denitrification capacity<br />
of <strong>the</strong>se plants has not been evaluated. Therefore <strong>the</strong> removal capacity of ammonia, nitrite,<br />
and nitrate from recirculating aquaculture systems by <strong>the</strong>se aquatic plants was compared.<br />
Materials and Method<br />
In experiment 1, <strong>the</strong> absorbing capacities of total ammonia-N (NH4-N), nitrite-N (NO2-<br />
N), and nitrate-N (NO3-N) were tested in 200 L aquaria. Fifty liters of rearing water from an<br />
existing Intensive Bioproduction Korean (IBK) system (Kim and Jo 1998) fish farm was filled<br />
in each aquarium and 500 g each of Pistia stratiotes, Hygrophila angustifolia, Eichhornia<br />
crassipes, and Hydrocotyle leucocephala, was carefully washed, weighed and placed in <strong>the</strong><br />
aquaria. NH4-N, NO2-N, and NO3-N in <strong>the</strong> water were measured at every 4 hours for 48hours.<br />
The experiment was carried out under temperature conditions of 30 o -38.5 o (September<br />
12-14).<br />
In experiment 2, <strong>the</strong> growth of <strong>the</strong> four plants was evaluated for 30 days in <strong>the</strong> IBK<br />
system and proximate analyses of <strong>the</strong> plants were made after <strong>the</strong> experiment. Each of 2.0 kg<br />
of <strong>the</strong> plants was planted in <strong>the</strong> wooden frameworks of 2 m 2 (2 x 1 m), which were installed at<br />
<strong>the</strong> top of biofilter of <strong>the</strong> system. This experiment was carried out from September 10, 1999 to<br />
October 9, 1999. Water temperature during <strong>the</strong> experimental period ranged from 28 o to 32 o .<br />
After <strong>the</strong> growth experiments, sample of each plant was taken and made freeze dry for<br />
<strong>the</strong> evaluation of moisture content of live plant (AOAC 1995). The freeze-dried samples were<br />
used for proximate analyses. Crude protein, moisture and ash of freeze dried and powdered<br />
plants were analyzed by Association of Official Analytical Chemists (AOAC 1995) methods.<br />
Crude fat was determined using <strong>the</strong> Soxtec System 1046 after <strong>the</strong> sample was freeze-dried.<br />
NH4-N was measured by Orion 720A (Orion Co., USA) and NO2-N and NO3-N were<br />
measured by DR2000 (HACH Co. USA). After <strong>the</strong> analysis, nitrogen removal capacity was<br />
calculated and compared with each o<strong>the</strong>r.<br />
Results and Discussion<br />
The changes of concentrations of NH4-N, NO2-N and NO3-N in aquarium water in<br />
experiment 1 are shown in Table 1. It was observed that Pistia stratiotes was most effective to<br />
reduce NH4-N, NO2-N and NO3-N in <strong>the</strong> water followed by Eichhornia crassipes and<br />
Hygrophila angustifolia, but Hydrocotyle leucocephala with negative results. The<br />
concentrations of NH4-N, NO2-N and NO3-N in <strong>the</strong> aquarium water with Pistia stratiotes<br />
decreased from 2.3 ppm, 0.33 ppm, and 20.4 ppm to 0.4 ppm, 0.027 ppm, and 15.3 ppm,<br />
respectively in 48 hours.<br />
For Hydrocotyle leucocephala <strong>the</strong> concentrations of NO2-N and NO3-N were ra<strong>the</strong>r<br />
increased with time. It seems to have been caused by <strong>the</strong> characteristics of this creeping long<br />
vine plant. The plant had to be cut into pieces to plant in <strong>the</strong> aquaria. From this process, some<br />
part of this plant seemed decayed, adding nutrients into water ra<strong>the</strong>r than removing <strong>the</strong>m.<br />
2
In experiment 2, Pistia stratiotes grew fastest in terms of total wet matter, but almost<br />
same growth with Hygrophila angustifolia in dry matter. Eichhornia crassipes, and<br />
Hydrocotyle leucocephala showed much inferior growth both in wet and dry matter among<br />
<strong>the</strong>m (Table 2). The total weights increased 11.2, 7.4, 6.4, and 4.2 times initial biomass in 30<br />
days, respectively.<br />
Table 1. Absorption of inorganic nitrogen from <strong>the</strong> water by four aquatic plants in <strong>the</strong><br />
aquarium in experiment 1 (30.1-38.5°C). The water was brought from an<br />
existing IBK system fish farm. (unit: mg/L in water).<br />
Aquatic Plants NH4-N NO2 - N NO3 - N<br />
Initial 24h 48h Initial 24h 48h Initial 24h 48h<br />
Pistia stratiotes 2.3 1.1 0.4 0.197 0.029 0.024 21.4 20.1 17.4<br />
Hygrophila angustifolia 2.3 1.7 1.6 0.197 0.170 0.15 21.4 20.1 20.1<br />
Eichhornia crassipes 2.3 1.4 0.6 0.197 0.057 0.029 21.4 20.8 17.9<br />
Hydrocotyle leucocephala 2.3 1.7 2.3 0.197 2.91 7.8 21.4 28.4 62.8<br />
Table 2. The growth performance of four aquatic plants at <strong>the</strong> top of filter bed of <strong>the</strong> IBK<br />
system for 30 days and proximate analysis of <strong>the</strong> plants in experiment 2.<br />
Item Pistia stratiotes<br />
3<br />
Hygrophila<br />
angustifolia<br />
Eichhornia<br />
crassipes<br />
Hydrocotyle<br />
leucocephala<br />
Initial biomass (g) 2,000 2,000 2,000 2,000<br />
Final biomass (g) 22,376 12,774 14,805 8,482<br />
Final/Initial ratio 11.2 6.4 7.4 4.2<br />
Biomass produced (g) 20,376 10,774 12,805 6,482<br />
Moisture (%) 90.00 80.20 92.30 89.20<br />
Dry Matter (DM) (%) 10.00 19.80 7.70 10.80<br />
Biomass produced, DM (g) 2,038 2,133 986 700<br />
Crude protein in DM (%) 4.61 2.62 4.75 4.85<br />
Crude protein in WM (%) 0.46 0.52 0.37 0.52<br />
Crude protein (g) 93.93 55.89 46.83 33.95<br />
Nitrogen value (g) 15.03 8.94 7.49 5.43<br />
Crude fat in DM (%) 22.44 15.40 15.48 22.86<br />
Crude fat in WM (%) 2.24 3.05 1.19 2.47<br />
Crude fat (g) 457.24 328.52 152.63 160.03<br />
Crude ash in DM (%) 24.18 12.71 18.1 17.99<br />
Crude ash in WM (%) 2.42 2.52 1.39 1.94<br />
Crude ash (g) 492.69 271.14 178.46 125.94<br />
DM: dry matter; WM: wet matter<br />
In terms of total nitrogen (N) syn<strong>the</strong>sized by <strong>the</strong> plants on an area of 2 m 2 for 30 days,<br />
Pistia stratiotes, with an amount of 15.03 g, was considerably superior to <strong>the</strong> o<strong>the</strong>r 3 plants,<br />
Hygrophila angustifolia (8.9 g), Eichhornia crassipes (7.49 g), and Hydrocotyle leucocephala<br />
(5.43 g). Thus <strong>the</strong> fastest growth rate of Pistia stratiotes in experiment 2 well agrees with <strong>the</strong>
fastest absorption of nutrients from water in experiment 1. Therefore Pistia stratiotes seems<br />
<strong>the</strong> best for denitrification purpose among <strong>the</strong> plants tested for <strong>the</strong> IBK system.<br />
In <strong>the</strong> present experiment initial planting was so thin that <strong>the</strong> spatial potential to grow <strong>the</strong><br />
plants was not fully utilized. Therefore if we had started <strong>the</strong> plant growing much intensely<br />
from <strong>the</strong> first, <strong>the</strong> production would have been more than double or triple <strong>the</strong> present results of<br />
15 g nitrogen syn<strong>the</strong>sis. Thus <strong>the</strong> amount of nitrogen syn<strong>the</strong>sis by Pistia stratiotes would have<br />
been more than 30 to 45 g on an area of 2 m 2 for 30 days.<br />
The amounts of crude fat and ash syn<strong>the</strong>sized were also highest in Pistia stratiotes (457 g<br />
and 492 g, respectively) followed by Hygrophila angustifolia (328 g and 271 g), Eichhornia<br />
crassipes (152 g and 178 g) and Hydrocotyle leucocephala (160 and 125 g).<br />
Conclusion<br />
Some aquatic plants such as Eichhornia crassipes, Hydrocotyle leucocephala,<br />
Hygrophila angustifolia, and Pistia stratiotes, are used for denitrification process in<br />
recirculating aquaculture systems by some fish farmers in Korea. The removal of NH4-N,<br />
NO2-N, and NO3-N from <strong>the</strong> water of IBK system by <strong>the</strong>se four aquatic plants was compared.<br />
Weight gain of, and nitrogen syn<strong>the</strong>sized by, <strong>the</strong>se plants in <strong>the</strong> system were evaluated. Pistia<br />
stratiotes appeared much more effective than <strong>the</strong> o<strong>the</strong>r three plants both in terms of total<br />
syn<strong>the</strong>sis and <strong>the</strong> removal of inorganic nitrogen nutrients from <strong>the</strong> water of IBK system.<br />
Acknowledgement<br />
The Art and Science Promotion Foundation in Pukyong <strong>National</strong> University supported<br />
this work<br />
References<br />
AOAC. “Official method of analysis. 16 th ed.” Association of Official Analytical Chemists.<br />
Arlington, Virginia. 1995.<br />
Colt, J. and D.A. Armstrong. “Nitrogen toxicity to crustaceans, fish and mollusks”.<br />
Proceedings of <strong>the</strong> Bio-Engineering <strong>Symposium</strong> of Fish Culture. American Fisheries<br />
Society: 1981.<br />
Dunigan, E.P., R.A. Phelen, and Z.H. Shamsuddin, Use of water hyacinths to remove nitrogen<br />
and phosphorus from eutrophic waters. Hyacinth Control Journal, (1975) 13: 59-61.<br />
Hrubec, T.C., S.A. Smith, and J.L. Robertson. “Nitrate toxicity; a potential problem of<br />
recirculating system”. G.S. Libey, and M.B. Timmons, Eds. Successes and Failures in<br />
Commercial Recirculating Aquaculture.(1996): 41-48 .<br />
4
Honda, H., Y. Watanabe, K. Kikuchi, N. Iwata, S. Takeda, H. Uremoto, T. Furata, and M.<br />
Kiyono. “High density rearing of Japanese flounder, Paralichthys olivaceus, with closed<br />
seawater recirculating system equipped with a denitrification unit”. Suisanzoshoku. 41<br />
(1993): 19-26.<br />
Kim, I.B, and J.Y. Jo. “Recirculating aquaculture systems in Korea – Development of an<br />
environmentally friendly aquaculture system, Intensive Bio-Production Korean (IBK)<br />
system.” Proceedings of <strong>the</strong> Second International Conference on Recirculating<br />
Aquaculture. Ronoake, Virginia. July 16-19. 1998:139-146.<br />
Lee, N.-H. “A swine wastewater treatment by using water hyacinth systems”. Doctoral<br />
Dissertation. <strong>National</strong> Fisheries University of Pusan. 1993.<br />
Payne, W.J, “Reduction of nitrogenous oxides by microorganisms”. Bacterial. Rev, 37,(1973)<br />
409-452.<br />
Reed, S.C., E.J. Middlebrooks, and R.W. Crites. Natural Systems for Waste Management and<br />
Treatment. New York: McGrow-Hill 1988.<br />
Rakocy, J.E. “Waste management in integrated recirculating systems”. Bull. Natl. Res. Inst.<br />
Aquaculture, Suppl. 1 (1994): 75-80.<br />
Russo, R.C. and R.V. Thurston. “Toxicity of ammonia, nitrite and nitrate to fishes” In<br />
Aquaculture and Water Quality. The World Aquaculture Society (1991): 58-89.<br />
Sawyer, C.N. and P.L. McCarty. Chemistry for Environmental Engineering. New York:<br />
McGrow-Hill. 1978.<br />
5
Recirculation System Design; The KISS Concept<br />
Rene’ Remmerswaal (1), Rolli Hadas Israel (2)<br />
(1) Haogenplast Projects, Israel, E-mail: renerem@netvision.net.il<br />
(2) Kora Engineering, Israel. E-mail: kora1980@netvision.net.il<br />
Having installed over 80.000 m³ of intensive culture pond volume Haogenplast<br />
Projects is a major fish farm constructor. Large efforts were made to develop costeffective<br />
recirculation systems. Experience was gained with roundfish, flatfish and<br />
shrimp, both in seawater and fresh water. A wide variety of equipment and system<br />
set-ups were tested and evaluated. Finally this work is yielding various effective<br />
solutions. The key is <strong>the</strong> KISS rule; Keep It Simple, Stupid! The system concept is<br />
described that is now in use for culture of shrimp, Hybrid striped bass and <strong>Sea</strong>bream.<br />
The fish or shrimps are grown in D-ended raceways of 100-500 m², 0.6-1.2 m. deep.<br />
A central baffle and paddlewheel aerators provide a one-directional current as well as<br />
O2 addition and CO2 stripping. The farm is in a greenhouse that is covered with<br />
transparent plastic (Tilapia), green plastic (Bass) or an insulating material (Flatfish).<br />
A special bottom outlet removes settled solids, while <strong>the</strong> main water treatment flow is<br />
taken via an overflow weir. Densities are kept modest (10-20 kg/m³ for fish).<br />
The main water treatment consists of a combination of a hydrocyclone / settler and<br />
beadfilter for solid removal and submerged aerated biofilters. Both components use<br />
“Haogenplast macaroni”, small extruded tubes with a large surface area. Pumping is<br />
done by airlift pumps.<br />
The solid catchers are periodically aerated for cleaning and <strong>the</strong> backwash water is<br />
directed to a covered denitrification pond. Here organics are digested, nitrate is turned<br />
to nitrogen gas and alkalinity is recovered. The effluent of <strong>the</strong> denitrification pond can<br />
be discharged or re-directed into <strong>the</strong> system. Small system adaptations are made if<br />
<strong>the</strong> cultured species requires so.<br />
The combination of large water volumes, large water flows and an overdimensioned<br />
watertreatment unit assure a good and stable water quality. The strong dependence on<br />
aeration by blowers makes <strong>the</strong> system technically simple and highly reliable, even in<br />
seawater.<br />
The system components are designed for one task but have dual purpose. Airlifts<br />
pump water but significantly contribute to gas exchange. Depending on <strong>the</strong> water<br />
quality <strong>the</strong>y also function as foam fractionator. The beadfilter is designed for solid<br />
capture but gives a bonus by working as biofilter as well.<br />
High energy efficiency is achieved by fine-tuning <strong>the</strong> airlift design and by operating<br />
paddlewheels and airlifts on-demand. This is achieved by an advanced<br />
1
onitoring/control system that also regulates <strong>the</strong> temperature in <strong>the</strong> farm through<br />
regulating passive ventilation and by operating heat-reflective screens.<br />
Technical data about <strong>the</strong> farm design, technical and biological performance will be<br />
presented.<br />
2
The Japanese Aquaculture Market and<br />
Changes into <strong>the</strong> 21st Century<br />
Daniel Gruenberg<br />
Ecologic, Co.<br />
Japan/Asian Technology & Business Development<br />
4-20-8-106 Himonya, Meguro-ku, Tokyo 152-0003<br />
Despite this small island nation of 120 million population being <strong>the</strong> world's largest seafood<br />
importer, Japan's mariculture industry, by far <strong>the</strong> world's most mature, is suffering from <strong>the</strong><br />
effects of <strong>the</strong> longest post WWII recession as well as structural and market obstacles to<br />
profitability. Producer morale is low and <strong>the</strong> outlook is poor. In this paper, I will describe<br />
briefly <strong>the</strong> historical development of <strong>the</strong> large industry with <strong>the</strong> intent that o<strong>the</strong>r nations can<br />
learn from Japan's mistakes and also I will cover some technologies that may help bring about<br />
recovery of this multi-billion dollar industry.<br />
Current producers are plagued by low survival rates, lack of effective vaccines, unregulated<br />
access to antibiotics, extremely inefficient distribution, water pollution, toxic algae blooms,<br />
expensive feed and poor benthos quality. Farmers are leaving <strong>the</strong> aquaculture industry in<br />
droves as <strong>the</strong> red-ink piles up.<br />
A large majority of farmed fish are shipped live in Japan due to <strong>the</strong> Japanese consumers'<br />
obsession with freshness required for enjoyable consumption of sushi and sashimi, uncooked<br />
forms of preparing fish. Approximately 95% of Japan's 70,000 ton production of red sea<br />
bream and about 65% of <strong>the</strong> 150,000 tons of Seriola are harvested and shipped to market in<br />
live holding trucks.<br />
We are proposing to <strong>the</strong> Japanese producers and regulators several solutions to <strong>the</strong> current<br />
dilemma, some of which are already well underway. First disease needs to be prevented<br />
through an effective vaccine program, and many Japanese and foreign companies have<br />
registration applications underway. However, some laws in existence prevent for example<br />
long-term effective viral vaccines and we are lobbying for changes to <strong>the</strong>se laws. Feed and<br />
feeding practice improvements will decrease feeding cost and decrease organic loading,<br />
providing synergistic improvements in environment and production efficiency. In concert with<br />
<strong>the</strong>se production related improvements, much effort is being put into improving <strong>the</strong><br />
distribution system with emphasis on live fish distribution technology, which <strong>the</strong> author has<br />
been concentrating on for <strong>the</strong> last two years. Current technology and that under development<br />
will be examined in detail.<br />
1
Novel Live <strong>Sea</strong>food Shipping and Freshness<br />
Preservation Technology from Japan<br />
Daniel Gruenberg<br />
Ecologic, Co.<br />
Japan/Asian Technology & Business Development<br />
4-20-8-106 Himonya, Meguro-ku, Tokyo 152-0003<br />
Abstract not available at time of printing.<br />
1
Entrepreneurial and Economic Issues of Recirculating<br />
Aquaculture Ventures<br />
Introduction<br />
Dr. Michael B. Timmons<br />
Professor<br />
Department of Agricultural and Biological Engineering<br />
Cornell University<br />
Ithaca, NY 14850 USA<br />
Fingerlakes Aquaculture LLC was created in June of 1997 by myself, my bro<strong>the</strong>r, Dr.<br />
William Youngs (Professor Emeritus Cornell University Department of Natural<br />
Resources -- and my mentor in aquaculture for 15 years) and a local businessman who<br />
owned a lumber yard and built and managed apartment units. In addition, Drs. Dave Call<br />
(Dean Emeritus Cornell College of Agriculture and Life Science) and Gene German<br />
(Professor of Food Marketing, Cornell University) were members of our Board of<br />
Managers that formed <strong>the</strong> startup company. At that time, live market prices for tilapia at<br />
<strong>the</strong> farm for our location in UpState New York exceeded $2.00/lb. The original financing<br />
of <strong>the</strong> company was personal cash, bank loans that were personally secured, and <strong>the</strong><br />
lumberyard owner building <strong>the</strong> building with his own personal funds and <strong>the</strong>n renting <strong>the</strong><br />
facility to Fingerlakes in exchange for equity ownership.<br />
In July 1997 a second major cash infusion occurred by a successful entrepreneur with<br />
extensive experience and success in startups and also with previous success in<br />
agricultural type businesses and seafood. This cash infusion was initiated due to a<br />
negative cash flow for <strong>the</strong> first 12 months and <strong>the</strong> drop in market price from $2.00 to<br />
$1.70/ lb. The drop in market price indicated that <strong>the</strong> original capacity of <strong>the</strong> Fingerlakes<br />
farm would have to be increased if Fingerlakes was to be cost competitive.<br />
Unfortunately, <strong>the</strong> market price continued to drop for <strong>the</strong> next several months to $1.30/lb<br />
farm price for live fish in small volumes (5,000 lb per week) with an anticipated farm<br />
price of around $1.10/lb for quantities above 10,000 lb per week. This again indicated<br />
that Fingerlakes would have to fur<strong>the</strong>r expand to be cost competitive. A new round of<br />
financing was initiated which diluted <strong>the</strong> original members significantly but did raise <strong>the</strong><br />
capital necessary along with bank loans to allow an expansion to be initiated from <strong>the</strong> late<br />
spring of 1999. And again, <strong>the</strong> bank loans required personal guarantees. This new farm<br />
became <strong>the</strong> growout operation to receive fingerlings from <strong>the</strong> original farm (Freeville<br />
operation) and grow <strong>the</strong>m to market size. Full production from this farm is expected to<br />
be reached by mid summer of 2000. Economic success is anticipated because of: a)<br />
larger scale of operations, b) trained workforce, c)improved technology, d)adequate<br />
water, e)greatly reduced electrical costs, and f) targeted marketing approach.<br />
1
Could we have been successful if we immediately had embarked on this larger scale<br />
farm? I do not think so. Unless you are simply adding additional systems from a<br />
"canned" design that is already working well, I believe you will face unexpected<br />
problems that will compromise your ability to achieve <strong>the</strong> cost effectiveness that is<br />
predicted on paper. On <strong>the</strong> o<strong>the</strong>r hand, once you have a working system and<br />
management protocols refined at some reasonable scale, e.g. 250,000 lb/yr, I do believe<br />
"that system" or farm can be reproduced multiple times to achieve <strong>the</strong> desired production<br />
levels and obtain <strong>the</strong> economies of scale necessary to achieve an economically<br />
competitive position.<br />
Lessons Learned<br />
Technology<br />
After having led a major R&D effort at Cornell University for 15 years that was<br />
completely focused on indoor Recirculating Aquaculture System (RAS) technology, <strong>the</strong><br />
Fingerlakes principles felt very confident, maybe overconfident, that employing <strong>the</strong> fullscale<br />
systems from <strong>the</strong> Cornell R&D sites to commercial implementation would face no<br />
major obstacles. Wrong. The Cornell system was based upon microbead filters and<br />
continuous biomass loading. After approximately one year of working with high rate<br />
fluidized sand beds at <strong>the</strong> Cornell facility and being convinced that ultimately, sand beds<br />
would prevail as <strong>the</strong> most economically competitive biofilter system, Fingerlakes<br />
installed sand biofilters as <strong>the</strong> biofilter of choice. The anticipated production level of <strong>the</strong><br />
Fingerlakes' first facility was 400,000 lb per year but depended upon <strong>the</strong> Cornell system<br />
of continuous biomass loading, i.e. <strong>the</strong>re are a mixture of size cohorts in a single tank<br />
with a harvest consisting of approximately 15% of <strong>the</strong> large fish being removed and <strong>the</strong>n<br />
this number of small 75 gram fish being added back to <strong>the</strong> tank.<br />
Pro-actively and essentially before <strong>the</strong> first fish were placed in <strong>the</strong> new facility,<br />
Fingerlakes abandoned <strong>the</strong> continuous biomass loading approach to a strict “all in all out”<br />
batch loading approach. Batch loading provides very accurate feed conversion and<br />
growth data at each tank harvest. We felt that this was in fact <strong>the</strong> most critical<br />
information we needed to generate at that time since it was <strong>the</strong>se data which in reality<br />
would define <strong>the</strong> overall economics of a large scale effort. The downside to this was less<br />
anticipated production per year. But at <strong>the</strong> time, <strong>the</strong> market price was still high (October<br />
1997). We thought we could survive <strong>the</strong> lower production levels since it was "only" an<br />
interim approach. We were over-confident that <strong>the</strong>se initial results and supporting data<br />
would lead to a large scale effort in <strong>the</strong> near future, e.g. millions of pounds per year as<br />
target production levels. We also made a change from <strong>the</strong> Cornell system that relied<br />
primarily on settling basins for solids removal to one that relied primarily on mechanical<br />
screen filtration. Unfortunately, cost consideration sometimes, too often, over-ride<br />
engineering judgement. We erred by under-sizing our mechanical screen system and this<br />
contributed to high suspended solids levels in <strong>the</strong> rearing tanks, which also compromised<br />
fish performance.<br />
2
Our largest error though was in not having an assured source of ground water to operate<br />
<strong>the</strong> farm. Needless to say, never never never start construction until you are convinced<br />
you have adequate water on site to provide at least 20% water exchange volumes per day.<br />
Also, expect that initial well recharge capacity will drop approximately 50% from its<br />
initial delivery levels (what you see over a one-week period of constant pumping during<br />
<strong>the</strong> exploratory phase) once <strong>the</strong> well is used on a continuous basis for a year. So, if you<br />
have 100,000 gallons of standing water in your system, you need a well capacity of at<br />
least 20,000 gallons per day which means your initial well capacities should be 40,000<br />
gallons per day or 28 gpm. Just to give you an idea of our nightmare --- we drilled 5<br />
wells at <strong>the</strong> first farm site, 4 of <strong>the</strong>m after construction. Our first well provided 8 gpm of<br />
water during tests, but "dried up" during construction (well, not quite, reduced to about<br />
0.5 gpm of flow). In my engineering egotism at <strong>the</strong> time, I believed we could<br />
successfully run <strong>the</strong> barn on about 8 to 10 gpm of continuous well flow. What is<br />
typically not accounted for in water needs are: a)Purging, b)Cleanup, c)Flushing during<br />
tank emergencies, d)General usage, and e)Loss of well capacity<br />
We pursued a whole series of efforts including water recovery from <strong>the</strong> manure settling<br />
ponds and ground filtration and ozone treatment--- but <strong>the</strong>se were not satisfactory. You<br />
must have water in <strong>the</strong> quantities as described above as a minimum. Our expansion farm<br />
went to a site that provided public water and had several hundred gallons per minute of<br />
excessive capacity.<br />
Capital Costs and Economic Returns. The technology being used must support an overall<br />
economically competitive operation. You should assume something near 5 years on<br />
depreciation but more importantly, <strong>the</strong> initial cost of your start up equipment will define<br />
in part <strong>the</strong> company's anticipated internal rate of return on <strong>the</strong> investment. In round<br />
numbers, your equipment should cost not more than $0.50 per pound per year (PPY) of<br />
production and <strong>the</strong> building, land, utilities etc will cost an additional $0.50 per PPY. If<br />
<strong>the</strong>se up-front investment costs are too high, your farm's internal rate of return on<br />
investment will be too low to attract outside investors.<br />
Management.<br />
I think in most cases, investors and o<strong>the</strong>rs grossly underestimate <strong>the</strong> importance of<br />
previous management experience with RAS technology and for <strong>the</strong> intended species to be<br />
grown. Experience with salmonids in RAS is not <strong>the</strong> same as tilapia in an RAS and vice<br />
versa. The management team that was in place at Fingerlakes' inception was extremely<br />
strong: Dr. W.D. Youngs (GM, previous large scale experience, noted fisheries<br />
authority), Michael Iannello (previous GM of a large 1.0 + million lb/yr integrated salmon<br />
farm in Maine), Ken DeMunn (President, very successful local small business owner),<br />
and Scott Hoffay (successful home construction business). In effect, I felt we had about<br />
as strong of a management team that was possible. Even with this experienced<br />
management team, Fingerlakes barely survived <strong>the</strong> first 2.5 years. As I stated above, I<br />
also believe if Fingerlakes had tried a larger scale of effort than <strong>the</strong>ir initial farm, <strong>the</strong>y<br />
would have failed categorically. Fingerlakes' first year of full production resulted in<br />
168,000 lb of sales. Why didn't Fingerlakes reach <strong>the</strong>ir expected level? I would attribute<br />
3
it to a lot of things, but basically, <strong>the</strong> lack of water was a severe compromise to<br />
Fingerlakes' ability to produce fish.<br />
Financing.<br />
Regardless of all we hear about government guaranteed loans for business startups, in my<br />
experience, it came down to equity infusion (self and outside investors) and personal<br />
guarantees of loans. The banks essentially will take no risk. They assume you will fail.<br />
They also assume that <strong>the</strong> value of <strong>the</strong> farm assets will be practically negligible. These<br />
are probably reasonable assumptions. The market value for used fish equipment is<br />
probably 10 cents on <strong>the</strong> dollar at best. Yes, you can probably re-sale your forklift for a<br />
reasonable salvage, but used pumps and o<strong>the</strong>r fish equipment are essentially of little to no<br />
value. The bank will <strong>the</strong>refore require that any loans to <strong>the</strong> company be personally<br />
guaranteed and in our case required "perfection" which means that we had to place assets<br />
in <strong>the</strong> bank's control that equaled or exceeded <strong>the</strong> value of <strong>the</strong> loans. This places <strong>the</strong><br />
bank above o<strong>the</strong>r creditors in a dispersal or bankruptcy scenario.<br />
On <strong>the</strong> original operating loan to Fingerlakes, my bro<strong>the</strong>r's and my personal stock assets<br />
were also only valued at 80% of face value (in case <strong>the</strong> stock market went down). Again,<br />
<strong>the</strong> bank will basically take no risk on a business start up. We followed several unfruitful<br />
experiences with lending and leasing entities and <strong>the</strong>y all ended up at <strong>the</strong> same point,<br />
ei<strong>the</strong>r provide equity guarantees or <strong>the</strong> farm (Fingerlakes) did not qualify for a loan.<br />
Also, bear in mind that <strong>the</strong>se financing activities require tremendous time efforts by<br />
someone to pursue sources, develop materials, and attend meetings after meetings. Also,<br />
assume a successful loan closing will take at least 3 months before money is in your<br />
hands for use "after" <strong>the</strong> loan terms have been agreed to.<br />
Venture firms. Venture firms are also supposed sources of capital. A typical venture<br />
firm will invest in less than 0.1% of <strong>the</strong> proposals that are presented to <strong>the</strong>m! My<br />
experience during our initial rounds of seeking capital was that <strong>the</strong> venture firm assumed<br />
that what you had was probably not unique, that if you could do it-- so could countless<br />
o<strong>the</strong>rs, and that <strong>the</strong> overall potential to make money in a food related business was not<br />
attractive, especially in comparison to o<strong>the</strong>r investment alternatives <strong>the</strong>y had access to.<br />
So, unless, you have an inside track with <strong>the</strong> venture firm (some of which we did and we<br />
were still unsuccessful)-- <strong>the</strong> likelihood of obtaining equity from <strong>the</strong>m is basically zero!<br />
On <strong>the</strong> o<strong>the</strong>r hand, once Fingerlakes had <strong>the</strong> Phase I operation up and running and had<br />
demonstrated <strong>the</strong> ability to breed and produce fingerlings successfully, grow fish with<br />
reasonable performance values, and sell fish successfully-- we were successful in<br />
bringing in equity cash for our Phase II effort (<strong>the</strong> growout facility). Our interim investor<br />
between Phase I and Phase II, which was <strong>the</strong> first time we ran out of money, though, was<br />
closely connected with this venture firm and had a large degree of influence with <strong>the</strong>m. I<br />
do not believe we would have obtained <strong>the</strong>ir investment o<strong>the</strong>rwise.<br />
4
Before You Invest.<br />
In my role as a university researcher and extension professor, I am often involved in<br />
helping people to decide on whe<strong>the</strong>r or not entering aquaculture is a wise investment<br />
decision. In particular, should an investment be made. My own opinion is that very few<br />
groups or individuals are capable of raising fish using RAS technology or raising fish at<br />
all in any kind of system. I would not recommend anyone invest in an aquaculture<br />
operation until <strong>the</strong> group had successfully demonstrated <strong>the</strong>ir capability to successfully<br />
raise fish. Then, based upon <strong>the</strong>ir initial results, can <strong>the</strong> company be profitable in an<br />
expansion phase. And, <strong>the</strong> prediction of business profits should be made using realistic<br />
values for selling prices.<br />
Species Choice.<br />
We chose tilapia because we believe that this fish has <strong>the</strong> attributes to be <strong>the</strong> equivalent<br />
of <strong>the</strong> broiler chicken. The industry's current problems associated with low market prices<br />
in reality are not valid in relation to tilapia being a commodity product. The only fish<br />
commodity product that can be used as a comparison is <strong>the</strong> catfish industry, which<br />
produces 600 million lb per year in comparison to US production of tilapia being 18<br />
million lb. Pond side prices paid to <strong>the</strong> farmer for catfish are generally around $0.75/lb<br />
whole fish basis. Fillet yields for catfish are 45% and tilapia yields are now at best<br />
around 33%. Thus, <strong>the</strong> equivalent farm price for tilapia would have to be $0.55/lb.<br />
Genetic improvements in carcass yield will balance <strong>the</strong> pricing, but until <strong>the</strong>n, large scale<br />
tilapia farming will have to be competitive with farm prices as noted above.<br />
A general <strong>the</strong>me for those entering aquaculture is to choose a high value species, such as<br />
perch or walleye or ornamental fish. The primary reason <strong>the</strong>se fish are at high market<br />
values is that <strong>the</strong>ir supply is very limited. Once, aquaculture develops successfully for a<br />
particular species and <strong>the</strong> market supply dramatically increases, <strong>the</strong> market price<br />
dramatically reduces. Also, don't be fooled by <strong>the</strong>se scenarios of apparently lucrative<br />
markets. There is a reason that <strong>the</strong> market is under supplied and driving <strong>the</strong> high price.<br />
Dramatic price reductions have been seen in <strong>the</strong> salmon and striped bass industries where<br />
market prices dropped by roughly 50% in less than a year's period. Similarly, tilapia<br />
prices have been falling from <strong>the</strong> high market prices of a couple years ago and I expect<br />
prices to drop fur<strong>the</strong>r.<br />
Scale Effects and Risk.<br />
The primary consideration that should dictate a particular biomass fish load for an<br />
independent production system is associated with catastrophic failure. Systems fail as<br />
units and typically all fish in a particular unit will fail. Biofilters are one source of<br />
failure. In my view it is more cost effective to minimize <strong>the</strong> number of biofilters on a<br />
farm so that each can be designed with substantial redundancy and excess capacity.<br />
The counter argument is to design small biomass systems with individual biofilters so<br />
that when a system fails, <strong>the</strong> severity of <strong>the</strong> economic loss is small since an individual<br />
system represents only a small fraction of <strong>the</strong> entire system. In <strong>the</strong> last farm I designed,<br />
5
I used one biofilter for a 250,000 lb per year production module. But I designed this<br />
farm to have 6 independent biofilter systems for <strong>the</strong> entire operation. I would suggest<br />
that each farm should have at least 4 independent growout systems, so that one would<br />
only lose 25% of <strong>the</strong>ir crop under catastrophic failure of a particular system.<br />
Scale of Production.<br />
Fingerlakes first farm targeted 250,000 lb per year as <strong>the</strong>ir production target. Their<br />
expanded farm is hoping to produce 1.5 million lb per year. Unfortunately, even this<br />
level of production is not nearly that necessary to be competitive with <strong>the</strong> overseas<br />
producers of fresh tilapia fillets where fillets are processed for roughly $0.03/lb and farms<br />
are in <strong>the</strong> 5 to 15 million lb/yr size. Our fillet costs using hand labor approach $1.00/lb<br />
fillet basis with expert hand cutters and trimmers being at best around $0.50/lb.<br />
However, both PICES and Baader are close to having fully automated processing<br />
equipment that can reduce fillet costs to $0.25 to $0.75 per lb. This fillet cost would<br />
allow <strong>the</strong> US producer to be cost competitive with <strong>the</strong> overseas suppliers. The problem is<br />
that <strong>the</strong> automatic filleting equipment requires volumes on <strong>the</strong> order of 5 to 10 million lb<br />
per year to justify <strong>the</strong> initial equipment expense. O<strong>the</strong>r economies of scale start to<br />
emerge at this level of production as well and begin to provide alternatives related to "inhouse"<br />
feed manufacturing, oxygen production, electrical generation, and fish by-product<br />
utilization.<br />
Being in <strong>the</strong> several 100 thousand lb per year production farm level is probably <strong>the</strong> worst<br />
position to be in. You basically have to many fish to deal with to develop and serve<br />
niche local customers and you need a fairly large staff and set of fixed costs to protect<br />
your investment which contributes to high overall production costs. Ei<strong>the</strong>r you get really<br />
big like <strong>the</strong> catfish farmers or you stay really small and basically do everything yourself.<br />
Labor requirements<br />
This will become a major choice in your operation. Fingerlakes employs 7 day a week<br />
24 per day coverage. O<strong>the</strong>r growout farms rarely employ this type of coverage.<br />
Certainly during <strong>the</strong> startup phase for <strong>the</strong> first year, I would highly recommend this type<br />
of coverage. As <strong>the</strong> system matures and built in alarm systems infrequently are activated<br />
due to loss of flow, water level, low oxygen etc--- <strong>the</strong>n one could start to consider easing<br />
<strong>the</strong> coverage of <strong>the</strong> fish farm. Experience shows that alarm systems will alert to an actual<br />
problem about 50% of <strong>the</strong> time in reality. Yes, <strong>the</strong>y should be much better, but this is<br />
what happens in <strong>the</strong> real world. There is a delicate balance between monitoring too many<br />
things and not enough.<br />
Comparison to Catfish & Broiler Production and Future Projected Costs.<br />
I compare in Table 1 <strong>the</strong> predicted costs of tilapia production based upon performance<br />
data collected at Cornell University and Fingerlakes Aquaculture LLC (Groton, NY) with<br />
previously published data for: a) Mississippi catfish production from large outdoor<br />
ponds, and b) chicken broiler production costs. The production levels for <strong>the</strong> fish systems<br />
6
are 590,000 kg/year. Prices, depreciation values, and associated economic factors for <strong>the</strong><br />
catfish farm are taken from Keenum and Waldrop (1988). Overall, <strong>the</strong> tilapia production<br />
costs were slightly higher than <strong>the</strong> catfish production costs, $1.62 per kg versus $1.56 per<br />
kg. The major point of <strong>the</strong> comparison provided in Table 1 is that when indoor tilapia<br />
production is practiced on a similar scale as <strong>the</strong> large USA outdoor catfish ponds, <strong>the</strong><br />
costs of production are also very similar. Initial system costs for tilapia and catfish are<br />
similar: $1.37 (tilapia) and $1.44 (catfish) per kg per yr of production. The investment<br />
costs for fish farming are roughly 3 times <strong>the</strong> initial capital investments for broiler<br />
production of $0.49 per kg per yr of production capacity. These costs must be brought<br />
down and <strong>the</strong>y will as we improve our designs. System costs would be expected to reduce<br />
by 25% over current costs due to improvements and refinements in system designs.<br />
Ultimately, fish production from aquaculture will have to compete with o<strong>the</strong>r commodity<br />
meats such as poultry. It is instructive to compare predicted costs of production for fish<br />
from indoor and outdoor facilities with those of broilers. Broiler production data is based<br />
upon USDA statistics (USDA, ERS 1996 a,b, c) and my personal knowledge gained from<br />
20 years working in <strong>the</strong> industry. USA broiler production is now based upon vertical<br />
integration with <strong>the</strong> broiler grower being <strong>the</strong> contract farmer. The farmer owns <strong>the</strong><br />
building, provides husbandry, and pays <strong>the</strong> majority of <strong>the</strong> utilities. For <strong>the</strong>se services<br />
<strong>the</strong> farmer is paid approximately $0.09 to $0.11 per kg of broiler produced. Thus, all<br />
costs associated with building ownership, depreciation of capital equipment, labor and<br />
utilities (electric and water and generally about 50% of <strong>the</strong> fuel heating costs) are borne<br />
by <strong>the</strong> farmer. The productivity per worker has increased from 95,000 kg of broilers per<br />
year in 1951 (Watt Publishing, 1951) to 950,000 kg per year in 1991 (Perry, 1991).<br />
Similar achievements have been made in equipment, housing, and nutrition and genetics;<br />
It is interesting to note that broiler production in <strong>the</strong> 1950’s was around 5 million kg per<br />
year. The productivity per unit of worker and total broiler consumption of <strong>the</strong> 1950’s is<br />
very similar to <strong>the</strong> current production levels of <strong>the</strong> USA tilapia industry (7 million kg of<br />
tilapia per year) and <strong>the</strong> productivity per person in <strong>the</strong> fish farming business is<br />
approximately 25,000 to 110,000 kg per year.<br />
Ultimately, indoor fish production has two distinct advantages over poultry production:<br />
feed conversion efficiency and productivity per unit area of building. Broiler production<br />
has feed conversion efficiencies of approximately 2.00 (2.09 bird weight, feed to gain<br />
ratio on feed energy levels of 3,170 kcal/kg and protein levels of 19.5%), while tilapia<br />
conversions are currently in <strong>the</strong> 1.3 to 1.5 range for feed energy levels of approximately<br />
3,500 kcal/kg. The yearly meat output per unit floor area from <strong>the</strong> tilapia system is 255<br />
kg/m 2 compared to 122 kg/m 2 from a broiler house. Thus, net economic productivity per<br />
year from a fixed tilapia production facility could be higher, even though <strong>the</strong> costs of<br />
production per unit weight are higher compared to broilers. The advantage for fish<br />
production systems is <strong>the</strong>ir higher potential rate of return per year from a fixed facility.<br />
References<br />
Keenum, M.E. and J.E. Waldrop. 1988. Economic analysis of farm-raised catfish<br />
production in Mississippi. Technical Bulletin 155, Mississippi Agricultural and<br />
Forestry Experiment Station, Mississippi State, MS 39762.<br />
7
Perry, C. 1991. Manpower management on large broiler farm. Poultry Digest July Issue,<br />
pp 20-26. Watt Publishing, Cullman, AL.<br />
USDA. 1994. Aquaculture situation and outlook report. AQS-12, March. Economic<br />
Research Service, Commodity Economics Division, USDA.<br />
USDA. 1996a. Economic Research Service: Poultry Economic Outlook, LDP-P-10.<br />
USDA. 1996b. Economic Research Service: Poultry Yearbook, Statistic Bulletin 927.<br />
USDA. 1996c. Economic Research Service: Poultry Production and Summary, POU 3-1.<br />
Watt Publishing. 1951. Broiler growing statistics. Broiler Grower Magazine. Watt<br />
Publishing, Cullman, AL.<br />
Table 1.<br />
Comparison of tilapia, catfish and broiler production costs for farms with a yearly fish<br />
production of approximately 590,000 kg; costs shown on a per unit weight of production<br />
and percentage of total cost by category.<br />
$ costs per kg produced % of Total Cost<br />
tilapia catfish broiler tilapia catfish broiler<br />
Ownership costs ($/kg)<br />
Depreciation 0.14 0.11 contract 8.6 7.1 --<br />
Interest on investment 0.07 0.10 contract 4.3 6.4 --<br />
Catastrophic fish insurance (3%) 0.07 -- contract 4.3 -- --<br />
Liability insurance + land taxes 0.01 0.01 contract 0.6 0.6 --<br />
Subtotal 0.29 0.22 0.05 17.9% 14.1% 7.7%<br />
Costs of goods services ($/kg)<br />
Feed 0.55 0.81 0.39 34.0 51.9 60.0<br />
Fingerlings (chicks) 0.10 0.14 0.09 6.2 9.0 13.9<br />
Oxygen 0.14 -- -- 8.6 -- -<br />
Subtotal 0.79 0.95 0.48 48.8% 60.9% 73.9%<br />
Operating expenses ($/kg)<br />
Chemicals -- 0.05 0.06 -- 3.2 9.2<br />
Repairs & maintenance 0.07 0.04 -- 4.3 2.6 --<br />
Heating water 0.02 -- -- 1.2 -- --<br />
Heating air 0.03 -- -- 1.9 -- --<br />
Electric 0.16 -- -- 9.9 -- --<br />
O<strong>the</strong>r utilities -- 0.08 0.02 -- 5.1 3.1<br />
Management labor + fringe 0.19 0.17 0.04 11.7 10.9 6.2<br />
Misc. 0.01 -- -- 0.6 -- -<br />
Interest on operating capital 0.06 0.05 -- 3.7 3.2 --<br />
Subtotal 0.54 0.39 0.12 33.3% 25.0% 18.5%<br />
Total cost of production ($/kg) 1.62 1.56 0.65 100% 100% 100%<br />
Note: Broiler costs are broken down for comparison based upon contract grower payments and allocation<br />
of costs between grower and integrator.<br />
8
Twenty-One Years of Commercial Recirculating<br />
Aquaculture with Trout and Perch<br />
Dr. Dave Smith, Ph.D.<br />
President<br />
Freshwater Farms of Ohio, Inc.<br />
2624 North U.S. Highway 68<br />
Urbana, Ohio 43078<br />
University Development of Recirculating Systems:<br />
The development of commercial recirculating aquaculture has its roots in two<br />
different worlds. The first is in biology, and <strong>the</strong> second is in wastewater engineering. I<br />
first became exposed to this new hybrid field in <strong>the</strong> latter part of <strong>the</strong> 1970’s when I<br />
became a grad student in <strong>the</strong> Aquaculture Research Laboratory at <strong>the</strong> University of<br />
Wisconsin in Madison. Here was one example of <strong>the</strong> type of <strong>Sea</strong> Grant research funded<br />
at that time to help <strong>the</strong> promise of aquaculture become a reality, and with expectations<br />
that it would happen very soon. The program, started by dairy professor Dr. Harold<br />
Calbert, was a venture that sought to find supplemental year-round income for dairy<br />
farmers who had empty barns sitting around <strong>the</strong> Midwest. The program got funding to<br />
construct three commercial scale recirculating systems inside a leased industrial building<br />
on <strong>the</strong> edge of town. This is where fish biologists and wastewater engineers came<br />
toge<strong>the</strong>r to create something new. The goal was to raise yellow perch indoors under<br />
controlled conditions, and to show <strong>the</strong> world <strong>the</strong> promise of recirculating aquaculture.<br />
The work of <strong>the</strong> systems was done in three different configurations, involving large<br />
circulating pumps, high pressure sand filters, tube settlers, trickling biofilters, and Koch<br />
rings. Turbidity, excessive backwashing, and difficult solids removal were <strong>the</strong> first<br />
problems to be discovered. The addition of flocculants such as alum, and new settling<br />
areas helped, and yellow perch were raised to market size from fingerlings in 9 to 11<br />
months at 21 degrees C. When <strong>the</strong> number crunching was done, <strong>the</strong> cost of production in<br />
1979 was estimated at $8.65/ kg ($3.86/ lb). In today’s dollars that is $20.40/ kg ($9.11/<br />
lb). At <strong>the</strong> time, <strong>the</strong> market price for Great Lakes yellow perch was $3.26 to $5.80/ lb in<br />
today’s dollars. The price of pioneering comes high. The focus of <strong>the</strong> Wisconsin<br />
aquaculture program quickly changed under <strong>the</strong> guidance of Dr. Terry Kayes, and my<br />
time <strong>the</strong>re was spent studying protein metabolism and carbohydrate tolerance in rainbow<br />
trout.<br />
Commercial Development of Recirculating Systems:<br />
When I finally had an opportunity to start my own aquaculture facility in 1983, it<br />
was in a bankrupt chicken farm on <strong>the</strong> edge of my hometown back in Ohio. It was <strong>the</strong>re,<br />
with <strong>the</strong> help of my engineer fa<strong>the</strong>r and family, that I sought to develop a farmer<br />
approach to recirculating aquaculture. The challenge was to make it simple, make it<br />
1
cheap, and make it do <strong>the</strong> job. Our first two prototype recirculating raceways were built<br />
with loosely stacked concrete blocks, two rows high, and lined with styrofoam and plastic<br />
liners. Even <strong>the</strong>se 75 foot long structures looked small in our 350 foot long chicken barn.<br />
The main lesson I brought back from Wisconsin was <strong>the</strong> crucial need for solids removal.<br />
This was done with settling areas behind penned section of trout, and with a filter section<br />
made of cut-up plastic field tile. The removal of suspended solids allowed our main<br />
biofilters to remain clear of organic residues, and <strong>the</strong> submerged pea-gravel filters were<br />
found to operate 8 to 10 years before need of cleaning or replacement.<br />
More refinements were incorporated into a second generation design, such as<br />
airlift pumps and aeration or “tidal” flushing of <strong>the</strong> biofilters, and <strong>the</strong> core of our business<br />
was <strong>the</strong> production of market-sized rainbow trout at a cost of $0.75 per pound. That may<br />
not be good in Idaho, but when you have markets of 1.5 million people an hour away, <strong>the</strong><br />
ability to sell a premium fish product improves <strong>the</strong> economics. These older recirculating<br />
systems are still in continuous operation, and <strong>the</strong>ir production of one half pound trout per<br />
gallon of water are maintained with 95-98% recirculation.<br />
The most important thing we have discovered at our facility is that in insulated<br />
pole barns (with supplemental solar heat) <strong>the</strong> water temperatures are easily maintained<br />
between 50 and 70 degrees F. This is very suitable for trout, and <strong>the</strong> recirculating<br />
systems, which we dubbed “WaterSmith Systems” allowed <strong>the</strong>ir installation in numerous<br />
o<strong>the</strong>r farms where water was a limiting factor. Pre-treatment of incoming water is<br />
sometimes necessary when excessive levels of iron (>0.5ppm) or ammonia (>1.0 ppm)<br />
are present in <strong>the</strong> water supply, but most well water sources are adequate. We have<br />
converted many o<strong>the</strong>r hog farms, cattle barns, and chicken farms since 1988, and have<br />
formed a network of growers in our area with joint feed purchases and marketing through<br />
Freshwater Farms of Ohio.<br />
Production costs now vary between $0.82 and $1.09 per lb., and <strong>the</strong> delivered<br />
price of graded whole live trout to our processing facility is $1.65 per lb. Therefore our<br />
farmers are operating on a margin of $0.56 to $0.83 per lb., depending on <strong>the</strong> particular<br />
facility. The key here is that a WaterSmith raceway system can be installed for as little<br />
as $5,000 in renovated hog pits that are capable of producing 10,000 pounds of trout per<br />
year. No supplemental heat has ever been necessary when our solar heater system is<br />
used, and for good reason, as heating a system of this size just 1.0 degree C. can add<br />
$0.85 per pound in production costs (year 2000 dollars, Meade, 1973).<br />
Our third generation design has been in operation over a year, and incorporates<br />
<strong>the</strong> same filter systems we have used for <strong>the</strong> past fifteen years, but incorporates timesaving<br />
and space-saving improvements. In a space of 13 feet by 20 feet we build<br />
modules with conical bottom polyethylene tanks set in <strong>the</strong> gravel biofilters for support.<br />
This approach allows three times <strong>the</strong> production in <strong>the</strong> same space as our raceways, and<br />
foregoes <strong>the</strong> normal daily chore of vacuum sweeping <strong>the</strong> settling areas of raceways (20<br />
minutes per day per raceway). The system consists of two tanks per filter module, with a<br />
combination of sizes available, usually 950 gallon or 1500 gallon tanks. The latter<br />
requires ceiling heights over 12 feet, or with below-grade excavation, 10 feet. We also<br />
2
have projects in <strong>the</strong> planning stages that will incorporate <strong>the</strong>se 1500 gallon tank modules<br />
in retrofitting hog barns with 8 foot deep pits, with existing slats providing access to <strong>the</strong><br />
tank tops. One converted cattle barn has had <strong>the</strong>se same modules in production for over a<br />
year, and capacity at time of harvest was 1500 pounds of trout per module. We seem to<br />
reach an oxygen transfer limitation at levels above that, and modifications to incorporate<br />
<strong>the</strong> use of bulk liquid oxygen are being examined.<br />
3
Application of Hazard Analysis and Critical Control Point<br />
(HACCP) Principles as a Risk Management Approach for<br />
Recirculating Aquaculture Systems (RAS)<br />
Michael L. Jahncke Michael H. Schwarz<br />
Director/Associate Professor Aquaculture Specialist<br />
Introduction<br />
Virginia <strong>Sea</strong>food Agricultural Research and Extension Center<br />
102 South King Street<br />
Hampton, Virginia 23669<br />
Most of <strong>the</strong> world’s commercial seafood species are ei<strong>the</strong>r declining or on <strong>the</strong> verge of<br />
over exploitation. Approximately 93% of known wild stocks of fish are used at or above<br />
<strong>the</strong>ir optimum sustainable yield (DOC, 1993). In <strong>the</strong> Sou<strong>the</strong>ast U.S. of <strong>the</strong> 15 species<br />
listed as of “major” importance, 11 were listed as “over” exploited, three were “fully”<br />
exploited, while one species was listed as “unknown” status (DOC, 1993). In <strong>the</strong><br />
November 1998 report to Congress on <strong>the</strong> status of marine stocks, NOAA Fisheries<br />
reported that 100 species reviewed are overfished or are approaching an overfished<br />
condition, while an additional 200 species are not overfished (NMFS, 1998).<br />
The world’s edible fisheries supplies have stabilized at approximately 80 million metric<br />
tons, but <strong>the</strong> world’s projected demand for seafood will be 110 to 120 million metric tons<br />
by 2010. As <strong>the</strong> upward trend for seafood increases, <strong>the</strong> U.S. must develop alternative<br />
seafood supplies or suffer increasing trade imbalances in fishery products (Garrett et al.,<br />
2000). Never<strong>the</strong>lesss, <strong>the</strong> demand for high quality seafood is expected to continue to<br />
increase over <strong>the</strong> next several years, exceeding that which can be supplied by commercial<br />
harvest of wild fisheries (Garrett et al., 2000).<br />
In <strong>the</strong> face of declining wild catches and increasing prices, <strong>the</strong>re has been a decline in<br />
total seafood consumption from a high of 16.2 lbs. in 1987 to 14.9 lbs. /person in 1998<br />
(NMFS, 1999). As a goal, <strong>the</strong> <strong>National</strong> Fisheries Institute has set a consumption goal of<br />
20 lbs./person by <strong>the</strong> year 2000 (Anon., 1990). The trend for reliance on seafood imports<br />
has been steadily increasing for <strong>the</strong> past 10 years to <strong>the</strong> extent that <strong>the</strong> U.S. now imports<br />
more than 50% of its total consumption of seafood from more than 172 countries (NMFS,<br />
1999). As a result, <strong>the</strong> U.S. is now <strong>the</strong> world’s second largest importer of seafood.<br />
World fisheries have undergone dynamic changes. The value of international trade in<br />
fish and fishery products has increased from US $2.2 billion in 1968 to more than US $43<br />
billion in 1998. In 1998, <strong>the</strong> U.S. exported $2.3 billion in edible fishery products and<br />
imported $8.2 billion resulting in a trade deficit in edible fishery products of $5.9 billion<br />
(NMFS, 1999).<br />
1
As <strong>the</strong> upward trend for seafood demand continues, <strong>the</strong> U.S. must develop alternative<br />
seafood supplies or suffer increasing imbalances in fishery products. Aquaculture is one<br />
of <strong>the</strong> fastest growing areas of agriculture. Throughout <strong>the</strong> world, aquaculture provides<br />
approximately 20% of <strong>the</strong> world’s seafood harvest, increasing more than 85% between<br />
1984 and 1992 (Anon., 1995).<br />
Estimated U.S. aquaculture production in 1997 was 348 thousand metric tons consisting<br />
primarily of baitfish, catfish, salmon, trout, clams, crawfish, mussels, oysters, fresh and<br />
saltwater shrimp, and o<strong>the</strong>r species such as striped bass (Morone saxatilis), tilapia, etc.<br />
Imported aquacultured seafood is responsible for most of <strong>the</strong> $5.9 billion U.S. trade<br />
deficit in edible fishery products (NMFS, 1999). In shrimp alone, for example, large<br />
quantities are imported from Mexico, Ecuador, Indonesia, Pakistan, and Thailand. O<strong>the</strong>r<br />
principle U.S. imported species include tuna, lobster, groundfish, and salmon (NMFS,<br />
1999).<br />
U.S. domestic landings are not expected to increase, and any near- and long-term<br />
additional increases in seafood products will have to be produced through domestic<br />
aquaculture operations in order to meet future demand and reduce U.S. reliance on<br />
imported seafood.<br />
Potential Risks<br />
This trend for reliance on imports will probably increase, along with additional Federal<br />
and state environmental regulations to protect wild aquatic stocks, habitat, and water<br />
quality. The U.S. aquaculture industry has <strong>the</strong> potential to help reduce this trend.<br />
However, <strong>the</strong> culture of non-native species poses potential threats to native aquatic<br />
animal species, native aquatic plants, and <strong>the</strong> environment. Never<strong>the</strong>less, with few<br />
exceptions, such as those for bacterial and viral diseases in salmonids and catfish, <strong>the</strong>re is<br />
no risk management strategy in place to provide protection against <strong>the</strong> introduction of<br />
exotic species or disease pathogens that could decimate our natural wild species (Garrett<br />
et al., 2000).<br />
Most disease transfer from cultured to wild species occurs in conjunction with<br />
introduction of non-indigenous species. The absence of a logical risk management<br />
approach to control <strong>the</strong>se hazards presents a major challenge to <strong>the</strong> aquaculture industry.<br />
Countries around <strong>the</strong> world have neglected such disease control procedures and have<br />
suffered dramatic negative consequences. One example is <strong>the</strong> introduction of <strong>the</strong><br />
“crayfish plague” in Britain by farmed crayfish imported from <strong>the</strong> U.S. (Thompson,<br />
1990). Farmed fish and shellfish have also been implicated as reservoirs of disease<br />
organisms (Monro and Waddell, 1984). Weston (1991) reviewed <strong>the</strong> literature and<br />
reported that 48 species, which were parasitic on freshwater fish, were transferred among<br />
continents via importation of live or frozen fish.<br />
Some of <strong>the</strong> more recent episodes in <strong>the</strong> U.S. include <strong>the</strong> introduction of <strong>the</strong> shrimp<br />
Taura virus, yellow head, and white spot viruses into South Carolina and Texas shrimp<br />
farms. Recent studies indicate that native wild white shrimp may also be susceptible to<br />
2
<strong>the</strong>se exotic viruses (Anon, 1995). Without an appropriate risk management strategy,<br />
<strong>the</strong>se diseases have <strong>the</strong> potential to eliminate <strong>the</strong> shrimp and aquaculture industries in<br />
South Carolina and Texas.<br />
The potential for transmission of exotic diseases, specifically shrimp viruses, into native<br />
wild stocks has been recognized by <strong>the</strong> Texas Parks and Wildlife Department (TPWD) as<br />
<strong>the</strong> single most serious resource management issue (McKinney, 1997). The South<br />
Carolina Department of Natural Resources (SCDNR) has developed a risk management<br />
approach to permitting importation of non-native stocks (Stokes and Browdy, 1997).<br />
O<strong>the</strong>r states such as Texas and Minnesota, have written regulations concerning<br />
possession and transportation of exotic species. This is a good start, but a more<br />
comprehensive risk management approach needs to be incorporated into state and Federal<br />
plans.<br />
Disease outbreaks within an aquaculture facility are a common occurrence that, if<br />
unchecked, can wipe out an entire year’s crop (Schwarz, personal communication). The<br />
detrimental effects of disease are even more apparent in intensive recirculating<br />
aquaculture operations. To control disease, many aquaculture companies rely heavily on<br />
<strong>the</strong> use of chemo<strong>the</strong>rapeutics. Currently <strong>the</strong>re are only five approved antibiotics for use<br />
in aquaculture, and <strong>the</strong>se can only be used for certain species and certain life stages.<br />
Inappropriate and/or misuse of such chemicals is not only illegal but can pose potential<br />
food safety hazards to consumers (Garrett et al., 1997). Similarly, <strong>the</strong> transmission of<br />
Streptococcus iniae from whole fish to human fish cutters illustrates <strong>the</strong> complex<br />
interaction of animal, human and environmental safety issues associated with aquaculture<br />
(CDC, 1996; Garrett et al., 2000).<br />
In addition to diseases and exotic pathogens, <strong>the</strong> aquaculture industry also faces major<br />
challenges concerning escapement of exotic species and subsequent displacement of wild<br />
native species from <strong>the</strong>ir natural environment. An example of this is <strong>the</strong> escapement of<br />
100,000 pen cultured Atlantic salmon into <strong>the</strong> Puget Sound (Brennan and Keene, 1997).<br />
There are numerous o<strong>the</strong>r examples of escapement of exotic species from aquaculture<br />
operations into <strong>the</strong> wild, potentially displacing native species and altering gene pools.<br />
Application of Haccp Principles for Risk Management<br />
The Hazard Analysis Critical Control Point (HACCP) system is a risk management<br />
approach that has been accepted on a worldwide basis to prevent major food safety<br />
hazards. The Codex Alimentarius Commission has recognized <strong>the</strong> benefits of HACCP<br />
for use as a global food-control system (Garrett et al., 1997).<br />
In addition to food safety, HACCP principles can be used to control a variety of non-food<br />
safety related hazards. At a <strong>National</strong> Marine Fisheries Service (NMFS) “Workshop on<br />
Integrated Assessment of Shrimp Pathogens,” <strong>the</strong> HACCP concept was proposed as a<br />
potential risk management tool to control exotic shrimp viruses in shrimp ponds and<br />
processing facilities (Jahncke, 1996). The Food And Agricultural Organization (FAO)<br />
3
and <strong>the</strong> World Health Organization (WHO) also recommended that <strong>the</strong> HACCP concept<br />
be applied to fresh waster aquaculture programs in Asia to control foodborne digenetic<br />
trematode infections in humans (Son et al., 1995; Santos, 1997). The results in Vietnam<br />
showed that application of HACCP princples to silver carp culture in North Vietnam was<br />
effective in preventing and controlling Clonorchis sinensi. Similarly, <strong>the</strong> application of<br />
<strong>the</strong>se principles to fresh water aquaculture ponds in Thailand and Laos to control<br />
Opisthorchis viverrini infections was also successful (Son et al., 1995; Santos, 1997).<br />
Application of HACCP principles at aquaculture sites has <strong>the</strong> potential to control<br />
transmission of exotic animal and human pathogens, and escapement of exotic species.<br />
However, except for <strong>the</strong> application of HACCP principles to control human pathogens in<br />
Asia, no additional research on <strong>the</strong> use of HACCP Principles for <strong>the</strong>se purposes has been<br />
conducted.<br />
References<br />
Anonymous. “NFI set sights on 20 lbs. per capita.” Water Farming Journal. 5(1990):14.<br />
Anonymous. “Native shrimp susceptible to South American virus.” The Aquaculture<br />
News. Aug. 3(1995):2.<br />
Brennan, M., L. Keene. “Farm salmon escape pens.” The <strong>Sea</strong>ttle Times Company. Mon.<br />
July 21, 1997.<br />
Centers for Disease Control (CDC). “Invasive infection with Streptococcus iniae-<br />
Ontario”. Morb. Mort. Wkly. Rep. 45(1996):650-653.<br />
Department of Commerce (DOC). “Our living oceans. Report on <strong>the</strong> status of U.S.<br />
living marine resources.” NOAA Technical Memorandum. NMFS-F/SPO-15. 1993.<br />
Garrett, E.S., M.L. Jahncke, and R.E. Martin. “Applications of HACCP principles to<br />
address food safety and o<strong>the</strong>r issues in aquaculture: An overview.” J. of Aquatic Food<br />
Prod. Technol. (In Press). 2000.<br />
Garrett, E.S., M.L. Jahncke, and J. M. Tennyson. “Microbiological hazards and<br />
emerging food-safety issues associated with seafoods.” J. of Food Prot. 60(1997):1409-<br />
1415.<br />
Jahncke, M.L. The application of <strong>the</strong> HACCP concept to control exotic shrimp viruses.<br />
Paper presented at <strong>the</strong> NMFS Workshop on Integrated Assessment of Shrimp Pathogens.<br />
New Orleans, LA. June, 1996.<br />
McKinney, L. The management of shrimp fisheries and mariculture-Balancing <strong>the</strong> risk<br />
of disease-Why everyone hates you and thinks you are an idiot. Proceedings of <strong>the</strong> 22nd<br />
Annual <strong>Sea</strong>food Sciences Tropical and Subtropical Technological Society of <strong>the</strong><br />
Americas, Biloxi, MS. Oct. 5-7, 1997.<br />
4
Monro, A.S.S. and I.F. Waddell. “Furunculosis: Experience of its control in <strong>the</strong> sea<br />
water cage culture of Atlantic salmon in Scotland.” ICES. CM/F:32. 1984.<br />
NMFS. Fisheries of <strong>the</strong> United States, 1997. Current Fisheries Statistics No. 9700. U.S.<br />
Dept. of Commerce, NOAA, NMFS, Silver Spring, MD. 1998.<br />
NMFS. Fisheries of <strong>the</strong> United States, 1998. Current Fisheries Statistics No. 9800.<br />
U.S. Dept. of Commerce, NOAA, NMFS, Silver Spring, MD 1999.<br />
Santos, C.A. <strong>Sea</strong>food Safety, Processing, and Biotechnology. The possible use of<br />
HACCP in <strong>the</strong> prevention and control of food-borne trematode infections in aquacultured<br />
fish. Lancaster, PA: Technomic Publishing Company. 1997.<br />
Schwarz, M. Personal communication. Aquaculture Specialist. VA <strong>Sea</strong>food Research<br />
and Extension Center. 102 S. King St., Hampton, VA 23669. 2000.<br />
Son, T.Q., V.S. Hoi, T.V. Dan, C. Nga, T.Q. Toan, L.V. Chau, N.V. De, D.T. Son, P.D.<br />
Luong, T.Q. Ngoc, and C.A.L. dos Santos. Application of Hazard Analysis Critical<br />
Control Point (HACCP) as a possible control measure against Clonorchis sinensis in<br />
cultured silver carp Hypophtalmichtys molitrix. Proceedings of <strong>the</strong> 2 nd seminar on foodborne<br />
zoonoses: Current Problems, Epidemiology and Food Safety. Khon Kaen,<br />
Thailand. Dec. 6-9, 1995.<br />
Stokes, A.D. and C.L. Browdy. Status of pathogen risk management for wild and<br />
cultured shrimp stocks in South Carolina. Proceedings of <strong>the</strong> Annual <strong>Sea</strong>food Sciences<br />
Tropical and Subtropical Technological Conference of <strong>the</strong> Americas. Biloxi, MS. Oct.<br />
5-7, 1997.<br />
Thompson, A.G. “The danger of exotic species.” World Aquaculture. 21(1990):25-32.<br />
Weston, D.P. Aquaculture and Water Quality. The effects of aquaculture on indigenous<br />
biota. Baton Rouge, LA: World Aquaculture Society. 1991.<br />
5
Abstract not available at time of printing.<br />
Report from Sou<strong>the</strong>rn States<br />
Brian Squyars<br />
Sou<strong>the</strong>rn States Cooperative, Inc<br />
1204 Peachtree Dr.<br />
Suffolk, VA 23434<br />
1
Ten Year in <strong>the</strong> Trenches: Perspectives on <strong>the</strong> Operation<br />
of Large Scale Commercial RAS for <strong>the</strong> Production of<br />
Hybrid Striped Bass<br />
Joshua N. Goldman, President<br />
Fins Technology, LLC<br />
15 Industrial Rd. Turners Falls MA 01376<br />
(413) 863-8905 • Fax: (413) 863-3575<br />
jgoldman@finstechnology.com<br />
Introduction<br />
Recirculating aquaculture systems (RAS) offer many advantages including reduced water<br />
consumption and environmental impact, and enhanced siting flexibility. Well-designed<br />
RAS provide high levels of control over water temperature and o<strong>the</strong>r parameters that can<br />
positively affect <strong>the</strong> biological performance of <strong>the</strong> species being cultured which in turn<br />
drives <strong>the</strong> economics of <strong>the</strong> business.<br />
A review of numerous commercial projects developed over <strong>the</strong> last decade suggests that<br />
despite <strong>the</strong>se advantages, RAS have not fulfilled <strong>the</strong>ir commercial potential due to three<br />
persistent problems: (i) higher than projected capital costs, (ii) prolonged start-up and<br />
debugging, and (iii) <strong>the</strong> inability of <strong>the</strong> life support system to consistently maintain<br />
adequate water quality while sustaining intensive feed input. These factors tend to reduce<br />
output and increase unit production costs. Our economic analysis makes it clear that even<br />
well designed RAS can only be economically competitive if <strong>the</strong>y overcome certain<br />
inherent operational costs by consistently achieving superior biological performance in<br />
term of fish growth, feed conversion efficiency and survival.<br />
How Can Superior Biological Performance Be Achieved in Commercial Systems?<br />
Although a great deal has been learned about <strong>the</strong> underlying unit processes from which<br />
RAS are constructed, achieving consistently superior biological performance represents a<br />
far broader and more significant challenge. Over <strong>the</strong> past decade, we experienced a<br />
disturbing gap between our understanding of <strong>the</strong> system components and <strong>the</strong> full range of<br />
practical considerations essential for commercial implementation.<br />
As designers of commercial RAS, we are challenged to meet a number of seemingly<br />
contradictory objectives. First, selection and integration of appropriately scaled unit<br />
processes is required to make efficient use of feed, oxygen, electricity, and o<strong>the</strong>r inputs.<br />
Second, implementation of <strong>the</strong> physical systems must be sufficiently robust to meet <strong>the</strong><br />
demands of commercial production, minimize maintenance-related downtime and offer<br />
very low cost. Optimally, <strong>the</strong> system should also link some degree of reserve treatment<br />
capacity to monitoring and control devices capable of minimizing <strong>the</strong> impacts of feeding<br />
and fish activity in real time. Finally, <strong>the</strong> configuration of <strong>the</strong> physical facilities should be<br />
thoroughly integrated with a well-designed management regime. Failure to appreciate <strong>the</strong><br />
risks of imprecise management can results in poor utilization of system capacity and<br />
1
increase <strong>the</strong> potential for bottlenecks as successive batches progress toward market. In<br />
our view, <strong>the</strong>se key success factors remain largely under appreciated.<br />
Background on Technical Development<br />
Fins Technology, (formerly AquaFuture, Inc.) is one of <strong>the</strong> world’s largest and longest<br />
operating recirculating aquaculture facilities. The company pioneered many of <strong>the</strong> basic<br />
process technologies that have become <strong>the</strong> standard for RAS in <strong>the</strong> U.S. Fins<br />
Technology has integrated three major elements in its technology platform: (1) highperformance<br />
life-support hardware, (2) process optimization methods, and (3) Fast-Track<br />
breeding to produce genetically superior fingerlings. Beginning in 1988, AquaFuture<br />
developed its first generation technology within a 4,000 square foot pilot plant in Turners<br />
Falls, Massachusetts. The Company’s production of hybrid striped bass (HSB)<br />
demonstrated that significantly faster fish growth could be achieved within a controlled<br />
environment.<br />
In 1990, based on <strong>the</strong> success of its pilot operation, AquaFuture, Inc. undertook an 80fold<br />
scale-up of its process by building 10 independent, 3 MGD second generation<br />
systems within a 40,000 Sq. Ft. facility. In 1993 and 1997 <strong>the</strong> plant was expanded to<br />
better integrate nursery activities and currently recirculates over 150,000 cu meters of<br />
water/day (28,000 gpm). Fish sales were initiated in 1991 with continuous weekly<br />
shipments.<br />
Despite two years of pilot experience and <strong>the</strong> breadth and depth of our technical team,<br />
many parameters specific to production of HSB within RAS remained poorly defined<br />
through scale-up. These parameters included HSB’s tolerance for NO3, CO2, TSS, high<br />
temperature and culture density. Because <strong>the</strong> majority of research on HSB had focused on<br />
pond production of juveniles, it was necessary to undertake significant in-house process<br />
evaluation to generate data necessary to continue <strong>the</strong> evolution of <strong>the</strong> system.<br />
Fins Technology patented fluidized bed bioreactor was a key development that provided<br />
vastly increased bio-treatment per unit of filter volume. This device allows biosolids<br />
concentrations 5 to 10 times greater <strong>the</strong>n can be achieved with conventional bioreactors.<br />
The reactors surface area allows for shorter process retention times and substantial<br />
reduction in <strong>the</strong> size and cost of treatment facilities. The filter balances microbial growth<br />
with continuous cleansing of <strong>the</strong> media. This significantly increases process stability<br />
while reducing maintenance requirements and lowering operational costs. For striped<br />
bass, high oxidation rates and excess surface area reduce diffusion limits providing <strong>the</strong><br />
capability for rapid response to changes in water quality. This is an important<br />
consideration for practical management of commercial systems which has not been<br />
widely described in <strong>the</strong> literature.<br />
Integration of Fish Health Management Systems<br />
In 1993, an expansion of <strong>the</strong> company’s facilities over-extended <strong>the</strong> available water<br />
resources and reduced our ability to maintain culture temperature within acceptable limits<br />
during summer months. This caused significant elevation in mortality associated with<br />
opportunistic bacterial infections. This forced us to implement a broad based health<br />
intervention plan which included improvements to internal water disinfection, routine<br />
2
fish health sampling, vaccination, probiotics, INAD’s, and increased access to make-up<br />
water to better control temperature. Perhaps more importantly, it reinforced <strong>the</strong> need to<br />
think of and understand <strong>the</strong> system as a whole; gaining an appreciation for how<br />
seemingly small changes in condition might result in large differences in outcome. This<br />
was a critical management lesson that would be reinforced again and again over <strong>the</strong><br />
years.<br />
Process Evaluation Leads to Fur<strong>the</strong>r Improvements Technology<br />
After stabilizing mortality, <strong>the</strong> company was able to implement improvements to its<br />
treatment process that had been developed as a result of <strong>the</strong> process evaluation effort.<br />
Development, testing and installation of upgraded filtration systems enabled increased<br />
feeding intensity while improving key water quality parameters by as much as 70%. This<br />
upgrade shifted <strong>the</strong> principle constraint from <strong>the</strong> culture environment to <strong>the</strong> capability of<br />
<strong>the</strong> fish <strong>the</strong>mselves.<br />
Breeding Program Introduced<br />
Having addressed <strong>the</strong> major limitations of <strong>the</strong> culture system, our research efforts were<br />
redirected toward breeding superior fish. In 1995 <strong>the</strong> company initiated a domestication<br />
program. Our goal was to establish a founding population of performance tested<br />
broodstock in order to produce superior performing fingerlings. Since 1995, <strong>the</strong><br />
Company evaluated over 7,000 individually and/or genetically tagged fish from 70<br />
families and 12 distinct strains. The top performing families resulting from this effort<br />
reach market 40% more quickly than commercially available hybrids. Ongoing efforts are<br />
underway to produce stable lines of superior hybrids for commercial production.<br />
Overview of Technical Accomplishments<br />
In 1998, after a decade of focused effort, AquaFuture developed its third-generation<br />
technology. This system optimizes <strong>the</strong> balance between fish biomass, feed input and<br />
filtration capacity, achieving a 50% increase in average daily feed input and nearly<br />
doubling production per filter module. The improved system offers a 70% reduction in<br />
capital cost per unit output and a 20% reduction in unit production costs while improving<br />
oxygenation and CO2 removal and needing less manpower to operate. We <strong>the</strong>n<br />
incorporated leading edge technologies including waste feed detection, a patented sump<br />
for segregating and removing mortalities and improved control systems. A comparison of<br />
first, second and third generation systems is shown in Figure 1.<br />
Integration and Experience<br />
A decade of commercial experience has underscored <strong>the</strong> need to broaden our<br />
development efforts to manage critical areas interrelated with, but beyond <strong>the</strong> controlled<br />
environment central to RAS. Achieving consistently superior biological performance<br />
requires well developed approaches to managing nutrition, health and genetics tailored to<br />
<strong>the</strong> species and culture system (see figure 2, below). Gaining access to effective metrics,<br />
tools and approaches has been both illusive and costly. On <strong>the</strong> positive side, some aspects<br />
of <strong>the</strong> controlled environment established in RAS have proven to be excellent platforms<br />
for making sustained gains in <strong>the</strong>se critical areas.<br />
3
Figure 1: Comparison of First, Second & Third Generation Systems<br />
First Generation:<br />
1980 - 1990<br />
4<br />
Second Generation:<br />
1990 - 1996<br />
Third Generation:<br />
1997 - 1998<br />
Production<br />
Pounds Output Per Module 10,000 65,000<br />
100,000<br />
Average No. Fish Per System 6,500 40,000 60,000<br />
Average Feed Input (Lbs/day) 50 330 500<br />
Daily Fish Growth (Lbs/day) 30 200 300<br />
Operations<br />
System Volume (gal) 18,000 160,000<br />
120,000<br />
Recirculation Flow (GPM) 400 1,800 2,200<br />
Energy Use: (kW/pound) 4.3 2.8 1.6<br />
Water Use: (gal/pound output) 238<br />
110 72<br />
Economics<br />
Capital Investment Per Module $ 160,000 $ 350,000 $ 150,000<br />
$ Capital / Ton Output $ 18,000 $ 11,000 $<br />
3,300<br />
Output Per Employee (tons/yr.) 5<br />
21<br />
60<br />
Figure 2: Key Disciplines Required For Successful Production within Commercial RAS<br />
Controll d e<br />
Envronm i t eRASn (with excess<br />
capacity<br />
to provide<br />
robustness)<br />
Benefi s: t<br />
• Bet er Feed t Converson i<br />
• Lower Mortaityl • Faster Growth<br />
• Siti g Flexib n li yi<br />
t<br />
• Consist nt eQualty<br />
i<br />
• Cos Reduct t on i<br />
MIS Systems:<br />
Monitoring Anal , sis y&<br />
Process Control<br />
Precise Co tron Creates l a Platf rm ofor<br />
Co ti n n s u o u<br />
Co t Red s ctio u ann I dproved<br />
m System Performance<br />
Healt Man h gemen a Systems t<br />
Nuritio t & need<br />
F anagement M<br />
Genetics & reedB i n g
Although valuable knowledge has been acquired about <strong>the</strong> issues that affect <strong>the</strong> success<br />
of commercial RAS, to date very limited information is available to help prospective<br />
users identify or address <strong>the</strong> practical issues of (i) project siting, (ii) managing <strong>the</strong> cost<br />
and quality of implementation, and (iii) developing robust though workable management<br />
systems. For us, identification of <strong>the</strong> unit processes that meet <strong>the</strong> opposing demands of<br />
robustness, efficiency and low cost was a critical first step. Proper implementation and<br />
cost containment represented a significant secondary challenge that many new users of<br />
RAS will undoubtedly find extremely problematic. Finally, accessing and integrating<br />
appropriate tools and strategies into <strong>the</strong> management regime is perhaps <strong>the</strong> most critical<br />
factor to achieving superior biological performance essential for commercial success. A<br />
decade of dealing with <strong>the</strong>se challenges has taught us to anticipate how changes to one<br />
parameter might affect biological or economic outcomes. We’ve found no substitute for<br />
<strong>the</strong> value of long-term operational experience to develop realistic expectations necessary<br />
for developing successful projects in an increasingly competitive market environment.<br />
5
Ecological and Resource Recovery Approaches to Reduce <strong>the</strong><br />
Environmental Impact of Aquaculture Production<br />
Paul R. Adler<br />
<strong>National</strong> Center for Cool and Cold Water Aquaculture<br />
United States Department of Agriculture-Agricultural Research Service<br />
45 Wiltshire Road, Kearneysville, WV 25430, USA<br />
Introduction<br />
In a global sense, sustainability can be defined as "managing <strong>the</strong> earth and human use of its<br />
resources so as to keep human civilization going indefinitely" (Frosch, 1998). Nature has<br />
achieved a sort of dynamic equilibrium through a high degree of interconnectedness of food<br />
and waste cycles, known as food webs.<br />
Developing integrated farming systems is critical to reducing <strong>the</strong> environmental impact of<br />
animal production. Traditionally, this has been through integrating animal and feed or plant<br />
production. But that has become increasingly difficult as agricultural production has become<br />
regionally specialized leading to <strong>the</strong> spatial separation of animal and feed production. This<br />
spatial separation has led to nutrient imbalances in watersheds and increases in nonpoint<br />
source runoff losses of nutrients to <strong>the</strong> water environment. The most common use of animal<br />
manure has been as a plant nutrient with ancillary benefits as an amendment to improve soil<br />
physical properties. Some manures have been used as an animal feed ingredient (CAST,<br />
1996).<br />
The food animal production industry has found it very difficult to pass on environmental<br />
control costs to consumers in <strong>the</strong> free market system (CAST, 1996). Reducing management<br />
costs and increasing byproduct value are potential ways to reduce environmental control<br />
costs. When animal manure is viewed as a waste, storage in lagoons is a common management<br />
and treatment alternative. Anaerobic storage of manure in lagoons, however, degrades its<br />
value by increasing offensive odors and air pollutants and reducing organic matter and nutrient<br />
content. As a resource (Janzen et al., 1999), value-added processes are used to maximize its<br />
value, <strong>the</strong>reby opening up more market options. In contrast to technological solutions,<br />
ecological approaches are less capital intensive and by using ecosystem services, have reduced<br />
operating costs.<br />
Water resources of high quality are needed for a sustainable society. Aquaculture production<br />
needs high quality water supplies and to develop economical systems to conserve and return<br />
clean water to <strong>the</strong> environment. Minimizing <strong>the</strong> environmental impact is critical to ensuring<br />
sustainable aquaculture production. The 3 main sources of nutrient pollution are aquaculture<br />
solids, overflow water from off-line settling basins for aquaculture solids, and nutrients from<br />
aquaculture system water. We have used 3 principles to guide our approach to <strong>the</strong><br />
development of new systems to reduce <strong>the</strong> environmental impact of aquaculture production:<br />
1
(1) identify waste byproducts from o<strong>the</strong>r industries which have value to reduce <strong>the</strong><br />
environmental impact of aquaculture production, a process called co-utilization, (2) develop<br />
ecological approaches which use <strong>the</strong> "free" labor of natural ecological processes, called<br />
ecosystem services, and (3) develop resource recovery systems which conserve or add value<br />
to <strong>the</strong> waste byproducts ra<strong>the</strong>r than degrade <strong>the</strong>ir value. This paper will review supporting<br />
literature and describe results from 3 current projects that use various aspects of <strong>the</strong> preceding<br />
principles.<br />
Co-Utilization<br />
Co-utilization is <strong>the</strong> production of new products from combining and blending two or more<br />
byproducts (Korcak, 1998). It is a value-added process, reducing costs through use of waste<br />
byproducts or producing a product of greater value than <strong>the</strong> lower value inputs. Composting<br />
is a co-utilization process blending a high carbon source (straw, wood, or paper products) and<br />
a high nitrogen (N) source (manure). The term co-utilization is used to emphasize an<br />
expanding definition of <strong>the</strong> types of byproducts utilized to include municipal, industrial, and<br />
animal byproducts in order to broaden <strong>the</strong> types of products that can be produced and <strong>the</strong><br />
goals of <strong>the</strong>ir incorporation.<br />
Co-utilization can be used to reduce <strong>the</strong> loss of nutrients in overflow water from off-line<br />
settling basins in aquaculture by sequestering <strong>the</strong> nutrients in <strong>the</strong> settled solids through<br />
alkaline stabilization or chemical sorption of phosphorus (P). Most P is initially in <strong>the</strong> solids.<br />
However, it has been shown that P content of rainbow trout manure is typically reduced by<br />
50% from <strong>the</strong> raceway to settling basin due to leaching (IDEQ, 1996). Reducing <strong>the</strong> loss of P<br />
from solids can significantly reduce <strong>the</strong> amount of P lost to <strong>the</strong> water environment.<br />
Alkaline stabilization<br />
Lime stabilization raises <strong>the</strong> pH of <strong>the</strong> biosolids to greater than 12, making <strong>the</strong> environment<br />
not suitable for survival of microorganisms. The high pH causes loss of ammonia N. However,<br />
because microbial mineralization of <strong>the</strong> organic matter is inhibited, carbon and organic N and<br />
P are conserved. The current standard method for aquaculture solids storage is under<br />
anaerobic conditions in settling basins. But significant carbon, N, and P are lost in this<br />
process. Pathogen destruction and organic matter stabilization can be achieved by blending<br />
alkaline byproducts such as cement kiln dust, lime kiln dust, or coal combustion ash with<br />
biosolids (Wright et al., 1998).<br />
Chemical sorption of phosphorus<br />
Excess P typically is removed in domestic wastewater systems by <strong>the</strong> addition of alum<br />
(Al2(SO4)3 or ferric iron salts (Fe2 (SO4)3) (Metcalf and Eddy, 1991). However, <strong>the</strong> use of<br />
ei<strong>the</strong>r of <strong>the</strong>se water treatment chemicals can incur a significant operating cost. There are<br />
several regional waste materials that have proven effective in P sequestration. These have<br />
included coal combustion byproducts (Stout et al., 1998), steelmaking slags and dusts (Lee et<br />
al., 1996), and residues from <strong>the</strong> processing of bauxite ores (Summers et al., 1996).<br />
2
Acid mine drainage (AMD) is widespread in <strong>the</strong> Appalachian region due to decades of coal<br />
mining activities predating regulation of acid discharge. When AMD is treated by<br />
neutralization with alkaline substances such as limestone or lime, a precipitate or floc is<br />
formed, consisting mainly of base metal hydroxides and unreacted alkaline material. Disposal<br />
costs of <strong>the</strong> floc can be as much as one half of <strong>the</strong> total operating cost for a treatment facility.<br />
Adler and Sibrell (unpublished data) have shown that <strong>the</strong> co-utilization of AMD floc added to<br />
settled rainbow trout solids can sequester more than 98% of <strong>the</strong> soluble P under anaerobic<br />
conditions typical of off-line settling basins, <strong>the</strong>reby reducing leaching loses of P into <strong>the</strong><br />
water environment.<br />
Stabilization of aquaculture solids with alkaline, aluminum, or iron byproducts has different<br />
results. Aluminum and iron byproducts will specifically sorb P, but anaerobic degradation of<br />
organic matter will continue and N and carbon will be lost. Use of alkaline byproducts,<br />
however, will conserve carbon, and organic N and P. The product will have a high lime<br />
content, which will probably limit land application ra<strong>the</strong>r than N or P content.<br />
Ecological Approach<br />
Aquaculture solids treatment and management systems<br />
The goals of solids treatment systems in aquaculture are volume reduction (e.g. thickening<br />
and dewatering) and stabilization. Stabilization of solids reduces pathogens (both human and<br />
animal) and eliminates offensive odors and <strong>the</strong> potential for putrefaction (Metcalf and Eddy,<br />
1991). Stabilization achieves <strong>the</strong>se objectives by ei<strong>the</strong>r <strong>the</strong> biological reduction or chemical<br />
oxidation of volatile solids, addition of chemicals to make solids unsuitable for survival of<br />
microorganisms, or heat disinfection or sterilization of <strong>the</strong> solids. Municipal biosolids<br />
treatment and management systems are typically capital intensive, whereas on farms, <strong>the</strong>y are<br />
more land intensive, relying more on natural ecological processes to achieve <strong>the</strong> desired goals.<br />
There are a number of natural biosolids treatment and management systems currently in use;<br />
some are anaerobic (anaerobic digesters, lagoons, and wetlands) and o<strong>the</strong>rs are aerobic<br />
(vermicomposting, composting, and land application) processing systems (Metcalf and Eddy,<br />
1991; Reed et al., 1995). Anaerobic storage of manure in settling basins has been <strong>the</strong> standard<br />
practice for aquaculture solids. However, <strong>the</strong> anaerobic environment degrades <strong>the</strong> solids value<br />
by increasing offensive odors and air pollutants and reducing organic matter and nutrient<br />
content. Land application and composting are <strong>the</strong> most common aerobic organic solids<br />
treatment systems. Land application is <strong>the</strong> beneficial use of solids at agronomic rates. The<br />
value of land-applied solids is greatly reduced by anaerobic storage prior to land application.<br />
There are four general groups of composting methods used on farms: passive composting<br />
(e.g. passively aerated windrows with embedded perforated pipes, or windrow composting<br />
with a much less frequent turning schedule), windrows (turned using ei<strong>the</strong>r a front-end loader,<br />
tractor-assisted or self-powered turner), aerated piles (e.g. aerated static pile using suction or<br />
pressure), and in-vessel composting (categorized based on geometric shape of vessel and<br />
movement of biosolids through system, e.g. plug-flow-operates on a first-in, first-out principle<br />
3
and dynamic batch systems which mechanically mix biosolids) (Metcalf and Eddy, 1991;<br />
Rynk, 1992). Their land, infrastructural, operational and maintenance, and odor control<br />
requirements, capital costs, and duration of compost to maturity all factor into <strong>the</strong> decision of<br />
which composting system is <strong>the</strong> best fit for <strong>the</strong> operator. In terms of cost, labor, management,<br />
and process speed, <strong>the</strong> windrow, passively aerated windrow, and aerated static pile systems<br />
are comparable (Rynk, 1992) and windrows, aerated piles, or aerated bins are <strong>the</strong> systems<br />
most likely to be used on farms. All biological processes release heat and because compost<br />
piles lose less heat as <strong>the</strong>ir size increases, <strong>the</strong>y reach higher temperatures. Consequently,<br />
composting can continue during <strong>the</strong> colder temperatures of winter if <strong>the</strong> piles are large enough<br />
in size. Decomposition of organic matter in <strong>the</strong> soil ecosystem occurs under mesophylic (50-<br />
105ºF) temperatures but employs a more diverse and complete microflora and fauna.<br />
An understanding of how <strong>the</strong> soil ecosystem works, what factors enhance <strong>the</strong> rate which it<br />
processes organic matter, and how to design systems that minimize <strong>the</strong> impact on <strong>the</strong><br />
environment are critical when developing systems to stabilize organic matter using <strong>the</strong> soil<br />
ecosystem. First, is a description of how <strong>the</strong> soil ecosystem processes organic matter. Organic<br />
matter decomposition occurs at several distinct but related spatial and temporal scales within<br />
<strong>the</strong> soil ecosystem (Lavelle, 1997). Soil invertebrates have limited ability to digest complex<br />
organic substrates and with increasing size, <strong>the</strong>ir relationship with microflora shifts from<br />
predations to mutualisms of increasing efficiency permitting <strong>the</strong>m to exploit soil resources.<br />
Microfoodwebs are comprised of microfauna predators (2mm; termites and earthworms) are soil invertebrates that affect major<br />
soil processes by digging soil and building organomineral structures. They are large enough to<br />
develop efficient internal mutualistic relationships with microflora, an ‘internal rumen’ type of<br />
digestion, which allow <strong>the</strong>m to digest o<strong>the</strong>rwise resistant material. Soil fauna enhance <strong>the</strong><br />
decomposition and humification of organic matter, especially low quality organic matter, by<br />
comminuting organic matter and increasing <strong>the</strong> surface area for microbial activity, by<br />
producing enzymes to breakdown complex compounds and polymerize compounds to form<br />
humus, and by improving <strong>the</strong> environment for microbial growth and interactions (Tian et al.,<br />
1997).<br />
The addition of carbon is an essential component of processing aquaculture solids using <strong>the</strong><br />
soil ecosystem, just like with composting. The carbon source provides energy, physical<br />
structure, and is <strong>the</strong> matrix for both <strong>the</strong> organic soil product and sequestration of N and P to<br />
reduce environmental losses. Organic matter quality affects decomposition and consequently<br />
N and P sequestration and release. The quality of organic matter is related to <strong>the</strong> C:N ratio<br />
4
and <strong>the</strong> polyphenol content (Northup et al., 1999). Organic matter quality decreases as C:N<br />
ratio, lignin, and polyphenol content increase. When earthworms mix and aerate <strong>the</strong> system,<br />
<strong>the</strong> carbon source and C:N ratio have a significant impact on <strong>the</strong> rate earthworms bioprocess<br />
<strong>the</strong> mixture. Switchgrass, oak, and willow are more desirable than barley straw, hybrid poplar,<br />
and pine, for example and C:N ratios less than 30 also reduce and delay bioprocessing by<br />
earthworms (Adler, unpublished data). Some carbon sources sequester N more rapidly than<br />
o<strong>the</strong>rs, such as willow, leading to greater conservation of N. Standard farm soil tillage<br />
equipment can also be utilized to mix <strong>the</strong> organic soil instead of relying of earthworms. If<br />
tillage is <strong>the</strong> favored management system to mix and aerate <strong>the</strong> system, carbon source and<br />
C:N ratio may not be as critical. In ei<strong>the</strong>r system, solids can be applied using standard farm<br />
equipment, such as a vacuum tank spreader for solids followed by surface application of <strong>the</strong><br />
carbon layer to minimize vector transmission and volatilization of odors and N. Both systems,<br />
whe<strong>the</strong>r relying solely on soil ecological processes for aquaculture solids stabilization or<br />
tillage, farm labor and capital investment are minimized compared to alternative strategies.<br />
Agroecosystems using biological management of soil fertility, strive for synchronization of<br />
nutrient release with plant demand (Woomer and Swift, 1994) to not only increase <strong>the</strong><br />
nutrient use efficiency, but also reduce <strong>the</strong> potential for loss to <strong>the</strong> ground and surface waters.<br />
With a C:N ratio of 20-30, water soluble N should be minimized (Stevenson and Cole, 1999).<br />
However, P sequestration in manure amended compost is N limited due to <strong>the</strong> low N:P ratio<br />
of manure. Water soluble P can be sequestered by having a higher C:P ratio. Net<br />
immobilization of P occurs when C:P ratio is >300 and net materialization when
solublized and transformed into microbial biomass. The bacterial layer is decomposed and<br />
oxidized during rest periods between doses. Biological clogging will occur if <strong>the</strong> organic<br />
loading rate and biological growth within <strong>the</strong> bed exceeds <strong>the</strong> capacity of decomposition.<br />
When microbial growth exceeds decomposition, <strong>the</strong> microbial biomass will increasingly<br />
decrease pore volume, hydraulic conductivity, and oxygen transport, leading to <strong>the</strong><br />
development of anaerobic conditions, a reduction in decomposition rate, and eventual failure<br />
of <strong>the</strong> filter to operate. The interaction of loading and assimilation rate will determine <strong>the</strong> filter<br />
capacity and life span. Temperature and availability of oxygen directly affect <strong>the</strong> rate of<br />
biodegradation and degree of stabilization.<br />
The design criteria for recirculating and intermittent sand filters differ; in general, <strong>the</strong> loading<br />
rates are greater with recirculating sand filters. Operation is best when <strong>the</strong> volume per dose is<br />
such that water flow around <strong>the</strong> filter medium is as a thin film to maximize absorption of<br />
soluble and colloidal material and oxygen transfer. However, when <strong>the</strong> volume of liquid<br />
applied is sufficient to fill in <strong>the</strong> pore space, particles and microorganisms can pass through <strong>the</strong><br />
filter untreated. The typical filter bed depth is 60 cm. At bed depths of 45cm, BOD and TSS<br />
removal remain high, but <strong>the</strong> degree of nitrification is significantly reduced. The hydraulic<br />
loading rate is typically 4-8 cm/d for intermittent and 12-20 cm/d for recirculating sand filters,<br />
a dose not exceeding 10% of <strong>the</strong> field capacity ensures film flow of <strong>the</strong> liquid. Typical organic<br />
loading rates range from 2.5-10g BOD/m 2 /d for intermittent and 10-40g BOD/m 2 /d for<br />
recirculating sand filters.<br />
To convert sand filters into a resource recovery approach, carbon, such as straw or sawdust,<br />
can be substituted for <strong>the</strong> sand, yielding an organic soil end product with value. With sand as<br />
<strong>the</strong> filter medium, concurrent with removing organic matter from <strong>the</strong> water, a waste sand<br />
byproduct is generated. Carbon filters with a hydraulic loading rate of 47cm/d and total<br />
suspended solids (TSS) loading rate of 20-100g/m 2 /d, removed more than 95% of <strong>the</strong> TSS<br />
(Adler, unpublished data), but performance varied with carbon source. Carbon source is a<br />
critical design parameter in optimizing ecological systems for resource recovery. The addition<br />
of epegic earthworms significantly increased bed hydraulic conductivity by maintaining pore<br />
volume at greater organic loading rates.<br />
Costs associated with reducing <strong>the</strong> environmental impact of aquaculture production can be<br />
decreased by: (1) reducing input costs through co-utilization of waste byproducts ra<strong>the</strong>r than<br />
using higher grade inputs, (2) reducing labor costs through use of ecosystem services, and (3)<br />
using resource recovery systems to conserve and increase <strong>the</strong> value of waste byproducts.<br />
Developing integrated farming systems is critical to maintaining economic and environmental<br />
sustainability. O<strong>the</strong>r cycles of integration need to be conceived and developed in addition to<br />
reintegrating animal and feed or plant production (e.g. soil farming, i.e. producing soil for<br />
non-farm markets, etc.).<br />
6
References<br />
CAST. 1996. Integrated Animal Waste Management. Task Force Report No. 128. Council<br />
for Agricultural Science and Technology. Ames, IA.<br />
Crites, R. and G. Tchobanoglous. 1998. Small and Decentralized Wastewater Management<br />
Systems. The McGraw-Hill Companies. New York, New York.<br />
Frosch, R.A. 1998. "Industrial ecology and sustainability". American Scientist. 86:2.<br />
IDEQ. 1996. Idaho Waste Management Guidelines for Aquaculture Operations. Idaho<br />
Division of Environmental Quality.<br />
Janzen, R.A., W.B. McGill, J.J. Leonard, and S.R. Jeffrey. 1999. "Manure as a resource-<br />
Ecological and economic considerations in balance." Transactions of <strong>the</strong> ASAE 42:1261-<br />
1273.<br />
Korcak, R.F. 1998. Why Co-Utilization? In Beneficial Co-Utilization of Agricultural,<br />
Municipal and Industrial By-Products. Brown, S., J.S. Angle, and L. Jacobs (eds.). Kluwer<br />
Academic Publishers, Dordrecht, The Ne<strong>the</strong>rlands.<br />
Lavelle, P. 1997. "Faunal activites and soil processes: Adaptive strategies that determine<br />
ecosystem function." Adv. Ecol. Res. 27:93-132.<br />
Lee, S. H., S. Vigneswaran, and L. Bajracharya. "Phosphorus Transport in Saturated Slag<br />
Columns: Experimental and Ma<strong>the</strong>matical Models." Water Sci. Tech., 34(1-2):153-160.<br />
Metcalf and Eddy, Inc. 1991. Wastewater Engineering: Treatment, Disposal, and Reuse,<br />
Third Edition, revised by G. Tchobanoglous and F.L. Burton. McGraw-Hill, Inc., New York,<br />
NY.<br />
Northup, R.R., R.A. Dahlgren, T.M. Aide, J.K. Zimmerman. 1999. Effect of plant<br />
polyphenols on nutrient cycling and implications for community structure, p. 369-380. In<br />
Principles and practices in plant ecology: Allelochemical interactions. Inderjit, K.M.M.<br />
Dakshini, and C.L. Foy (eds.). CRC Press, Boca Raton, FL.<br />
Reed, S.C., R.W. Crites, and E.J. Middlebrooks. 1995. Natural Systems for Waste<br />
Management and Treatment. Second Edition. McGraw-Hill, Inc. New York, NY.<br />
Rynk, R. 1992. On-Farm Composting Handbook. Nor<strong>the</strong>ast Regional Agricultural<br />
Engineering Service, NRAES-54.<br />
7
Sharpley, A., J.J. Meisinger, A. Breeuwsma, J.T. Sims, T.C. Daniel, and J.S. Schepers. 1998.<br />
Impact of animal manure management on ground and surface water quality. In Animal Waste<br />
Utilization: Effective Use of Manure as a Soil Resource. J.L. Hatfield and B.A. Stewart<br />
(eds.). Ann Arbor Press. Chelsea, MI.<br />
Stevenson, F.J. and M.A. Cole. 1999. Cycles of Soil: Carbon, Nitrogen, Phosphorus, Sulfur,<br />
and Micronutrients. 2 nd ed. Wiley, New York.<br />
Stout, W. L., A. N. Sharpley, and H. B. Pionke. 1998. "Reducing Soil Phosphorus Solubility<br />
with Coal Combustion By-Products." J. Environ. Qual., 27:111-118.<br />
Summers, R. N., D. D. Smirk, and D. Karafilis. 1996. "Phosphorus Retention and Leachates<br />
from Sandy Soil Amended with Bauxite Residue (Red Mud)." Aust. J. Soil Res., 34:555-567.<br />
Swift, M.J., O.W. Heal, and M.J. Anderson. 1979. Decomposition in Terrestrial Ecosystems.<br />
University of California Press, Berkeley, CA.<br />
Tian, G., L. Brussaard, B.T. Kang, and M.J. Swift. 1997. Soil fauna-mediated decomposition<br />
of plant residues under constrained environmental and residue quality conditions, p. 125-134.<br />
In Driven by Nature: Plant Litter Quality and Decomposition. G. Cadisch and K.E. Giller<br />
(eds.). CAB International, UK.<br />
Woomer, P.L. and M.J. Swift. 1994. Biological Management of Tropical Soil Fertility.<br />
Wiley, New York.<br />
Wright, R.J., W.D. Kemper, P.D. Millner, J.F. Power, and R.F. Korcak (Eds.). 1998.<br />
Agricultural Uses of Municipal, Animal, and Industrial Byproducts. U.S. Department of<br />
Agriculture, Agricultural research Service, Conservation research report No. 44, 135 pp.<br />
8
Tilapia and Fish Wastewater Characterization and<br />
Regulatory Experiences in New York<br />
Dr. Michael B. Timmons<br />
Professor<br />
Department of Agricultural and Biological Engineering<br />
Cornell University<br />
Ithaca, NY 14850 USA<br />
Dr. Shulin Chen<br />
Associate Professor<br />
Biological Systems Engineering<br />
Washington State University<br />
Pullman, WA<br />
Introduction and Background<br />
This paper will report on our experiences with <strong>the</strong> water regulatory agencies governing<br />
wastewater treatment in NY State and provide some additional background information<br />
on waste and manure characteristics from tilapia and fish in general. At this point in<br />
time, we can not draw any definitive differences between tilapia manure and o<strong>the</strong>r fish<br />
species manures, see Figure 1 for a general mass balance. All fish in <strong>the</strong> process of<br />
assimilating feed will produce ammonia which in turn must be oxidized by <strong>the</strong><br />
nitrification system used for <strong>the</strong> facility:<br />
Nitrosomonas (autotrophic)<br />
NH4 + 1.5 O2 --> 2H + H2O + NO2<br />
Nitrobacter (autotrophic)<br />
NO2 + 0.5 O2 --> NO3<br />
Alkalinity destruction (7 g per g NH4)<br />
Note that <strong>the</strong> ultimate fate of <strong>the</strong> protein-nitrogen in <strong>the</strong> above equations is nitrate (NO3).<br />
Chen et al. (1997) has summarized <strong>the</strong> waste generation for <strong>the</strong> major farm animals (see<br />
Table 1). In particular, <strong>the</strong> waste being produce from fish can be described as (Chen, et<br />
al. 1997):<br />
• TSS 20-50%<br />
• BOD 10-60%<br />
• Ammonia-N 3% (will become after nitrification nitrate-N)<br />
• P 1%<br />
1
And <strong>the</strong> physical characteristics of fish manures (Chen et al., in press) are described as:<br />
• Wide size distribution<br />
• Significant non-settleable portion, ~ 50%<br />
• Organic in nature, > 80% by weight<br />
• Specific gravity < 1.1<br />
• High in nutrient content<br />
Table 1. Waste generation (kg/day per 1,000 kg live weight) from a catfish RAS and<br />
o<strong>the</strong>r commercial animal production systems (Chen et al., 1997<br />
Animal BOD5 Solids TKN Sludge Volume<br />
(L)<br />
Catfish 0.8-1.3 4.2 0.20 70-420<br />
Beef cattle 1.6 9.5 0.32 30<br />
Dairy Cow 1.4 7.9 0.51 51<br />
Poultry 3.4 14.0 0.74 37<br />
Swine 3.1 8.9 0.51 76<br />
Total suspended solids (TSS) are a key indicator of overall water quality and <strong>the</strong><br />
efficiency of <strong>the</strong> solids removal system. Chen et al. (1993) expressed <strong>the</strong> various key<br />
water quality parameters in a RAS system with catfish in relation to TSS (Table 2):<br />
Table 2. TSS (mg/L) and BOD, COD, TKN and TP expressed as weight percentage of<br />
<strong>the</strong> TSS (from Chen et al. 1993<br />
TSS<br />
(Mg/L)<br />
BOD5 BOD20 COD TKN TP<br />
Mean 973 23 59 101 4.0 0.7<br />
STD 260 6.6 16.9 17.7 0.7 0.2<br />
As mentioned, <strong>the</strong> effectiveness of removing manures and suspended solids from an RAS<br />
is extremely critical. Chen et al. (1994) described several unit operation processes and<br />
<strong>the</strong>ir appropriateness for moving solids based upon solids size:<br />
Gravitational separation<br />
• settling tanks (particles > 100 micron)<br />
• hydro-cyclones<br />
• foam fractionators (particles < 30 micron including dissolved solids)<br />
Physical filtration<br />
• granular filter (particles > 60 micron)<br />
• sand filter (wide range including particles < 30 micron)<br />
• bead filter (wide range including particles < 30 micron)<br />
• screening (screen size dictates, typically > 60 micron)<br />
2
In comparison of gravity separation methods , Singh et al (1999) found no difference in<br />
water quality between settling basins and screen filters. Twarowska et al (1997) reported<br />
<strong>the</strong> efficiency of solids removal of a sludge collector and a screen filter as 80% and 41%,<br />
respectively. Settling velocities are key design values for specifying size and depths of<br />
settling basins. Wong and Piedrahita (2000) used a top-loading settling column to<br />
characterize <strong>the</strong> settling properties of <strong>the</strong> solids in <strong>the</strong> discharge water from a commercial<br />
rainbow trout production facility. They found <strong>the</strong> median settling velocity on a massbasis<br />
for <strong>the</strong> settleable solids was 1.7 cm⋅sec -1 .<br />
Tilapia Feces. The physical properties of tilapia manure are distinctly different than say<br />
trout feces in that tilapia produce a feces that is encapsulated in a mucous membrane<br />
resulting in sausage like strands. The fecal strands will float to <strong>the</strong> surface about 30<br />
minutes or so after being defecated due to gas bubbles being formed in <strong>the</strong> feces within<br />
<strong>the</strong> strand and <strong>the</strong>n later sink again as gas bubbles diffuse through <strong>the</strong> membrane strands.<br />
Carbohydrate makeup in tilapia feces will also have an impact on <strong>the</strong> fecal strand density.<br />
In general higher carbohydrate diets and lower fat diets will result in fecal strands that<br />
float more readily than higher energy diets produce; <strong>the</strong> higher carbohydrate levels result<br />
in <strong>the</strong> fish creating a more definitive mucus membrane for <strong>the</strong> fecal strand. Digestibility<br />
also impacts fecal strands with lower digestibility resulting in more floating fecal strands.<br />
Fingerlakes experiences to date are that small changes in nutrient composition can have<br />
dramatic impacts on water quality. Be extremely cautious in switching feed<br />
formulations.<br />
Foaming.<br />
Foaming within an indoor system under high feeding rates (standing biomasses > 80<br />
kg/m 3 ) and percentage feeding rates greater than 1% of body mass per day will<br />
undoubtedly experience foaming. Foam is generally cut back when feed is broadcast as a<br />
result of <strong>the</strong> oil sheen that is on <strong>the</strong> feed pellets. Thus, <strong>the</strong> highest foam levels are seen<br />
after a period of non-feeding. Foam has no major negatives o<strong>the</strong>r than es<strong>the</strong>tic unless <strong>the</strong><br />
foam becomes so thick that feed will not fall through into <strong>the</strong> water and <strong>the</strong> foam<br />
reducing gas transfer, ei<strong>the</strong>r for oxygen addition or CO2 removal.<br />
The Fingerlakes farm had foaming problems that were so severe that that fish could be<br />
held up by <strong>the</strong> foam. The foam once physically removed would last several days before<br />
it would completely collapse. This very thick foam resulted from a high fat diet that<br />
apparently was not effectively digested by <strong>the</strong> fish. As a result an extremely high nutrient<br />
load was placed into <strong>the</strong> water column. Generally, one will not see any foaming if water<br />
daily exchange rates are 20% of system volume per day. Recirculating Aquaculture<br />
Systems (RAS) will generally see quite a bit of foam when water exchanges (actual fresh<br />
water makeup) replace 5% or less of <strong>the</strong>ir water on a daily basis. Foam in <strong>the</strong>se instances<br />
can be reduced by employing foam fractionators, o<strong>the</strong>r active foam removal systems or<br />
ozone (applying 15 g ozone per kg of feed fed is a general rule of thumb that can be<br />
applied).<br />
3
Experiences with Regulatory Agency: NY DEC.<br />
Our regulatory agency in New York is called <strong>the</strong> Department of Environmental<br />
Conservation (DEC). The first farm built by Fingerlakes was an integrated farm with<br />
breeding, fingerling and growout production and located in Freeville, NY (approximately<br />
10 miles from Cornell campus). Target capacity was 250,000 lb/yr of tilapia. This barn<br />
was followed 2 years later by a much larger farm located in Groton, NY (7 miles from<br />
Freeville farm) with a target capacity of 1.2 million lb/yr. Similar waste treatment<br />
schemes were used at both locations. Ponds were constructed to perform primary settling<br />
of manure laden water collected within <strong>the</strong> fish facility. At Freeville, suspended solids<br />
were removed by a rotating micro-screen (90 micron) while at Groton, settling pits were<br />
used that were divided into a primary settling area (1/3 of <strong>the</strong> pit) that was emptied daily<br />
and a secondary settling area that was emptied once per week. Settling criteria was based<br />
upon 1 gpm of flow required 1 ft 2 of bottom pit surface. Both facilities employed <strong>the</strong><br />
Cornell double drain system (15% flow from center bottom drain and 85% of flow from<br />
side wall that is not treated for solids removal, see Figure 2). Characteristics of <strong>the</strong> two<br />
facilities are described in Table 3.<br />
Table 3. Characteristics of primary settling ponds used for commercial applications with<br />
Fingerlakes Aquaculture LLC<br />
Parameter Comments<br />
Site Freeville Groton<br />
Feed fed per day 500 to 700 lb/day 2,000 to 4,000 Groton coming on<br />
line; full capacity<br />
September 2000<br />
System water 100,000 400,000 Includes biofilters,<br />
volume, gallons<br />
Primary Settling 100 ft x 100 ft x 10 150ft x 250 ft x 15<br />
Pond<br />
ft<br />
Secondary Ponds 40 ft x 100 ft x 6ft None; effluent goes<br />
(in series with pond<br />
#1)<br />
to municipal sewer<br />
Discharge from Wetland with Public sewer;<br />
ponds<br />
potential for field regulated by time of<br />
crop application day<br />
TSS from ponds 10 to 20 mg/L TSS 10 to 20 mg/L TSS<br />
4<br />
settling tanks etc<br />
Side slopes approx 1<br />
to 1<br />
Ultimately, an effective disposal method of manure solids held in ponds is to apply <strong>the</strong>m<br />
agronomically for land agriculture and field crops. When applying waste-water and or<br />
slurry directly to <strong>the</strong> land, <strong>the</strong> following recommendation has been made by Chen et al.<br />
(1997):<br />
Both waste water or slurry.<br />
• 150 to 200 m 2 per kg of feed per day (Chen et al., 1997)<br />
Raw sludge or stabilized sludge<br />
• Application according to agronomic rate
NY DEC Interaction.<br />
The owners of Fingerlakes worked pro-actively with <strong>the</strong> NY DEC. Initial meetings were<br />
set up with <strong>the</strong> appropriate officials. In <strong>the</strong> Freeville (first farm), <strong>the</strong> DEC issued a letter<br />
to Fingerlakes declaring that <strong>the</strong> farm was exempt from wastewater regulations since <strong>the</strong><br />
manure captured in <strong>the</strong> settling pond would be agronomically applied to farm land. This<br />
was a key ruling from <strong>the</strong> DEC in our favor. It eliminated any need for Fingerlakes to go<br />
through <strong>the</strong> much more laborious processes generally associated with wastewater<br />
permits. All this was done in writing of course including follow-up notes between<br />
Fingerlakes and <strong>the</strong> NY DEC to clarify <strong>the</strong>ir rulings etc. In NY, <strong>the</strong>re is a distinction<br />
between sludge and manure, with manure being associated with farming practices (more<br />
lenient) and sludge being considered industrial and generally becomes a much more<br />
laborious process to obtain a permit. Be careful not to use sludge if you are actually<br />
talking about manure.<br />
The Groton expansion was a much more complicated procedure in terms of obtaining<br />
permission to build a fish farm. One of <strong>the</strong> major reasons Fingerlakes chose <strong>the</strong> Groton<br />
site was that Groton could provide municipal services of both sewer and water. Village<br />
officials claimed that as long as Fingerlakes performed primary settling (as in settling<br />
ponds)-- <strong>the</strong>n <strong>the</strong>ir wastewater treatment plant could handle <strong>the</strong> additional waste-water<br />
treatment load. The Groton Village was a permitted facility by <strong>the</strong> NY DEC and was<br />
allowed to discharge 600,000 gallons of treated wastewater per day. Groton's average<br />
discharge was approximately 300,000 gallons per day. Fingerlakes anticipated discharge<br />
from <strong>the</strong>ir settling pond approximately 40,000 gallons per day, so it seemed a ra<strong>the</strong>r<br />
trivial increase to <strong>the</strong>ir daily discharge levels.<br />
Unfortunately for Fingerlakes, Groton Village had 3 or 4 days in <strong>the</strong> last several years<br />
where <strong>the</strong>y actually exceeded <strong>the</strong>ir permitted 600,000 gal/day allowance (during<br />
rainstorms). NY DEC used this violation to temporarily prevent Groton from issuing a<br />
building permit to Fingerlakes. After several months of negotiations and several<br />
meetings later, Fingerlakes placed an offer on an alternate building site outside of <strong>the</strong><br />
Village. At this point, <strong>the</strong>re was apparently some "behind <strong>the</strong> scenes" activities between<br />
politicians and legislators--- and <strong>the</strong> Groton Village was allowed to accept <strong>the</strong><br />
Fingerlakes farm as a new industrial customer. This whole process wracked havoc on <strong>the</strong><br />
whole project. It is very complicated in terms of logistics and timing of building a new<br />
plan, but my advice at this point would be <strong>the</strong> obvious one: do not invest in anything<br />
until you have <strong>the</strong> necessary permits in hand (even when <strong>the</strong> municipalities assure you<br />
<strong>the</strong>re will be no problem). In <strong>the</strong> end, <strong>the</strong> NY DEC issued a letter that <strong>the</strong> Groton Village<br />
was not authorized to accept anymore than 40,000 gallons/day of fish farm effluent until<br />
<strong>the</strong> Village had demonstrated that <strong>the</strong>y had eliminated some of <strong>the</strong>ir own unidentified<br />
infiltration problems so that <strong>the</strong>y would not exceed <strong>the</strong>ir permitted discharge levels.<br />
References<br />
Chen, S., Ning, Z., and Malone, R.F. In press. Characterization and digestibility of<br />
aquacultural sludge, Aquacultural Engineering.<br />
5
Chen, S., Coffin, D. E., and Malone, R. F., 1993. Production, characteristics, and<br />
modeling of aquacultural sludge from a recirculating aquacultural system using a<br />
granular media biofilter. Page 16-25 In Wang, J. K. (editor), Techniques for<br />
Modern Aquaculture. Proceedings of an Aquacultural Engineering Conference,<br />
21-23 June 1993., Spokane, Washington. American Society of Agricultural<br />
Engineers, St. Joseph, Michigan. 604pp.<br />
Chen, S., Stechey, D., and Malone, R. F. 1994. Suspended Solids Control in Recirculating<br />
aquacultural systems. Chapter 3 (page 61-100). In Timmons, M. B., and Losordo,<br />
T (Editors), Engineering Design and Management of Aquaculture Water Reuse<br />
Systems. Elsevier Science. 333pp.<br />
Chen, S., Coffin, D. E., and Malone, R. F., 1997. Sludge production and management for<br />
recirculating aquacultural systems. Journal of World Aquaculture Society,<br />
28(4):303-315.<br />
Ning, Z., 1996. Characteristics and Digestibility of Aquacultural Sludge. Master’s <strong>the</strong>sis.<br />
Department of Civil and Environmental Engineering, Louisiana State University,<br />
Baton Rouge, Louisiana, USA.<br />
Singh, S., Ebeling, J., and Wheaton, F., 1999. Water quality trials in four recirculating<br />
system configurations. Aquacultural Engineering, 20(2):75-84.<br />
Twaroska, J.G., Westerman, F.W., and Losordo, T.M., 1997. Water treatment and waste<br />
characterization of an intensive recirculating fish production system.<br />
Aquacultural Engineering, 16(3):133-148.<br />
Wong, K.B. and R.H. Piedrahita. 2000. Settling velocity characterization of aquaculture<br />
solids. Aquacultural Engineering 21: 233-246.<br />
6
O 2<br />
Feed<br />
CO 2<br />
Ammonia<br />
Figure 1. General mass balance on a feeding fish<br />
Figure 2. Cornell Double-Drain system (major flow out of side of tank; drawing supplied<br />
by <strong>the</strong> Freshwater Institute, Shepherdstown, WV)<br />
7<br />
BOD,TSS,<br />
N, P
Michigan's Platte River State Fish Hatchery Case History<br />
A fourteen-year dispute about phosphorous effluent contribution<br />
and its impact on Platte Lake<br />
Introduction<br />
Harry Westers<br />
Aquaculture Bioengineering Corporation<br />
P.O. Box 8<br />
Rives Junction, MI 49277<br />
Since 1928, <strong>the</strong> Michigan Department of Natural Resources has operated a trout rearing station<br />
on Brundage Spring and creek water, tributaries to <strong>the</strong> Platte River, near Honor, Michigan.<br />
In 1969 construction was started on a large, modern fish hatchery to support <strong>the</strong> successful Great<br />
Lakes salmon program.<br />
Production increased from 10,000 kg trout per year to 106, 000 kg coho and chinook salmon.<br />
By <strong>the</strong> early 1980's residents of Platte Lake, located some 17 km downstream from <strong>the</strong> hatchery,<br />
came to <strong>the</strong> Department to express <strong>the</strong>ir concerns about negative impacts <strong>the</strong> new hatchery had<br />
on Platte Lake. They believed that noticeable water quality degradation had occurred,<br />
specifically with respect to water transparencies.<br />
In 1986 litigation was initiated by <strong>the</strong> Platte Lake Improvement Association (PLIA) against <strong>the</strong><br />
Michigan Department of Natural Resources (MDNR).<br />
That same year a preliminary injunction was issued by <strong>the</strong> Court regarding discharges of<br />
phosphorus from <strong>the</strong> hatchery.<br />
The Site<br />
The hatchery is located near Honor, Michigan, in <strong>the</strong> northwest part of <strong>the</strong> Lower Peninsula.<br />
The area is characterized by glacial outwash deposits with extensive groundwater resources.<br />
The facility is situated adjacent to Platte River, 29 river kilometers above Lake Michigan, 17.1<br />
km upstream from Big Platte Lake, <strong>the</strong> disputed body of water (Figure 1).<br />
1
The Hatchery<br />
The hatchery supports <strong>the</strong> Great Lakes salmon program and currently produces 78,000 kg<br />
annually and uses up to 80,000 kg of food. The original production targets were for three<br />
million coho salmon, but were changed to two million to reduce effluent phosphorus load. The<br />
coho salmon are grown to 36/kg (28g/fish). In addition to <strong>the</strong> coho salmon, <strong>the</strong> hatchery<br />
produces five million chinook salmon at 220/kg (4.5g/fish). The site also houses a coho egg<br />
take facility.<br />
The chinook salmon are reared indoors in large concrete raceways while final rearing of <strong>the</strong> coho<br />
salmon occurs outdoors in Burrows rearing ponds, modified from circulation to plug-flow<br />
design, equipped with baffles to make <strong>the</strong> ponds self-cleaning. This has significantly improved<br />
<strong>the</strong> management of solids, contributing to fur<strong>the</strong>r reductions in discharge of phosphorous.<br />
The hatchery operates on three water sources. Brundage Spring delivers water to <strong>the</strong> indoor<br />
rearing tanks at a rate of approximately 4500 lpm (1200 gpm), Brundage Creek provides about<br />
18,000 lpm (5000 gpm) used indoors and out and Platte River allows up to 32,000 lpm (8500<br />
gpm) of water to <strong>the</strong> outdoor raceways. This water is pumped to an elevated water distribution<br />
reservoir to provide <strong>the</strong> required hydrostatic pressure for deliverance through underground<br />
piping. The high quality, stable temperature, spring water can be reused by pumping it up into<br />
<strong>the</strong> distribution reservoir to modify extreme summer river water temperatures.<br />
The hatchery discharges into <strong>the</strong> Platte River after passing through a two hectare (5 acre)<br />
treatment pond.<br />
The River<br />
The Platte River is a very stable river system, receiving abundant groundwater from <strong>the</strong><br />
underlying glacial geology. Its 500 km 2 watershed is approximately 90% underdeveloped. The<br />
river has a moderate natural productivity with phosphorous concentrations typically ranging<br />
from 20 )g/L in winter/spring down to 10 )g/L in late summer/fall. Variations may fluctuate<br />
from 12 to 50 )g/L in May - July to less than 12 )g/L in December (Walker 1998).<br />
The Lake<br />
Big Platte Lake is a 10.6 km 2 (2650 acre) natural, hard water lake with a mean depth of 7.7 m<br />
(25') and a maximum depth of 29 m (95').<br />
Based on mean ranges for total phosphorus, total nitrogen and chlorophyll a, its classification is<br />
oligotrophic. However, a mean Secchi depth of 2.32 m (7.6') places it in <strong>the</strong> eutrophic category<br />
(Table 1). The reduced Secchi depth is associated directly with <strong>the</strong> development of calcium<br />
carbonate (marl) precipitates in <strong>the</strong> lake (King 1999).<br />
3
Table 1. Platte Lake compared to <strong>the</strong> general trophic classification of lakes.<br />
Measured<br />
Parameter<br />
Total P ()g/L)<br />
mean<br />
range<br />
Total N ()g/L)<br />
mean<br />
range<br />
Chlorophyll a<br />
()g/L)<br />
mean<br />
range<br />
Secchi depth (m)<br />
mean<br />
range<br />
Source: King, 1999.<br />
Oligotrophic Mesotropic Eutrophic Platte Lake<br />
Summer 1987<br />
8.0<br />
3.0 - 17.7<br />
661<br />
307 - 1630<br />
1.7<br />
0.3 - 4.5<br />
9.9<br />
5.4 - 28.3<br />
26.7<br />
10.9 - 95.6<br />
753<br />
361 - 1387<br />
4.7<br />
3 - 11<br />
4.2<br />
1.5 - 8.1<br />
Walker (1998) classifies <strong>the</strong> lake as “oligo-mesotropic.”<br />
4<br />
84.4<br />
16 - 386<br />
1875<br />
393 - 6100<br />
14.3<br />
3 - 78<br />
2.45<br />
0.8 - 7<br />
6.5<br />
1 - 12<br />
328<br />
207 - 430<br />
4<br />
2 - 7<br />
2.32<br />
0.3 - 4<br />
Platte Lake has a long history of hypolimnetic oxygen depletion during <strong>the</strong> summer months.<br />
The cause of <strong>the</strong> depletion suggests ei<strong>the</strong>r severe respiration within <strong>the</strong> lake or a significant<br />
amount of groundwater added during <strong>the</strong> summer period. The latter is suspected based on <strong>the</strong><br />
fact that both calcium carbonate and carbon dioxide are significantly supersaturated at all strata<br />
in <strong>the</strong> lake. Fur<strong>the</strong>rmore, based on algae productivity of <strong>the</strong> lake, <strong>the</strong> hypolimnetic dissolved<br />
oxygen depletion is not associated with respiration of algae produced within <strong>the</strong> lake, but,<br />
instead, indicates groundwater throughput (King 1999).<br />
The near constancy of dissolved oxygen concentration during <strong>the</strong> winter suggests that <strong>the</strong>re is<br />
little groundwater moving through <strong>the</strong> lake in <strong>the</strong> winter.<br />
A significant portion of <strong>the</strong> shoreline is taken up by both summer and full-time residences.<br />
The Charge<br />
The lake residents, represented by <strong>the</strong> Platte Lake Improvement Association (PLIA), have in<br />
court depositions stating that “whiting” events caused by marl precipitation did not occur prior<br />
to <strong>the</strong> construction of <strong>the</strong> new hatchery and that transparencies were usually greater than three<br />
meters (10'). Fur<strong>the</strong>rmore, <strong>the</strong>y have stated that symptoms of eutrophication, such as reductions
in crayfish populations, disappearance of sensitive vegetation (bulrushes), reductions in mayfly<br />
hatches, <strong>the</strong> growth of dark, polluted matter on docks and boats, and fishing, have all become<br />
worse because of <strong>the</strong> effects from <strong>the</strong> hatchery.<br />
The Effluent<br />
The initial <strong>National</strong> Pollutant Discharge Elimination System (NPDES) permit issued did not<br />
include limits on phosphorus discharges until 1980. In 1985, <strong>the</strong> PLIA sued <strong>the</strong> Department,<br />
making <strong>the</strong> following points: The draft 1985 NPDES permit level of 636 kg phosphorus<br />
annually is not protective; not all sources of phosphorus related directly or indirectly to <strong>the</strong><br />
hatchery are accounted for, such are <strong>the</strong> salmon weirs, smolt releases and adult salmon migration<br />
and accompanying die-offs in <strong>the</strong> river.<br />
In <strong>the</strong> 1970's a study by Grant (1979) determined that <strong>the</strong> hatchery contributed 1360 kg of<br />
phosphorus annually. It represented 33% of <strong>the</strong> total watershed contribution to <strong>the</strong> lake of 3260<br />
kg annually. By 1990 <strong>the</strong> direct percentage contribution by <strong>the</strong> hatchery was reduced to less<br />
than 5% of <strong>the</strong> annual phosphorus loading to Platte Lake (Walker 1998). The changes in<br />
phosphorus discharge were <strong>the</strong> result of improvements in managing solid waste, reduction of<br />
production by one million coho salmon and by switching to low phosphorus food in 1988. The<br />
new 1998 permit issued by <strong>the</strong> Michigan Department of Environmental Quality restricts <strong>the</strong> use<br />
of water to 166 million liter per day (30,000 gpm) and limits phosphorus discharge to 200 kg per<br />
year with no more than 55 kg in any three months. The discharge of suspended solids is limited<br />
to 1000 kg daily with concentrations not to exceed 4-6 mg/l, depending on total flow.<br />
The Court<br />
In 1988, <strong>the</strong> Court agreed with <strong>the</strong> PLIA that <strong>the</strong> Department was polluting, impairing and<br />
destroying Platte Lake and would continue to do so. The following excerpt is from Judge<br />
Brown's Opinion (1988a):<br />
14) Prior to <strong>the</strong> establishment of <strong>the</strong> salmon program:<br />
a) The waters of Big Platte Lake were clear, objects being distinguished at depths of 10<br />
- 12 feet;...<br />
15) Subsequent to <strong>the</strong> operation of <strong>the</strong> salmon program:<br />
a) The waters of Big Platte Lake have become mucky and obscure;...<br />
The Department must reduce <strong>the</strong> phosphorus loading with <strong>the</strong> intent of maintaining a lake<br />
phosphorus standard of 8 )g/L; feed low phosphorus food (
The Results<br />
Transparencies during <strong>the</strong> warm water period (May to September) have improved from an<br />
average of two meter in <strong>the</strong> 1970's to 3.5 meter in <strong>the</strong> 1990's. However, severe “whiting” events,<br />
with transparencies less than one meter, still occur although less frequently. Maximum<br />
transparencies have increased from an average of 3.5 m in <strong>the</strong> 1970's to 5.0 m and greater in <strong>the</strong><br />
1990's (Whelan 1999).<br />
It is believed by some that <strong>the</strong> reductions in nutrients from <strong>the</strong> hatchery and <strong>the</strong> watershed itself<br />
(cause unknown) have had a measurable effect on <strong>the</strong> lake.<br />
There can be significant correlations between lake phosphorus and transparency because of <strong>the</strong><br />
influence of phosphorus on algae production, which in turn influences pH and calcium<br />
carbonate (marl) formation.<br />
However, <strong>the</strong> lake phosphorus values were only reduced by 9% in spite of <strong>the</strong> overall loading<br />
reduction of 24% in <strong>the</strong> 1990's. In o<strong>the</strong>r words, lake phosphorus concentrations did not exhibit<br />
a proportionate response to external loads. It is believed that internal phosphorus cycling may<br />
be responsible for that, and <strong>the</strong>re are some expectations that this source of phosphorus cycling<br />
will diminish over time. However <strong>the</strong> quantity of phosphorus stored in surface sediments is very<br />
large in relation to <strong>the</strong> quantity stored in <strong>the</strong> water column and in relation to <strong>the</strong> external load.<br />
For instance, data from <strong>the</strong> 1988 core indicate that ± 4000 mg/m 2 of phosphorus is present in <strong>the</strong><br />
top one centimeter of sediment, compared with ± 62 mg/m 2 of storage in <strong>the</strong> water column at an<br />
average concentration of 8 )g/L and with an external loading rate of ± 300 mg/m 2 /yr in 1990-<br />
1996.<br />
Precipitation of marl is commonly accompanied by co-precipitation of phosphorus. Such<br />
phosphorus removal can be an important mechanism to protect marl lakes from eutrophication.<br />
Tables 2 and 3 summarize P loads, average flows, and lake P concentrations from 1990- 1996.<br />
6
Table 2. Summary of average flows and P leads at watershed gauging sites on <strong>the</strong> Platte<br />
River watershed for <strong>the</strong> 1990-1996 period (Walker 1998).<br />
Location Flow<br />
10 6 m 3 /yr<br />
Platte River @ USGS<br />
Sta. (excluding<br />
hatchery load)<br />
P-Load<br />
kg/yr<br />
7<br />
Concentration<br />
)g/L<br />
Error<br />
C.V.<br />
121.1 1565 12.9 4.0%<br />
North Branch 31.3 497 15.9 3.4%<br />
Brundage Creek 12.8 157 12.3 3.5%<br />
Hatchery 1990-1996 - 190 - -<br />
Hatchery 1990-1992 - 316 - -<br />
Hatchery 1993-1996 - 96 - -<br />
Table 3. Summary of P loads and lake concentrations for 1990-1992 and 1993-1996<br />
(Walker 1998).<br />
Period Total P Loads (kg/yr)<br />
Hatchery Non-Hatchery Total<br />
Lake P<br />
)g/L<br />
1990-1992 316 2931 3247 8.5<br />
1993-1996 96 2367 2463 7.7<br />
Reduction 220 565 785 0.8<br />
% Reduction 70 19 24 9<br />
Net loads decreased from 316 kg/yr in 1990-1992 to 96 kg/yr 1993-1996 (
Based on <strong>the</strong> scale of annual and seasonal phosphorus variations in Platte Lake, detection of<br />
changes and comparison with <strong>the</strong> 8 )g/L goal require extra ordinary accurate and precise data.<br />
Few laboratories are equipped to provide a 0.1 )g/L resolution represented in <strong>the</strong> data set<br />
(Walker 1998).<br />
All variables exhibit strong seasonality. The average P concentrations range from 10 )g/L in<br />
November to 6 )g/L in August/September. Also, year-to-year variations in transparencies<br />
between 1990-1996 were controlled largely by climatological factors and by variations in <strong>the</strong><br />
cycling of phosphorus within <strong>the</strong> lake, ra<strong>the</strong>r than by variations in external phosphorus loads.<br />
<strong>Sea</strong>sonal decreases in water transparencies occur as a result of marl precipitation, which occur<br />
naturally in <strong>the</strong>se types of lakes.<br />
Although seasonal variations in transparencies can be strong, <strong>the</strong>y did not correlate with <strong>the</strong><br />
significant year-to-year variations detected in phosphorus during <strong>the</strong> 1990-1996 period.<br />
This indicates that year-to-year variations in average transparency, if present, are too small for<br />
detection in <strong>the</strong> presence of strong seasonal and random variance (Walker, 1998).<br />
The 1990-1996 transparency trend does not confirm that decreasing P trends are positively<br />
correlated with increasing transparency trends.<br />
Generally, at least ten years of data are desired for detecting trends in water quality data (Hirsch<br />
et al. 1992). For shorter records <strong>the</strong>re is a greater risk that an apparent trend is attributed to a<br />
pattern which appears to be a trend, but actually is a random occurrence and <strong>the</strong>re is greater risk<br />
that actual trends will go undetected, particularly if <strong>the</strong>y are small.<br />
If <strong>the</strong> 8 )g/L goal is interpreted as a limit that applies to every sample, every day of <strong>the</strong> month,<br />
<strong>the</strong>n it is not achievable under any hatchery loading scenario without reducing phosphorus loads<br />
from o<strong>the</strong>r sources (Walker 1998).<br />
Conclusion<br />
Calcium carbonate precipitation in marl lakes causes reductions in transparencies as <strong>the</strong> light is<br />
scattered by <strong>the</strong> inorganic calcite particles, ra<strong>the</strong>r than absorption and scattering by algae cells.<br />
Often <strong>the</strong>se events are mistakenly perceived by <strong>the</strong> public as algal blooms. Most likely <strong>the</strong>y<br />
have played a role in awakening among <strong>the</strong> Platte Lake residents concern about <strong>the</strong> lake's water<br />
quality (eutrophication). Although algal photosyn<strong>the</strong>sis may play a role in <strong>the</strong>se events by<br />
increasing <strong>the</strong> pH, <strong>the</strong> algal cells <strong>the</strong>mselves account for a small percentage of <strong>the</strong> total light<br />
extinction in Platte Lake. Its algal biomass typically accounts for but a small portion of this<br />
phenomena. Climatological events drive <strong>the</strong> entire process. For instance, a shallow <strong>the</strong>rmocline<br />
with warmer surface waters would be conducive to increased photosyn<strong>the</strong>sis. For a given solar<br />
condition, <strong>the</strong> average light intensity in <strong>the</strong> mixed, upper, layer increases as <strong>the</strong> <strong>the</strong>rmocline<br />
8
depth decreases.<br />
Improvements in transparencies during <strong>the</strong> recreational season, resulting from reductions in<br />
phosphorus loads over <strong>the</strong> 1990-1996 period are not detectable in <strong>the</strong> presence of climatological<br />
and o<strong>the</strong>r random variations.<br />
Never<strong>the</strong>less, Walker (1998) concludes that over <strong>the</strong> 1975-1996 time frame increases in<br />
transparencies are generally correlated with decreases in hatchery phosphorus loads. However,<br />
clear evidence for this is lacking.<br />
Final Outcome<br />
Finally, after 14 years a consent agreement was filed with <strong>the</strong> Court in March 2000. It addresses<br />
<strong>the</strong> amount of water and phosphorus <strong>the</strong> hatchery can discharge, <strong>the</strong> number of salmon that can<br />
pass <strong>the</strong> lower weir, <strong>the</strong> water quality monitoring required for <strong>the</strong> watershed and <strong>the</strong> hiring of an<br />
implementation coordinator to oversee implementation and compliance with <strong>the</strong> agreement.<br />
The hatchery discharge of phosphorus will be phased down over <strong>the</strong> next six years to 175<br />
pounds per year with no more than 55 pounds for any three-month period.<br />
No more than 20 million gallons per day can be discharged (13,889 gpm).<br />
Also, <strong>the</strong> phosphorus concentration of Platte Lake must not exceed 8 )g/L 95% of <strong>the</strong> time.<br />
All inflows and discharge points will be measured twice per week for total phosphorus,<br />
temperature, suspended solids and flows, and current watershed monitoring will continue until<br />
compliance with <strong>the</strong> final 175-pound phosphorus standard has been demonstrated for five<br />
continuous years.<br />
The phased approach is needed to allow <strong>the</strong> facility to be renovated, a key component of <strong>the</strong><br />
program. Up to 7.5 million dollars have been approved for <strong>the</strong> renovation aimed at designing<br />
state-of-<strong>the</strong>-art effluent controls. The parties feel that this agreement represents a model of how<br />
government can successfully interact with concerned citizens to protect natural resources.<br />
References<br />
Grant, J., 1979. Water quality and phosphorus loading analysis of Platte Lake, 1970-1978.<br />
Water Quality Division, Michigan Department of Natural Resources, Lansing.<br />
Hirsch, R.M., J.R. Slack, and R.A. Smith, 1982. Techniques of trend analysis for monthly water<br />
quality data. Water Resources, Vol 18, no. 1. pp 107-121.<br />
King, D.L., 1999. Memorandum, re. Platte Lake, to T.R. Batterson, Michigan State University,<br />
9
East Lansing.<br />
Walker, W.W., 1998. Analysis of monitoring data from Platte Lake, Michigan. Report prepared<br />
for <strong>the</strong> Michigan Department of Natural Resources, Lansing.<br />
Whelan, G.E., 1999. Managing effluents from an intensive fish culture facility: The Platte River<br />
State Fish Hatchery Case History. In: Addressing concerns for water quality impacts from largescale<br />
Great Lakes aquaculture. Great Lakes Fishery Commission, Ann Arbor, Michigan, pp 43-<br />
47.<br />
10
Perspective on <strong>the</strong> Role of Government, Industry, and<br />
Research in Advancing <strong>the</strong> Environmental<br />
Compatibility and Sustainability of Aquaculture<br />
Introduction<br />
Joseph A. Hankins<br />
Director, The Conservation Fund’s Freshwater Institute<br />
Shepherdstown, West Virginia<br />
Over <strong>the</strong> last half century of aquaculture research and development, most of <strong>the</strong> progress<br />
has been internal to <strong>the</strong> production process, examining culture practices and systems, feeds<br />
and nutrition, species choice and o<strong>the</strong>r husbandry considerations. Generally <strong>the</strong> success of<br />
<strong>the</strong>se efforts has been measured in terms of increased productivity with increased<br />
profitability assumed as a collateral benefit. Over <strong>the</strong> last decade an increased awareness<br />
and urgency has developed regarding certain external factors or constraints involving<br />
industry sustainability and environmental interactions. In some cases <strong>the</strong>se concerns are<br />
driven by <strong>the</strong> aquaculture industry’s recognition that some practices or key production<br />
inputs currently utilized to maintain productivity are no longer assuring future profitability.<br />
In o<strong>the</strong>r cases, a maturing aquaculture industry has found itself increasingly scrutinized by<br />
regulatory and private sectors no longer willing to automatically accept aquaculture as<br />
alternative “green” agriculture.<br />
As <strong>the</strong> practice of agriculture has moved from a way of life to a business, aquaculture,<br />
lagging nearly half a century behind in development, is suffering an intense level of public<br />
scrutiny unknown during <strong>the</strong> early development of traditional agriculture. The<br />
aquaculture industry is currently faced with solving <strong>the</strong> simultaneous problems of<br />
developing economically viable production systems, reducing <strong>the</strong> impact on <strong>the</strong><br />
environment and improving public perception.<br />
Sustainability and Environmental Compatibility<br />
What are we really talking about when we use <strong>the</strong> term sustainability? Depending on <strong>the</strong><br />
context and source it seems to be a code word that is interpreted to mean anything from<br />
organic farming to spiritual naturalism to excessive government regulation. The truth is a<br />
simpler and less controversial idea, sustainability embodies both a mindset and practices<br />
that must meet <strong>the</strong> needs of <strong>the</strong> present without compromising or limiting our capability to<br />
meet <strong>the</strong> needs of <strong>the</strong> future. It’s an urge that most of us understand instinctively and<br />
practice daily in some personal form. Where we’ve gotten into trouble is when we have<br />
attempted to squeeze <strong>the</strong> broad concept of sustainability into a smaller box of<br />
circumstances. Concepts like sustainable development, sustainable agriculture or even<br />
sustainable aquaculture get really tough to define and defend because <strong>the</strong><br />
1
interconnectedness and consequential assessment required for sustainability fails when we<br />
place fences to limit <strong>the</strong> extent of <strong>the</strong> problem.<br />
General evidence seems to support <strong>the</strong> notion that aqua-farmers, like <strong>the</strong>ir terrestrial<br />
colleagues, would support <strong>the</strong> need for production practices that promote sustainable<br />
agriculture but almost assuredly <strong>the</strong>y would have a wide range of opinions about what<br />
approaches are sustainable or desirable. Issues of rural equity, stability, productivity and<br />
sustainability are strongly colored by location, experience and personal circumstance. One<br />
commonly agreed to point is <strong>the</strong> need for continued profitability and preservation of<br />
economic capital, even as production paradigms evolve.<br />
The contemporary vision of sustainability can be seen to have two imperatives, economic<br />
growth and environmental compatibility (Magretta 1997). Sustainable economic<br />
development enables a business to continually upgrade its capability to secure and<br />
maintain a competitive advantage in <strong>the</strong> world economy. Environmental sustainability can<br />
be restated as environmental compatibility but must go beyond <strong>the</strong> simple responsibility of<br />
do no immediate harm to <strong>the</strong> recognition that ecosystem interactions resonate globally and<br />
certainly may have unforeseen consequences.<br />
Complicating our ability to pin down sustainability or environmental compatibility is <strong>the</strong><br />
recognition that our view and definition of <strong>the</strong>se concepts changes with our advancing<br />
technological capability, <strong>the</strong> sophistication of our understanding of environmental ecology<br />
and <strong>the</strong> shifts in social expectations and cultural values over time.<br />
The role of government in support of aquaculture sustainability<br />
Public policies and programs shape <strong>the</strong> environment in which <strong>the</strong> aquaculture industry<br />
operates. The character of this environment or business climate has an immediate impact<br />
on competitiveness and ultimately <strong>the</strong> sustainability of aquaculture as an agribusiness.<br />
Clearly <strong>the</strong> government must find a middle ground between undue constraint on one hand,<br />
and being consistent with <strong>the</strong> public duty to provide a safe food supply and a clean healthy<br />
environment on <strong>the</strong> o<strong>the</strong>r.<br />
While <strong>the</strong> government can and should play a catalytic role in promoting industry<br />
development, it is not <strong>the</strong> specific or direct role of government to guarantee <strong>the</strong> future<br />
success of aquaculture as an industry. The most critical role of government is to create a<br />
positive and stable regulatory and policy framework intended for long-term industry<br />
growth. The larger traditional agriculture industry is rapidly reaching <strong>the</strong> conclusion that<br />
future prospects for growth and profitability depend strategically on sustainability and<br />
environmental compatibility issues (Magretta 1997). The role of government <strong>the</strong>n is to<br />
provide a commonly understood and agreed upon set of rules that supports <strong>the</strong> general<br />
public interest in <strong>the</strong>se issues and provide a level playing field for economic activity.<br />
The killer of business efficiency is uncertainty. In <strong>the</strong> current climate of regulatory<br />
patchwork, <strong>the</strong> aquaculture industry is faced with a regulatory pattern that is<br />
2
unprecedented in <strong>the</strong> growth of a new major agriculture production sector. Ranging from<br />
environmental regulations imposed by <strong>the</strong> local county health department to global trade<br />
barriers based on genetics or food additives, <strong>the</strong> nascent aquaculture industry is spending<br />
too much time deciphering and responding to regulatory code and interpretations of new<br />
policy. With a clearer, more stable set of rules, <strong>the</strong> time and limited financial resources<br />
could be better used in improving production efficiency and environmental compatibility<br />
directly through <strong>the</strong> competitive marketplace.<br />
Government initiatives should be directed toward supporting infrastructure needed by all<br />
sides to provide a better knowledgebase for decision-making and business productivity.<br />
These should include-<br />
• Support a coordinated research and development effort focused on industry<br />
constraints or areas of conflict with public policy<br />
• Accelerate technology transfer of public research to <strong>the</strong> private sector<br />
• Establish a clearly stated and consistent regulatory and policy framework<br />
The role of industry in support of aquaculture sustainability<br />
Various sources have made predictions for <strong>the</strong> future growth of global aquaculture. It<br />
seems to be assumed that such growth will occur as a matter of destiny. However, <strong>the</strong><br />
aquaculture industry must be responsible for seizing <strong>the</strong> opportunities for commercial<br />
development and maintaining its competitiveness in <strong>the</strong> world economy (Anon. 1995).<br />
Catfish farming has a 30-year record of business sustainability (Boyd and Tucker 1995),<br />
<strong>the</strong> trout industry even longer. Yet, clearly, conditions today are very different than even<br />
a decade ago and conditions ten years forward will bring even more changes. Past<br />
performance does not guarantee future success and sustainability does not mean<br />
immutability.<br />
Examination of <strong>the</strong> basic trends supporting <strong>the</strong> predicted growth of global aquaculture<br />
provides some instruction. The commercial aquaculture sector, outside of mainland<br />
China, has been primarily focused on <strong>the</strong> production of high value stocks destined for<br />
markets in <strong>the</strong> industrialized nations (New 1999). Yet much of <strong>the</strong> scope for growth in<br />
global aquaculture production is more closely related to finding a solution to a projected<br />
world shortfall in food protein supply. Conventional commercial aquaculture is<br />
increasingly distanced from <strong>the</strong> issues of world hunger and population growth (Currie<br />
2000) and may be poised to miss one of <strong>the</strong> great economic opportunities in agriculture in<br />
<strong>the</strong> next century.<br />
The aquaculture industry must play a greater part in shaping its own business environment.<br />
The aquaculture industry understands better than most <strong>the</strong> issues of nutrient loadings,<br />
toxicity and physiology, water quality and environmental stewardship. Instead of viewing<br />
effluent regulations as a constraint, <strong>the</strong> aquaculture industry should shape <strong>the</strong>se<br />
regulations into competitive opportunities to utilize waste products as inputs that create<br />
value in o<strong>the</strong>r production systems (Adler, Takeda et al. 1996). In o<strong>the</strong>r agricultural<br />
systems, it has been found that <strong>the</strong>re is substantial economic and environmental<br />
3
justification for an investment into waste processing to reduce distribution costs by<br />
volume reduction and to increase macronutrient concentration in wastes (Gray 1999;<br />
Janzen, McGill et al. 1999), ra<strong>the</strong>r than seek out <strong>the</strong> apparent low cost waste disposal<br />
solution.<br />
The aquaculture industry has a vested interest in gaining access to and maintaining high<br />
quality, clean and productive growing sites. The aquaculture industry should strive to be<br />
perceived as an agent working for clean water and not an industry running away from its<br />
own environmental obligations. In both <strong>the</strong> developing and industrialized world, access to<br />
fresh water supplies will soon become one of <strong>the</strong> most pressing environmental and<br />
economic issues. In <strong>the</strong> long run, aquaculture industry growth depends on expanded<br />
access to water. It may well be that <strong>the</strong> next regulatory issue will not be effluent water<br />
quality but influent water quality as a criteria for culture use and suitability. As a<br />
potentially harmless or even beneficial user of water resources, <strong>the</strong> aquaculture industry<br />
has an opportunity to demonstrate leadership in appropriate development and use of<br />
limited water supplies for <strong>the</strong> production of food products (Jenkins, Wade et al. 1995).<br />
The U.S. and European aquaculture industries, and to some extent <strong>the</strong> general public, has<br />
mixed feelings about intensification of production and <strong>the</strong> appropriate application of highyield<br />
technology to increase productivity (Kilman 1999; Urch 1999). O<strong>the</strong>r sectors of <strong>the</strong><br />
global aquaculture community may have made more pragmatic decisions (Leggett and<br />
Johnson 2000). One can clearly argue that for terrestrial agriculture (Avery 1999; Huber<br />
1999) and specifically for aquaculture (Bergheim, Kristiansen et al. 1993; Summerfelt<br />
1998), that intensification provides <strong>the</strong> only foreseeable solution to meeting <strong>the</strong> at odds<br />
imperatives of conserving natural resources and meeting <strong>the</strong> food production requirements<br />
of a growing global population. Low yield aquaculture will not get us where we need to<br />
go. We simply must get smart enough to create and use <strong>the</strong> tools technology provides in a<br />
sustainable manner (Avery 1999).<br />
The role of research in support of aquaculture sustainability<br />
Public investment in research programs allow science to take a long view and assess <strong>the</strong><br />
implications and requirements to support growth of <strong>the</strong> aquaculture industry domestically<br />
in <strong>the</strong> face of a variety of international and domestic factors. Research can be described<br />
under three specific <strong>the</strong>mes that should be addressed in funded program initiatives.<br />
• Set priorities for near and long term aquaculture research and sustainable aquaculture<br />
development through systems analyses that put biological factors, <strong>the</strong> physical<br />
environment and external input use in perspective.<br />
The issues of production site and water resource scarcity and <strong>the</strong> issue of high capital cost<br />
of aquaculture investment are interrelated. Three factors influence <strong>the</strong> capital cost<br />
required for aquaculture development. First, and most familiar to producers, is <strong>the</strong> cost of<br />
technology to provide intensive or semi-intensive culture systems that are viable our<br />
economy. Second, an increasingly important factor, is <strong>the</strong> cost of infrastructure associated<br />
4
with siting and <strong>the</strong> special equipment or provisions to meet regulatory requirements. The<br />
final factor is <strong>the</strong> cost of capital itself. In most analyses <strong>the</strong> economic variable of largest<br />
importance to successful current or prospective aquaculture businesses is <strong>the</strong> capital cost<br />
of a new venture or expansion. To effectively prioritize, attack and reduce <strong>the</strong>se costs, it<br />
is crucial that we systematically analyze and understand integrated sets of baseline data on<br />
inputs, outputs and costs. In <strong>the</strong> principle economic viability and sustainability are<br />
mutually compatible and in <strong>the</strong> largest sense of sustainability are common objectives.<br />
The best strategy for continued growth and health of <strong>the</strong> industry is to clearly understand<br />
where our current practices have left us and <strong>the</strong>n rapidly and accurately identify those<br />
external factors that will require adaptation in <strong>the</strong> future. The aquaculture research<br />
community should lead an axiomatic shift in aquaculture development from an industry<br />
currently based on <strong>the</strong> opportunistic utilization of natural resources to an industry that is<br />
fundamentally science based and research intensive.<br />
We need increasingly multi-disciplinary approaches to research. We need closer national<br />
and international cooperation that recognizes <strong>the</strong> globalization of aquaculture research<br />
support. We need to work toward <strong>the</strong> calculation of <strong>the</strong> total cost, including <strong>the</strong><br />
environmental and social cost, of food production when analyzing <strong>the</strong> market price of<br />
products produced domestically as well as those produced elsewhere and imported. We<br />
need to find substitutes for key current inputs that will become limiting factors in <strong>the</strong><br />
future. We may need to consider <strong>the</strong> justification and use of production support practices<br />
to promote sustainability.<br />
• Aggressively pursue, develop, document and validate management approaches and<br />
technology that reduce <strong>the</strong> eutrophication impact of aquaculture development while<br />
maintaining or increasing profitability.<br />
The problem of fish farming as a source of nutrification is no different than o<strong>the</strong>r natural<br />
or anthropogenic sources. It could be argued that aquaculture has received more publicity<br />
than its share of <strong>the</strong> total load would indicate. Whe<strong>the</strong>r <strong>the</strong> impact is overstated or to<br />
understand and correct <strong>the</strong> problem, it is clear that <strong>the</strong> charge falls to <strong>the</strong> research and<br />
technology base to resolve <strong>the</strong> issue.<br />
The trend in discharge regulation is now toward a dual system of receiving water waste<br />
load allocation for mass loading control and promulgation of new effluent treatment and<br />
technology guidelines for on-farm source reduction. Under this new regulatory scenario,<br />
aquafarmers will be challenged to adopt best husbandry practices to maximize production<br />
profitability with minimal wastage of feed. While source reduction is <strong>the</strong> appropriate<br />
strategy, <strong>the</strong>re will be no one best diet or technology solution. Contemporary research<br />
indicates that optimal digestible protein to digestible energy ratios will vary under different<br />
conditions, feed intakes and growth stage of <strong>the</strong> fish. Nitrogen excretion rates will vary<br />
with feeding rates and meal frequency. Nutrient digestibility will be affected by factors not<br />
related to diet such as feeding rate, fish size, salinity and temperature.<br />
5
We need new approaches to feeding practices that will contribute to better feed utilization<br />
and accelerated growth rates. We need better simulation modeling of <strong>the</strong> physiological<br />
state of <strong>the</strong> fish through to <strong>the</strong> modeling of wide-scale effects of farms on water quality.<br />
We need <strong>the</strong> development of decision support systems for aquaculture siting which would<br />
incorporate a geographic data base of relevant hydrographic and o<strong>the</strong>r environmental<br />
information, <strong>the</strong> characteristics of <strong>the</strong> particular type of production system, and natural<br />
resource factors such as water resource availability, spatial topography and soils, and<br />
receiving water quality. We need to consider diet manipulation to alter manure nutrient or<br />
physical characteristics that heighten isolation and removal. We need to develop<br />
production systems that enhance <strong>the</strong> internal cycling and reincorporation of nutrients and<br />
energy into end products. We need to continue to develop production systems that<br />
minimize <strong>the</strong> use of natural resources and non-renewables.<br />
• Reduce <strong>the</strong> impact or interaction of aquaculture with external biota through more<br />
biosecure production systems.<br />
One of <strong>the</strong> most emotionally charged and costly problems facing <strong>the</strong> industry is <strong>the</strong><br />
product damage and attrition caused by predation. Fish eating birds in pond culture,<br />
marine mammals attacking sea cages and even invertebrates foraging on shellfish culture<br />
beds cause millions of dollars in direct product losses and indirectly create <strong>the</strong> potential for<br />
disease transfer and escapement.<br />
Ano<strong>the</strong>r strongly polarizing issue is <strong>the</strong> potential genetic interaction of domesticated<br />
stocks with wild stocks. With <strong>the</strong> recent introduction of bio-engineered or genetically<br />
manipulated cultured products, <strong>the</strong> sense of concern is fur<strong>the</strong>r heightened at <strong>the</strong> same time<br />
that farmers are seeing <strong>the</strong> potential for vastly improved livestock characteristics.<br />
A third interaction field is <strong>the</strong> potential for disease transmission in ei<strong>the</strong>r direction between<br />
aquaculture livestock and <strong>the</strong> natural environment. While this problem typically does not<br />
have <strong>the</strong> emotional charge of <strong>the</strong> two previous issues, <strong>the</strong> recent coverage of whirling<br />
disease incidence in “wild” salmonid stocks in <strong>the</strong> west, <strong>the</strong> threat posed by ISA virus for<br />
Atlantic salmon in <strong>the</strong> east and <strong>the</strong> concern over <strong>the</strong> zoonotic potential of Streptococcus<br />
iniae in tilapia, catfish and striped bass indicates an easily aroused public interest. The<br />
aquaculture industry has generally responded to <strong>the</strong>se concerns in a reactionary ra<strong>the</strong>r than<br />
preventative basis. If aquaculture is to become a widely valued activity, and not just<br />
tolerated, <strong>the</strong>n <strong>the</strong>se concerns must be addressed and planned for ecologically, socially and<br />
economically.<br />
We need to develop highly biosecure aquaculture production systems to maintain <strong>the</strong><br />
integrity of both natural systems as well as <strong>the</strong> cultured stocks. We need research on<br />
better physical or behavioral exclusion barriers, creating alternative habitat for predators,<br />
and a clearer understanding of disease epidemiology. We need production systems that<br />
are equally as sophisticated as <strong>the</strong> organisms being selected and manipulated to grow in<br />
<strong>the</strong>m. In <strong>the</strong> face of declining approval or economic utilization of <strong>the</strong>raputants, we need<br />
to isolate high-density livestock systems from <strong>the</strong> economic and biological threats of<br />
6
disease. We need to create environmentally secure production systems that reduce <strong>the</strong><br />
risk of contamination that may threaten livestock or <strong>the</strong> safety of <strong>the</strong> final consumer.<br />
Summary<br />
In contrast to more familiar areas of aquaculture research or business activity (such as<br />
nutrition, reproduction, product quality, business planning) sustainability and<br />
environmental compatibility have no dedicated or easily defined base. However it is<br />
possible to address well-recognized issues, of economically critical importance in <strong>the</strong> near<br />
term, and with substantial scope for research opportunity. Many in <strong>the</strong> industry would not<br />
make a distinction between sustainability and environmental compatibility. Even recent<br />
texts on sustainable agriculture suggest that aquaculture is sustainable just by its practice<br />
alone. Recent experience provides evidence to <strong>the</strong> contrary. Aquaculture growth has<br />
been historically driven by product demand and <strong>the</strong>n by production profits. To continue<br />
development, it is increasingly clear that we must move past solely production profit<br />
criteria and toward sustainable aquaculture concepts<br />
Acknowledgments<br />
This material is based upon work supported by <strong>the</strong> USDA, Agriculture Research Service,<br />
under Agreement No. 59-1931-8-038. Any opinions, findings, conclusions, or<br />
recommendations expressed in this publication are those of <strong>the</strong> author and do not<br />
necessarily reflect <strong>the</strong> view of <strong>the</strong> USDA or o<strong>the</strong>r funding agency.<br />
References<br />
Adler, P. R., F. Takeda, et al. 1996. “Utilizing byproducts to enhance aquaculture<br />
sustainability.” World Aquaculture 27(2): 24-26.<br />
Anon. 1995. "Federal aquaculture development strategy." Ottawa, Canada: Department of<br />
Fisheries and Oceans.<br />
Avery, D. T. 1999. "The Moral Imperative of Biotechnology." American Outlook.<br />
Summer:13-14.<br />
Avery, D. T. 1999. "We Are All Environmentalists Now." American Outlook. Summer:<br />
35-37.<br />
Bergheim, A., R. Kristiansen, et al. 1993. "Treatment and utilization of sludge from<br />
landbased farms for salmon." Techniques for Modern Aquaculture, Spokane, WA, ASAE<br />
Boyd, C. E. and C. S. Tucker. 1995. “Sustainability of channel catfish farming.” World<br />
Aquaculture 26(3):45-53.<br />
7
Currie, D. J. 2000. “Aquaculture: Opportunity to benefit mankind.” World Aquaculture<br />
31(1) 44-49.<br />
Gray, K. 1999. "Pelletizing Venture Turning Poultry Litter into Fertilizer Products."<br />
BioCycle. 40:49-50.<br />
Huber, P. "Ecological Eugenics." 1999. The Wall Street Journal. New York. December<br />
20:A23.<br />
Janzen, R. A., W. B. McGill, et al. 1999. “Manure as a Resource -- Ecological and<br />
Economic Considerations in Balance.” American Society of Agricultural Engineers. 42(5)<br />
1261-1273.<br />
Jenkins, M. R., E. M. Wade, et al. 1995. Economic analysis of non-traditional water<br />
resources for aquaculture in West Virginia. Shepherdstown, West Virginia. The<br />
Conservation Fund Freshwater Institute.<br />
Kilman, S. 1999. "Food Fright Biotech Scare Sweeps Europe, and Companies Wonder if<br />
U.S. is next." Wall Street Journal. New York. October 7:P1.<br />
Leggett, K. and I. Johnson. 1999. "China bets <strong>the</strong> farm on promise (and glory) of genetic<br />
engineering." Wall Street Journal. New York. March 29:A17.<br />
Magretta, J. 1997. "Growth through Global Sustainability-An Interview with Monsanto's<br />
CEO, Robert B. Shapiro." Harvard Business Review. Jan-Feb: 79-88.<br />
New, M. B. 1999. “Global Aquaculture: Current trends and challenges for <strong>the</strong> 21st<br />
century.” World Aquaculture 30(1):8-13.<br />
Urch, M. 1999. "The fish farm Frankenstein." <strong>Sea</strong>food International. 14:5.<br />
Summerfelt, S.T. 1998. “An integrated approach to aquaculture waste management in<br />
flowing water tank culture systems” In: The Second International Conference on<br />
Recirculating Aquaculture, G.S. Libey and M.B. Timmons (eds.), Virginia Polytechnic<br />
Institute and State University, Roanoke, VA, July 16-19:87-97.<br />
8
Introduction<br />
Implications of Total Maximum Daily<br />
Load (TMDLs) on Aquaculture<br />
Charles H. Martin<br />
Environmental Engineer Consultant, Office of Water Quality Assessments,<br />
Virginia Department of Environmental Quality<br />
Total Maximum Daily Loads or TMDLs are required by §303(d) of <strong>the</strong> Clean Water Act<br />
(CWA) and <strong>the</strong> §4.01 of Virginia’s State Water Control Law. The state statute is known as<br />
<strong>the</strong> Water Quality Monitoring, Information and Restoration Act. The first requirement of<br />
§303(d) of <strong>the</strong> CWA is that <strong>the</strong> states identify and develop a list of impaired waters (those not<br />
meeting water quality standards). The second requirement is that <strong>the</strong> states develop TMDLs<br />
for waters on <strong>the</strong> 303(d) lists. As with most new programs, <strong>the</strong> TMDL process has produced<br />
a number of issues that impact o<strong>the</strong>r water quality management programs such as water<br />
quality standards, monitoring, and VPDES permits.<br />
Waters Needing TMDLs<br />
Only waters that violate Virginia’s Water Quality Standards are placed on <strong>the</strong> 303(d) List for<br />
TMDL development. These are waters that have documented long term quality problems<br />
based on chemical and biological water quality data. DEQ does not list waters for TMDL<br />
development based on temporary or transient violations of <strong>the</strong> standards. Violations of <strong>the</strong><br />
standards are determined by <strong>the</strong> biennial analysis of <strong>the</strong> previous five years of chemical and<br />
biological water quality data from about 1,500 monitoring stations operated by DEQ, U.S.<br />
Geological Survey, and Tennessee Valley Authority (TVA).<br />
TMDLs are special studies that identify each significant source of pollution, calculate <strong>the</strong><br />
amount of pollutant contributed by each source, and quantify <strong>the</strong> reductions needed to attain<br />
water quality standards. TMDLs are pollutant specific and waters impaired for more than one<br />
pollutant need a TMDL developed for each pollutant. Every TMDL has a point source and<br />
nonpoint source component plus a margin of safety to account for uncertainties in <strong>the</strong> TMDL<br />
analysis. The point source or nonpoint source component may be insignificant in a particular<br />
TMDL, but both components must be addressed.<br />
Virginia’s 1996 and 1998 303(d) TMDL Priority List identified streams immediately<br />
downstream of 6 fish farms as impaired due to degradation of <strong>the</strong> benthic communities. A<br />
special study funded by DEQ identified total suspended solids as <strong>the</strong> cause of <strong>the</strong> impairment.<br />
The fish farms were suspected as a significant source of <strong>the</strong> impairment. DEQ has contracted<br />
with <strong>the</strong> Virginia Water Resources Research Center to develop TMDLs for <strong>the</strong>se impaired<br />
1
stream segments. These 6 TMDLs are scheduled to be completed and submitted to EPA by<br />
May 1, 2002.<br />
These will be <strong>the</strong> first group of TMDLs developed in Virginia addressing benthic community<br />
degradation. The benthic TMDLs present special challenges in determining <strong>the</strong> cause and<br />
effect relationships between <strong>the</strong> pollutant(s) and <strong>the</strong> bottom dwelling aquatic life.<br />
Rapid Changes in TMDL Process<br />
EPA proposed on August 23, 1999, significant modifications to <strong>the</strong> TMDL regulation with<br />
associated revisions to <strong>the</strong> NPDES and <strong>the</strong> Water Quality Standards program regulations.<br />
Recently, EPA announced that <strong>the</strong> final 303(d) rules will be issued in late June or July.<br />
Apparently, EPA will proceed with an expanded TMDL program that will broaden federal<br />
authority and make <strong>the</strong> TMDL a primary water quality management program instead of just<br />
one part of <strong>the</strong> process. One of <strong>the</strong> major impacts to <strong>the</strong> TMDL regulation revisions is <strong>the</strong><br />
requirement that an implementation plan must be submitted to EPA as a part of each TMDL.<br />
2
The NOAA/DOC Aquaculture Initiative and<br />
Policy and Its Implication for<br />
Recirculation Systems<br />
Jim McVey<br />
<strong>National</strong> <strong>Sea</strong> Grant Program<br />
Silver Spring, MD<br />
Background. NOAA's and <strong>the</strong> Department of Commerce's primary focus for Aquaculture<br />
has been through programs in <strong>the</strong> <strong>National</strong> <strong>Sea</strong> Grant College Program (NSGCP) in <strong>the</strong><br />
Office of Oceanic and Atmospheric Research (OAR) and The <strong>National</strong> Marine Fisheries<br />
Service (NMFS). Many aquaculture businesses dealing with many species have benefitted<br />
from NOAA research and extension activities. The <strong>National</strong> Marine Fisheries Service,<br />
originally <strong>the</strong> U.S. Fish and Fisheries Commission released billions of marine fish larvae in <strong>the</strong><br />
late 1800's and it's successor, <strong>the</strong> Bureau of Commercial Fisheries , that became NMFS,<br />
contributed more technology and information base for <strong>the</strong> development of marine aquaculture<br />
or mariculture. The NMFS presently has two research laboratories devoted to aquaculture<br />
research at Manchester Washington and Milford, Connecticut. The NMFS also conducts<br />
research under Saltonstall/Kennedy (SK) grants and provides economic assistance through<br />
<strong>the</strong> Fisheries Finance Program. The <strong>National</strong> <strong>Sea</strong> Grant College Program, created in 1968,<br />
has provided financial support for mariculture research to <strong>the</strong> academic community since it's<br />
inception. <strong>Sea</strong> Grant research, education and outreach programs, in 29 coastal and Great<br />
Lakes states, have contributed trained scientists, new technology and industry partnerships<br />
that have provided a very strong information and resource base for <strong>the</strong> present national<br />
marine aquaculture initiative. <strong>Sea</strong> Grant considers <strong>the</strong> Great Lakes and <strong>the</strong> species in <strong>the</strong>m<br />
as topics related to its mandate. The state programs conduct in-state competitions for<br />
aquaculture related projects and support over 35 extension agents that deal, in some degree,<br />
with aquaculture issues. <strong>Sea</strong> Grant supports a <strong>National</strong> Aquaculture Specialist in <strong>the</strong><br />
<strong>National</strong> Office, national competitions on aquaculture topics, a <strong>National</strong> Depository for <strong>the</strong><br />
archiving and distribution of research and extension publications, a significant portion of <strong>the</strong><br />
AQUANIC electronic information center for aquaculture, and national and state web pages<br />
that include aquaculture information.<br />
A 1980 Memorandum of Understanding (MOU) between <strong>the</strong> Departments of<br />
Agriculture(USDA) Commerce (DOC) and Interior (DOI), defined aquaculture as A<strong>the</strong><br />
propagation and rearing of aquatic species in controlled or selected environment@. Pursuant<br />
to this MOU, DOC, through NOAA's <strong>National</strong> Marine Fisheries Service and <strong>the</strong> <strong>National</strong> <strong>Sea</strong><br />
Grant College Program, carried out aquaculture research and development on marine,<br />
estuarine, and anadromous species. This emphasis remains until this day. Work on<br />
anadromous species has been coordinated with DOI and USDA. The <strong>National</strong> <strong>Sea</strong> Grant<br />
College Program has coordinated its extension component with USDA in most of <strong>the</strong> coastal<br />
and Great Lakes states. Subsequent to <strong>the</strong> establishment of this MOU, <strong>the</strong> Fisheries Finance<br />
Program, administered by NMFS, and <strong>the</strong> Coastal Zone Management Act (CZMA),<br />
1
administered by NOAA's <strong>National</strong> Ocean Service (NOS), were amended to include<br />
comprehensive planning, conservation and management of aquaculture facilities within <strong>the</strong><br />
coastal zone.<br />
In 1998, NOAA developed its own aquaculture policy, aligned with <strong>the</strong> <strong>National</strong> Aquaculture<br />
Development plan, but has included aquaculture in its Strategic Plan since 1995. <strong>Sea</strong> Grant<br />
has had its own aquaculture plan since 1983, and it is aligned with <strong>the</strong> <strong>National</strong> Aquaculture<br />
Plan. NOAA created a Steering Committee for aquaculture in 1998, which soon expanded<br />
to a NOAA/DOC Aquaculture Steering Committee in order to include all <strong>the</strong> offices of<br />
NOAA and DOC that are involved in aquaculture research and regulation. This committee<br />
consists of members from NSGCP, NMFS, NOS, <strong>National</strong> Environmental Satellite Data and<br />
Information Service (NESDIS), Office of Sustainable Development, NOAA's General<br />
Consul's Office, and DOC's Office of Science and Technology Policy, <strong>National</strong> Institutes of<br />
Standards and Technology(NIST), Economic Development Administration (EDA), Minority<br />
Business Development Administration (MBDA), and <strong>the</strong> <strong>National</strong> Trade Office. The object<br />
of uniting this broad spectrum of agencies in <strong>the</strong> committee was to bring all <strong>the</strong> resource of<br />
<strong>the</strong> Department of Commerce to focus on <strong>the</strong> development of aquaculture in <strong>the</strong> US. This<br />
Committee, through a series of workshops held at professional and scientific meetings,<br />
developed a NOAA/DOC Aquaculture Policy that was signed by Secretary of Commerce<br />
Daley on August 10, 1999. This was presented at a national workshop to a group of federal,<br />
state and academic scientists, industry and NGO's at a workshop held from August 11-12,<br />
1999. In addition to bringing <strong>the</strong> policy document out to <strong>the</strong> participants several breakout<br />
sessions were held for regional participants to start to develop regional plans for <strong>the</strong><br />
implementation of <strong>the</strong> policy.<br />
During <strong>the</strong> development of this policy <strong>the</strong> Build Sustainable Fisheries Team budgeted for a<br />
<strong>National</strong> Aquaculture Initiative for FY-99 and FY-2000. The NSGCP held a national<br />
competition for aquaculture topics in FY-99 and used <strong>the</strong> NOAA Steering Committee and<br />
outside academic and industry scientists to review <strong>the</strong> proposals and select <strong>the</strong> most<br />
meritorious. Over 175 pre-proposals were received for <strong>the</strong> low level of $800K that was<br />
available and 32 full proposals were solicited from <strong>the</strong> pre-proposal selection process.<br />
Because so many excellent proposals were received NOAA decided to draw upon FY-2000<br />
funds and funded a total of $1.6 million over <strong>the</strong> two fiscal year budget years. In FY-2000<br />
<strong>the</strong>re has been an additional call for proposals for $600K of available funds but this call was<br />
primarily to address <strong>the</strong> regulatory framework, use mapping and codes of conduct for <strong>the</strong><br />
industry in order to help set <strong>the</strong> regulatory and permit framework for advancing US<br />
aquaculture. Additional money was also set aside in FY-2000 for <strong>the</strong> establishment of a<br />
Marine Aquaculture Information Service through <strong>the</strong> NOAA Central Library and for NMFS<br />
and NOS participation in improving <strong>the</strong> regulatory framework , development of a code of<br />
conduct for DOC and <strong>the</strong> aquaculture industry, and identifying appropriate zones for coastal<br />
aquaculture.<br />
2
Future Directions for <strong>the</strong> NOAA/DOC Aquaculture Initiative.<br />
The NOAA/DOC Steering Committee is working through <strong>the</strong> NOAA budget process to ramp<br />
up support for <strong>the</strong> aquaculture initiative in addition to that available for FY-2000. Budget<br />
increases are being planned for FY-2001 and <strong>the</strong>n again in FY-2002. Also, within <strong>the</strong><br />
<strong>National</strong> Marine Fisheries Service <strong>the</strong>re is a proposal to increase <strong>the</strong> Fishery Loan Program<br />
to expand <strong>the</strong> eligibility for <strong>the</strong> nearly $30 million dollars presently available for aquaculture<br />
and fisheries in that program. We expect to increase <strong>the</strong> in-house research funds for<br />
aquaculture in addition to expanding <strong>the</strong> funds available for extramural programs like <strong>Sea</strong><br />
Grant. We are working with <strong>the</strong> Advanced Technology Program at NIST to increase <strong>the</strong>ir<br />
awareness of <strong>the</strong> potential for new technologies to increase US competitiveness in<br />
aquaculture production and we are working through <strong>the</strong> Minority Business Development<br />
Administration to increase <strong>the</strong> participation of minorities in <strong>the</strong> aquaculture industry through<br />
<strong>the</strong>ir programming.<br />
We are also seeking a one-time, larger increment for funding to bring <strong>the</strong> US aquaculture<br />
effort in par with our international competition. We are doing this through a variety of venues<br />
and processes and we have been working with USDA to try to develop a united approach to<br />
this issue. The revised <strong>National</strong> Aquaculture Plan, being developed through <strong>the</strong> Joint Sub-<br />
Committee on Aquaculture, will be <strong>the</strong> basis for this larger effort.<br />
The Department of Commerce Aquaculture Policy.<br />
The Department of Commerce Aquaculture Policy is a two page document with <strong>the</strong> first page<br />
being <strong>the</strong> policy itself and <strong>the</strong> second page being a basic implementation plan for <strong>the</strong> policy.<br />
The Policy is as follows:<br />
The NOAA/DOC Aquaculture Policy<br />
Vision for U.S. Aquaculture: To assist in <strong>the</strong> development of a highly competitive,<br />
sustainable aquaculture industry in <strong>the</strong> United States that will meet growing consumer<br />
demand for aquatic foods and products that are of high quality, safe, competitively priced and<br />
are produced in an environmentally responsible manner with maximum opportunity for<br />
profitability in all sectors of <strong>the</strong> industry.<br />
DOC Aquaculture Mission: A mission of <strong>the</strong> Department of Commerce (DOC) is to create<br />
sustainable economic opportunities in aquaculture in a manner that is environmentally sound<br />
and consistent with applicable laws and Administration policy. This mission complements and<br />
is an integral part of <strong>the</strong> Department's effort to restore and maintain sustainable wild stock<br />
fisheries in order to maximize <strong>the</strong> benefits of U.S. coastal resources for its citizens.<br />
Aquaculture in <strong>the</strong> United States can make major contributions to <strong>the</strong> local, regional, and<br />
national economies by providing employment in a new and diverse industry and by creating<br />
business opportunities both here and abroad. The United States can lead <strong>the</strong> world in <strong>the</strong><br />
development of aquaculture technologies and advance international guidelines for <strong>the</strong> industry<br />
in order to maintain a healthy environment.<br />
3
Definition: Aquaculture is defined as <strong>the</strong> propagation and rearing of aquatic organisms in<br />
controlled or selected aquatic environments for any commercial, recreational, or public<br />
purpose.<br />
DOC Aquaculture Objectives: The DOC and its agencies, working in partnership with<br />
USDA, DOI, o<strong>the</strong>r Federal agencies, state, local, and tribal governments, environmental<br />
organizations, industry, academia, and o<strong>the</strong>r stakeholders at <strong>the</strong> national and regional levels<br />
will create a business climate and technological base for industry to develop environmentally<br />
sound aquaculture. The specific objectives by <strong>the</strong> year 2025 are to:<br />
I. Increase <strong>the</strong> value of domestic aquaculture production from <strong>the</strong> present $900<br />
million annually to $5 billion, which will help offset <strong>the</strong> $6-billion annual U.S. trade<br />
deficit in seafood.<br />
II. Increase <strong>the</strong> number of jobs in aquaculture from <strong>the</strong> present estimate of 180,000<br />
to 600,000.<br />
III. Develop aquaculture technologies and methods both to improve production and<br />
safeguard <strong>the</strong> environment, emphasizing where possible, those technologies that<br />
employ pollution prevention ra<strong>the</strong>r than pollution control techniques.<br />
IV. Develop a code of conduct for responsible aquaculture by <strong>the</strong> year 2002 and have<br />
100 percent compliance with <strong>the</strong> code in Federal waters.<br />
V. Double <strong>the</strong> value of non-food products and services produced by aquaculture in<br />
order to increase industry diversification.<br />
VI. Enhance depleted wild fish stocks through aquaculture, <strong>the</strong>reby increasing <strong>the</strong><br />
value of both commercial and recreational landings and improving <strong>the</strong> health of<br />
our aquatic resources.<br />
VII. Increase exports of U.S. aquaculture goods and services from <strong>the</strong> present value of<br />
$500 million annually to $2.5 billion.<br />
The implementation actions for this policy are as follows:<br />
Policy Implementation: To achieve <strong>the</strong>se objectives, <strong>the</strong> Department of Commerce<br />
and its agencies, working in partnership with USDA, DOI, o<strong>the</strong>r Federal agencies, state,<br />
local, and tribal governments, environmental organizations, industry, academia, and o<strong>the</strong>r<br />
stakeholders at <strong>the</strong> national and regional levels will:<br />
’ Develop a set of aquaculture guidelines for DOC aquaculture activities by <strong>the</strong> end<br />
of <strong>the</strong> year 2000 and ensure that all subsequent DOC activities conform to <strong>the</strong>se<br />
guidelines.<br />
4
’ Conduct research and help develop guidelines for an environmentally sound and<br />
sustainable aquaculture industry and promote domestic and international<br />
compliance with <strong>the</strong> guidelines.<br />
’ Consistent with <strong>the</strong>se guidelines, conduct basic and applied research to<br />
domesticate additional species, giving preference to high-value species and to<br />
those that are least likely to create problems for <strong>the</strong> environment.<br />
’ Deliver U.S. government aquaculture services, assistance, and research to state<br />
and local governments and industry in a comprehensive and coordinated manner.<br />
’ Hold national and regional meetings with aquaculture constituents to inventory<br />
present resources and issues and set priorities for <strong>the</strong> future<br />
’ Hold national and regional meetings with aquaculture constituents to inventory<br />
present resources and issues and set priorities for <strong>the</strong> future<br />
’ Develop an efficient and transparent permitting process for aquaculture.<br />
’ Accelerate <strong>the</strong> implementation of new aquaculture production methods by<br />
developing both pilot scale and demonstration projects where necessary.<br />
’ Develop effective enhancement strategies, where appropriate, for aquatic species<br />
to help wild stock fisheries recover and to provide additional recreational<br />
opportunities.<br />
’ Integrate aquaculture development with wild fish stock management and<br />
environmental stewardship to maximize <strong>the</strong> value of our aquatic resources for <strong>the</strong><br />
benefit of <strong>the</strong> nation.<br />
’ Minimize <strong>the</strong> adverse impacts of aquaculture on protected species through proper<br />
design and siting of facilities and <strong>the</strong> application of appropriate deterrent<br />
technology.<br />
’ Provide financial, marketing, and trade assistance to <strong>the</strong> aquaculture industry.<br />
’ Provide extension, training, and education programs to ensure a competitive, safe<br />
industry.<br />
5
The DOC and NOAA Aquaculture Efforts and Implications for Recirculation System<br />
Technology.<br />
NOAA's 1998 Aquaculture Policy document specifically identified two areas as high priority<br />
for involvement by NOAA <strong>the</strong>se are: AOpen ocean aquaculture and closed system (or urban)<br />
aquaculture.@ The Build Sustainable Fisheries budget process has likewise identified <strong>the</strong>se<br />
areas along with enhancement of marine fisheries for increasing commercial and recreational<br />
fisheries. The concept here is that, properly conducted, <strong>the</strong>se technologies are more<br />
environmentally sustainable and acceptable than some o<strong>the</strong>r alternatives. There have been<br />
recent discussions on <strong>the</strong> development of Urban Aquaculture, which would place recirculation<br />
production facilities in major cities where <strong>the</strong> markets are available and economic incentives<br />
are available for creating jobs and products. The Minority Business Administration is<br />
particularly interested in this concept and is working with NMFS and <strong>Sea</strong> Grant to advance<br />
this work.<br />
NOAA, through both <strong>the</strong> NSGCP and NMFS has already done significant research on water<br />
recirculation systems at <strong>the</strong> NMFS Galveston Laboratory during <strong>the</strong> 1970's and through many<br />
university laboratories around <strong>the</strong> country. The NMFS is planning on increasing <strong>the</strong>ir<br />
research capabilities in this area at selected laboratories and <strong>the</strong> NSGCP will continue to<br />
support research and extension in this technology through both state and national<br />
competitions. Specific wording for research on recirculation systems was contained in <strong>the</strong><br />
FY-99 <strong>Sea</strong> Grant competition and <strong>the</strong> new competition in FY-2001 will contain language<br />
calling for research on that topic.<br />
Recirculation systems are presently utilized for <strong>the</strong> culture and maintenance of high value<br />
products and uses such as ornamental species, hatcheries, juvenile production, and for some<br />
food species such as Tilapia and Hybrid Striped Bass. However, <strong>the</strong> culture of most marine<br />
food fish remains marginal in economic terms and considerable more research is needed to<br />
define <strong>the</strong> optimum systems and procedures for <strong>the</strong> culture of marine species.<br />
There has been much work on <strong>the</strong> individual components of recirculating systems but we have<br />
yet to have a standardized marine recirculating system with known performance<br />
characteristics for a range of economically important species. Until we have that information,<br />
which should include economic analyses for specific systems and management techniques, <strong>the</strong><br />
industry will not be able to attain <strong>the</strong> loans and financing <strong>the</strong>y need to move ahead. NOAA<br />
and <strong>the</strong> DOC hopes to support <strong>the</strong> type of research that will provide this information in order<br />
to expand this industry sector. A new Department of Commerce call for technology<br />
proposals will occur in January or February of 2001 for funding in <strong>the</strong> summer of 2001.<br />
6
Information sources for aquaculture in <strong>the</strong> NOAA/DOC system.<br />
<strong>National</strong> <strong>Sea</strong> Grant Homepage: www.nsgo.seagrant.org/research/rfp/index.html<br />
<strong>National</strong> <strong>Sea</strong> Grant Depository Homepage: http://nsgd.gso.uri.edu/loan.html<br />
<strong>National</strong> Marine Fisheries Service Homepage: www.nmfs.gov<br />
Check NE (Milford Lab) and NW(Manchester Lab) Fisheries Centers<br />
NOAA Central Library Homepage: www.lib.noaa.gov<br />
MBDA Homepage: www.mbda.gov/virtual_centers/aquaculture/index.html<br />
AQUANIC: www.ansc.purdue.edu/aquanic<br />
References:<br />
NOAA/DOC Aquaculture Policy, U.S. Department of Commerce, August 10, 1999,<br />
Washington, DC.<br />
NOAA Aquaculture Policy, U.S. Department of Commerce, <strong>National</strong> Oceanic and<br />
Atmospheric Administration, <strong>National</strong> Marine Fisheries Service, Office of Sustainable<br />
Development, Washington, DC, 1998.<br />
<strong>Sea</strong> Grant Aquaculture Plan 1983-1987, Marine Information Service, <strong>Sea</strong> Grant College<br />
Program, Texas A&M University, College Station, Texas 77843.<br />
Aquaculture Research and Development: Strategic/Implementation Plan, Prepared for<br />
Committee on Health Safety and Food, <strong>National</strong> Science and Technology Council. December<br />
1994.<br />
<strong>National</strong> Marine Aquaculture Initiative, Federal Register Notice, Docket Number 00309067-<br />
0067-01, RIN 0648-ZA82, March 27, 2000.<br />
7
Abstract<br />
Olfactory Sensitivity of <strong>the</strong> Nile Tilapia,<br />
Oreochromis Niloticus, to Amino Acids<br />
M. Fares*, T. Shoji*', R. El-S. Saleh*2,<br />
M. A. Sobeih*2, Z. H. Ahmed*2 and H.Ueda*<br />
*Toya Lake Station for Environmental Biology, Faculty of Fisheries,<br />
Hokkaido University, Abuta 049-57, Japan<br />
*'Faculty of Pharmaceutical Science, Hokkaido University, Sapporo 060, Japan<br />
*2Faculty of Veterinary Medicine, Suez Canal University, Ismailia, Egypt<br />
The olfactory sensitivity of <strong>the</strong> Nile tilapia, Oreochromis niloticus, to fourteen<br />
amino acids was investigated using electrophysiological recording techniques. The<br />
relative stimulatory efficacy (RSE) of <strong>the</strong> fourteen amino acids determined at 1X10⁴ M<br />
revealed two distinct groups of stimulants. Serine, alanine and cysteine were <strong>the</strong> most<br />
stimulatory, while betaine and proline were <strong>the</strong> least. The remaining amino acids were<br />
intermediate. Sex of <strong>the</strong> fish did not affect RSE. The magnitudes of olfactory nerve<br />
responses increased exponentially with logaritbinic increases of stimulus concentration<br />
from <strong>the</strong> minimum threshold to 1X10⁴ M. The calculated average minimum detection<br />
threshold is 1X10826 M which is within <strong>the</strong> range reported previously for fish species.<br />
Key words: Nile tilapia; olfactory sensitivity; amino acids; chemosensitivity.<br />
Introduction<br />
Feeding behaviour is an elective process in an animal, since specific food items are<br />
selected from a variety of nutrient sources within <strong>the</strong> environment. This selection is<br />
mediated by two separate factors: chemical constituents of <strong>the</strong> food item and <strong>the</strong> animal's<br />
own chemosensitivity.<br />
The olfactory systems of fish have been shown to be highly sensitive to chemical stimuli<br />
(Hara, 1975). The fish olfactory epi<strong>the</strong>lium is similar in structure to that of <strong>the</strong> o<strong>the</strong>r<br />
vertebrates and, because olfaction takes place in an aquatic medium, a wide variety of<br />
compound classes are suitable stimuli. Among <strong>the</strong>se compounds amino acids have been<br />
demonstrated to be feeding cues and act as potent olfactory stimulants (Carr, 1982).<br />
Considerable effort to measure <strong>the</strong> chemosensitivities of different fish species has been<br />
expended.<br />
1
Tilapia is an important fish species f or <strong>the</strong> aquaculture industry in many countries.<br />
Oreochromis niloticus and 0. aureus have <strong>the</strong> ability to adapt different environmental<br />
conditions beside <strong>the</strong>ir hardiness, ease of breeding, diversified habitats and fast body<br />
growth. (Zaki et al., 1996). The Nile tilapia (0. niloticus) is a tropical fish that is<br />
originally from <strong>the</strong> Nile basin in Africa, but is now widely distributed throughout <strong>the</strong><br />
world f or aquaculture purpose. (McKenzie et al., 1996). We have chosen to examine <strong>the</strong><br />
olfactory sensitivity of Nile tilapia based on <strong>the</strong> relative stimulatory efficacy (RSE) of<br />
fourteen amino acids. Fur<strong>the</strong>rs <strong>the</strong> minimum detection thresholds of <strong>the</strong> six most potent<br />
amino acids are determined. All tested amino acids are found in plant and/or animal<br />
tissues, and thus might encountered in food items.<br />
Materials and Methods<br />
Experimental Preparation<br />
Nile tilapia weighing 390.9 ± 31.2 g and 200.2 ± 4.7 g with total length 26.9 ± 0.5 cm<br />
and 22.6 ± 0.1 cm for males and females, respectively, were obtained from a commercial<br />
supplier and maintained in aquaria equipped with an aerator-filter and heater.<br />
Temperatures were maintained at 24-25 0C on a 12 h light : 12 h dark cycle and fed ad<br />
libitum with a commercial diet.<br />
The fish were anaes<strong>the</strong>tized with MS-222 (tricaine-methane sulphonate, 1:20000<br />
dilution), immobilized with Flaxedil (gallamine triethiodide, Sigma, St. Louis, MO, USA,<br />
3 mg/Kg body weight) and fastened with a clamp in a plexiglass chamber with <strong>the</strong> dorsal<br />
portion of <strong>the</strong> fish remaining above <strong>the</strong> water level of <strong>the</strong> chamber. Exposed parts of <strong>the</strong><br />
fish were covered with wet tissue and kept moist throughout <strong>the</strong> experiment. Charcoal<br />
filtered, warm aerated water was perfused through <strong>the</strong> mouth and over <strong>the</strong> gills<br />
throughout <strong>the</strong> experiment to provide artificial respiration. The skin and part of <strong>the</strong><br />
skull were removed to expose <strong>the</strong> olfactory bulbs and proximal portion of <strong>the</strong> olfactory<br />
nerve.<br />
Electrical Recording Procedure<br />
The olfactory nerve response elicited by chemical stimulation was recorded using enamel<br />
coated twin tungsten microelectrodes (tip diameter= 10-30mm). The recording electrode<br />
was penetrated into <strong>the</strong> olfactory nerves. A metal needle placed within <strong>the</strong> dorsal<br />
musculature was used as a reference electrode. The signal was amplified by AC<br />
preamplifier (MOD. DAM-5A, W-P Instruments Sarasota, FL, USA) with a bandpass of<br />
300 Hz-3 KHz and integrated with an electric integrator (time constant = 0.3s). Pen<br />
recorder recorded integrated olfactory responses<br />
Method Of Stimulation<br />
A constant background flow (llml/s) of buffered artificial freshwater (AFW; 0.3mM<br />
NaC1, 0.2mM KC1, 0.2mM CaC12 ,0.2mM NaHCO3, pH 6.9) in deionized water was<br />
directed over <strong>the</strong> olfactory epi<strong>the</strong>lium in a rostral to caudal direction. One ml aliquots of<br />
2
each stimulant were delivered via a Teflon tube over <strong>the</strong> olfactory epi<strong>the</strong>liuin. The inter<br />
stimulus interval was 230s, during which time <strong>the</strong> olfactory epi<strong>the</strong>lium was constantly<br />
flushed with AFW. This interval was chosen because complete recovery following<br />
successive stimulations was demonstrated. Stimuli consisted of reagent grade L-amino<br />
acids dissolved in AFW. To determine <strong>the</strong> RSE of <strong>the</strong> amino acids, each was presented at<br />
a concentration of 1x10⁴ M,. and <strong>the</strong> results are expressed as percentage relative to <strong>the</strong><br />
response to L-serine. Stimuli applied in <strong>the</strong> threshold experiments were presented in<br />
ascending order of concentration beginning with a control (AFW alone) sample.<br />
Statistics<br />
Data were expressed as mean ± SE. Statistical analysis were calculated by repeated<br />
measures analysis of variance, post hoc Newman-Kuels analysis, and General Linear<br />
Model test (ANOVA).<br />
Results<br />
The relative stimulatory efficacy (RSE) of <strong>the</strong> tested amino acids was determined at<br />
1x10⁴ M and <strong>the</strong> results are expressed as a percentage of <strong>the</strong> response to L-serine. Each<br />
amino acid was presented to each fish in a minimum of three trials. Repeated measures<br />
analysis of variance indicated that <strong>the</strong>re was significant difference between amino acids<br />
(F~31.31, P
To determine <strong>the</strong> RSE of <strong>the</strong> examined fourteen amino acids, each was presented at a<br />
concentration of 1x10⁴M. In <strong>the</strong> present study, <strong>the</strong>re is no difference in RSE between<br />
male and female Nile tilapia, which indicates that <strong>the</strong> olfactory neural response to amino<br />
acids for both sexes is quite similar. The Post hoc statistical testing indicated that <strong>the</strong> RSE<br />
of <strong>the</strong> tested amino acids separated into two distinct groups, with serine (standard),<br />
alanine, and cysteine comprising <strong>the</strong> most stimulatory one, while betaine and proline <strong>the</strong><br />
least effective. The o<strong>the</strong>r amino acids (methionine, glutamine, argnine, glycine, lysine,<br />
glutamic acid tryptophan, histidine, and leucine) were intermediate between <strong>the</strong>se groups<br />
and indistinguishable in response from each o<strong>the</strong>r. Cysteine is <strong>the</strong> most efficacious amino<br />
acid tested for channel catfish, Ictalurus punctatus, (Caprio, 1978) and eel, Angulla<br />
rostrata, (Silver, 1982) as well as <strong>the</strong> Nile tilapia.<br />
Olfactory thresholds obtained electrophysiologically for <strong>the</strong> most potent amino acids in<br />
fish were generally lie between 106 and 109M (Kang and Caprio 1995). Which reflect<br />
<strong>the</strong> approximate levels of free amino acids found in natural waters as it varies according<br />
to <strong>the</strong> back ground level of total amino acids (Caprio, 1982). The present data of<br />
olfactory responses in Nile tilapia demonstrated <strong>the</strong> average threshold of <strong>the</strong> six most<br />
potent amino acids (serine, alanine, cysteine, methionine, glutamine, and arginine) was<br />
1x10⁸ .26 M These thresholds were not different from those previously reported fish<br />
species. This indicate that <strong>the</strong> detected thresholds for all fish tested have been found to be<br />
very similar and quite low. The magnitude of olfactory nerve response increased<br />
exponentially with logarithmic increases in concentration. This is typical of all fish<br />
studied using olfactory electrophysiological technique (Hara, 1982).<br />
Comparisons of responses at a single concentration might not necessarily predict those at<br />
ano<strong>the</strong>r if <strong>the</strong>re were significant variations in <strong>the</strong> slopes of <strong>the</strong> concentration response<br />
plots for <strong>the</strong> different amino acids. The slopes for <strong>the</strong> amino acids used in <strong>the</strong> present<br />
study were similar indicating that significant changes in rank order at different<br />
concentrations would not occur if pH of <strong>the</strong> stimulus solution maintained in neutral<br />
range.<br />
While <strong>the</strong> olfactory neural response typically exhibits a tonic component followed by a<br />
phasic response to long-duration stimulus presentation, our stimulus sample pulses were<br />
quite short in duration so a significant tonic component was probably not observed.<br />
It has been suggested, based on behavioural investigations that olfaction is responsible<br />
for <strong>the</strong> arousal and excitatory state and <strong>the</strong> feeding search image (Valetincic et al., 1994).<br />
The similarities in olfactory sensitivity of fish with different feeding requirements are<br />
consistent with this observation. However, <strong>the</strong> question if Nile tilapia olfactory sensitivity<br />
as measured by electrophysiology (a chemically noiseless environment) reflects that in<br />
natural environment. Information addressing this question could be obtained through<br />
behavioural studies, which can narrow <strong>the</strong> information gap between electrophysiology<br />
and behaviour. This is <strong>the</strong> key to understand fish chemosensitivity and should be actively<br />
pursued in <strong>the</strong> future.<br />
4
Acknowledgments<br />
We thank Dr. K. Kurihara , Dr. J. Caprio, Dr. T. Marui, Dr. J. B. K. Leonard, and for<br />
<strong>the</strong>ir encouragement and help throughout <strong>the</strong> present study; H. Sakano, T. Yamamoto and<br />
A. Sato for <strong>the</strong>ir assistance ; and H. Haruna for his help in making <strong>the</strong> experimental<br />
systems, we thank Egyptian high education minster, department of mission for <strong>the</strong><br />
scholarship "channel system programme".<br />
References<br />
Carr, W. (1982) Chemical stimulation of feeding behaviour. In Chemoreception in<br />
Fishes. (T. J. Hara, ed.), PP.259-273. New York: Elsevier.<br />
Caprio, J. (1978). Olfaction and taste in channel catfish: an electrophysiological study of<br />
<strong>the</strong> response to amino acids and derivatives. J. Comp. Physiol. 123,357-371.<br />
Caprio, J. (1982) High sensitivity and specificity of olfactory and gustatory receptors of<br />
catfish to amino acids.In Hara, T. J., ed. Chemoreception in Fishes. Pmisterdam: Elsevier,<br />
pp. 109-113.<br />
Hara, T. J. (1975) Olfaction in fish, Progr. Neurobiol., 5, 271-335.<br />
Hara, T. J., (1982) Structure-activity relationships of amino acids as olfactory stimuli. In<br />
Chernoreception in Fishes, Hara, T. J., Ed., Elsevier, Amsterdam, 135.<br />
Kang, J., and Caprio, J., (1995) In vivo responses of single olfactory catfish, Ictalurus<br />
punctatus. J. Neurophysiol., 73: 172-177.<br />
Mckenzie, DJ. Piraccini, G. Bronzi, P. and Bolis,C. L. (1996) The effect of plasma acid<br />
base status on urea excretion in Nile tilapia. In; The Physiology of Tropical Fish<br />
<strong>Symposium</strong> Proceedings International congress on <strong>the</strong> Biology of <strong>the</strong> Fishes, San<br />
Francisco state University July 14-18.<br />
Silver, W. L. (1979) Olfactory responses from a marine elasmobranch: <strong>the</strong> Atlantic<br />
stingray Dasyatis sabina. Mar. Behav. Physiol. 6,297-305.<br />
Valentincic, T., Wegert, 5, and Caprio, J. (1994) Learned olfactory discrimination versus<br />
innate taste responses to amino acids in channel catfish (Ictalurus punctatus). Physiol.<br />
Behav. 55(5)865-873.<br />
Zaki, M.I Michael, M o I., and Ghbrial, S.G. (1996). Embryological characteristics of two<br />
Oreochromis Spp.(Tilapia) and <strong>the</strong>ir hybrid using <strong>the</strong> induced spawning method. The<br />
Fish egg: Its Biology and Culture <strong>Symposium</strong> Proceedings. International congress on <strong>the</strong><br />
Biology of Fishes, San Francisco state University July 14-18.<br />
5
Fig.1(a) Typical integrated olfactory neural response from a male Nile tilapia (TL=23cm,<br />
W=180g) to a concentration series of L-Alanine with logarithmic increase in stimulus<br />
concentration.<br />
(b) Plot of mean log response v log L-Alanine (?) concentration extrapolated<br />
regression line intersects <strong>the</strong> response to control (AFW), indicating <strong>the</strong><br />
<strong>the</strong>oretical detection threshold.<br />
6
Fig. 2. Relative stimulatory efficacy (RSE) of amino acids in both male and female Nile<br />
tilapia presented at 1X10⁴ M. RSE indicates <strong>the</strong> olfactory response elicited standardized<br />
to <strong>the</strong> response to 1X10⁴ M. Serine. Bars are mean ± SE.<br />
7
Table 1. Relative stimulatory efficacy (RSE; mean " S.E.) of amino acids in Nile tilapia<br />
standardized to <strong>the</strong> response to i04 M serine. Groupings Indicate results of a post hoc<br />
Newman-Kuels analysis where amino acids sharing <strong>the</strong> same letter do not produce<br />
significantly different olfactory responses.<br />
Amino Acid Grouping RSE mean " S.E.<br />
Serine Standard 100 "0<br />
Alanine A 93 "6<br />
Cysteine A 91 "7<br />
Methionine AB 89 "6<br />
Glutamine ABC 78 "6<br />
Arginine ABC 72 "7<br />
Glycine ABCD 59 "9<br />
Lysine ABCD 54 "5<br />
Glutamic acid ABCD 51 "7<br />
Tryptophan BCD 47 "6<br />
Histidine CD 42 "8<br />
Leucine CD 37 "9<br />
Betaine D 28 "5<br />
Proline D 25 "3<br />
8
Development of a Third Generation Acoustic<br />
Waste Feed Monitor<br />
Scott Tsukuda 1 , Roger Wallace 2 , Steven Summerfelt 1 , John Davidson 1 , Joseph Hankins 1<br />
Introduction<br />
1<br />
Freshwater Institute<br />
2<br />
CultureTools<br />
P. O. BOX 1889 P. O. BOX 132<br />
Shepherdstown, WV 25443 Monkton, VT 05469<br />
Feed detection technologies have shown positive results in commercial net pen<br />
applications. Research systems have used ultrasonic, infrared, and visual feed detection<br />
(Bjordal et al. 1993; Blyth and Purser 1993; Foster et al. 1995). The advantages of<br />
systems for monitoring feed wastage compared with traditional surface behavior<br />
monitoring or ration feeding has been documented for cage-based systems (Ang and<br />
Petrell 1997, 1998; Juell et al. 1993). Some commercial systems are claiming 5-20% feed<br />
conversion improvements and also shortened production cycles (Anonymous 1999).<br />
To date, <strong>the</strong>re have not been analogous systems commercially available for land-based<br />
intensive aquaculture systems utilizing circular tanks. Although, <strong>the</strong>re have been<br />
innovations in tank and system design (dual drain, recirculating systems), tank systems are<br />
typically designed with, at least, a center drain with an externally mounted standpipe for<br />
<strong>the</strong> effluent management. This similarity facilitates development of a waste feed<br />
monitoring system that can be retrofitted to pre-existing culture tanks.<br />
The UltraEye waste feed controller (CultureTools, Monkton, VT) is a third generation<br />
detection unit nearing commercial availability. Compared to previous units, <strong>the</strong> UltraEye<br />
unit has added a number of improvements designed to improve detection efficiency and<br />
improve differentiation between uneaten feed, feces and o<strong>the</strong>r background noise. The<br />
purpose of this project is to evaluate this improved unit.<br />
History<br />
The first model was designed as an inexpensive standalone unit with limited configuration<br />
settings controlled by dip switches. The feed routine was discontinued when a number of<br />
pellet counts was exceeded and an interval timer controlled time between feedings. There<br />
was limited feedback from <strong>the</strong> unit to <strong>the</strong> user and <strong>the</strong> transducer was attached side<br />
mounted to a standpipe (Summerfelt et al. 1995).<br />
The second unit was designed solely as a waste feed monitor unit (Derrow et al. 1996). It<br />
was assumed digital pellet detection data (pellet/no pellet) would flow into a central<br />
computer for processing. This central computer would possibly handle data from multiple<br />
feeders, and subsequently control a network of feeders. The aim was to develop <strong>the</strong><br />
1
feeder control algorithms on a PC separately from <strong>the</strong> development of <strong>the</strong> detection unit<br />
and possibly integrate <strong>the</strong>m on a later model.<br />
The transducer orientation was also changed for this second unit. The transducer was<br />
mounted to <strong>the</strong> top of a standpipe to send <strong>the</strong> signal down into <strong>the</strong> standpipe ra<strong>the</strong>r than<br />
across <strong>the</strong> cross section. This change resulted in better detection because it moves <strong>the</strong><br />
detection volume out of <strong>the</strong> unstable near field and also facilitates installation, removal and<br />
cleaning while <strong>the</strong> production system is operating.<br />
Table 1. Comparison of Feed Detectors.<br />
Feature Generation 1 Generation 2 Generation 3<br />
(Commercial)<br />
Parameter<br />
Dip Switches Dip Switches Software<br />
Configuration<br />
Selectable<br />
Networkeable No As slave to PC or Included 2-wire<br />
PLC<br />
RS-485<br />
Operator Detection Single LED Multiple LED’s LCD or PC Display<br />
Feedback<br />
Detection Primarily based<br />
Signal Gain<br />
2<br />
Primarily based on<br />
Signal Gain<br />
Signal Gain and<br />
Proprietary<br />
Algorithms<br />
Integrated Feed<br />
Control<br />
Yes No Yes<br />
Feed Control Interval No Time of Day or<br />
Interval<br />
Transducer Mount Perpendicular to<br />
Flow<br />
Parallel to Flow Parallel to Flow<br />
Configuring<br />
Manual Manual Semi-Automatic or<br />
Detection Settings<br />
Manual<br />
The current unit has returned towards <strong>the</strong> integrated approach of <strong>the</strong> first prototype by<br />
combining waste feed detection and feeder control into one box. The manufacturer has<br />
added both circuitry and software algorithms to improve particle detection. In addition to<br />
an interval timer, <strong>the</strong> unit has an event timer that can be programmed for feeding at<br />
specific times during <strong>the</strong> day. Proprietary algorithms have been added by <strong>the</strong><br />
manufacturer to enhance pellet detection and decrease false counts. Significantly, <strong>the</strong> dip<br />
switches have been replaced by software routines so that <strong>the</strong> user can change values using<br />
an integrated LCD display and keypad without opening <strong>the</strong> enclosure. In addition, <strong>the</strong><br />
unit has 2-wire RS-485 communications for remote configuration and access to more<br />
advanced features on a PC. The RS-485 network also allows multiple units to be accessed<br />
on a single PC. Table 1 lists a brief comparison of <strong>the</strong> three units.<br />
Performance of Generation 3<br />
In a 1500 L flow-through tank containing 120 kg rainbow trout being fed a 3/16” Zeigler<br />
Trout diet, <strong>the</strong> UltraEye unit has shown <strong>the</strong> ability to detect <strong>the</strong> differences in feed
wastage between day and night feeding and has demonstrated differences in feed wastage<br />
as small as 13 gram increments 1 .<br />
Preliminary experiments in a partial recirculation double drain tank system have shown<br />
that <strong>the</strong> units can differentiate between feed and feces for pellets as small as 2.5 mm.<br />
Future Trials.<br />
Additional feed control tests within 12 ft double drain tanks in a partial recirculation<br />
system with Rainbow Trout fingerlings are currently being carried out. Answering <strong>the</strong><br />
following questions are important for this investigation: (1) How will <strong>the</strong> increased<br />
effluent solids concentration created by <strong>the</strong> double drain design effect <strong>the</strong> performance of<br />
<strong>the</strong> waste feed controller? (2) How effectively are fingerling pellets detected by <strong>the</strong> unit?<br />
(3) What effect does <strong>the</strong> particle retention time in <strong>the</strong> 12 ft tank have on waste feed<br />
detection and feed wastage?<br />
Acknowledgements<br />
The funding for this work was provided by <strong>the</strong> USDA-ARS under grant #59-1930-8-038.<br />
References<br />
Ang, K. P. and Petrell, R. J. “Control of feed dispensation in seacages using underwater<br />
video monitoring: effects on growth and food conversion.” Aquacultural Engineering.<br />
16 (1997): 45-62.<br />
Ang, K. P. and Petrell, R. J. “Pellet wastage, and subsurface and surface feeding<br />
behaviours associated with different feeding systems in sea cage farming of salmonids.”<br />
Aquacultural Engineering. 18 (1998): 95-115.<br />
Anonymous. “The bonus of lower FCR’s.” Fish Farmer. 22 (1999): 36.<br />
Bjordal, Å., Juell, J. E., Lindem, T., and Fernö, A. “Hydroacoustic monitoring and<br />
feeding control in cage rearing of Atlantic salmon (Salmo salar L.).” Fish Farming<br />
Technology. (1993): 203-208.<br />
Blyth, P. J., Purser G. J., Russell, J. F. “Detection of feeding rhythms in seacaged Atlantic<br />
salmon using new feeder technology.” Fish Farming Technology. (1993): 209-216.<br />
Derrow, R. W., Mehrabi, A., Summerfelt, S. T., Hankins, J. A. “Design and Testing of a<br />
Second Generation Acoustic Waste Feed Monitor. Proceedings from <strong>the</strong> Successes and<br />
Failures in Commercial Recirculating Aquaculture Conference. (1996): 552-561.<br />
1 The experimental protocol and <strong>the</strong> methods were in compliance with <strong>the</strong> Animal Welfare Act (9CFR)<br />
requirements and were approved by <strong>the</strong> Freshwater Institute Institutional Animal Care and Use<br />
Committee.<br />
3
Durant, M. D., Summerfelt, S. T., Hankins, J. A. “A field trial of a hydroacoustic waste<br />
feed control device in a flow-through tank fish production system with rainbow trout<br />
(Onchorhynchus mykiss).” Quality in Aquaculture, European Aquaculture Society, Gent,<br />
Belgium. (1995): 123-129.<br />
Foster, M., Petrell, R., Ito, M. R., Ward, R. “Detection and counting of uneaten food<br />
pellets in a sea cage using image analysis.” Aquacultural Engineering. 14 (1995): 251-<br />
269.<br />
Juell, J. E., Furevik. D. E., Bjordal, Å.. “Demand Feeding in salmon farming by<br />
hydroacoustic food detection. Aquacultural Engineering. 12 (1993): 155-167.<br />
Summerfelt, S.T., Holland, K. H., Hankins, J. A., Durant, M.D. “A hydroacoustic waste<br />
feed controller for tank systems.” Wat. Sci. Tech. 31 (1995) 123-129.<br />
4
Effect of Different Protein/Energy Ratios on<br />
Growth Response of Tilapia<br />
Fatma A. Hafez<br />
Central Laboratory for Aquaculture Research at Abbassa<br />
Agricultural Research Center<br />
Abou-Hammad, Sharkia<br />
Egypt<br />
Abstract not available at time of printing.<br />
1
The Effects of Ultraviolet Filtration on <strong>the</strong><br />
Production of <strong>the</strong> Gold Fish<br />
Carassius auratus in Recirculating Systems<br />
Donald I. Anadu Ph.D.<br />
Department of Biological Sciences,<br />
South Carolina State University, P.O. Box 7501. Orangeburg, SC 29117. U.S.A.<br />
Abstract<br />
Goldfish (Carassius auratus) were reared in two recirculating systems initially under <strong>the</strong><br />
same settings and UV conditions for period of 100 days. Halfway through <strong>the</strong><br />
experiment, <strong>the</strong> supply of <strong>the</strong> UV irradiation in one <strong>the</strong> setting was discontinued. Several<br />
water quality parameters were monitored in both settings at <strong>the</strong> two different times. The<br />
results indicate that UV systems enhanced <strong>the</strong> growth of <strong>the</strong> fish, significantly increased<br />
<strong>the</strong> relative growth rate, <strong>the</strong> production, <strong>the</strong> survival and <strong>the</strong> yield of <strong>the</strong> fish population.<br />
Specifically, <strong>the</strong> ratio of <strong>the</strong> relative growth rates for <strong>the</strong> UV to <strong>the</strong> non-UV treated<br />
goldfish was 23:1., production 26:1., survival,1.8:1 and yield 2:1.The condition factors<br />
for both populations were not significantly different at 0.9:1 ratio. These findings indicate<br />
that <strong>the</strong>re were positive correlation between UV irradiation and most goldfish production<br />
parameters.<br />
Introduction<br />
As aquaculture becomes an important facet of world fish production, improved principles<br />
and techniques involved in this practice will enhance <strong>the</strong> contribution of aquaculture to<br />
<strong>the</strong> fisheries industry. The major goal of a successful aquaculture is to maximize<br />
production and <strong>the</strong>refore profit.<br />
Water in different fish production systems is at risk of contamination from waterborne<br />
pathogenic organisms. These pathogens have undesirable effects on <strong>the</strong> main goal of a<br />
successful aquaculture, which is to maximize production (profit) in <strong>the</strong> system.<br />
Ultraviolet (UV) irradiation systems have been applied both as water and air clarifier and<br />
sterilizers for <strong>the</strong> past 50 years. Their applications have included; <strong>the</strong> disinfecting of<br />
recycled distilled water in pharmaceutical and cosmetic industries, kidney dialysis water,<br />
frozen juice concentrate makeup water, beverage bottle and container rinse water, cottage<br />
cheese wash water, in fish hatchery water supply, control of algae in open fish ponds,<br />
control of bacteria in ornamental fish production and aquarium systems and in <strong>the</strong> control<br />
of tuberculosis Kizer, (1990) as well as o<strong>the</strong>r airborne viruses, mold spores and<br />
microorganisms.<br />
The objectives of this study were i) To estimate gold fish production parameters in<br />
experimental recirculating system without UV irradiation ii) To estimate gold fish<br />
production parameters in experimental recirculating system with UV irradiation and iii)<br />
1
To compare <strong>the</strong> primary water quality parameters in <strong>the</strong> two systems above (DO, pH, and<br />
Temperature).<br />
Materials and Methods<br />
Two populations of <strong>the</strong> same age class of <strong>the</strong> ornamental gold fish Carassius auratus<br />
were reared in similar conditions and settings for 100 days. They were reared in 50 gallon<br />
(190 L) water maid tanks of 38x20x18’’ and a constant water level of 6 ins (15 cm.).<br />
Fifty (50) gold fish (3.40 ± 0.54 g) per tank were stocked.<br />
The culture water was filtered and circulated by use of Maryland Magnum 350 pump<br />
(convertible carnister filter able to pump 350 GPH) and aerated using Maxima® 805 air<br />
pumps. An ultraviolet sterilizing unit (1.5-L capacity, Angstrom 2537® Model AN - 5)<br />
was connected to <strong>the</strong> filter pumps in both set-ups. Fish were fed once daily (at 1000 hr)<br />
with flake food (TETRA SM 80®) to satiation.<br />
Dissolved oxygen, pH, and temperature were determined daily from <strong>the</strong> fish tanks during<br />
<strong>the</strong> tests. Individual weights and lengths of all <strong>the</strong> fish grown were recorded at various<br />
times between <strong>the</strong> experiment and at <strong>the</strong> termination of <strong>the</strong> experiment. From <strong>the</strong> final<br />
weights, <strong>the</strong> growths and <strong>the</strong> relative growth rates were calculated using <strong>the</strong> formula;<br />
Relative growth = Y2- Y1/ Y1 and Relative growth rate = (Y2-Y1)/[Y1 (t2-t1)]; where t1 is<br />
<strong>the</strong> time at <strong>the</strong> beginning of an interval and t2 <strong>the</strong> time at <strong>the</strong> end, and Y1 and Y2 are <strong>the</strong><br />
respective fish sizes in weights (g) at those times (Ricker 1979, Tyler and Gallucci,<br />
1980). The relationship between <strong>the</strong> two tanks and <strong>the</strong> mean growth of <strong>the</strong> associated<br />
gold fish groups were compared.<br />
The condition factors (CF or K) for <strong>the</strong> two populations were calculated from <strong>the</strong><br />
relationship K = W/(L) 3 where K is condition factor; also an index of growth rate<br />
Busacker et al. 1990.<br />
Production was computed as <strong>the</strong> sum of <strong>the</strong> products of growth rate (G) and mean<br />
biomass (B), evaluated at short intervals of time. P = GB, where P is production, G is<br />
growth rate and B is <strong>the</strong> mean biomass Warren, 1971.<br />
Results and Discussion<br />
During <strong>the</strong> experiment, certain water quality parameters were measured to ascertain that<br />
values were within <strong>the</strong> acceptable levels for <strong>the</strong> rearing of goldfish. The dissolved oxygen<br />
became higher in <strong>the</strong> NUV (set-up without ultraviolet irradiation) tank towards <strong>the</strong> end of<br />
<strong>the</strong> experiment. This disparity is attributable to <strong>the</strong> low numbers of fish in <strong>the</strong> set up at<br />
this time. The low number was as a result of <strong>the</strong> increased mortality since <strong>the</strong> UV supply<br />
was uncoupled. The results of all <strong>the</strong> o<strong>the</strong>r variables measured are shown on table 1.<br />
2
Table 1. The mean (N = 20) initial and final sizes, biomass, weight gains, survival,<br />
production and yields of goldfish from <strong>the</strong> two set-ups at different times.<br />
Mo<br />
N<br />
Mean<br />
biomass B<br />
(g)<br />
Relative<br />
Growth<br />
Rate (G)<br />
Condition<br />
Factor (K)<br />
3<br />
Production<br />
(GB)<br />
Survival<br />
(%)<br />
Yield (g)<br />
+ + * + + + + + + + + + + + +<br />
Feb 20 20 2.4 2.4 ND ND ND 100 100 ND<br />
Mar 20 20 3.51 3.49 0.06 .06 0.18 0.19 0.21 0.20 100 100 ND<br />
Apri<br />
(1)<br />
Apri<br />
(2)<br />
20 20 4.39 4.21 .031 026 0.18 0.19 0.14 0.11 100 100 ND<br />
+ - + - + - + - + - + - + -<br />
20 20 4.75 4.44 0.03 0.02 0.15 0.15 0.14 0.09 96 82 ND<br />
May 20 20 5.62 4.87 0.023 0.01 0.14 0.16 1.30 .050 96 54 270 132<br />
* Indicates set up with (+) UV and without (-) NUV ultraviolet irradiation.<br />
Production was calculated as <strong>the</strong> product of <strong>the</strong> relative growth rate and <strong>the</strong> mean<br />
biomass.(Warren 1971). Although <strong>the</strong> absolute value did not amount to much in ei<strong>the</strong>r set<br />
up, but <strong>the</strong> UV set-up was significantly higher than <strong>the</strong> second set-up NUV (a ratio of<br />
26:1). Production here is defined as <strong>the</strong> total amount of tissue elaborated by a population<br />
Warren 1971.<br />
Yield was calculated as <strong>the</strong> mean biomass B multiplied by <strong>the</strong> number (N) of fish that<br />
survived to <strong>the</strong> end of <strong>the</strong> experiment. The fish yield in <strong>the</strong> UV coupled system was<br />
approximately 270 g as against 132 g in <strong>the</strong> NUV system. The condition factor (K) was<br />
not significantly affected. This was probably due to <strong>the</strong> short duration of time for <strong>the</strong><br />
entire experiment.<br />
The mode of action of ultraviolet irradiation has been attributed to radiation of high<br />
intensities of ultraviolet light for a given amount of time. When this light is emitted<br />
within a given curve of <strong>the</strong> ultraviolet spectrum, it will disrupt and mutate <strong>the</strong> DNA<br />
(deoxyribonucleic acid) of microorganisms. The bactericidal activities of <strong>the</strong> UV<br />
irradiation accounts for <strong>the</strong> many positive attributes found in <strong>the</strong> UV coupled system in<br />
<strong>the</strong> goldfish production experiments.
All <strong>the</strong> measured parameters were relatively similar in <strong>the</strong> two recirculating systems until<br />
<strong>the</strong> UV treatments became varied. The use of UV radiation in fish culture is a significant<br />
improvement in <strong>the</strong> fish culture technology. Reared fish will find adequate comfort with<br />
<strong>the</strong> UV equipped systems especially in crowded situations as in fish hatcheries. It is<br />
proposed that <strong>the</strong> UV systems will be useful in overwintering those warm water fish that<br />
are now targeted for culture in cold regions like <strong>the</strong> tilapias that must be stocked in higher<br />
densities than usual.<br />
References<br />
Busacker, G. P., I. Adelman and E. M. Goolish. Growth. <strong>Pages</strong> 363 – 387 in C.B. Shreck<br />
and P.B. Moyle, editors, Methods for fish biology Be<strong>the</strong>sda, Maryland. American<br />
Fisheries Society 1990.<br />
Kizer, Kenneth W. “Using ultraviolet radiation to control tuberculosis”. California<br />
Department of Health Services. 19 p. 1990.<br />
Ricker, W.E. Growth rates and models. <strong>Pages</strong> 677- 743 in W. S. Hoar, D. J. Randall, and<br />
J. R. Bretts, editors. Fish physiology, volume 8. New York, Academic press. 1979.<br />
Tyler, A.V. and V.F. Gallucci. Dynamics of fished stock. <strong>Pages</strong> 111 to 147 in R.T Lackey<br />
and L.A. Nielsen, editors, Fisheries management. Boston. Blackwell scientific<br />
publications 421p. 1980.<br />
Warren, C.E. Biology and water pollution control. Philadelphia, W.B.Saunders Co. 434p.<br />
1971.<br />
4
Introduction<br />
Evaluation of UV Disinfection Performance in<br />
Recirculating Systems<br />
Songming Zhu, Brooks Saucier, James Durfey, and Shulin Chen<br />
Department of Biological Systems Engineering<br />
Washington State University, Pullman, WA 99164 USA<br />
Ultraviolet (UV) disinfection is an increasingly popular alternative in wastewater<br />
treatment (Hanzon and Vigilia, 1999) and aquaculture industries. Damage to <strong>the</strong> genetic<br />
material of <strong>the</strong> pathogens as it absorbs UV radiation is considered <strong>the</strong> main inactivation<br />
mechanism as cell replication being blocked (U.S. EPA, 1986). The advantages of UV<br />
disinfection are non-toxic, ecologically friendly, effective with a wide range of<br />
organisms, short contact time, and easy to control (Moreland et al., 1998; Hanzon and<br />
Vigilia, 1999). UV facilities used in wastewater industry are usually flow-through<br />
systems with several banks of lamps in series (Ho et al., 1998). Inactivation of pathogens<br />
can be described as a first-order reaction with respect to UV dose (mJ/cm -2 ) usually<br />
defined as UV light intensity (mW/cm -2 ) times <strong>the</strong> exposure time (s) (U.S. EPA, 1986).<br />
The effectiveness of UV radiation to inactivate pathogenic microorganisms in wastewater<br />
has been well documented for wastewater treatment purposes (Johnson and Qualls, 1984;<br />
U.S. EPA, 1986; Darby et al., 1993; Emerick et al., 1999).<br />
UV devices have become an integral part of many aquaculture operations providing<br />
disinfected water to hatchery, rearing and depuration operations. Recirculation is a major<br />
feature of <strong>the</strong>se aquaculture systems, which makes <strong>the</strong> evaluation of UV disinfection<br />
effectiveness different from that in flow-through wastewater treatment systems.<br />
Recirculating systems have attracted significant attention in <strong>the</strong> last two decades for<br />
applications in aquaculture. Lack of suitable water supplies and more stringent control of<br />
wastewater and nutrient discharges from pond and raceway facilities drive <strong>the</strong> demand<br />
for recirculating systems. However, little research work has been reported on using UV<br />
devices in recirculating systems. In <strong>the</strong> wastewater treatment industry, UV devices are<br />
often used after secondary treatment (Nieuwstad et al., 1991; Ho et al., 1998) where<br />
water is relatively clear (60-82%/cm UV transmittance) (Hanzon and Vigilia, 1999). UV<br />
energy delivered to <strong>the</strong> clear water is relatively high, thus providing effective treatment.<br />
This may not be <strong>the</strong> case for recirculating aquaculture systems where waters carry high<br />
levels of suspended solids, thus resulting in low transmittance (less than 65%/cm UV<br />
transmittance according to measurements). Moreover, UV dosage is a major parameter<br />
for UV disinfection specification. Yet, this parameter cannot be simply applied to<br />
recirculating systems. Adoption of existing UV technology is hindered by a lack of<br />
quantitative design and performance information on UV disinfection for recirculating<br />
systems (Downey et al., 1998).<br />
1
The objectives of this study were (1) to evaluate <strong>the</strong> performance characteristics of UV<br />
disinfection devices in recirculating systems with various conditions of water flow rate,<br />
UV transmittance, and UV lamp output power; (2) to present quantitative information for<br />
<strong>the</strong> design and operation of UV disinfection devices used in recirculating systems.<br />
Materials and Methods<br />
Experimental apparatus<br />
The UV disinfection study was conducted using a water recirculating system as shown in<br />
Figure 1. The system consisted of an 1100-liter tank, a recirculating pump, and a singlelamp<br />
ultraviolet (UV) unit (Aqua Ultraviolet, CA, USA). Prior to each test, <strong>the</strong> tank was<br />
cleaned and filled with artificial seawater or freshwater (Table 1). The artificial seawater<br />
was made using Durex All Purpose Salt (Morton International, Chicago, USA) and<br />
dechloride tap water. Wastewater containing high concentration of microorganisms,<br />
collected from a dairy wastewater lagoon, was used as fecal coliform source. For each<br />
test, a certain volume of dairy wastewater was put into <strong>the</strong> tank, and mixed with <strong>the</strong><br />
artificial seawater. An air diffuser was placed in <strong>the</strong> water tank to maintain dissolved<br />
oxygen concentration at 9.3 ± 0.4 mg/l (measured using a YSI-50 DO meter, Yellow<br />
Spring, Inc., USA). The diffuser also served as a mixer to keep coliform concentration<br />
homogeneous within <strong>the</strong> tank. The mixed water was pumped from <strong>the</strong> bath through a<br />
one-way valve, and <strong>the</strong>n returned to <strong>the</strong> bath via two ways: an over flow path and a<br />
disinfection path through <strong>the</strong> UV unit (Figure 1). Two ball valves were used in both of<br />
<strong>the</strong> two paths to adjust water flow rates through <strong>the</strong> UV device according to <strong>the</strong><br />
experimental protocol. Timing was started once <strong>the</strong> UV light was turned on. Water<br />
samples were collected from <strong>the</strong> tank at different disinfection times (Table 1). Before<br />
each test, <strong>the</strong> outside surface of <strong>the</strong> quartz sleeve of <strong>the</strong> UV lamp was hand cleaned with<br />
commercial cleaning solution so that <strong>the</strong> effect of sleeve dirt on <strong>the</strong> disinfection<br />
efficiency was mostly eliminated. Most of <strong>the</strong> treatments had a salinity of 15‰ except<br />
<strong>the</strong> treatments K (fresh water) and L (26‰ salinity). These two treatments were<br />
conducted for comparing <strong>the</strong> impact of salinity on <strong>the</strong> UV disinfection of fecal coliform.<br />
Sample analysis<br />
Sample analyses were performed in <strong>the</strong> Water Quality and Waste Analysis Laboratory at<br />
Washington State University, a laboratory certified by <strong>the</strong> Washington Department of<br />
Ecology for <strong>the</strong> analysis of related wastewater parameters. Fecal coliform (FC)<br />
concentration, a parameter commonly used for UV disinfection study, was determined<br />
using <strong>the</strong> membrane filter procedure specified by <strong>the</strong> Standard Method (APHA, 1995).<br />
In addition, water samples, collected before <strong>the</strong> UV lamp was turned on for each trial,<br />
were analyzed for UV254 (UV light at a wave-length of 254 nm) transmittance using a<br />
Spectronic 21-D spectrophotometer (Milton Roy, Brussels, Belgium), turbidity using a<br />
965-A Digital turbidimeter (Orbeco Analytical Systems, Inc., NY, USA), total suspended<br />
solids (TSS) concentration according to <strong>the</strong> Standard method (APHA, 1995).<br />
2
Figure 1 Schematic of <strong>the</strong> experimental system.<br />
Results and Discussion<br />
As summarized in Table 1, <strong>the</strong> UV devices were highly effective for FC disinfection<br />
under all experimental conditions. In most cases, a 25 UV unit killed about 99% of FC in<br />
<strong>the</strong> 340-liter wastewater within 31.5 min. This meant that only about 1% FC could<br />
survive after 7 cycles through a 25 UV unit. Similarly, about 99% FC of <strong>the</strong> wastewater<br />
was disinfected after 5 cycles through a 40 UV unit. The disinfection efficiency of<br />
treatment E was extremely low compared with those of <strong>the</strong> o<strong>the</strong>rs due to <strong>the</strong> low flow<br />
rate.<br />
FC survival ratio (<strong>the</strong> ratio of FC concentration after UV exposure to initial FC<br />
concentration), a dimensionless parameter, was used as an index parameter in this study<br />
for <strong>the</strong> comparison of disinfection results among <strong>the</strong> treatments with different initial FC<br />
concentrations. In wastewater industry, microorganism survival ratio is often expressed<br />
as a function of UV dosage, i.e., <strong>the</strong> product of UV irradiance and time (U.S. EPA, 1986).<br />
In recirculating systems, however, <strong>the</strong> survival ratio depends on not only <strong>the</strong> dosage of<br />
<strong>the</strong> flow-through <strong>the</strong> UV unit of <strong>the</strong> system, but also <strong>the</strong> cycle number of <strong>the</strong> water of <strong>the</strong><br />
system for a given period. The accumulated flow-through dosage based on average cycle<br />
number is not proper ei<strong>the</strong>r, because <strong>the</strong> survival ratio also varied with <strong>the</strong> flow rate.<br />
Thus, in this paper, FC survival ratio was described as a function of time. This was a<br />
major performance difference between recirculating and flow-through UV disinfections<br />
systems.<br />
Figure 2 gives <strong>the</strong> experimental results of <strong>the</strong> treatments with different salinity levels. No<br />
significant difference (R 2 = 0.92, N = 4, P < 0.05) of FC survival ratio was observed<br />
between treatment K (fresh water) and L (26‰ salinity). Figure 2 also shows <strong>the</strong> result<br />
of treatment C (15‰ salinity) which was conducted under similar conditions with K and<br />
L except salinity and water volume (Table 1). Compared with those of K or L, FC<br />
survival ratio of C dropped very quickly due to <strong>the</strong> volume difference. In fact, <strong>the</strong> water<br />
volume of K and L was twice of C. This meant that <strong>the</strong> average recirculating period of K<br />
3
and L was also twice. However, for <strong>the</strong> same number of cycles, treatment C would have<br />
similar disinfection efficiency with K and L.<br />
Figure 2 Fecal coliform survival ratio versus disinfection time for different salinity levels<br />
of treatments K (fresh water), L (26‰) and C (15‰). Water volume of treatment C (340<br />
liter) was a half of that of K and L (680 liter).<br />
UV254 transmittance (%/cm)<br />
Fecal coliform survival ratio<br />
100<br />
80<br />
60<br />
40<br />
20<br />
0<br />
1<br />
0.1<br />
0.01<br />
0.001<br />
K<br />
L<br />
C<br />
0 500 1000 1500 2000 2500 3000<br />
Disinfection time (s)<br />
Figure 3 Linear correlation between UV254 transmittance and turbidity of <strong>the</strong><br />
experimental wasters. R 2 is determination coefficient of regression, and N is data number<br />
4<br />
y = -1.89x + 83.0<br />
R 2 = 0.86<br />
N=20<br />
0 5 10 15 20 25 30 35<br />
Turbidity (NTU)
Table 1 Summary of <strong>the</strong> tested results.<br />
Treatment A B C D E F G H I J K L<br />
UV unit power (W) 25 25 25 25 25 25 25 40 40 40 25 25<br />
Wastewater volume (litter) 340 340 340 340 340 340 340 340 340 340 680 680<br />
Salinity (‰) 15 15 15 15 15 15 15 15 15 15 0 26<br />
Flow rate (l/s) 1.26 1.26 1.26 2.52 0.63 1.26 2.52 2.52 1.26 1.26 1.26 1.26<br />
Temperature (°C) 13.8 13.7 14.1 14.3 16.6 16.3 9.9 10.9 11.6 11.8 12.8 12.7<br />
pH 8.2 8.2 8.2 8.4 8.4 8.4 7.7 8.1 8.0 8.1 8.1 8.0<br />
DO concentration (mg/l) 9.1 9.9 9.7 9.3 9.1 9.2 10.4 10.5 10.2 10.1 9.4 8.9<br />
TSS (mg/l) 60 74 79 71 51 46 36 36 34 50 36 44<br />
Turbidity (NTU) 13.7 16 32.1 31 14.5 9.4 17.1 15.9 15.7 28.3 29.2 28.8<br />
UV254 transmittance (%/cm) 54.2 52.9 30.1 25.3 57.6 69.2 52.1 38.2 39.4 26.8 35.0 31.0<br />
Fecal coliform concentration (FCU/100ml)<br />
Disinfection time = 0 (s) 32250 61400 67250 24500 26000 12500 14000 27500 27500 39000 67000 37000<br />
270 19000 39000 63000 12500 13900 7500 10850 16250 15000 19000<br />
540 8900 27150 33050 8250 10000 3550 3900 4425 5150 8800 34800 29000<br />
810 4800 8900 18800 5950 5050 1180 1550 1300 2300 3150<br />
1080 350 855 1500<br />
1350 2000 4050 6600 850 1750 220 400 90 355 895<br />
1890 375 700 1150 160 820 60 80<br />
2160 6620 4460<br />
2700 4940 1950<br />
5
Regression analysis indicated that, for <strong>the</strong> experimental waters, <strong>the</strong>re was a strong linear<br />
correlation between UV254 transmittance and turbidity level (R 2 = 0.86, N = 20, P < 0.01)<br />
(Figure 3). Among <strong>the</strong> treatments, turbidity was adjusted by adding a different volume of<br />
wastewater. TSS data were with high variance, most likely caused by many factors, such<br />
as inhomogeneity of sampling, pipeting, and salinity (APHA, 1995). Due to <strong>the</strong> limited<br />
TSS data, no quantitative relationships were established between TSS and UV254<br />
transmittance, or TSS and turbidity. O<strong>the</strong>r parameters, including pH, temperature, and<br />
dissolved oxygen (DO) concentration, were monitored (Table 1), but not controlled<br />
during <strong>the</strong> experiment.<br />
Figure 4 Fecal coliform survival ratio versus disinfection time for different UV254<br />
transmittances of treatments A (54.2 %/cm), B (52.9 %/cm), C (30.1 %/cm) and F (69.2<br />
%/cm) in a recirculating experimental system with a 25 W UV unit and a flow rate of<br />
1.26 l/s.<br />
Fecal coliform survival ratio<br />
Fecal coliform survival ratio<br />
1<br />
0.1<br />
0.01<br />
0.001<br />
1<br />
0.1<br />
0.01<br />
0.001<br />
I<br />
J<br />
A<br />
B<br />
C<br />
F<br />
0 500 1000 1500 2000<br />
Disinfection time (s)<br />
0 500 1000 1500 2000<br />
Disinfection time (s)<br />
Figure 5 Fecal coliform survival ratio versus disinfection time for different UV254<br />
transmittances of treatments I (39.4 %/cm) and J (26.8 %/cm) in a recirculating<br />
experimental system with a 40 W UV unit and a flow rate of 1.26 l/s.<br />
UV254 transmittance was an important factor determining disinfection efficiency. As<br />
shown in Figure 4, FC survival ratio dropped quickly for <strong>the</strong> highest transmittance of<br />
treatment F (69.2 %/cm), and <strong>the</strong> final ratio at time of 1890 seconds was 0.0048. With<br />
similar transmittance (54.2 and 52.9 %/cm, respectively), treatments A and B resulted in<br />
6
similar disinfection efficiency. The final ratios of treatments A and B were 0.012 and<br />
0.011, respectively, about twice of treatment F. The survival ratio of treatment C<br />
dropped slowly (0.017 final ratio) due to <strong>the</strong> low transmittance (30.1 %/cm). The<br />
mechanism of <strong>the</strong> impact of UV transmittance on disinfection efficiency can be easily<br />
understood because a higher transmittance resulted in a higher average UV energy<br />
intensity, or a higher UV dosage for <strong>the</strong> water through an UV unit. The same<br />
performance could be observed in a recirculating system with a 40 W UV unit (Figure 5).<br />
For a given wastewater, FC survival ratio declined more quickly using a 40 W unit than<br />
using a 25 W one.<br />
Fecal coliform survival ratio<br />
Figure 6 Fecal coliform survival ratio versus disinfection time for different UV254<br />
transmittances and UV powers of treatments D (25.3 %/cm, 25 W), G (52.1 %/cm, 25 W)<br />
and H (38.2 %/cm, 40 W) in a recirculating experimental system with a flow rate of 2.52<br />
l/s.<br />
Fecal coliform survival ratio<br />
1<br />
0.1<br />
0.01<br />
0.001<br />
1<br />
0.1<br />
0.01<br />
0.001<br />
D<br />
G<br />
H<br />
0 500 1000 1500 2000<br />
A<br />
E<br />
G<br />
Disinfection time (s)<br />
0 500 1000 1500 2000<br />
Disinfection time (s)<br />
Figure 7 Fecal coliform survival ratio versus disinfection time for different flow rates of<br />
treatments E (0.63 l/s), A (1.26 l/s), G (2.52 l/s) in a recirculating experimental system<br />
with a 25 W UV unit and similar UV254 transmittances of A (54.2 %/cm), E (57.6 %/cm)<br />
and G (52.1 %/cm).<br />
The impact of transmittance was less pronounced for <strong>the</strong> 25 W unit when flow rate<br />
increased from 1.26 to 2.52 l/s (Figure 6). Although <strong>the</strong> difference of UV transmittance<br />
between treatments D (25.3 %/cm) and G (52.1 %/cm) was significant, <strong>the</strong> decline of<br />
7
survival ratio was similar (final ratios were 0.0066 and 0.0057, respectively). This was<br />
because <strong>the</strong> high flow rate might have provided all parts of <strong>the</strong> flow stream with more<br />
probability to be exposed in high UV intensity condition. Figure 6 also shows that <strong>the</strong><br />
FC survival ratio of treatment H (40 W unit) declined more quickly than that of D and G<br />
(25 W unit).<br />
Water flow rate was ano<strong>the</strong>r key factor impacting UV disinfection efficiency.<br />
Treatments A (54.2%/cm), E (57.6 %/cm) and G (52.1 %/cm) had similar UV<br />
transmittance levels, but showed different results because of <strong>the</strong> flow rate difference<br />
(Figure 7). Treatment A (1.26 l/s flow rate) had a final survival ratio of 0.012.<br />
Treatment E, with <strong>the</strong> lowest flow rate (0.63 l/s), resulted in a ratio of 0.0315, much<br />
higher than A. The highest flow rate of treatment G (2.56 l/s) produced <strong>the</strong> lowest final<br />
ratio (0.0057). Reasons for <strong>the</strong> results can be explained below. Although a low flow rate<br />
increased <strong>the</strong> UV dosage of <strong>the</strong> flow-through an UV unit, <strong>the</strong> disinfecting opportunity of<br />
<strong>the</strong> water through <strong>the</strong> UV unit would be reduced because of <strong>the</strong> reduced number of<br />
cycles. Moreover, although high UV dosage may kill more bacteria flowing through <strong>the</strong><br />
UV unit, <strong>the</strong> disinfection efficiency per unit of UV intensity would be low. With <strong>the</strong><br />
increase in flow rate, <strong>the</strong> UV disinfection effciency rose even more for <strong>the</strong> treatments<br />
using <strong>the</strong> 40 W unit (H and I in Figure 8) than those using <strong>the</strong> 25 W unit. FC survival<br />
ratio of H (2.52 l/s flow rate) at <strong>the</strong> time of 1350 s was 0.0033 which was only one fourth<br />
that of treatment I (1.26 l/s flow rate). Therefore, in order to obtain a better disinfection<br />
result, a high flow rate was more desirable for a high power UV unit.<br />
The FC disinfection generally approached an exponential function of UV reacting time in<br />
a recirculating system, as shown in Figures 2, 4, 5, 6, 7 and 8. These results were<br />
obtained in controlled conditions without continuous FC sources. In reality, UV devices<br />
are operated in various conditions.<br />
Fecal coliform survival ratio<br />
1<br />
0.1<br />
0.01<br />
0.001<br />
Figure 8 Fecal coliform survival ratio versus disinfection time for different flow rates of<br />
treatment H (2.52 l/s) and I (1.26 l/s) in a recirculating experimental system with a 40 W<br />
UV unit and similar water UV254 transmittances of H (38.2 %/cm) and I (39.4 %/cm).<br />
Conclusions<br />
0 500 1000 1500 2000<br />
Disinfection time (s)<br />
(1) The UV devices were highly effective for FC disinfection under all experimental<br />
conditions. Only about 1% FC could survive after 7 cycles through <strong>the</strong> 25 UV unit<br />
and 5 cycles through <strong>the</strong> 40 UV one.<br />
8<br />
H<br />
I
(2) UV254 transmittance was an important factor affecting <strong>the</strong> disinfection efficiency of<br />
UV units. A high UV254 transmittance generally resulted in a high disinfection<br />
efficiency, but <strong>the</strong> increment of efficiency was not obvious for a low power UV unit<br />
working at a high flow rate (e.g., 25 W UV unit at 2.52 l/s flow rate).<br />
(3) To obtain high disinfection efficiency, maintaining a sufficient flow rate was<br />
necessary for a recirculating UV disinfection system, especially for a high power UV<br />
unit working with low UV transmittance wastewater.<br />
Acknowledgements<br />
This study was funded by a grant from <strong>the</strong> Saltonstall-Kennedy Program, <strong>National</strong><br />
Marine Fisheries Service, Award Number NA76FD0300. The authors thank Shauna<br />
Mason and Michael Martin for assisting in sample collection and analysis.<br />
References<br />
APHA, 1995. Standard methods for <strong>the</strong> examination of water and wastewater (19th<br />
edition). American Public Health Association, American Water Works Association,<br />
Water Environment Federation, Washington, DC.<br />
Darby, J.L., Snider, K.E., Tchobanoglous, G., 1993. Ultraviolet disinfection for<br />
wastewater reclamation and reuse subject to restrictive standards. Water<br />
Environment Research 65 (2): 169-180.<br />
Downey, D., Giles, D.K., Delwiche, M.J., MacDonald, J.D., 1998. Development and<br />
validation of a general model for predicting biological efficacy of UV reactors against<br />
plant pathogens in irrigation water. Transactions of <strong>the</strong> ASAE 41 (3): 849-857.<br />
Emerick, R.W., Loge, F.J., Thompson, D., Darby, J.L., 1999. Factors influencing<br />
ultraviolet disinfection performance part II: association of coliform bacteria with<br />
wastewater particles. Water Environment Research 71 (6): 1178-1187.<br />
Hanzon, B.D., Vigilia, R., 1999. UV disinfection. Wastewater Technology 2 (3): 24-28.<br />
Ho, C.H., Pitt, P., Mamais, D., Chiu, C., and Jolis, D., 1998. Evaluation of UV<br />
disinfection systems for large-scale secondary effluent. Water Environment Research<br />
70 (6): 1142-1150.<br />
Johnson, J.D., Qualls, R.G., 1984. Ultraviolet disinfection of a secondary effluent:<br />
measurement of dose and effects of filtration. EPA-600/S2-84-160, U. S. EPA,<br />
Municipal Environmental Research Laboratory, Cincinnati, Ohio, USA. 8 pp.<br />
Moreland, V., Asahina, A., Unutoa, T., Fujioka, R., 1998. UV disinfection: to pilot or<br />
not to pilot. Water Environment and technology 10 (6): 47-51.<br />
Nieuwstad, T.J., Havelaar, A.H., van Olphen, M., 1991. Hydraulic and microbiological<br />
characterization of reactors for ultraviolet disinfection of secondary wastewater<br />
effluent. Water Research 25 (7): 775-783.<br />
U.S. Environmental Protection Agency, 1986. Design manual: municipal wastewater<br />
disinfection. EPA/625/1-86/021, Office of Research and Development, Water<br />
Engineering Research Laboratory, Cincinnati, Ohio, pp.157-244.<br />
9
Effects of Baffle Depth on Oxygenation at <strong>the</strong> Pumping<br />
Station of Intensive Bioproduction<br />
Korean (IBK) Recirculating Aquaculture System<br />
Introduction<br />
Jae-Yoon Jo<br />
Professor of Aquaculture, Department of Aquaculture<br />
Pukyong <strong>National</strong> University, Pusan 608-737, Korea<br />
In-Bae Kim<br />
Professor Emeritus<br />
Pukyong <strong>National</strong> University<br />
Pusan 608-737 Korea<br />
Jin Hwan Lee<br />
Graduate Student<br />
Department of Aquaculture<br />
Pukyong <strong>National</strong> University<br />
Pusan, 608-737 Korea<br />
1<br />
Jeonghwan Park<br />
Graduate Student<br />
Pukyong <strong>National</strong> University<br />
Pusan 608-737, Korea<br />
Kuen-Hack Suh<br />
Professor of Chemical Engineering<br />
Department of Chemical Engineering,<br />
Pukyong <strong>National</strong> University<br />
Pusan, 608-707 Korea<br />
Dissolved oxygen is one of <strong>the</strong> most important water quality parameters for<br />
aquaculture and maintaining proper concentration in a high density recirculating<br />
aquaculture system is always important for both fish and nitrifiers. Therefore a variety of<br />
aeration devices are employed or pure oxygen is applied in <strong>the</strong> culture system. But extra<br />
energy or cost is needed to operate <strong>the</strong> aeration devices or to supply <strong>the</strong> pure oxygen.<br />
Their efficiency is varying but all devices have to add up to <strong>the</strong> production costs. It is<br />
known that cost of oxygen supply is highest in <strong>the</strong> total expenditure of aquaculture except<br />
for feed cost. The percentage of aeration cost to <strong>the</strong> total expenditure in rainbow trout<br />
culture, hatchery, and recirculating aquaculture was 13-15%, 23% (Petit 1990), and<br />
8.6%(Timmons and Aho 1998), respectively. Therefore proper devices have to be<br />
selected for <strong>the</strong> reduction of production cost. In <strong>the</strong> Intensive Bioproduction Korean<br />
(IBK) recirculating aquaculture system, circulating pump(s) also supplies oxygen into<br />
water while circulating <strong>the</strong> water. Since a lot of bubbles are formed in <strong>the</strong> pumping<br />
process, oxygen is easily transferred to <strong>the</strong> water. The efficiency of oxygen transfer ratio<br />
(OTR) is positively related with contact time between bubbles and water but is negatively<br />
related with bubble size. Water temperature also affects <strong>the</strong> saturation point of oxygen.<br />
Therefore, OTR and aeration effectiveness (AE) were compared with <strong>the</strong> combinations of<br />
two different water temperatures (20 o C and 30 o C) and 4 different baffle depths (0, 50,<br />
100, and 150 cm) at <strong>the</strong> IBK recirculating aquaculture system to check <strong>the</strong> effect of<br />
temperatures and baffle depths on OTR and AE. .
Materials and Method<br />
Schematic drawing of <strong>the</strong> pumping station of IBK system is shown in Figure 1. The<br />
pumping station is constructed of concrete and is consists of water supply channel,<br />
pumping site, pumps, U-shaped mixing chamber, baffle, and water discharge channel.<br />
Water from rearing tanks flows into water supply channel and is pumped into <strong>the</strong> Ushaped<br />
mixing chamber by axial flow vertical pump(s). The U-shaped mixing chamber is<br />
1.5 m long and 2.0 m deep, and is divided into two parts by a baffle plate, and <strong>the</strong> depth<br />
of water path is manipulated by changing <strong>the</strong> depths of <strong>the</strong> baffle, 0 cm (control, without<br />
baffle), 50 cm, 100 cm, and 150 cm. Then water flows through <strong>the</strong> discharge channel and<br />
is fed into <strong>the</strong> biological filter chamber.<br />
Oxygen transfer rate (OTR) and aeration effectiveness (AE) were determined at<br />
20 o C and 30 o C with each of <strong>the</strong> 4 different baffle depths. Total water volume in <strong>the</strong><br />
system was 250 kL and <strong>the</strong> flow rate by a 3.5 kW mixed flow vertical pump was 370 kL<br />
per hour. Oxygen concentration was monitored by 4-Channel Multi Logger System<br />
(Oxygard, Denmark) and recorded automatically every 30 seconds.<br />
Figure 1. Schematic drawing of <strong>the</strong> pumping station of IBK system.<br />
(a): Plan view; (b): Side view; (1): Supply channel; (2): Vertical pump;<br />
(3): U-shaped a mixing chamber; (4): Baffle; (5): Discharge channel.<br />
Results and Discussion<br />
As shown in Table 1, dissolved oxygen (DO) concentration in <strong>the</strong> water was<br />
considerably increased in <strong>the</strong> U-shaped mixing chamber. The DO was increased by 2.1 to<br />
2.6 mg/L at 20 o C, while that at 30 o C by 1.9 to 2.7 mg/L. The OTR and AE at 20 o C were<br />
777 to 962 g O2/hr and 43.2% to 58.2%, respectively, while those at 30 o C were 703 to<br />
2
999 g O2/hr and 48.5% to 57%, respectively. In <strong>the</strong> experiment at 20 o C, OTR at <strong>the</strong> baffle<br />
depths of 100 cm and 150 cm was significantly higher than that of control while AE of all<br />
baffles were significantly higher than that of <strong>the</strong> control. In <strong>the</strong> experiment at 30 o C, OTR<br />
at all baffles were significantly higher than <strong>the</strong> control while AE with baffle depths of<br />
150 cm was significantly higher than that of <strong>the</strong> control.<br />
It is hard to compare <strong>the</strong> AE value of this experiment with o<strong>the</strong>rs because of <strong>the</strong><br />
differences in experimental conditions. However, Soderberg (1982) reported <strong>the</strong> aeration<br />
efficiencies of some gravity aerators with various distances of waterfall, showing <strong>the</strong><br />
efficiency increase with <strong>the</strong> increase of <strong>the</strong> distance of waterfall. In this experiment, <strong>the</strong><br />
AE was ranged from 43% to 58.1% and was affected by baffle depths. Average OTR and<br />
AE were increased by increasing baffle depth at both temperatures, 20 o C and 30 o C.<br />
Net oxygen transfer depends upon <strong>the</strong> temperature, <strong>the</strong> contact area of air-water<br />
interface, and contact time (Haney 1954; Spotte 1992; Lawson 1995). In this experiment,<br />
<strong>the</strong>re are strong trends that increasing baffle depths increased <strong>the</strong> contact time of bubbles<br />
with water, leading to enhanced oxygen transfer, that is, <strong>the</strong> deeper <strong>the</strong> baffle <strong>the</strong> higher<br />
<strong>the</strong> OTR and AE at both temperatures.<br />
Table 1. Effects of baffle depths in <strong>the</strong> pumping station in <strong>the</strong> IBK recirculating<br />
aquaculture system on oxygen transfer rate (OTR) and aeration efficiency (AE)<br />
at two different temperatures<br />
Baffle Depth (cm)<br />
0 (control) 50<br />
20<br />
100 150<br />
o C<br />
Av. DO (mg/L)<br />
Inlet<br />
Outlet<br />
4.3<br />
6.4<br />
4.6<br />
6.8<br />
4.7<br />
7.0<br />
4.8<br />
7.4<br />
Increased DO (mg/L) 2.1 2.2 2.3 2.6<br />
AE (%) 43.2±1.98c 51.5±2.70b 52.5±1.60b 58.1±2.74a<br />
OTR (g O2/hr) 777±35.4c 814±18.5bc 851±35.4ab 962±63.2a<br />
Added DO by baffle (g O2/hr) 0 37 74 185<br />
30 o C<br />
Av. DO (mg/L)<br />
Inlet<br />
Outlet<br />
3.6<br />
5.5<br />
2.9<br />
5.1<br />
2.8<br />
5.2<br />
2.8<br />
5.5<br />
Increased DO (mg/L) 1.9 2.2 2.4 2.7<br />
AE (%) 48.5±0.67b 47.9±1.85b 50.9±5.95b 57.0±2.20a<br />
OTR (g O2/hr) 703±42.7c 814±55.5b 888±92.3b 999±30.2a<br />
Added DO by baffle (g O2/hr) 0 111 185 296<br />
The oxygen concentration increase at 20 o C from inlet to outlet of <strong>the</strong> U-shaped<br />
mixing chamber was 2.1 mg/L without baffle, and 2.6 mg/L with 150 cm baffle. There<br />
are strong trends that <strong>the</strong> oxygen transfer rate increased to a large extent with increasing<br />
baffle depth.<br />
The amount of oxygen transferred by <strong>the</strong> cascading water in <strong>the</strong> pumping station of<br />
<strong>the</strong> IBK recirculating aquaculture system is considerable from <strong>the</strong> first. Providing Ushaped<br />
water-bubble mixing chamber can fur<strong>the</strong>r enhance <strong>the</strong> efficiency. In this<br />
experiment at 20 o C, an amount of 777 g oxygen per hour was increased without baffle<br />
plate, and with 150 cm deep baffle, 962 g of oxygen per hour was increased. Therefore<br />
3
<strong>the</strong> amount of added increase by providing 150 cm baffle was 185 g oxygen per hour or<br />
4,440 g per day.<br />
During <strong>the</strong> time of high temperature in <strong>the</strong> summer season <strong>the</strong> water temperature in <strong>the</strong><br />
IBK system increases to 30 o C or higher for an extended length of time and much more<br />
oxygen is consumed by <strong>the</strong> fish and oxygen concentration decreases after passing through<br />
fish rearing tanks. The concentration of oxygen in <strong>the</strong> inlet water of <strong>the</strong> pumping station<br />
at 30 o C, as shown in Table 1, ranged somewhere between 2.8 and 3.6, which were much<br />
lower than those at 20 o C. In <strong>the</strong> experiment at 30 o C, an amount of 703 g oxygen per hour<br />
was increased without baffle plate, and with 150 cm deep baffle, 999 g of oxygen per<br />
hour was increased. Therefore <strong>the</strong> amount of added increase by providing 150 cm baffle<br />
was 296 g oxygen per hour or 7,104 g per day. When we calculate <strong>the</strong>se figures in terms<br />
of <strong>the</strong> local price of pure oxygen, 325 won per kg, <strong>the</strong> added amount of oxygen per day,<br />
7,368 g at 30 o C, is wroth for 2,308 won and this amount leads to a monthly saving of<br />
69,264 won, equivalent to US$63. With fur<strong>the</strong>r improvement of <strong>the</strong> device we expect<br />
saving of <strong>the</strong> cost to a considerable extent.<br />
The oxygen concentration in inlet water, effluent from fish tanks, at 20 o C remained<br />
higher than that at 30 o C. This is due to <strong>the</strong> higher oxygen saturation concentration and<br />
lower oxygen consumption by <strong>the</strong> fish at lower temperature. Never<strong>the</strong>less, oxygen<br />
transfer rate and AE at 20 o C water were not much different from those at 30 because of<br />
higher DO of inlet water. Oxygen transfer rate and AE were increased with <strong>the</strong> increase<br />
of baffle depth. Therefore, <strong>the</strong> deeper baffle depth significantly enhances not only <strong>the</strong><br />
oxygen concentration but also <strong>the</strong> OTR and AE in <strong>the</strong> IBK system without additional<br />
power consumption.<br />
Conclusion<br />
The effects of baffle depths, 0, 50, 100, and 150 cm, in <strong>the</strong> U-shaped mixing<br />
chamber at <strong>the</strong> pumping station of <strong>the</strong> Intensive Bioproduction Korean (IBK)<br />
recirculating aquaculture system on oxygen transfer rate (OTR) and aeration<br />
effectiveness (AE) were tested.<br />
The OTR and AE were increased with increasing baffle depth both at 20 o C and 30 o C<br />
without extra energy. The oxygen transfer efficiency through <strong>the</strong> U-shaped mixing<br />
chamber with deeper baffle plate up to 150 cm was much more effective than shallower<br />
baffles to enhance dissolved oxygen in <strong>the</strong> IBK system.<br />
Total amount of oxygen transferred with <strong>the</strong> baffle depth of 150 cm was 999 g/hr<br />
with an increase of 296 g O2/hr compared to control at 30 . This leads to added amount<br />
of 213 kg O2 per month, and we expect fur<strong>the</strong>r improvement in future.<br />
Acknowledgement<br />
This work was supported by research grant from <strong>the</strong> Research Center for Ocean<br />
Industrial Development (RCOID), Pukyong <strong>National</strong> University, designated by <strong>the</strong> Korea<br />
Science and Engineering Foundation (KOSEF).<br />
4
References<br />
Haney, P.D. “Theoretical Principles of Aeration”. J. American Water Works Association.<br />
46 (1954):353-376.<br />
Lawson, T.B. Fundamentals of Aquacultural Engineering. New York. Chapman & Hall.<br />
1995.<br />
Petit, J.1990. Water Supply, Treatment and Recycling in Aquaculture. Aquaculture 1. New<br />
York. Ellise Horwood. 1990.<br />
Soderberg, R.W. “Aeration of Water Supplies for Fish Culture in Flowing Water”.<br />
Progressive Fish Culturist. 44 (1969): 89-93.<br />
Spotte, S.H. Captive <strong>Sea</strong>water Fishes, Science and Technology. New York. John Wiley<br />
and Sons, Inc.1992<br />
Timmons, M., and P.W. Aho. “Comparison of Aquaculture and Broiler Production<br />
Systems.” Proceedings of <strong>the</strong> Second International Conference on Recirculating<br />
Aquaculture. G.S. Libey. M.B. Timmons (Eds). Roanoke, Virginia. 1998.<br />
5
Oxygen Management at a Commercial Recirculating<br />
Aquaculture Farm producing Atlantic Salmon<br />
(Salmo salar) Smolts<br />
Edward Parker, B.Sc.<br />
M.Sc. Biology candidate<br />
University of New<br />
Brunswick<br />
Fredericton, NB, Canada<br />
E3B 5A3<br />
Introduction<br />
Tillmann Benfey, Ph.D.<br />
Professor<br />
Department of Biology<br />
University of New Brunswick<br />
Fredericton, NB, Canada<br />
E3B 5A3<br />
Michel Couturier, Ph.D.<br />
Professor<br />
Department of Chemical Engineering<br />
University of New Brunswick<br />
Fredericton, NB, Canada<br />
E3B 5A3<br />
The effective management of dissolved oxygen (DO) levels is <strong>the</strong> most critical factor in <strong>the</strong><br />
operation of commercial recirculating aquaculture systems. The fish, nitrifying bacteria in<br />
<strong>the</strong> biofilter, and heterotrophic bacteria that feed on <strong>the</strong> uneaten food and organic wastes all<br />
need oxygen. Close control of <strong>the</strong> DO level is critical because failure of <strong>the</strong> aeration or<br />
oxygenation system can lead to a total loss of <strong>the</strong> crop within minutes.<br />
Atlantic salmon (Salmo salar) smolt production facilities are intensive aquaculture systems<br />
in which direct oxygenation must be used toge<strong>the</strong>r with aeration to meet <strong>the</strong> oxygen demand<br />
of <strong>the</strong> fish and bacteria. However, it is crucial that oxygen gas be used efficiently because<br />
it is expensive. The commercial profitability of <strong>the</strong>se systems can be improved directly<br />
through decreased oxygen expenses or indirectly through better system performance.<br />
This paper will discuss oxygen management at a commercial freshwater recirculating<br />
aquaculture farm annually producing 400,000 Atlantic salmon smolts in New Brunswick,<br />
Canada. About 68,000 kg of pure oxygen is consumed per production cycle at this facility.<br />
The oxygen is stored in bulk on site and injected into <strong>the</strong> water by bubble diffusers and low<br />
head oxygenator (LHO) units. The level of DO in each tank is controlled by manual<br />
adjustment of <strong>the</strong> flow of injected oxygen. The objectives of this study were to determine<br />
<strong>the</strong> oxygen utilization efficiency of <strong>the</strong> system and to test <strong>the</strong> effectiveness of an automatic<br />
on/off DO control system.<br />
1
System Description<br />
A schematic of <strong>the</strong> recirculating system on which this study was done is provided in Figure<br />
1. Before entering <strong>the</strong> settledeck, which serves as a water reservoir and sedimentation tank,<br />
<strong>the</strong> make-up water from an artesian well is ozonated and heated. Water from <strong>the</strong> settledeck<br />
is pumped to three fluidised sand-bed nitrification biofilters. After each nitrification<br />
biofilter, <strong>the</strong> water is degased by bubbling atmospheric air into <strong>the</strong> water and oxygenated<br />
by an LHO unit. The water <strong>the</strong>n flows to <strong>the</strong> tank field where twenty 33 m 3 double drain<br />
tanks hold <strong>the</strong> fish. Within each tank is a bubble diffuser for adding pure oxygen into <strong>the</strong><br />
water and an airlift pump for creating current. Most of <strong>the</strong> water exits <strong>the</strong> tanks from <strong>the</strong><br />
middle of <strong>the</strong> water column and flows directly back to <strong>the</strong> settledeck. The remainder exits<br />
from <strong>the</strong> bottom and is treated by a swirl separator and microscreen drumfilter to remove<br />
solids before flowing back to <strong>the</strong> settledeck. Effluent water exits <strong>the</strong> recirculating system<br />
through an overflow pipe located in <strong>the</strong> settledeck and a discharge pipe located at <strong>the</strong> bottom<br />
of <strong>the</strong> swirl separator. The recirculating system operates at a 95 to 96% recirculation rate,<br />
meaning that 5% to 4%, respectively, of <strong>the</strong> system flow is exchanged during each turnover.<br />
Well<br />
Ozone<br />
Heat<br />
S ettled ec k<br />
Degaser<br />
LHO<br />
Tank Field<br />
Twenty 33 m3 Fish Tanks<br />
60 %<br />
40 %<br />
LHO<br />
W astew ater Treatm ent System<br />
Degaser Degaser<br />
Swirl<br />
Separator<br />
Microscreen<br />
Figure 1: Layout sketch of <strong>the</strong> recirculating aquaculture system, with arrows showing<br />
direction of water flow.<br />
Methods<br />
The amount of DO added by <strong>the</strong> make-up water, LHO units, degasers, bubble diffusers, and<br />
settledeck, and <strong>the</strong> amount consumed by <strong>the</strong> effluent, nitrification biofilters, settledeck and<br />
fish, was obtained by performing oxygen and water mass balances at five system biomasses<br />
of 4076, 7889, 8180, 10093, and 12743 kg. The mass of DO added or consumed by each<br />
unit was obtained by multiplying <strong>the</strong> measured water flow rate by <strong>the</strong> difference between<br />
2<br />
LHO
<strong>the</strong> outlet and inlet DO concentrations. The DO consumed by <strong>the</strong> fish (oxygen consumption<br />
rate) was calculated by measuring <strong>the</strong> rate of DO decrease in <strong>the</strong> fish tank while water and<br />
oxygen flow through <strong>the</strong> bubble diffusers were turned off.<br />
The effectiveness of an automatic on/off DO control system to control fish tank DO at 100%<br />
was tested on 4 different tanks. DO levels before and during DO control were logged once<br />
a minute for 24 hours and compared.<br />
Results and Discussion<br />
Figure 2 shows kg DO/day added to <strong>the</strong> recirculating system by <strong>the</strong> make-up water, LHO<br />
units, degasers and bubble diffusers at <strong>the</strong> five system biomasses. Most DO was added by<br />
<strong>the</strong> bubble diffusers and LHO units, which had average absorption efficiencies of 72% and<br />
DO added (kg/day)<br />
90<br />
80<br />
70<br />
60<br />
50<br />
40<br />
30<br />
20<br />
10<br />
0<br />
4076 7889 8180 10093 12743<br />
System biomass (kg)<br />
Figure 2: DO added to <strong>the</strong> recirculating system.<br />
DO consumed (kg/day)<br />
90<br />
80<br />
70<br />
60<br />
50<br />
40<br />
30<br />
20<br />
10<br />
0<br />
-10<br />
4076 7889 8180 10093 12743<br />
System biomass (kg)<br />
Effluent<br />
Make-up<br />
LHO units<br />
Degasers<br />
Bubble diffusers<br />
75%, respectively. LHO unit absorption efficiency decreased linearly with increasing gasto-liquid<br />
ratio.<br />
Figure 3 shows kg DO/day consumed within <strong>the</strong> recirculating system by <strong>the</strong> effluent water,<br />
Figure 3: DO consumed by <strong>the</strong> recirculating aquaculture system.<br />
3<br />
Total<br />
Nitrification biofilters<br />
Settledeck<br />
Fish<br />
Total
nitrification biofilters, settledeck and fish at <strong>the</strong> five system biomasses. Most DO was<br />
consumed by <strong>the</strong> fish and nitrification biofilters. Fish DO consumption did not vary with<br />
system biomass and averaged 0.5 kg DO/kg feed (72% of <strong>the</strong> total) during daylight hours.<br />
Nitrification biofilter DO consumption averaged 0.12 kg DO/kg feed (17% of <strong>the</strong> total).<br />
However, not all of <strong>the</strong> DO consumed by <strong>the</strong> nitrification biofilters was for nitrification<br />
because an average of 6.86 kg DO were consumed/kg total ammonia-nitrogen removed in<br />
<strong>the</strong> nitrification biofilters. This is more than expected for nitrification alone.<br />
Figure 4 shows <strong>the</strong> wide fluctuations in DO observed in fish tanks over 24 hours when<br />
oxygen flow rate through <strong>the</strong> bubble diffuser is constant. Without control or adjustment of<br />
oxygen flow through <strong>the</strong> bubble diffuser, it is continually supplying enough oxygen to meet<br />
peak DO demand throughout <strong>the</strong> day but DO concentrations rise greatly at night when fish<br />
DO (mg/L)<br />
18<br />
17<br />
16<br />
15<br />
14<br />
13<br />
12<br />
11<br />
fed fed fed<br />
9 10 11 12 13 14 15 16 17 18 19 20 21 22 23 24 1 2 3 4 5 6 7 8<br />
Time<br />
4<br />
sunset<br />
sunrise<br />
Figure 4: DO levels over 24 hours in a fish tank when oxygen addition rate is kept<br />
constant.<br />
Inflow<br />
Tank<br />
Outlet<br />
Outlet<br />
DO demand is least. The automatic DO control system eliminated <strong>the</strong> wide fluctuations in<br />
fish tank DO and proved to be effective at controlling it at 100%.<br />
Conclusions<br />
In total, an average of 26% of <strong>the</strong> pure oxygen that flowed through <strong>the</strong> LHO units and<br />
bubble diffusers at each system biomass was lost due to absorption inefficiencies. On<br />
average, 11% of <strong>the</strong> total DO consumed at each system biomass was due to processes or<br />
components o<strong>the</strong>r than <strong>the</strong> fish and nitrification biofilters. Fish DO consumption during<br />
100%
daylight hours averaged 0.5 kg DO/kg feed (72% of <strong>the</strong> total). The total DO consumption<br />
for <strong>the</strong> recirculating system at each system biomass averaged 0.73 kg DO/kg feed. The<br />
automatic on/off DO control system was effective at controlling <strong>the</strong> fish tank DO at 100%<br />
saturation. Control of DO concentration at levels not exceeding 100% saturation is key in<br />
<strong>the</strong> proper management of oxygen in recirculating systems. Loss of oxygen to <strong>the</strong><br />
atmosphere can be significant at higher concentrations.<br />
Acknowledgments<br />
This research was funded by <strong>the</strong> New Brunswick Department of Fisheries and Aquaculture.<br />
5
Ozone Dose and Equilibrium TOC in Recirculating Systems<br />
Valdis Krumins,<br />
Faculty Research Associate<br />
Introduction<br />
James Ebeling,<br />
Research Assistant<br />
Department of Biological Resources Engineering<br />
University of Maryland, College Park<br />
1<br />
Fred Wheaton,<br />
Professor and Chair<br />
Ozone is applied to recirculating aquaculture systems (RAS) for many purposes,<br />
including color and organic carbon removal. Although <strong>the</strong> interaction of ozone with<br />
organics in RAS is complex, it is suggested that ozonation decreases organic carbon<br />
concentrations by: 1) direct oxidation of organic compounds 2) coagulation of<br />
particulates into larger ones more easily removed by mechanical filtration, and 3)<br />
breaking down large, “refractory,” organic molecules into more biodegradable ones.<br />
Several authors have confirmed that ozone does decrease <strong>the</strong> amount of organic<br />
carbon in recirculating systems. Brazil et al, (1996) compared <strong>the</strong> water quality in<br />
systems receiving ozone to controls. While <strong>the</strong>y found no significant differences in<br />
dissolved organic carbon (DOC), <strong>the</strong> ratio of DOC to cumulative feed in <strong>the</strong> treated units<br />
was significantly different from <strong>the</strong> control. Summerfelt et al (1997) found that<br />
ozonation reduced DOC levels by approximately 17%, although <strong>the</strong> reductions for two<br />
different ozone dosage rates were ‘similar.’ This report presents <strong>the</strong> progress of an<br />
experiment to quantify <strong>the</strong> decrement in organic carbon as a function of <strong>the</strong> ozone dose.<br />
Methods<br />
Two identical recirculating aquaculture systems were used in this experiment.<br />
Ozone was added to only one system at a time. The systems are described elsewhere<br />
(system #1, Ebeling et al, 1997), and consist of a 2 m 3 culture tank, 60μm rotating microscreen<br />
filter, and 57 L (bed volume) bubble-washed bead biofilter. The water flow rate<br />
was 60-65 L/min. For <strong>the</strong> ozonation runs, an Emperor Aquatics “Atomizer” ozone<br />
contactor was installed between <strong>the</strong> screen filter and <strong>the</strong> bead filter. The systems were<br />
stocked with 54-80 kg of hybrid striped bass, weighing 270 – 560 g each. Each tank was<br />
fed 1.5% - 1% of biomass (800 g feed) daily.<br />
Tanks were drained and cleaned at <strong>the</strong> start of each test, which ran for 28 days.<br />
Ozone was added at a rate of 0 g/d (control), 8 g/d, 12 g/d and 24 g/d (0, 10, 15 and 30 g<br />
ozone / kg feed). Water samples were collected each morning before feeding and<br />
analyzed for total organic carbon (TOC) using a Shimadzu TOC-5050A analyzer.
At this time, <strong>the</strong> control (both tanks), 8 g/d (tank 1), and 12 g/d (both tanks)<br />
experimental trials have been completed. Preliminary experiments were run on both<br />
tanks at <strong>the</strong> 24 g/d dose. However, <strong>the</strong>se trials lasted 7-10 days and did not start with<br />
“clean” water. (Trials were started with a feed burden of 1.2 and 2.1 g/L in tanks 1 and 3,<br />
respectively.)<br />
Results and Discussion<br />
Cumulative feed burden (CFB) is a concept championed by Dr. Dallas Weaver to<br />
compare <strong>the</strong> water use efficiency among systems with different management schemes for<br />
feeding or water replacement. It is simply <strong>the</strong> weight of all of <strong>the</strong> feed ever put into <strong>the</strong><br />
TOC (mg / L)<br />
35<br />
30<br />
25<br />
20<br />
15<br />
10<br />
5<br />
tank 1 no ozone tank 3 no ozone<br />
tank 1 12 g/d tank 3 12 g/d<br />
tank 1 8 g/d tank 1 24 g/d<br />
tank 3 24 g/d<br />
0<br />
0 1 2 3 4 5 6 7 8<br />
Cumulative Feed Burden (g / L)<br />
Figure 1. Total organic carbon with accumulating feed burden. Two runs (tanks 1 and 3) each for<br />
control, 12 g/d and 24 g/d ozone, only tank 1 data available for <strong>the</strong> 8 g/d run. 24 g/d runs began with<br />
“dirty” (CFB ≠ 0) water.<br />
tank, divided by <strong>the</strong> system volume. If system water is flushed and replaced with clean<br />
water, <strong>the</strong> CFB is multiplied by exp(-V/Vtot), where V is <strong>the</strong> volume of water replaced,<br />
and Vtot is <strong>the</strong> total system volume. Although CFB only truly applies to inert components<br />
of <strong>the</strong> feed (that do not break down), it can be used to model system water organic<br />
carbon, a large portion of which is resistant to biological decomposition. CFB starts at<br />
zero when <strong>the</strong> tanks are filled with clean water and freshly stocked with fish. It rises<br />
2
somewhat every day with feeding, and drops when <strong>the</strong> bead filters are flushed or water is<br />
o<strong>the</strong>rwise exchanged. Eventually, <strong>the</strong> systems reach equilibrium, where <strong>the</strong> amount of<br />
flushed material balances <strong>the</strong> amount of feed. For systems that have been operating for a<br />
long time, CFB is <strong>the</strong> daily feed rate divided by <strong>the</strong> daily water exchange.<br />
Figure 1 plots <strong>the</strong> morning TOC concentrations as a function of CFB. Initially,<br />
TOC concentrations rise rapidly, <strong>the</strong>n appear to level off after a CFB of 2 g/L. The fact<br />
that TOC remains constant even with increasing CFB indicates that organic carbon is<br />
being removed by some mechanism o<strong>the</strong>r than flushing. Therefore, ra<strong>the</strong>r than analyzing<br />
<strong>the</strong> data as TOC/CFB (similar to Brazil et al, 1996), all <strong>the</strong> data collected after <strong>the</strong> CFB<br />
reaches 2 g/L are considered to be “in equilibrium,” and analyzed by a two-factor<br />
ANOVA (general linear model, SAS Institute, Cary, NC). Table 1 lists <strong>the</strong> resulting<br />
average equilibrium TOC concentrations.<br />
The ANOVA reveals that TOC is significantly (p < 0.001) affected by tank and<br />
ozone dose, but interaction between tank and dose is not significant. For <strong>the</strong> control, 12<br />
and 24 g/d treatments, <strong>the</strong> average equilibrium TOC concentration in tank 3 (16.95 mg/L)<br />
is about 4 mg/L lower than in tank 1 (20.89 mg/L). (The 8 g/d replicate for tank 3 has not<br />
yet been completed; <strong>the</strong>refore, 8 g/d data are not included in <strong>the</strong> mean comparisons.)<br />
This can be seen most clearly for <strong>the</strong> control and 12 g/d runs in Figure 1, where <strong>the</strong> tank 3<br />
curves are consistently lower than <strong>the</strong> corresponding tank 1 curves.<br />
In both tanks, <strong>the</strong> equilibrium TOC concentration with 12 and 24 g/d ozone is<br />
significantly lower than <strong>the</strong> control, although <strong>the</strong> two dosage rates do not differ<br />
significantly from each o<strong>the</strong>r. For <strong>the</strong> 8 g/d trial in tank 1, <strong>the</strong> TOC was significantly<br />
lower than both <strong>the</strong> no ozone and <strong>the</strong> 12 g/d ozone dose, though not <strong>the</strong> 24 g/d rate.<br />
Table 1. Equilibrium TOC concentration with ozone dose.<br />
Treatment control 8 g/d ozone 12 g/d ozone 24 g/d ozone<br />
Tank 1 only<br />
Tank 3 only<br />
TOC (mg/L) 27.17 a<br />
12.61 b<br />
16.61 c<br />
n 13 5 15 3<br />
3<br />
15.04 b,c<br />
TOC (mg/L) 23.50 a<br />
N/A 14.36 b<br />
n 9 N/A 14 6<br />
Both tanks TOC (mg/L) 25.67 a<br />
N/A 15.52 b<br />
n – number of samples<br />
N/A – Data not available<br />
a, b, c<br />
– data in <strong>the</strong> same row not sharing a letter are significantly different at <strong>the</strong> 0.05 level.<br />
13.19 b<br />
13.81 b<br />
The results show that ozonation decreases organic carbon equilibrium<br />
concentrations, but among <strong>the</strong> ozone doses investigated here, increasing ozone dose does<br />
not seem to change <strong>the</strong> final TOC. In fact, <strong>the</strong> lowest average TOC concentrations were<br />
observed with <strong>the</strong> smallest (nonzero) ozone dose, 8 g/d in tank 1. This result is<br />
surprising, because during <strong>the</strong> 8 g/d run, <strong>the</strong> system water had a slight but noticeable
yellow color, while <strong>the</strong> water in <strong>the</strong> higher ozone treatments was crystal clear. The color<br />
(absorbance) was not quantified in this experiment.<br />
Clearly, more research is needed to determine to what extent equilibrium TOC in<br />
a recirculating system depends on <strong>the</strong> rate of ozone addition.<br />
Conclusions<br />
• TOC concentrations in recirculating systems rise and <strong>the</strong>n level off with water use<br />
(increasing CFB). Equilibrium is reached (in our systems) at about CFB = 2 g/L.<br />
• In <strong>the</strong>se experimental systems, ozonation lowers <strong>the</strong> equilibrium TOC from an<br />
average of about 26 mg/L to approximately 15 mg/L.<br />
• The difference in equilibrium TOC between two identical recirculating systems is<br />
approximately 4 mg/L. This intrinsic variability among systems is not negligible<br />
compared to <strong>the</strong> effect of ozone.<br />
• A difference in equilibrium TOC among <strong>the</strong> different ozone doses could not be<br />
detected.<br />
Acknowledgement<br />
References<br />
This research was supported by <strong>the</strong> Maryland Agricultural Experiment Station.<br />
Brazil, B.L, Summerfelt, S.T., Libey, G. S., “Application of Ozone to Recirculating<br />
Aquaculture Systems.” In: G.S. Libey, M.B. Timmons (eds.), Successes and<br />
Failures in Commercial Recirculating Aquaculture. Conference Proceedings,<br />
Nor<strong>the</strong>ast Regional Agricultural Engineering Service, July 1996, Ithaca, NY, pp.<br />
373-389.<br />
Ebeling, J.M, Hochheimer, J., Singh, S., Wheaton, F. “Preliminary Results and<br />
Description of a Four-Tank (2x2 Factorial Design) Recirculation Solids Removal<br />
and Nitrification Performance Study at <strong>the</strong> University of Maryland.” In:<br />
Timmons, M.B., Losordo, T. (eds.) Advances in Aquacultural Engineering, AES<br />
Proceedings III. NRAES-105. Cornell Cooperative Extension, Ithaca, NY,. 1997.<br />
pp. 11-18.<br />
Summerfelt, S.T., Hankins, J.A., Weber, A., Durant, M.D. “Ozonation of a Recirculating<br />
Rainbow Trout Culture System II: Effects on Microscreen Filtration and Water<br />
Quality.” Aquaculture 158(1997):57-67.<br />
4
Introduction<br />
Genetic Improvement of Fishes for Commercial<br />
Recirculating Aquaculture Systems:<br />
A Case Study Involving Tilapia<br />
Eric M. Hallerman<br />
Department of Fisheries and Wildlife Sciences<br />
Virginia Polytechnic Institute and State University<br />
Blacksburg, VA 24061-0321, USA<br />
A growing sector of aquaculture produces fish not in traditional pond systems, but in<br />
recirculating aquaculture systems (RAS). Development of RAS has tended to emphasize<br />
production systems as opposed to cultured stocks. As <strong>the</strong> RAS sector matures, however,<br />
it becomes appropriate to broaden <strong>the</strong> focus to consider <strong>the</strong> genetics of cultured stocks.<br />
The profitability of aquaculture in RAS will depend, in part, on development of genetic<br />
lines suitable for growth under conditions of high density, sub-optimal water quality, and<br />
so forth.<br />
Fish breeders have a range of choices for pursuing genetic improvement of<br />
aquaculture stocks, including: (1) selective breeding approaches, such as individual or<br />
family selection, and (2) biotechnological approaches, such as gene transfer. This<br />
technical session of <strong>the</strong> conference includes presentations of both selective breeding and<br />
biotechnology-based programs of genetic improvement of stocks for production in RAS.<br />
I will open <strong>the</strong> program with a discussion of selective breeding of tilapia (Oreochromis<br />
sp.) within <strong>the</strong> operations of Blue Ridge Aquaculture (Martinsville, VA), a commercial<br />
production enterprise. Scott Lindell (AquaPartners Technologies, Turners Falls, MA)<br />
discusses strain evaluation and selective breeding of striped bass (Morone saxatilis).<br />
Christopher Kohler (Sou<strong>the</strong>rn Illinois University, Carbondale, IL) <strong>the</strong>n will discuss strain<br />
evaluation and selective breeding of white bass (Morone chrysops). Loren Miller et al.<br />
(University of Minnesota, St. Paul, MN) <strong>the</strong>n will present <strong>the</strong>ir group’s findings in<br />
selective breeding of walleye (Stizostedion vitreum). Over <strong>the</strong> past 15 years, increasing<br />
effort has been committed to application of biotechnological metohds to aquaculture<br />
production. Elliot Entis (A/F Protein, Waltham, MA) discusses <strong>the</strong> development and<br />
imminent commercialization of transgenic Atlantic salmon (Salmo salar) and rainbow<br />
trout (Oncorhynchus mykiss). It is my intent that commercial producers will understand<br />
<strong>the</strong> potential of genetic improvement for enhancing productivity and profitability of <strong>the</strong>ir<br />
operation, and gain insight regarding practical approaches for securing or producing<br />
genetically improved stock.<br />
1
Case Study: Genetic improvement of tilapia at Blue Ridge Aquaculture<br />
Tilapias, Oreochromis sp., are highly suited for production in RAS, showing high<br />
tolerance to crowding, ready acceptance of a wide range of foods, good feed conversion<br />
efficiency, rapid growth rate, and ease of reproduction. They also are amenable to<br />
selective breeding for improvement of certain traits of production interest. I present a<br />
case study of selective breeding of hybrid tilapia, showing how selective breeding can be<br />
practiced in <strong>the</strong> context of commercial production in RAS.<br />
Blue Ridge Aquaculture of Martinsville, Virginia is to my knowledge, <strong>the</strong> world’s<br />
largest producer of tilapia in RAS. Blue Ridge produces over one thousand tons of tilapia<br />
per year, which are sold live in markets in New York, Boston, and Toronto. Most of <strong>the</strong><br />
buyers are Asians, who prefer ei<strong>the</strong>r red or white fish. Blue Ridge concentrates on <strong>the</strong><br />
market for white fish. Hence, <strong>the</strong>ir breeding goals are light body coloration and, of<br />
course, rapid growth rate. Working cooperatively with Blue Ridge Aquaculture, I<br />
approached <strong>the</strong>se goals using <strong>the</strong> tools of classical, quantitative genetics, using withinstrain<br />
selection.<br />
Methods<br />
Genetic resource materials. We started with a typical, commercially obtained gray<br />
tilapia strain with genetic background including <strong>the</strong> well-known Rocky Mountain white<br />
strain.<br />
Production system. Reproducing broodstock are held in two lined ear<strong>the</strong>n ponds in a<br />
greenhouse. Each 20,000 gallon pond holds approximately 90 males and 270 females.<br />
Every seven days, workers collect <strong>the</strong> broodstock and remove eggs or fry from <strong>the</strong><br />
females’ mouths. This not only makes <strong>the</strong> females spawn sooner, but more important<br />
from <strong>the</strong> geneticist’s viewpoint, allows rearing of groups of equal-aged young fish. Some<br />
of <strong>the</strong>se groups ultimately will be subject to selection for purposes of broodstock<br />
replacement. Eggs are taken year-round, with <strong>the</strong> help of supplemental lighting from<br />
August to May.<br />
The eggs are hatched in classical McDonald hatching jars. The fry are transferred to<br />
1200 gallon tanks for rearing to one gram. Fish intended for production are fed methyltestosterone-treated<br />
feed to achieve sex-reversal under an INAD. Fish that are broodstock<br />
candidates do not receive hormone-treated feed, so that we’ll have both sexes. Fish of one<br />
gram are transferred to lined ear<strong>the</strong>n ponds in ano<strong>the</strong>r greenhouse for growth to 30<br />
grams. Fish of thirty grams are transferred into RAS in <strong>the</strong> main production building, to<br />
56,500 gallon tanks for grow-out to 500 grams. Blue Ridge Aquaculture has 42 of <strong>the</strong>se<br />
RAS. It takes about a year to bring a fish from egg to market size. Fish are graded at least<br />
three times through <strong>the</strong> grow-out period (Figure 1). Roughly <strong>the</strong> bottom 10-30% of fish<br />
are discarded through <strong>the</strong> production process depending on <strong>the</strong> number of fish in <strong>the</strong><br />
batch. Blue Ridge Aquaculture regards <strong>the</strong> removal of slow-growing fish as costeffective.<br />
These culling steps also are practiced on <strong>the</strong> broodstock replacement<br />
candidates.<br />
2
Selection. When <strong>the</strong>y reach market size, broodstock candidates are sorted by sex. We<br />
know we will need 500 males and 1400 females as broodstock for <strong>the</strong> next generation.<br />
Knowing how many broodstock replacement candidates of each sex are on hand, we can<br />
determine what proportion to retain, in o<strong>the</strong>r words, what our selection intensity should<br />
be. A sample is taken to determine <strong>the</strong> minimum weight criterion for selection for each<br />
sex. Then, we check every fish, selecting as broodstock only <strong>the</strong> light-colored, rapidly<br />
growing individuals. For example, in <strong>the</strong> second generation, we selected 40% of <strong>the</strong><br />
males and 60% of <strong>the</strong> females grown out. I hasten to add that this final selection step<br />
comes after at least three gradings as described above, so our selection intensities actually<br />
are much higher, roughly 13% for males and 37% for females. We are now in our fourth<br />
generation of selection.<br />
Throughout <strong>the</strong> entire process of rearing broodstock replacement candidates,<br />
prospective broodstock is maintained as two genetic lines, <strong>the</strong> “A” and “B” lines. At<br />
spawning time, males from one line are mated only with females of <strong>the</strong> o<strong>the</strong>r, and vice<br />
versa. The young <strong>the</strong>n are considered part of <strong>the</strong> male parent’s line. This is a simplified<br />
application of <strong>the</strong> rotational line-crossing scheme developed by Kincaid (1977). The<br />
practice of making matings only between <strong>the</strong> lines reduces <strong>the</strong> likelihood of matings<br />
among relatives, and minimizes <strong>the</strong> rate of inbreeding accumulation.<br />
Results and discussion<br />
Body coloration. The typical coloration of <strong>the</strong> tilapia at <strong>the</strong> beginning of <strong>the</strong> selective<br />
breeding program included grey saddle marks over <strong>the</strong> back, and grey coloration along<br />
<strong>the</strong> back. We’ve made clear progress on body coloration. A typical fish from <strong>the</strong> third<br />
generation is silvery white and beautiful (Figure 2), well accepted at <strong>the</strong> market.<br />
Response to selection. Since <strong>the</strong> commercial grower was not interested in producing<br />
fish from a control line that did not undergo selection, we had no direct means of<br />
quantifying improvement of growth rate, i.e., no contemporary comparison of select and<br />
randomly-bred lines. However, I do have data (Table 1) showing that our select line<br />
performs well at Blue Ridge Aquaculture. Compared to <strong>the</strong> DS line from ano<strong>the</strong>r source<br />
simultaneously under production at Blue Ridge Aquaculture, our line showed higher<br />
growth rate (2.30 vs 1.91 grams/day).<br />
Certain o<strong>the</strong>r traits also were improved in response to selection. These traits<br />
apparently are positively correlated with growth rate in this line. These select line<br />
exhibits a better feed conversion ratio (1.53 vs. 1.92) than <strong>the</strong> reference DS line, an FCR<br />
that continues to improve. Though mortality initially was higher than in <strong>the</strong> reference<br />
line, it has improved with each generation. Overall, Blue Ridge Aquaculture is highly<br />
satisfied with its select line.<br />
Selective breeding as an investment. This selective breeding represents what I regard<br />
as <strong>the</strong> minimum scale needed for achieving successful in-house selective breeding. It<br />
represents a commitment to grow equal-aged groups of fish and to maintain and evaluate<br />
broodstock replacement candidates. It represents a commitment of dedicated tank space<br />
3
and human effort. This commitment must be regarded as an investment. On my estimate,<br />
we increased Blue Ridge’s revenues by on <strong>the</strong> order of $200,000 a year, on a research<br />
investment of on <strong>the</strong> order of $50,000 a year. Though it was regarded as a risk at <strong>the</strong><br />
outset, Blue Ridge Aquaculture maintains <strong>the</strong> selective breeding program because it is<br />
justified as a business decision. The cost of committing space and effort to <strong>the</strong> breeding<br />
program led to a positive return on investment.<br />
Should your enterprise undertake a genetic improvement program?<br />
The presentations in this technical session on genetic improvement collectively<br />
provide a number of case studies on genetic improvement of lines for production in<br />
recirculating aquaculture systems. They show that <strong>the</strong>re are many technical possibilities<br />
for approaching genetic improvement. Some producers may prove interested in <strong>the</strong><br />
possibility of starting <strong>the</strong>ir own genetic improvement program. I urge such readers to first<br />
do two things.<br />
First, invest time in becoming familiar with <strong>the</strong> principles of fish breeding. I<br />
recommend that you read Tave (1993), Genetics for fish hatchery managers, or ano<strong>the</strong>r<br />
suitable book on genetic improvement of fishes. As you gain a broad, general<br />
background, you also should read <strong>the</strong> technical literature on genetic improvement of your<br />
species of interest. The literature cited section of your fish breeding book is a good place<br />
to start. For readers interested readers in gaining a more in-depth grounding in <strong>the</strong> <strong>the</strong>ory<br />
underlying selective breeding, I recommend Falconer and Mackay (1996), Introduction to<br />
quantitative genetics.<br />
Second, take <strong>the</strong> time to reach well-considered answers to <strong>the</strong> series of questions<br />
below highlighting key issues regarding genetic improvement of a fish stock. On a basic<br />
level, <strong>the</strong> question is a simple choice: is it worthwhile to develop your own genetically<br />
improved stock, or alternatively, is it more worthwhile to choose <strong>the</strong> best existing stock<br />
for your system? To make this decision, consider <strong>the</strong> following questions carefully:<br />
- What are your breeding goals? Most likely, rapid growth will be a leading goal.<br />
You must decide on one, or possibly two breeding goals. Should you attempt genetic<br />
improvement of many goals simultaneously, you are likely to achieve little genetic<br />
progress towards any of <strong>the</strong>m. Also, you must not change your breeding goals<br />
frequently.<br />
- Do you produce your own seed stock? Selective breeding can go forward only in <strong>the</strong><br />
context of a production program encompassing <strong>the</strong> entire life cycle.<br />
- Do you have <strong>the</strong> infrastructure to hold and performance test your broodstock<br />
candidates? In o<strong>the</strong>r words, do you have <strong>the</strong> means to produce and grow a group of<br />
fish of equal-aged upon which to practice selection?<br />
- Can you do all this and also maintain your production? Commercial producers profit<br />
by selling fish, not by engaging in genetic improvement per se. Do you have<br />
sufficient infrastructure and money to support one or more workers whose effort will<br />
be dedicated to <strong>the</strong> genetic improvement program?<br />
4
If you have answered “yes” to all <strong>the</strong> questions above, <strong>the</strong>n <strong>the</strong> decision to go forward<br />
with an in-house genetic improvement program may be justified. If you are seriously<br />
considering such a commitment, <strong>the</strong>n I pose two additional questions:<br />
- Have you secured <strong>the</strong> cooperation of a professional geneticist? Given your breeding<br />
goals and <strong>the</strong> inevitable economic and logistical constraints, a geneticist can help you<br />
design <strong>the</strong> breeding program that’s most appropriate for your enterprise. The<br />
collaboration of a geneticist will ensure a well-designed program and help avoid<br />
foreseeable errors of experimental design or execution.<br />
- Do you plan to maintain a control, randomly bred line? Maintaining a control line<br />
provides a baseline for comparison to determine whe<strong>the</strong>r and to what degree you<br />
have achieved genetic progress. However, maintaining a control line does consume<br />
resources. You must make a clear-minded decision on whe<strong>the</strong>r or not to maintain a<br />
control line.<br />
If you conclude that developing your own genetically improved line is not appropriate<br />
for you, and I anticipate that this will be <strong>the</strong> conclusion for most producers, <strong>the</strong>n what are<br />
<strong>the</strong> options? It is likely to prove advantageous simply to base your production on <strong>the</strong> best<br />
stock available to you. How, <strong>the</strong>n, would you determine, what stock performs “best”<br />
under your production conditions? You would compare <strong>the</strong> performance of two or more<br />
stocks in your production system at <strong>the</strong> same time under identical conditions. Each stock<br />
should be produced in replicated systems, and <strong>the</strong> results analyzed statistically. A<br />
geneticist can help you design an appropriate experiment for your facility. Then, of<br />
course, you would compare <strong>the</strong> production and costs on your enterprise budget<br />
spreadsheet. The advantage of identifying and producing <strong>the</strong> best stock is considerable<br />
(Lindell et al., this volume; Kohler et al., this volume). Choosing <strong>the</strong> best line can lead to<br />
an improvement in production equal to one or more generations of selective breeding<br />
(Kinghorn 1983).<br />
Genetic improvement as part of your business strategy<br />
Commercial growers should think of genetic improvement as a part of long-term<br />
strategy, like raising production efficiency or improving marketing. Think for a moment<br />
how much of <strong>the</strong> intensification of <strong>the</strong> broiler industry came from genetic improvement.<br />
Over <strong>the</strong> 34 years before 1991, selective breeding contributed an estimated 86% of <strong>the</strong><br />
improvement in weight-at-age (Havenstein et al. 1994).<br />
Since we frequently are working with species that are not very domesticated or<br />
improved, <strong>the</strong> gains can be dramatic. We can exploit great phenotypic variation and high<br />
fecundity. Gains in growth rate from selective breeding have been high, for example,<br />
10% per generation in rainbow trout (Kincaid et al. 1977), 10% per generation in coho<br />
salmon (Hershberger et al. 1990), and 10-30% per generation in Atlantic salmon<br />
(Gjedrem 1979). A key point is that you need a long-term commitment in order to realize<br />
<strong>the</strong>se benefits. Each of <strong>the</strong> successes cited above is <strong>the</strong> result of a long-term commitment,<br />
each with its own background, each a different model of how to go forward.<br />
5
- Harold Kincaid works for <strong>the</strong> US Fish and Wildlife Service, which proved a reliable<br />
source of research support for many years.<br />
- Genetic improvement of Atlantic salmon is <strong>the</strong> result of a breeding cooperative that<br />
Norwegian farmers started, and that <strong>the</strong> government entered later. This program has<br />
gone forward for over 30 years.<br />
- Genetic improvement of coho salmon is an example of cooperation built on<br />
commitment between <strong>the</strong> University of Washington, Dom<strong>Sea</strong> Farms – a commercial<br />
producer, and <strong>Sea</strong> Grant – a program of <strong>the</strong> U.S. Department of Commerce.<br />
The key point is that success in breeding often depends on support and collaboration over<br />
<strong>the</strong> long term between partners from industry, university, and government. Teambuilding<br />
can be key to success.<br />
The key points of this review are:<br />
Conclusions<br />
- Use of a genetically improved line has <strong>the</strong> potential to boost your production and<br />
profits.<br />
- It may be or may not be worthwhile for you to pursue genetic improvement at your<br />
own farm.<br />
- Becoming well acquainted with genetic principles, securing <strong>the</strong> collaboration of a<br />
geneticist, and bringing toge<strong>the</strong>r <strong>the</strong> infrastructure and money you’ll need are key<br />
steps for achieving success in genetic improvement of an aquaculture stock.<br />
Acknowledgements<br />
I gratefully acknowledge support for my genetic improvement research from <strong>the</strong><br />
CFAST (Commercial Fish and Shellfish Technologies) program, <strong>the</strong> Virginia<br />
Aquaculture Initiative, and <strong>the</strong> U.S. Department of Agriculture Hatch Program. I also am<br />
grateful for mutually beneficial cooperation with Darrin Prillaman, Rocky Holley, and<br />
Bill Martin of Blue Ridge Aquaculture.<br />
Literature Cited<br />
Falconer, D.S., and T.F.C. Mackay. Introduction to quantitative genetics, fourth edition.<br />
Harlow, Essex, UK: Longman (1996).<br />
Gjedrem, T. “Selection for growth rate and domestication in Atlantic salmon.” Z. Tierz.<br />
Zuchtungsbiol. 96:56-59 (1979).<br />
Havenstein, G.B., P.R. Ferket, E. Scheideler, and B.T. Larson. Growth, liveability, and<br />
feed conversion of 1957 vs 1991 broilers when fed “typical” 1957 and 1991 broiler<br />
diets. Poult. Sci. 73:1785-1794 (1994).<br />
6
Hersberger, W.K., J.M. Myers, R.N. Iwamoto, W.C. McAuley, and A.M. Saxton.<br />
“Genetic changes in <strong>the</strong> growth of coho salmon (Oncorhynchus kisutch) in marine netpens,<br />
produced by ten years of selection.” Aquaculture 85:187-197 (1990).<br />
Kincaid, H.L. “Rotational line crossing: An approach to <strong>the</strong> reduction of inbreeding<br />
accumulation in trout brood stocks.” Prog. Fish-Cult. 39:179-181.<br />
Kincaid, H.L., W.R. Bridges, and B. von Limbach. “Three generations of selection for<br />
growth rate in fall-spawning rainbow trout. Trans. Amer. Fish. Soc. 106:621-628<br />
(1977).<br />
Kinghorn, B. “Genetic variation in food conversion efficiency and growth in rainbow<br />
trout.” Aquaculture 32:141-155 (1983).<br />
Tave, D. Genetics for fish hatchery managers, second edition. New York: Van Nostrand<br />
Reinhold (1993).<br />
Table 1. Performance of <strong>the</strong> Blue Ridge Aquaculture Select strain (BRA-S), with comparison to DS strain.<br />
______________________________________________________________________________________<br />
Strain Tanks N Stocked Mortality Weight Weight Gain/Day FCR<br />
At Stocking At Harvest<br />
______________________________________________________________________________________<br />
DS A2, A3 59,676 2.8% 8.3 g 495 g 1.9 g 1.92<br />
BRA-S1 A4, A6 62,113 5.3% 14.0 484 2.3 1.48<br />
______________________________________________________________________________________<br />
7
Figure 1. Production and selection of tilapia broodstock replacement candidates at Blue<br />
Ridge Fisheries includes three or more rounds of culling through <strong>the</strong> production cycle.<br />
Figure 2. Selection for light body coloration resulted in a silvery white production stock.<br />
8
Strain Evaluation and Selective Breeding of<br />
Striped Bass<br />
Scott Lindell<br />
Fins Technology, LLC<br />
Turners Falls, MA<br />
Fins Technology has created <strong>the</strong> world’s largest collection of performance tested F1<br />
through F3 domesticated striped bass and white bass. In 1995, we initiated a strain<br />
evaluation program to establish founder stocks of striped bass for future selective<br />
breeding. We systematically evaluated over 5,000 prospective striped bass and 3,000<br />
white bass broodstock from 70 families and 12 distinct strains over four year-classes.<br />
Fish were individually tracked via physical and/or microsatellite markers. No single<br />
strain ranked highest in all economically important characteristics evaluated (growth rate,<br />
survival, and feed conversion efficiency). Growth rates of individuals (assignable to<br />
families and strains in replicate tanks) were compared by year-class. Survival and feed<br />
conversion efficiencies were tracked by family and strain respectively in replicated tanks.<br />
There was considerable variation in family performance within strains across year-<br />
classes, suggesting that strain alone is an insufficient basis for selection. Based on <strong>the</strong>se<br />
results, we initiated a selective breeding program that combines family and within family<br />
selection, and crossbreeding of different strains to exploit <strong>the</strong>ir superior attributes. Use of<br />
microsatellite markers is expected to increase selection differential by allowing us to<br />
unambiguously identify top performing individuals from large numbers of communally<br />
reared families.<br />
1
Performance Comparison of Geographically Distinct<br />
Strains of White Bass to Produce Sunshine Bass<br />
Christopher C. Kohler 1 , Robert J. Sheehan 1 , Joseph J. Myers 1 ,<br />
James B. Rudacille 1 , M. Lizabeth Allyn 1 and A. Victor Suresh 1<br />
1 Fisheries and Illinois Aquaculture Center, Sou<strong>the</strong>rn Illinois University<br />
Carbondale, Illinois 62901-6511 USA<br />
White Bass (Morone chrysops) broodstock were obtained from three locations<br />
encompassing <strong>the</strong> native range of this species: Arkansas River, Arkansas; Lake Erie, near<br />
Cleveland, Ohio; and Lake Poinsett, South Dakota. In spring 1996, white bass eggs of<br />
each strain were fertilized with fresh semen from <strong>the</strong> same strain or with extended striped<br />
bass (M. saxatilis) semen pooled from nine males collected from <strong>the</strong> Arkansas River.<br />
Each strain of white bass and sunshine bass was stocked at 500,000/ha as 4-d post hatch<br />
larvae into quadruplicated ear<strong>the</strong>n ponds recently filled and fertilized. The fish were<br />
offered fry meal (~50% crude protein) 21-d post stocking. Phase I fingerlings were<br />
harvested 35-d post stocking. Sunshine bass mean survival rates (12.5%) were<br />
significantly higher than white bass (2.6%). No difference in survival existed within <strong>the</strong><br />
white bass or sunshine bass groups. Phase II sunshine bass were subsequently stocked in<br />
triplicated ponds at 25,000/ha. The fish were fed to satiation twice daily with a 40%<br />
crude protein diet and harvested 100-d post stocking. Lake Erie sunshine bass mean<br />
weight (90.2 g) was significantly greater than Arkansas fish (58.4 g), but not South<br />
Dakota fish (69.0 g). Phase III sunshine bass were stocked in triplicated ponds at<br />
5,000/ha and fed in <strong>the</strong> same manner as in Phase II. In fall 1997, ponds were harvested<br />
and all fish reached marketable size with Lake Erie sunshine bass averaging 647 g,<br />
followed by Arkansas fish at 638 g and South Dakota fish at 566 g. These weights were<br />
not significantly different (P > 0.05). However, Lake Erie and South Dakota fish had<br />
significantly (P < 0.05) higher dessouts (37.3% and 37.8%, respectively) than Arkansas<br />
fish (34.6%). These results demonstrate <strong>the</strong> feasibility of raising sunshine bass to market<br />
size in ear<strong>the</strong>n ponds in <strong>the</strong> Midwest. Lake Erie white bass might offer some advantage<br />
as a source of broodfish relative to <strong>the</strong> strains compared and under <strong>the</strong> conditions in<br />
which <strong>the</strong>y were raised in this study.<br />
1
Abstract not available at time of printing.<br />
Production of YY Male Tilapia<br />
Robert Abernathy<br />
TilTech Aqua Farm<br />
Robert, LA<br />
1
Abstract<br />
Issues in <strong>the</strong> Commercialization of Transgenic Fish<br />
Elliot Entis<br />
Aqua Bounty Farms<br />
USA<br />
E-mail: eentis@aol.com<br />
The properly regulated use of genetically modified fish in aquaculture can allow for a rapid<br />
increase in <strong>the</strong> amount of fish protein available for consumption at lower costs than<br />
presently possible while limiting environmental dangers associated with fish farming. The<br />
commercial introduction of <strong>the</strong>se fish will encourage <strong>the</strong> use of recirculating tank systems,<br />
save on <strong>the</strong> use of coastal waters, and create a more sustainable industry. Consumer<br />
acceptance, however will not be easy, and requires companies to be committed to policies<br />
of openness and education.<br />
Introduction<br />
The recent development of rapidly growing transgenic salmon, trout, tilapia and o<strong>the</strong>r<br />
finfish, has created concern among environmentalists. It is feared that genetically modified<br />
fish might pose fur<strong>the</strong>r dangers to <strong>the</strong> health and safety of wild fish stocks than those<br />
posed by commercial aquaculture. Potential commercialization of such fish has also raised<br />
fears that <strong>the</strong>ir use might result in detrimental social and economic consequences for some<br />
groups (Hite and Gutrich 1998). It has been suggested, for example, that dramatic<br />
increases in aquaculture productivity, resulting from <strong>the</strong> application of genetic engineering<br />
technologies that are controlled by large corporations, could disadvantage underdeveloped<br />
countries relative to industrialized countries and could jeopardize <strong>the</strong> livelihoods of fishers<br />
everywhere (Open-ended Ad Hoc Working Group on Biosafety, Convention on Biological<br />
Diversity, 1996). Some special interest groups and countries have suggested, <strong>the</strong>refore,<br />
that <strong>the</strong> application of genetic engineering to fish farming be highly constrained if not<br />
prohibited altoge<strong>the</strong>r (CNI 1995; Greenpeace 1997). This paper takes <strong>the</strong> view that such<br />
draconian policies would be a grave mistake, with negative implications for <strong>the</strong><br />
environment, <strong>the</strong> world economy and <strong>the</strong> supply of adequate amounts of fish protein<br />
worldwide. Instead, national and international policies that foster <strong>the</strong> safe development<br />
and use of biotechnology should be strongly encouraged and supported in aquaculture to<br />
increase utility and productivity<br />
The foundation of this belief is that harvesting wild fish for consumption, as practiced<br />
today in many areas, is not an environmentally sustainable activity, and that expanded,<br />
low-cost, environmentally friendly aquaculture would help to feed <strong>the</strong> world. Indeed, it<br />
has been suggested that aquaculture yields will have to increase seven-fold over <strong>the</strong><br />
1
coming 25 years simply to maintain current per caput fish consumption worldwide<br />
(Clayton 1995), and, according to FAO, <strong>the</strong> world is likely to see an increase of 300% in<br />
aquaculture production over <strong>the</strong> next 13 years (FAO, 1997). Improvements in <strong>the</strong><br />
economics and environmental soundness of aquaculture are <strong>the</strong>refore required to ensure<br />
greater benefits to consumers and to <strong>the</strong> environment.<br />
Status of Transgenic Technology<br />
Transgenic strains of Atlantic salmon, Chinook salmon (Oncorhynchus tschawytscha) and<br />
rainbow trout (O. mykiss), grow 400% to 600% faster than <strong>the</strong>ir non-transgenic siblings<br />
during <strong>the</strong> early life stages and reach full market size in less than one-half <strong>the</strong> time required<br />
for non-transgenic fish of <strong>the</strong> same species (Hew et al, 1992; Devlin et al 1994; Maclean et<br />
al 1995). Preliminary evidence also suggests that food conversion rates may be improved<br />
by as much as 25%. Such transgenic Atlantic salmon can reach a weight of 3 kg in<br />
fourteen months from first feeding. In <strong>the</strong> same time period, transgenic rainbow trout<br />
routinely reach a weight of 4.5 kg. (Sutterlin 1998). Researchers working with trout,<br />
salmon, tilapia, carp and o<strong>the</strong>r species have all reported dramatic increases in growth rates<br />
based on using a variety of gene promoters linked to growth hormone genes. The result<br />
of this biotechnology-derived improvement will be dramatically increased harvests with<br />
reduced production costs and with diminished exploitation of scarce feed products. The<br />
attendant shift in economics will facilitate <strong>the</strong> use of more environmentally sound practices<br />
in aquaculture, as discussed below.<br />
Environmental Concerns<br />
Environmentalists’ fears of transgenic fish can be summarized in <strong>the</strong> form of two<br />
hypo<strong>the</strong>tical and mutually contradictory dangers associated with <strong>the</strong>ir escape into <strong>the</strong> wild:<br />
• transgenic fish will outcompete wild stocks and lead to a loss of genetic diversity;<br />
• transgenic fish will be less fit in <strong>the</strong> wild, will crossbreed with wild types, and produce<br />
offspring with lower survival rates <strong>the</strong>reby reducing <strong>the</strong> total population of wild fish.<br />
It is not <strong>the</strong> intent of this paper to argue <strong>the</strong> validity of ei<strong>the</strong>r fear. Those wishing to<br />
examine <strong>the</strong> scientific literature will find a number of articles detailing <strong>the</strong> potential of<br />
adverse consequences resulting from <strong>the</strong> escape of farm raised fish, including transgenics.<br />
Some authors have suggested that <strong>the</strong>se fears are overstated (Knibb 1997; Tave 1986)<br />
whereas o<strong>the</strong>rs have held that <strong>the</strong> dangers are quite real, at least in localized areas (Regal<br />
1994; Kapuscinski and Hallerman 1990, 1991; Hindar et al. 1991) The purpose of this<br />
paper is to suggest how <strong>the</strong> development of transgenic salmon with rapid growth traits can<br />
increase <strong>the</strong> economic value of aquaculture, limit its impact on <strong>the</strong> environment and<br />
enhance <strong>the</strong> well-being of wild fish.<br />
2
The Salmon Example<br />
Salmon farming is conducted almost entirely in open seawater cages and has resulted in a<br />
number of environmental concerns. The most frequently cited problems include <strong>the</strong><br />
following:<br />
• impact on wild stocks of large numbers of escapees - numbering in <strong>the</strong> millions of fish<br />
in a single growing season (NASCO 1994, 1997);<br />
• impact of particulate, nitrogenous and o<strong>the</strong>r chemical wastes on local ecosystems<br />
(Gowen and Rosenthal 1993, McLay and Gordon-Rogers 1997, Ellis 1997).<br />
• multiplication of water-borne infectious diseases associated with concentrated biomass<br />
(Goldberg and Triplett 1997);<br />
• destruction of natural habitat due to reconfiguration of, or intrusion upon, coastal<br />
areas to support farming activity (Phillips et al. 1993; Ellis,1997).<br />
Of continuing concern is that <strong>the</strong> projected growth of <strong>the</strong> salmon farming industry over <strong>the</strong><br />
next 20 to 30 years (FAO 1997) would be expected to increase its environmental impact<br />
if present methods of farming remain unchanged. These problems will also apply to <strong>the</strong><br />
farming of o<strong>the</strong>r species, <strong>the</strong> growth of which may be even more rapid. How <strong>the</strong>n, to<br />
square <strong>the</strong> circle and to grow <strong>the</strong> larger amounts required for consumption while<br />
minimizing environmental impacts?<br />
The Use of Transgenics<br />
Based on technical progress to date, it seems probable that <strong>the</strong> application of gene<br />
modification techniques, if employed appropriately, offer one of <strong>the</strong> best opportunities for<br />
resolution of this problem.<br />
The advent of transgenic salmon, which can attain market size in one-third to one-half <strong>the</strong><br />
time historically required with less feed input, will allow for <strong>the</strong> commercial introduction<br />
of a new farming system based on <strong>the</strong> use of recycled-water facilities. These facilities have<br />
virtually no impact on surrounding waterbodies and can, in fact, be situated many miles<br />
from any coastal location. The critical factor allowing for <strong>the</strong> expanded use of <strong>the</strong>se<br />
facilities and for subsequent reduction in deployment of open water cages, is <strong>the</strong> vastly<br />
improved economics associated with rapid-growth transgenics (Table 1). Improved feed<br />
conversion also enhances sustainability by requiring less of <strong>the</strong> world’s increasingly scarce<br />
feed proteins to support <strong>the</strong> aquaculture industry.<br />
3
Table 1. Cost comparisons for transgenic vs. non-transgenic salmon<br />
production. In this pro forma analysis, a traditional farming operation is<br />
assumed to produce 1000 lbs of salmon per harvest over a 36-month harvest<br />
cycle; <strong>the</strong> transgenic operation has a cycle of 18 months and 20% improvement<br />
in food-conversion rates (FCRs). The cost-of-production (i.e., $1.50/lb) in <strong>the</strong><br />
traditional operation is based on <strong>the</strong> industry average, comprising 40% for feed<br />
($0.60/lb) and 60% for fixed costs ($0.90/lb). Both operations are assumed to<br />
be subject to a wholesale price ex-farm of $1.80/lb. Note that, <strong>the</strong> event that<br />
FCRs were not improved, production cost-per-pound for transgenic salmon<br />
would still be lower (i.e., $128/lb), resulting in total production cost of $2560,<br />
providing gross profit of $1040 (345% improvement).<br />
4<br />
Aquaculture Operation<br />
Production Criterion Non-Transgenic Transgenic<br />
Harvest Size 1000 lbs 1000 lbs<br />
Harvest Cycle 36 months 18 months<br />
Total Cycles 1 2<br />
Total Pounds 1000 2000<br />
Food Input-Cost (lb -1 ) $0.60 $0.52<br />
Fixed Cost (lb -1 ) $0.90 $0.68<br />
Production Cost (lb -1 ) $1.50 $1.20<br />
Total Production Cost $1500 $2400<br />
Sales Revenue $1800 $3600<br />
Gross Profit $300 $1200<br />
Increased Profitability --- 400%<br />
Water recycling facilities have been available for many years, but have been ignored by<br />
salmon farmers until very recently due to <strong>the</strong>ir large capital investment requirements and<br />
high operating costs. The few salmon farmers who operate land-based facilities have<br />
generally been unable to compete economically with seawater cage operations and have<br />
become hatchery-nursery operations, concentrating on egg and smolt generation for sale<br />
to growout farmers.<br />
This state of affairs has begun to change recently, albeit slowly, as a result of several<br />
factors. First, <strong>the</strong>re is a growing realization within <strong>the</strong> industry that increasingly complex<br />
environmental regulations present a significant cost to farmers. In many locations, <strong>the</strong>se<br />
regulations put a limit on production and require potentially expensive ameliorative<br />
efforts.
Second, as <strong>the</strong> salmon farming industry matures, <strong>the</strong> size and nature of <strong>the</strong> producers are<br />
changing. What was once an industry of small farmers is rapidly evolving into an<br />
aquaculture version of agribusiness: relatively large companies with multinational interests<br />
controlling an increasing share of production. These companies are less interested in least<br />
cost methods of production in <strong>the</strong> short- term than in <strong>the</strong> predictability of costs and<br />
harvest size in <strong>the</strong> long run. In any given year, a seawater cage facility may represent <strong>the</strong><br />
most cost-effective method of production, but may also be subject to <strong>the</strong> highest degree of<br />
risk: storms, disease, predation, and changes in water temperature that can severely and<br />
unpredictably reduce yields. For large firms with <strong>the</strong> available capital, <strong>the</strong>refore, reliance<br />
on indoor systems represents a predictable alternative with greater opportunity for longrange<br />
planning and growth at diminished risk.<br />
Third, recent improvements in <strong>the</strong> design and engineering efficiencies of modern recycledwater<br />
plants allow for higher stocking densities, less disease, fewer breakdowns and lower<br />
operating costs. The increased number of engineering firms now designing and promoting<br />
water-recycling systems ensures that improvements to filtering systems, pumping and<br />
oxygenation equipment, temperature controls and water flows will continue.<br />
Despite <strong>the</strong>se pressures and incentives to move from open water to indoor growout, <strong>the</strong><br />
vast majority of salmon are still grown outdoors and <strong>the</strong> movement towards recirculation<br />
systems is slow. The primary reason for this is still <strong>the</strong> lower costs of growing salmon in<br />
open waters compared growing in a capital intensive, highly engineered plant. The<br />
missing component, <strong>the</strong> single element which can drive <strong>the</strong> movement towards more<br />
environmentally sound land-based salmon farming, is <strong>the</strong> advent of fish which are<br />
significantly less expensive to raise. Rapidly growing transgenics, such as those developed<br />
in Canada by Dr. Choy Hew and Dr. Garth Fletcher (Hew et al 1992) and licensed to<br />
Aqua Bounty Farms under <strong>the</strong> tradename AquAdvantage®, Inc. meet this need.<br />
The economic impact of <strong>the</strong> increased growth rates is enormous: not only is <strong>the</strong> cost-perunit<br />
weight of production lower as a result of shortening <strong>the</strong> growout time and reducing<br />
<strong>the</strong> amount of feed required, production is essentially doubled over time because two<br />
harvests of transgenic salmon can be produced in <strong>the</strong> same time that it takes to produce<br />
one harvest of non-transgenic salmon. Preliminary economic analyses (Table 1) indicate<br />
that if a farmer were to receive <strong>the</strong> same market price for transgenics as for nontransgenics,<br />
profitability could increase by over 400%. Obviously, this will not happen, nor<br />
is it desirable. The preferable outcome will be a sharing of economic benefits between<br />
consumer and producer: lower costs of production and increased output will lead to lower<br />
selling prices and a larger market as people who presently cannot afford <strong>the</strong> product will<br />
find it in <strong>the</strong>ir price range (Hite and Gutrich 1998).<br />
Even where <strong>the</strong> initial capital requirements for high-tech indoor growing systems cannot<br />
be met, transgenics will at least reduce input needs and increase output at lower costs - an<br />
invaluable benefit in a world where <strong>the</strong> price of fish makes it prohibitively expensive for<br />
many.<br />
The first transgenic fish to be commercially available, A/F Protein’s AquAdvantage®<br />
salmon, are being grown in <strong>the</strong> Company’s land-based facility. Commercial grow-out in<br />
open water cages will be permitted only for sterile transgenics, all-female triploids. Aqua<br />
5
Bounty Farms believes that this eliminates any direct threat to <strong>the</strong> wild fish population,<br />
even if it does not fully address certain of <strong>the</strong> o<strong>the</strong>r environmental concerns cited<br />
previously. The policy issue here is, is it not more acceptable to raise sterile, rapidly<br />
growing transgenic fish in open water cages than fertile, slow growing non-trangenic fish?<br />
If <strong>the</strong> commercialization of transgenic fish proceeds according to <strong>the</strong> principles of using<br />
environmentally isolated facilities or growing only sterile fish in open areas, this<br />
technology will produce a net gain for <strong>the</strong> ocean’s ecosystems by replacing systems with<br />
more severe impacts.<br />
Conclusion<br />
Recognizing <strong>the</strong> enormous potential benefit of biotechnology, such as <strong>the</strong> development of<br />
transgenic fish, means also recognizing that while regulatory oversight is necessary,<br />
regulations must be used to safely advance its use, not to hamper or eliminate <strong>the</strong><br />
technology. Fur<strong>the</strong>r, regulatory oversight should be developed in keeping with <strong>the</strong><br />
thoughts expressed in <strong>the</strong> ICLARM-GTZ Bellagio Conference ‘Environment and<br />
Aquaculture in Developing Countries’ (Pullin 1993), that “environmental conservation and<br />
human needs must be balanced.” A sound understanding of <strong>the</strong> economic, nutritional and<br />
environmental advantages which transgenics can offer - through application of costbenefit<br />
analysis - should be employed (Hite and Gutrich 1998; Balint et al. 1998).<br />
Examples where <strong>the</strong>se guidelines to <strong>the</strong> development of policy have not been followed<br />
show that <strong>the</strong> results are negative to producers, consumers, and ultimately, to <strong>the</strong><br />
environment as well (Ackefors and Olburs 1995).<br />
References<br />
Ackefors, H. and C. Olburs. 1995. Aquaculture: a threat to <strong>the</strong> environment, or opportunities for a new<br />
industry? The Swedish paradox. J of Marine Biot. 3:53-55.<br />
Ackefors, H., C. Olburs. 1996. Swedish aquaculture policy - a nightmare for <strong>the</strong> industry? Aquaculture<br />
Europe. 21(2): 6-13.<br />
A/F Protein, Inc. 1998. AquAdvantage . US Patent & Trademark Office. Reg. No. 2,147,668. March 31,<br />
1998.<br />
Anon. 1997. Scotland loses £1.3m salmon. Scottish Fish Farmer: October, 1997: p 2.<br />
Aqua Bounty Farms. 1998. The Blue Revolution. Aqua Bounty Farms Update: Vol.1, No.4, July, 1998:<br />
p.2<br />
Balint, P.J., Colwell, R.R., Gutrich, J.J., Hite, D., Levin, M., Stenquist, S., Whiteman, H.H. and R. A.<br />
Zilinskas. 1998. Risks and benefits of marine biotechnology: conclusions and recommendations,<br />
p.213-220. In R.A. Zilinskas and P.J. Balint (eds.) Genetically engineered marine organisms:<br />
environmental and economic risks and benefits. Kluwer Academic Publishers, Boston, Dordrecht,<br />
London.<br />
Claxton, L. 1995. Production must increase to meet world needs. Nor<strong>the</strong>rn Aquaculture: November 1995:<br />
p.1<br />
CNI. 1995. Transgenic fish: <strong>the</strong> next threat to marine biodiversity. Community Nutrition Institute in<br />
collaboration with <strong>the</strong> Biotechnology Working Group. November 1995. Washington, D.C.<br />
6
Devlin, R.H., Yesaki, T.Y., Biagi, C.A., Donaldson, E.M., Swanson, P. and W.K. Chan. 1994.<br />
Extraordinary salmon growth. Nature: 371, 209-10.<br />
Ellis, D. and Associates. 1998. Net loss: <strong>the</strong> salmon netcage industry in British Columbia. David Suzuki<br />
Foundation, Vancouver, B.C. 1996<br />
FAO. 1997. Review of <strong>the</strong> state of world aquaculture, p. 30-37. FAO Fisheries Circ. No.886, Rev.1 FAO,<br />
Rome.<br />
Fletcher, G., Alderson, R., Chin-Dixon, E.A., Shears, M.A., Goddard, S.V. and C. Hew. 1997.<br />
Transgenic fish for sustainable aquaculture. In: Sustainable Aquaculture -2nd International<br />
<strong>Symposium</strong>, Oslo 2-5 November 1997. A.A. Balkema Publishers, Rotterdam, Ne<strong>the</strong>rlands.<br />
Goldburg, R. and T. Triplett. 1997. Murky waters: environmental effects of aquaculture in <strong>the</strong> United<br />
States. EDF Publications, Washington, D.C.<br />
Gowen, R.J. and H.Rosenthal. 1993. The environmental consequences of intensive coastal aquaculture in<br />
developed countries, p. 102-115. In R.S.V.Pullin, H.Rosenthal and J.L. Maclean (eds.) Environment<br />
and aquaculture in developing countries. ICLARM, Conf. Proc. 31, 359 p.<br />
Greenpeace. 1997. Greenpeace condemns commercialization of life. In web site:<br />
http://www.greenpeace.org., press release. Brussels, November, 1997.<br />
Hew, C.L. and G. Fletcher. 1997. Transgenic fish for aquaculture. Chemical and Industry: April 21, 1997:<br />
311-314.<br />
Hew, C.L., Fletcher, G.L., Du, S.J., Gong, Z., Shears, M.A., King, M.J. and D.R. Idler. 1992. Growth<br />
enhancement in transgenic atlantic salmon by <strong>the</strong> use of an ‘all fish’ chimeric growth hormone gene<br />
construct. Biotechnology Vol. 10, February, 1992: 176-181.<br />
Hindar, K., Ryman, N., and R. Utter. 1991. Genetic effects of cultured fish on natural populations. Can. J.<br />
Aquat. Sci. 48: 945-7.<br />
Hite, D. and J.J. Gutrich. 1998. Economic analysis of introduced genetically engineered organisms, p.181-<br />
212. In R.A. Zilinskas and P.J. Balint (eds.) Genetically engineered marine organisms: environmental<br />
and economic risks and benefits. Kluwer Academic Publishers, Boston, Dordrecht, London.<br />
Kapuscinski, A. and E. Hallerman, 1990. Transgenic fish and public policy: anticipating environmental<br />
impacts of transgenic fish. Fisheries 15(1): 2-11.<br />
Kapuscinski, A. and E. Hallerman, 1991. Implications of introduction of transgenic fish into natural<br />
ecosystems. Can. J. Fish Aquatic. Sci. 48: 99-107.<br />
Knibb, W.R. 1997. Risk from genetically engineered fish and modified marine fish. Transgenic Res. 6:<br />
59-67. Genetically engineered marine organisms: environmental and economic risks and benefits.<br />
Kluwer Academic Publishers, Boston, Dordrecht, London.<br />
McLay, A. and K. Gordon-Rogers, Editors. 1997. Report of <strong>the</strong> Scottish Salmon Strategy. The Scottish<br />
Office, Edinburgh, Scottland.<br />
Maclean, N., Nam, S., Williams, D., and L. Lavender. 1995. Abstract 118. In Molecular biology in fish,<br />
fisheries and aquaculture, an international symposium. Fisheries Society of British Isles, Plymouth,<br />
UK.<br />
NASCO. 1994. Ten year review of <strong>the</strong> activities of <strong>the</strong> North Atlantic Salmon Conservation Organization.<br />
North Atlantic Salmon Conservation Organization. Edinburgh, Scotland.<br />
NASCO. 1997. Report on <strong>the</strong> activities of <strong>the</strong> North Atlantic Salmon Conservation Organization 1995-<br />
1997. North Atlantic Salmon Conservation Organization. Edinburgh, Scotland.<br />
Open-Ended Ad Hoc Working Group on Biosafety, Convention on Biological Diversity. 1996. Elaboration<br />
of <strong>the</strong> terms of reference for <strong>the</strong> Open-ended Ad Hoc Working Group on Biosafety.<br />
UNEP/CBD/BSWG/1/3. Aarhus, Denmark.<br />
7
Phillips, M.J., Kwei Lin, C., and M.C.M. Beveridge. 1993. Shrimp culture and <strong>the</strong> environment: lessons<br />
from <strong>the</strong> world’s most rapidly expanding warmwater aquaculture sector, p.171-197. In R.S.V.Pullin,<br />
H.Rosenthal and J.L. Maclean (eds.) Environment and aquaculture in developing countries.<br />
ICLARM, Conf. Proc. 31, 359 p.<br />
Pullin, R.S.V. 1993. An overview of environmental issues in developing country aquaculture, p.1-19. In<br />
R.S.V.Pullin, H.Rosenthal and J.L. Maclean (eds.) Environment and aquaculture in developing<br />
countries. ICLARM, Conf. Proc. 31, 359 p.<br />
Regal, P.J. 1994. Scientific principles for ecologically based risk assessment of transgenic organisms.<br />
Molecular Ecology 3:5-15.<br />
Sutterlin, A. 1998 Internal company progress report (unpublished). A/F Protein, Waltham, MA., USA.<br />
Tave, D. 1986. Genetics for fish hatchery managers. AVI Publishing Co. Westport, Connecticut.<br />
Zilinskas, R.A. and P.J. Balint, Editors. 1998. Genetically engineered marine organisms: environmental<br />
and economic risks and benefits. Kluwer Academic Publishers, Boston, Dordrecht, London.<br />
8
Introduction<br />
Removal of Protein and TSS from <strong>Sea</strong> Water by<br />
Foam Separator<br />
Kuen-Hack Suh<br />
Department of Chemical Engineering<br />
Pukyong <strong>National</strong> University<br />
Pusan, Korea<br />
Sung-Koo Kim<br />
Department of Biotechnology &<br />
Bioengineering<br />
Pukyong <strong>National</strong> University<br />
Pusan, Korea<br />
In recent years, in Korea, recirculating aquaculture technologies for intensive fish culture<br />
are increasingly being used to enhance production of a high quality aquacultural products<br />
all year around including seawater. In high density aquaculture system, <strong>the</strong> increase of<br />
protein and organic particulates by uneaten feed, feed waste and excreta of fish gives a<br />
bad effect in fish growth and environment. Also protein and organic particulates are<br />
decomposed to ammonia nitrogen and nitrite nitrogen which are harmful to fish and also<br />
<strong>the</strong>se cause consumption of dissolved oxygen. The foam separation has been considered<br />
as a process for removal of protein and suspended solids in aquacultural water (Chen et<br />
at., 1994; Suh and Lee, 1995).<br />
The objective of this research is to determine <strong>the</strong> feasibility of foam separator for <strong>the</strong><br />
removal of aquacultural waste, such as protein, total suspended solid (TSS) and organic<br />
compound from marine aquacultural water. The removal rate and <strong>the</strong> removal efficiency<br />
of <strong>the</strong> foam separator have been studied by changing <strong>the</strong> initial concentrations of protein<br />
and TSS, hydraulic residence time, superficial air velocity and air distributor pore size as<br />
experimental variables. In addition, <strong>the</strong> foam separator as an aerator was also evaluated<br />
for increasing dissolved oxygen concentration.<br />
Materials and Methods<br />
The foam separator was composed of a separation column, foam riser, foam collector and<br />
air distributor. The height of separation column was 600 mm and liquid volume was 1000<br />
mL. The air from an air pump was introduced into <strong>the</strong> column through a rotameter and an<br />
air distributor. For most of <strong>the</strong> experiment, a sintered glass disc of G3 pore size and 25<br />
mm i.d. was emploved as an air distributor. Peristaltic pumps were used to introduce<br />
experimental water at <strong>the</strong> top of <strong>the</strong> separation column. Liquid samples were taken from<br />
an outlet which was raised up to <strong>the</strong> water surface level in separation column.<br />
1<br />
Byong-Jin Kim<br />
Department of Chemical Engineering<br />
Pukyong <strong>National</strong> University<br />
Pusan, Korea<br />
Jae-Yoon Jo<br />
Department of Aquaculture<br />
Pukyong <strong>National</strong> University<br />
Pusan, Korea
Results and Discussion<br />
Protein and TSS removal characteristics of foam separation were dependent on protein<br />
concentration. Fig. 1 presents <strong>the</strong> changes of removal rates and efficiencies of protein and<br />
TSS on initial protein concentration. As initial protein concentration in <strong>the</strong> feeding<br />
solution is increased, <strong>the</strong> protein removal rate increased and removal efficiency<br />
decreased.<br />
Protein removal rate, g/m 3 ¡¤min<br />
10<br />
8<br />
6<br />
4<br />
2<br />
(a)<br />
Removal rate<br />
Removal efficiency<br />
0<br />
10<br />
0 10 20 30 40 50 60 70<br />
Initial protein concentration, g/m 3<br />
60<br />
50<br />
40<br />
30<br />
20<br />
Protein removal efficiency, %<br />
Fig. 2 presents <strong>the</strong> effect of hydraulic residence time in <strong>the</strong> foam separator on <strong>the</strong> removal<br />
of protein and TSS in sea water at 0.85 cm/sec of superficial air velocity. Fig. 3 shows<br />
that increase in hydraulic residence time increased <strong>the</strong> removal efficiencies of protein and<br />
TSS. The protein and TSS removal rates in increased to 10.25 g protein/m 3 ·day and 51.8<br />
g TSS/m 3 ·day, respectively when HRT was about 0.48 minutes. So after passing that<br />
point, protein and TSS removal rate was also dropped. So protein and TSS removal rates<br />
Protein removal rate, g/m 3 ¡¤min<br />
12<br />
10<br />
8<br />
6<br />
4<br />
2<br />
were maximum at this point and also when HRT was fur<strong>the</strong>r decreased <strong>the</strong>n removal rate<br />
was dropped. Within <strong>the</strong> range of 0.28 to 8.76 minutes of hydraulic residence time, <strong>the</strong><br />
removal efficiencies ranged from 12.2 to 72.5% for protein, 33.4 to 92.4% of TSS.<br />
Fig. 3 presents <strong>the</strong> removal efficiencies of protein and TSS as a function of superficial air<br />
velocity. The superficial air velocity tested were 0.42, 0.85, 1.27, 1.70 and 2.1 cm/sec at a<br />
constant hydraulic retention time of 2.05 minute. Overall, Figure 4 demonstrates that <strong>the</strong><br />
2<br />
TSS removal rate, g/m 3 ¡¤min<br />
50<br />
40<br />
30<br />
20<br />
10<br />
(b)<br />
Removal rate<br />
Removal efficiency<br />
0<br />
50<br />
0 10 20 30 40 50 60 70<br />
Initial protein concentration, g/m 3<br />
Fig. 1. The effect of initial protein concentration on protein (a) and TSS (b) removal.<br />
(a)<br />
Removal rate<br />
Removal efficiency<br />
0<br />
0<br />
0 2 4 6 8 10<br />
Hydraulic residence time, min<br />
100<br />
80<br />
60<br />
40<br />
20<br />
Protein removal efficiency, %<br />
TSS removal rate, g/m 3 ¡¤min<br />
60<br />
50<br />
40<br />
30<br />
20<br />
10<br />
Removal rate<br />
Removal efficiency<br />
0<br />
0<br />
0 2 4 6 8 10<br />
Hydraulic residence time, min<br />
Fig. 2. The effect of hydraulic residence time on protein (a) and TSS (b) removal.<br />
(b)<br />
100<br />
90<br />
80<br />
70<br />
60<br />
100<br />
80<br />
60<br />
40<br />
20<br />
TSS removal efficiency, %<br />
TSS removal efficiency, %
higher superficial air velocity greatly increased <strong>the</strong> removal rates and removal<br />
efficiencies of protein and TSS in bulk solution. Each substance removal was nearly<br />
proportional to <strong>the</strong> superficial air velocity used. This might be due to <strong>the</strong> increases in <strong>the</strong><br />
area of air-water interface resulted from <strong>the</strong> higher superficial air velocity, which can<br />
cause increasing amount of substances adsorbed.<br />
Protein removal rate, g/m 3 ¡¤min<br />
12<br />
10<br />
8<br />
6<br />
4<br />
In Fig. 4 removal rates and removal efficiencies of protein and TSS were plotted as<br />
function of <strong>the</strong> air distributor pore size. With <strong>the</strong> increasing pore size of air distributor,<br />
removal rates and removal efficiencies of protein and TSS were decreased. When<br />
reducing <strong>the</strong> pore size of air distributor, <strong>the</strong> bubble diameter was diminished. This was<br />
due to <strong>the</strong> increased interfacial area available for protein adsorption, with more protein<br />
and TSS entering <strong>the</strong> foam phase, thus promoting removal.<br />
Protein removal rate, g/m 3 ¡¤min<br />
6<br />
5<br />
4<br />
3<br />
2<br />
1<br />
(a)<br />
Air<br />
stone<br />
(a)<br />
Air distributor<br />
Removal rate<br />
Removal efficiency<br />
2<br />
0<br />
0.0 0.5 1.0 1.5 2.0 2.5<br />
Superficial air velocity, cm/sec<br />
G4 G2 G1<br />
0 30 60 90 120<br />
0<br />
150<br />
Pore size, §<br />
Removal rate<br />
Removal efficiency<br />
100<br />
80<br />
60<br />
40<br />
20<br />
Protein removal efficiency, %<br />
100<br />
80<br />
60<br />
40<br />
20<br />
Protein removal efficiency, %<br />
To determine <strong>the</strong> effect of a foam separator on dissolved oxygen transfer to sea water,<br />
dissolved oxygen saturation were measured with various hydraulic residence times and<br />
superficial air velocities and calculated out <strong>the</strong> overall mass transfer coefficient. As<br />
shown in Fig. 5, <strong>the</strong> hydraulic residence time for highest overall oxygen mass transfer<br />
coefficient was <strong>the</strong> optimum condition for <strong>the</strong> highest protein removal rate. And <strong>the</strong><br />
higher superficial air velocity substantially increases dissolved oxygen saturation in <strong>the</strong><br />
bulk solution.<br />
3<br />
TSS removal rate, g/m 3 ¡¤min<br />
20<br />
18<br />
16<br />
14<br />
12<br />
10<br />
Air<br />
stone<br />
(b)<br />
Air distributor<br />
G4 G2 G1<br />
Removal rate<br />
Removal efficiency<br />
0 30 60 90 120<br />
0<br />
150<br />
Pore size, §<br />
Fig. 4. The effect of air distributor pore size on protein (a) and TSS (b) removal.<br />
TSS removal rate, g/m 3 ¡¤min<br />
26<br />
24<br />
22<br />
20<br />
18<br />
Removal rate<br />
Removal efficiency<br />
16<br />
0<br />
0.0 0.5 1.0 1.5 2.0 2.5<br />
Superficial air velocity, cm/sec<br />
Fig. 3. The effect of superficial air velocity on protein (a) and TSS (b) removal.<br />
(b)<br />
100<br />
80<br />
60<br />
40<br />
20<br />
100<br />
80<br />
60<br />
40<br />
20<br />
TSS removal efficiency, %<br />
TSS removal efficiency, %
K L a, min -1<br />
50<br />
40<br />
30<br />
20<br />
10<br />
(a)<br />
Reference<br />
K L a<br />
0<br />
90<br />
0 2 4 6 8 10<br />
Hydraulic residence time, min<br />
Saturation<br />
100<br />
98<br />
96<br />
94<br />
92<br />
DO saturation, %<br />
Chen, S. “Modeling surfactant removal in foam fraction I, II”. Aquacultural Engineering<br />
13(1994) 13: 163-200.<br />
Suh, K.H. and Lee, M.G.. “ Treatment of Aquacultural Recirculating Water by Foam Separation -<br />
I. Characteristics of Protein Separation” J. Korean. Fish. Soc., 28(1995). 599-606.<br />
4<br />
K L a, min -1<br />
25<br />
20<br />
15<br />
10<br />
5<br />
K L a<br />
0<br />
90<br />
0.0 0.5 1.0 1.5 2.0 2.5<br />
Superficial air velocity, cm/sec<br />
Saturation<br />
Fig. 5. The effect of hydraulic residence time (a) and superficial air velocity (b) on DO transfer.<br />
(b)<br />
100<br />
98<br />
96<br />
94<br />
92<br />
DO saturation, %
Hydrodynamics in <strong>the</strong> ‘Cornell-Type’ Dual-Drain Tank<br />
Introduction<br />
Steven T. Summerfelt, Research Engineer, and<br />
John Davidson, Research Associate<br />
The Conservation Fund’s Freshwater Institute<br />
Shepherdstown, West Virginia<br />
Michael B. Timmons, Professor<br />
Agricultural and Biological Engineering Department<br />
Cornell University, Ithaca, NY 14853<br />
Circular fish culture tanks can be managed as “swirl settlers,” settling basins with two<br />
effluents, because of <strong>the</strong>ir capability to concentrate solids at <strong>the</strong>ir bottom and center.<br />
Solids that concentrate at <strong>the</strong> bottom center can be removed in a small flow stream by<br />
using a bottom-drawing center drain, while <strong>the</strong> majority of flow is withdrawn at an<br />
elevated drain. The two drains have been typically located at <strong>the</strong> tank’s center, which <strong>the</strong>n<br />
takes advantage of both <strong>the</strong> ‘tea-cup effect’ and <strong>the</strong> strength of <strong>the</strong> overall flow when it<br />
drains through <strong>the</strong> tank center, as reviewed by Timmons et al. (1998). However, <strong>the</strong><br />
‘Cornell-type’ dual-drain culture tank differs significantly from <strong>the</strong> o<strong>the</strong>r dual-drain<br />
designs, because it only places <strong>the</strong> bottom drain at <strong>the</strong> tank’s center and removes <strong>the</strong><br />
majority of flow through an elevated drain located on <strong>the</strong> tank’s side-wall. This paper<br />
reports an investigation of water mixing and settleable solids fractionation within a<br />
'Cornell-type' double-drain circular culture tank.<br />
Materials and Methods<br />
Settleable solids fractionation and tank mixing were studied within a 3.66 m (12 ft) i.d. x<br />
1.22 m (4 ft) tall circular ‘Cornell-type’ dual-drain tank at <strong>the</strong> Freshwater Institute.<br />
Replicated tests were conducted under two hydraulic exchange rates (1 and 2 rearing tank<br />
volume exchanges per hour), at three diameter to depth ratios (12:1, 6:1, 3:1), three<br />
bottom drain flow percentages (5, 10, and 20% of total flow), and in <strong>the</strong> presence and<br />
absence of rainbow trout. Some of <strong>the</strong> trials could not be conducted, however, because<br />
<strong>the</strong> flow rates through <strong>the</strong> tank’s bottom drain were too low to flush pellets through <strong>the</strong><br />
3.8 cm (1.5 in) diameter drainpipe. Trout were maintained at densities exceeding 60<br />
kg/m 3 and fish were fed 1% body weight per day. The experimental protocol and <strong>the</strong><br />
methods described were in compliance with <strong>the</strong> Animal Welfare Act (9CFR) requirements<br />
and were approved by <strong>the</strong> Freshwater Institute’s Institutional Animal Care and Use<br />
Committee.<br />
1
Bottom drain flows were set and calibrated using a calibrated bucket and a stop watch.<br />
Total flow was measured using a pipe-mounted flow meter; <strong>the</strong>se flows were checked<br />
using a stop watch and a larger basin of known volume. Total suspended solids (TSS)<br />
concentrations were measured during all trials where fish were present. TSS samples<br />
were collected on <strong>the</strong> tank’s inlet flow, both tank outlet flows, and <strong>the</strong> tank’s bottomcenter<br />
drain outlet flow after it has passed through a microscreen filter.<br />
Tank Mixing Tests<br />
Rhodamine WT dye was added to <strong>the</strong> culture tank in a single pulse to determine <strong>the</strong><br />
effectiveness of tank mixing under <strong>the</strong> different conditions tested. Dye-pulse flushing was<br />
monitored by collecting water samples over a period of time (Figure 1).<br />
120<br />
100<br />
80<br />
60<br />
40<br />
20<br />
0<br />
25.0 minute = ‘mixing-cup’ calculated mean HRT<br />
0 20 40 60 80 100 120 140<br />
Time after dye-pulse input, min<br />
Figure 1. An example plot showing <strong>the</strong> absorbance data for each sample taken after<br />
<strong>the</strong> dye-pulse was added to <strong>the</strong> culture tank.<br />
The mean hydraulic retention time (HRT) of <strong>the</strong> water flowing through <strong>the</strong> culture tank<br />
was estimated using <strong>the</strong> “mixing-cup” method described on page 63.3 of Levenspiel<br />
(1989), as follows:<br />
n<br />
∑ ti<br />
⋅ Ci<br />
⋅ Δti<br />
measured mean residence time (min) = i=<br />
1<br />
(Eq. 1)<br />
n<br />
∑Ci ⋅ Δti<br />
i=<br />
1<br />
where: Ci is <strong>the</strong> absorbance of sample i, ti is <strong>the</strong> length of time <strong>the</strong> sample i was collected<br />
after <strong>the</strong> dye-tracer was input into <strong>the</strong> tank, and Δti is <strong>the</strong> interval between adjacent<br />
samples when sample i was collected. The ‘mixing-cup’ method accounts for unequal<br />
sample intervals within <strong>the</strong> data.<br />
2
The ideal mean residence time was also calculated by dividing <strong>the</strong> water volume in <strong>the</strong><br />
tank (V) by <strong>the</strong> water flowrate through <strong>the</strong> tank (Q). Tank turnover efficiencies were<br />
estimated from <strong>the</strong> ratio of <strong>the</strong> two residence times found above:<br />
measured mean residence time (min)<br />
turnover efficiency = (Eq. 2)<br />
ideal mean residence time (min)<br />
If mixing within <strong>the</strong> tank is perfect, <strong>the</strong> tank turnover efficiencies equal 1.0. Turnover<br />
efficiencies of less than 1.0 indicate less than perfect mixing and that some water short<br />
circuits through <strong>the</strong> culture tank. Turnover efficiencies greater than 1.0 are an indication<br />
of problems with <strong>the</strong> precision of water flow rate or tank volume measurements, or<br />
inconsistencies within <strong>the</strong> samples taken during <strong>the</strong> dye-tracer test.<br />
Pellet Flushing Tests<br />
Pulses of sinking PVC cylindrical pellets (each about 3 mm in length by 3 mm o.d.) were<br />
added to quantify solids flushing kinetics and <strong>the</strong> relative strength of <strong>the</strong> radial flow. The<br />
plastic pellets had a specific gravity of 1.05, similar to <strong>the</strong> specific gravity reported for<br />
trout fecal matter. The plastic pellets also exhibited a settling velocity of 3.8 cm/s, which<br />
was similar to <strong>the</strong> settling velocity reported for fecal matter 1.7-4.3 cm/s (Warrer-Hansen,<br />
1982). Feed pellets tested in this study settled more rapidly (e.g., 14 cm/s) than <strong>the</strong> plastic<br />
pellets, but <strong>the</strong> feed pellet settling velocities measured were similar to those reported by<br />
o<strong>the</strong>rs.<br />
During a pellet flushing test, 1000-grams of dry pellets were weighed out, wetted in a<br />
bucket to remove air bubbles from <strong>the</strong> pellets, and placed into <strong>the</strong> tank water in a pulse.<br />
The plastic pellets settled fairly rapidly and were transported by radial flow towards <strong>the</strong><br />
bottom-center drain. The plastic pellets were <strong>the</strong>n collected from <strong>the</strong> discharge from <strong>the</strong><br />
bottom-center drain at specific time intervals. Baskets containing 1-mm mesh stainless<br />
steel screen were used to capture <strong>the</strong> pellets from <strong>the</strong> flow during each sampling interval.<br />
Ano<strong>the</strong>r screened basket was placed to capture all pellets flushed through <strong>the</strong> side-wall<br />
drain. Following collection, <strong>the</strong> pellets were oven dried and <strong>the</strong>n weighed. Minimums of<br />
three pulsed-pellet tests were run for each set of conditions.<br />
An unsteady-state mass balance was developed to quantify pellet flushing, assuming zero<br />
pellet inflow, reaction, or accumulation, i.e., Loss = Inflow – Outflow – Reaction –<br />
Accumulation. The outflow term in <strong>the</strong> mass balance was broken into a component<br />
representing simple mass action of flow to <strong>the</strong> bottom drain, and a component<br />
representing pellet enrichment at <strong>the</strong> bottom drain due to a combination of sedimentation<br />
and radial flow (assuming that <strong>the</strong> pellet outflow at <strong>the</strong> tank’s sidewall is negligible); this<br />
was done to distinguish between <strong>the</strong> two different mechanisms transporting pellets to <strong>the</strong><br />
bottom center drain, i.e., Loss =– Outflow (mass action) – Outflow (enrichment). Or<br />
more specifically,<br />
3
V ⋅<br />
dC<br />
dt<br />
= −Qout,<br />
b ⋅ Cout,<br />
b − k ⋅ Cout,<br />
b ⋅ V<br />
= V ⋅<br />
{ − ( Q/<br />
V + k)<br />
⋅ C }<br />
4<br />
out,<br />
b<br />
(Eq. 3)<br />
Where: k is a 1 st order rate constant characterizing bead enrichment at <strong>the</strong> bottom-center<br />
drain and Qout,b and Cout,b are <strong>the</strong> flowrate and concentration of pellets flushed through <strong>the</strong><br />
bottom center drain at a given time. Integration provides an equation that can be used to<br />
model pellet flushing through <strong>the</strong> bottom drain in real time:<br />
Cout,<br />
b<br />
{ t}<br />
−<br />
( ) ( ) ( Q / V+<br />
k<br />
@ t C @ t 0 e<br />
) ⋅<br />
= ⋅<br />
= out,<br />
b<br />
(Eq. 4)<br />
Note that <strong>the</strong> flushing of a homogeneously distributed dye pulse is only due to mass action<br />
and would result in a similar equation, but without k (1 st order enrichment constant).<br />
Therefore, <strong>the</strong> k-value increases <strong>the</strong> rate of solids flushing relative to <strong>the</strong> culture tank<br />
exchange rate. After manipulation of Eq. 4, <strong>the</strong> k-value for each pellet flushing test was<br />
calculated from <strong>the</strong> slope of <strong>the</strong> line produced by plotting <strong>the</strong> pellet flushing data (Figure<br />
2) after manipulation to <strong>the</strong> following form:<br />
solids<br />
5<br />
4<br />
3<br />
2<br />
1<br />
0<br />
y-axis = -LN(fraction of solids remaining) (Eq. 5)<br />
x-axis = t (Eq. 6)<br />
slope of <strong>the</strong> linear regression line = (Q/V + k) (Eq. 7)<br />
4/28/99 2' Depth<br />
T. Flow = 55.2 gpm B. Flow = 11.7 gpm<br />
k=0.690/min 3.57% not included t 0 = 1.43 min<br />
0 20 40 60 80 100 120<br />
Time (min)<br />
Data Excluded from<br />
Linear Regression<br />
Data Used for Linear<br />
Regression<br />
Linear (Data Used for<br />
Linear Regression)<br />
y = 0.7224x - 1.035<br />
R 2<br />
= 0.9554<br />
Figure 2. An example plot showing pellet-flushing data plotted as <strong>the</strong> natural logarithm<br />
of <strong>the</strong> ‘fraction of pellets remaining’ for each outlet sample taken after a pulse of pellets<br />
was added to <strong>the</strong> culture tank. The data not included in <strong>the</strong> linear regression only<br />
represented 3.57% of <strong>the</strong> total mass of pellets flushed from <strong>the</strong> tank.
A sample pellet-flushing test is shown in Figure 2. Note that not all <strong>the</strong> data fits <strong>the</strong><br />
assumption that pellet enrichment at <strong>the</strong> bottom center drain due to settling and radial flow<br />
could be approximated by 1 st order kinetics. In most tests, effective pellet flushing<br />
occurred and only a small portion (e.g. less than 15%) of <strong>the</strong> pellets did not flush<br />
according to <strong>the</strong> 1 st order kinetic equation.<br />
Results and Discussion<br />
Solids Partitioning Between Side-wall and Bottom-Center Drains<br />
Less than 5% of <strong>the</strong> sinking pellets were flushed through <strong>the</strong> side-wall drain during all<br />
trials. However, larger fractions of pellets were flushed through <strong>the</strong> side-wall drain when<br />
fish were present (e.g., < 4.3%) than during trials conducted in <strong>the</strong> absence of fish (e.g., <<br />
1.4%). Increasing <strong>the</strong> culture tank exchange rate from 1 ex/hr to 2 ex/hr also increased<br />
<strong>the</strong> fraction of pellets flushed through <strong>the</strong> sidewall drain.<br />
The k-values estimated from <strong>the</strong> pellet-tracer tests are an indication of <strong>the</strong> rate that pellets<br />
can be flushed from <strong>the</strong> bottom-center drain and also of <strong>the</strong> relative strength of <strong>the</strong> radial<br />
flow. When fish were present, <strong>the</strong> rate that pellets were flushed through <strong>the</strong> bottomcenter<br />
drain was greater at 2 ex/hr than at 1 ex/hr and at <strong>the</strong> smaller diameter:depth ratios.<br />
All <strong>the</strong> trials at 2 ex/hr and diameter:depth ratios of 3.1:1 and 6:1 produced strong radial<br />
flows, rapid solids flushing, and exhibited no problems with solids flushing.<br />
A very important observation was that <strong>the</strong> settleable solids frequently deposited about <strong>the</strong><br />
tank’s bottom-center drain during most trials at 1 ex/hr, but only at <strong>the</strong> diameter:depth<br />
ratio of 12:1 during trials at 2 ex/hr. During <strong>the</strong>se trials, <strong>the</strong> radial flow transported <strong>the</strong><br />
settleable solids to <strong>the</strong> center portion of <strong>the</strong> tank, but water velocities were so low in <strong>the</strong><br />
middle of <strong>the</strong> tank that a good portion of <strong>the</strong>se solids settled within a torus-shaped region<br />
about <strong>the</strong> center drain. Fortunately, this accumulation of settled solids were usually<br />
sufficiently near to <strong>the</strong> center drain that pulling <strong>the</strong> external stand-pipe regulating <strong>the</strong><br />
bottom-center drain flow, even for an interval of < 1 min, was sufficient to flush <strong>the</strong><br />
accumulated solids. The presence of fish improved <strong>the</strong> rate that pellets were flushed<br />
through <strong>the</strong> bottom-center drain (i.e., <strong>the</strong> K-values in Table 1) for a given diameter:depth,<br />
underflow percentage, and overall tank exchange rate.<br />
The relative importance of <strong>the</strong> two pellet flushing mechanisms, i.e., mass action (i.e., Q/V)<br />
versus enrichment at bottom-center drain (k), was illustrated by calculating <strong>the</strong> percentage<br />
of pellet flushing due to enrichment alone:<br />
k<br />
% flushing due toenrichment<br />
= ⋅100<br />
(Eq. 8)<br />
k + Q / V<br />
The radial flow mechanism played a much larger role than <strong>the</strong> mass transport mechanism<br />
in <strong>the</strong> transport of pellets to <strong>the</strong> bottom-center drain during <strong>the</strong> trials at 2 ex/hr and<br />
diameter:depth ratios of 3.1:1 and 6:1 and during <strong>the</strong> 1 ex/hr trials at diameter:depth ratios<br />
of 3.1:1 (Table 1). Pellets were not flushed effectively during <strong>the</strong> remainder of <strong>the</strong> trials,<br />
5
so <strong>the</strong> k-values and <strong>the</strong> enrichment percentage shown in Table 1 could not be calculated<br />
under <strong>the</strong>se conditions.<br />
Table 1. The relative amount of flushing produced by enrichment (i.e., k/[k+Q/V]*100) at<br />
<strong>the</strong> bottom-center drain was calculated for each trial that a k-value (listed before<br />
enrichment-value) could be estimated.<br />
k-value ± standard error (min) / enrichment ± standard error (%)<br />
Dia:depth = 3.1:1 Dia:depth = 6:1 Dia:depth = 12:1<br />
2 ex/hr (fish present)<br />
5% bottom flow 0.39±0.02 / 93±0 0.13±0.05 / 71±14 NA<br />
10% bottom flow 0.48±0.01 / 94±0 0.34±0.05 / 91±2 0.02±0.02 / 58±14<br />
20% bottom flow 0.87±0.24 / 96±1 0.58±0.06 / 95±1 0.07±0.03 / 0<br />
1 ex/hr (fish present)<br />
5% bottom flow 0.06±0.04 / 84±2 NA NA<br />
10% bottom flow 0.06±0.03 / 62±24 0.08±0.04 / 65±17 NA<br />
20% bottom flow 0.10±0.04 / 80±7 0.20±0.02 / 91±1 NA<br />
2 ex/hr (no fish)<br />
5% bottom flow 0.08±0.04 / 61±17 NA NA<br />
10% bottom flow 0.53±0.14 / 93±2 NA NA<br />
20% bottom flow 1.37±0.02 / 98±0 0.00±0.01 / 12±12 NA<br />
1 ex/hr (no fish)<br />
5% bottom flow -0.01±0.00 / 83±0 NA NA<br />
10% bottom flow 0.01±0.04 / 29±9 NA NA<br />
20% bottom flow 0.08±0.00 / 0 NA NA<br />
Note, an enrichment-value of zero indicates that <strong>the</strong> term (k/[k+Q/V]*100) was negative, e.g., <strong>the</strong> beads<br />
took longer to flush than <strong>the</strong> hydraulic exchange rate through <strong>the</strong> tank. NA indicates that ei<strong>the</strong>r bead<br />
flushing was so poor that k-values could not be calculated, or that bottom-drain pipe velocity was too low<br />
to flush beads and <strong>the</strong> tests were not run.<br />
Additionally, not all of <strong>the</strong> data was included in <strong>the</strong> linear regression of <strong>the</strong> bead-pulse data<br />
as plotted according to <strong>the</strong> –LN(fraction of solids remaining) versus time, as in <strong>the</strong><br />
example shown in Figure 2. This data was excluded because it did not fit <strong>the</strong> 1 st order<br />
kinetics assumption for solids enrichment at <strong>the</strong> bottom-center drain. We think that when<br />
large portions of <strong>the</strong> pellets did not exhibit enrichment at <strong>the</strong> center drain according to 1 st<br />
order kinetics, it was due to insufficient velocity in <strong>the</strong> rotational flow, i.e. <strong>the</strong> actual water<br />
velocity starting from <strong>the</strong> outside wall. Under <strong>the</strong>se low velocity conditions, <strong>the</strong> pellets<br />
did not flush rapidly because <strong>the</strong>y settled on <strong>the</strong> tank floor just before reaching <strong>the</strong> tank’s<br />
center drain. Velocities at <strong>the</strong> outside walls appear to require velocities of at least 15 cm/s<br />
(0.5 ft/s) to promote solids departure from <strong>the</strong> center drain.<br />
The pellet-pulse data when plotted according to <strong>the</strong> –LN(fraction of solids remaining)<br />
versus time (Figure 2) also provides a graphical estimate of <strong>the</strong> time required for <strong>the</strong> beads<br />
to travel from <strong>the</strong> tank’s surface to <strong>the</strong> bottom center drain, i.e., <strong>the</strong> dead time (t0) for<br />
solids flushing from <strong>the</strong> tank. The x-intercept of this data provides <strong>the</strong> estimate of <strong>the</strong><br />
6
tank’s dead time. When fish were present, average dead times ranged from 1.0 to 2.6 min<br />
for all conditions tested.<br />
Tank Mixing<br />
When water rotates about a circular tank, a torus-shaped region about <strong>the</strong> center drain can<br />
become an irrotational zone with lower velocities and poor mixing (Timmons et al., 1998).<br />
However, according to <strong>the</strong> dye-tracer tests, <strong>the</strong> ‘Cornell-type’ dual-drain tank exhibited<br />
good mixing characteristics during all trials with fish present, as illustrated by tank<br />
turnover efficiencies near 1.0. However, mixing was often better during <strong>the</strong> 2 ex/hr trials<br />
than at <strong>the</strong> 1 ex/hr trials.<br />
Settleable Solids Fractionation and Waste Management<br />
Due to variability in <strong>the</strong> TSS data, <strong>the</strong> TSS data collected during all trials was combined<br />
according to its sampling location. This data indicates that <strong>the</strong> flow discharged from <strong>the</strong><br />
‘Cornell-type’ tank’s bottom-center drain contained TSS concentrations (i.e., 19.6 ± 3.6<br />
mg/L) that were more than 10-times greater than <strong>the</strong> TSS concentration discharged from<br />
<strong>the</strong> side wall drain (i.e., 1.5 ± 0.2 mg/L). For <strong>the</strong>se trials, <strong>the</strong> concentration of TSS<br />
discharged from <strong>the</strong> side-wall drain was sufficiently low that it would not require fur<strong>the</strong>r<br />
solids treatment in order to pass even many of <strong>the</strong> more stringent discharge limits imposed<br />
by environmental regulatory agencies. On <strong>the</strong> o<strong>the</strong>r hand, <strong>the</strong> concentrated and relatively<br />
small flow discharged from <strong>the</strong> bottom-center drain would definitely require treatment<br />
before discharge. However, this flow was treated effectively using a microscreen filter<br />
where, on average, capture of <strong>the</strong> TSS discharged from <strong>the</strong> circular culture tank’s bottomcenter<br />
drain was greater than 80%.<br />
Acknowledgments<br />
The work reported in this publication was supported in part by <strong>the</strong> Nor<strong>the</strong>astern Regional<br />
Aquaculture Center at <strong>the</strong> University of Massachusetts Dartmouth through grant number<br />
96-38500-3032 from <strong>the</strong> Cooperative State Research, Education, and Extension Service<br />
(CREES) of <strong>the</strong> United States Department of Agriculture (USDA). Any opinions,<br />
findings, conclusions, or recommendations expressed in this publication are those of <strong>the</strong><br />
authors and do not necessarily reflect <strong>the</strong> view of <strong>the</strong> USDA or any of <strong>the</strong>ir sub-agencies.<br />
Literature Cited<br />
Levenspiel, O. 1989. Chemical Reactor Omni Book. Oregon State Univ., Corvallis, OR.<br />
Timmons, M.B., S.T. Summerfelt, and B.J. Vinci. 1998. Review of circular tank<br />
technology and management. Aquacultural Engineering 18(1): 51-69.<br />
Warren-Hansen, I. 1982. Methods of treatment of waste water from trout farming. <strong>Pages</strong><br />
113-121 In J. Alabaster (ed.), EIFAC Technical Paper No. 41. Report of <strong>the</strong> EIFAC<br />
Workshop on Fish-Farm Effluents, Silkeborg, Denmark, 26-28 May, 1981, FAO Rome.<br />
7
Introduction<br />
A Partial-Reuse System for Coldwater Aquaculture<br />
Steven Summerfelt, Research Engineer<br />
John Davidson, Research Associate<br />
Thomas Waldrop, Systems Manager<br />
Scott Tsukuda, Research Engineer<br />
The Conservation Fund’s Freshwater Institute<br />
Shepherdstown, West Virginia<br />
Traditionally, coldwater species have been cultured in raceways that take advantage of<br />
large water supplies in locations where space may be limited, as in <strong>the</strong> Idaho Snake River<br />
valley and <strong>the</strong> mountains of North Carolina. Making <strong>the</strong> most of a large water resource,<br />
water is often serially reused as it flows by gravity from raceway to raceway that are stairstepped<br />
down a hillside. Recently, more stringent water pollution control and water use<br />
permitting, as well as limited availability of large high-quality water resources, have<br />
increased interest in alternate culture systems that can economically sustain (or even<br />
increase) fish production levels using smaller water volumes and removing a larger<br />
fraction of <strong>the</strong> waste produced. To this end, <strong>the</strong> Freshwater Institute has designed and<br />
evaluated a partial-recirculating system capable of supporting high production densities on<br />
≤ 20% of <strong>the</strong> flow required within a single-pass system 1 . As well, this partial-reuse system<br />
incorporates ‘Cornell-type’ dual-drain circular culture tanks that can provide uniformly<br />
healthy water quality, optimized water velocities for fish health and condition, and solids<br />
removal that is rapid, gentle, and much more efficient (Timmons et al., 1998). These<br />
properties of round tanks present key advantages over raceways and ear<strong>the</strong>n ponds.<br />
Additionally, using a dual-drain system to remove settleable solids has <strong>the</strong> potential to<br />
improve <strong>the</strong> economics of solids removal both within <strong>the</strong> culture tank’s water column and<br />
from <strong>the</strong> effluents of flow-through and water-reuse systems. When a circular fish-culture<br />
tank is converted into a “swirl” separator, <strong>the</strong> concentrated solids are removed from <strong>the</strong><br />
culture tank within a relatively small flow stream leaving <strong>the</strong> bottom-drawing center drain.<br />
Meanwhile, in a ‘Cornell-type’ dual-drain culture tank, <strong>the</strong> majority of <strong>the</strong> flow (relatively<br />
free of settleable solids) is discharged from <strong>the</strong> tank through a fish-excluding port located<br />
partway up <strong>the</strong> tank side-wall (Summerfelt et al., 2000a). Once <strong>the</strong> solids are<br />
concentrated into a much smaller discharge, this reduced flow can be treated much more<br />
economically and more efficiently with a device such as a microscreen filter or settling<br />
basin.<br />
1 This work was supported by <strong>the</strong> US Department of Agriculture, Agricultural Research Service, under<br />
grant agreement number 59-1930-8-038.<br />
1
Partial-Reuse Systems<br />
Ideally, <strong>the</strong> concentration of dissolved oxygen and density of fish density will be <strong>the</strong> first<br />
limits to fish production within a reuse system, which requires successfully controlling<br />
dissolved carbon dioxide, un-ionized ammonia, and nitrite levels. For salmonids, <strong>the</strong><br />
maximum upper safe limits for chronic exposure to carbon dioxide and un-ionized<br />
ammonia have been reported to range from ≤ 9 to 30 mg/L and from ≤ 0.0125 to 0.03<br />
mg/L, respectively (Noble and Summerfelt, 1996; Wedemeyer, 1996). Nitrite can kill<br />
rainbow trout at concentrations of ≥ 0.20-0.40 mg/L unless o<strong>the</strong>r anions such as calcium<br />
or chloride are present. Fortunately, water containing at least 50 mg/L of calcium or<br />
chloride ions can increase a fish’s tolerance to nitrite 50-fold (Wedemeyer, 1996).<br />
Dissolved carbon dioxide and un-ionized ammonia are in acid-base equilibrium with,<br />
respectively, <strong>the</strong> dissolved inorganic carbon system 2 and <strong>the</strong> total ammonia-nitrogen<br />
system 3 . Therefore, <strong>the</strong> amount of dissolved carbon dioxide and un-ionized ammonia<br />
present depends upon <strong>the</strong> water’s pH and, respectively, <strong>the</strong> aqueous concentrations of<br />
inorganic carbon and total ammonia-nitrogen present. The influence of pH on acid-base<br />
equilibrium is important because dissolved carbon dioxide and un-ionized ammonia are<br />
much more toxic to fish than ammonium and o<strong>the</strong>r species of <strong>the</strong> dissolved inorganic<br />
carbon system.<br />
Partial-reuse systems do not use biofilters to control ammonia levels. Therefore, in order<br />
to dilute <strong>the</strong> ammonia produced a partial-reuse system must rely on much larger make-up<br />
water flow rates than fully-recirculating systems, typically 10-20% of <strong>the</strong>ir total flow<br />
(depending upon <strong>the</strong> alkalinity of <strong>the</strong> water as discussed later). However, to help prevent<br />
un-ionized ammonia-nitrogen concentrations from accumulating to unsafe levels, <strong>the</strong><br />
water’s pH is maintained at minimum levels that are just below where <strong>the</strong> shift in<br />
equilibrium in <strong>the</strong> dissolved inorganic carbon system would produce limiting<br />
concentrations of dissolved carbon dioxide. Ideally <strong>the</strong>n, only as much dissolved carbon<br />
dioxide will be stripped as is necessary to maintain safe dissolved carbon dioxide levels.<br />
Thus, both unionized-ammonia and dissolved carbon dioxide concentrations can be<br />
minimized within <strong>the</strong> partial-reuse system.<br />
Materials and Methods<br />
Partial-Reuse System<br />
The Freshwater Institute’s pilot-scale partial-reuse system (Figure 1) consisted of three 12<br />
ft id x 3.5 ft deep circular ‘Cornell-type’ dual-drain culture tanks (Figure 2). The water<br />
flowing from <strong>the</strong> culture tank’s bottom-center drain is immediately discharged from <strong>the</strong><br />
center. The water flowing out of <strong>the</strong> ‘Cornell-type’ side-wall drains is all collected and<br />
2 Dissolved carbon dioxide is in equilibrium with o<strong>the</strong>r components of <strong>the</strong> dissolved inorganic carbon<br />
system, i.e., carbonic acid (H2CO3), bicarbonate (HCO3 - ), and carbonate (CO3 = ).<br />
3 Ammonia exists in two forms, ei<strong>the</strong>r as un-ionizied ammonia (NH3) or as <strong>the</strong> ammonium ion (NH4 + ).<br />
2
filtered through 90 μm openings within a rotating drum filter (Model RFM 3236, PRA<br />
Manufacturing Ltd., Nanaimo, British Columbia, Canada) before it enters a pump sump<br />
(Figure 1). O<strong>the</strong>r than a small water overflow from <strong>the</strong> pump sump, <strong>the</strong> majority of water<br />
is pumped by one, two, or three 1.5-hp centrifugal pumps (Model B2-½TPMS, Berkley<br />
Pumps, Delevan, Wisconsin) through an packed aeration column (Figure 1). The water<br />
exiting <strong>the</strong> aeration column <strong>the</strong>n gravity flows back to <strong>the</strong> culture tanks after first passing<br />
through a low head oxygenator (Model MS-LHO-400 gal/min, aluminum construction,<br />
PRA Manufacturing Ltd.) installed within a cone-bottom sump (Figure 1). The system<br />
water’s pH was controlled by adjusting <strong>the</strong> amount of carbon dioxide stripped by turning<br />
<strong>the</strong> fan “on” and “off.” Initially, fan control was manual, but later a pH controller (GLI<br />
International, Milwaukee, Wisconsin) was used.<br />
Fish and Feeding<br />
The partial-reuse system was stocked with 36,943 15-gram rainbow trout. Fish were fed a<br />
High Fat Trout Grower diet (Zeigler Bro<strong>the</strong>rs, Gardner, PA) that contained approximately<br />
38% crude protein and 12% crude fat. Fish were first hand fed to satiation and later fed<br />
to satiation using a commercial ultrasonic waste feed controller that was developed by<br />
Culture Tools, Inc. (Monkton, VT), as described by Tsukuda et al. (2000). Records were<br />
kept on <strong>the</strong> number of 22.7 kg (50 lb) feed bags fed daily (e.g., 0, 1, or 2 bags per tank per<br />
day) and <strong>the</strong>n <strong>the</strong>se numbers were summed to provide a weekly total feed consumption.<br />
Dead fish were removed daily and weak-appearing trout were culled daily. Records were<br />
kept on <strong>the</strong> number of culled and dead fish removed. Mean fish size was estimated<br />
bimonthly by weighing in bulk around 300 fish from each tank. Feed conversion rates<br />
were calculated from <strong>the</strong> total mass of feed fed divided by <strong>the</strong> total mass of fish produced.<br />
No chemical or antibiotic treatments were used during this study. The experimental<br />
protocol and <strong>the</strong> methods described were in compliance with <strong>the</strong> Animal Welfare Act<br />
(9CFR) requirements and were approved by <strong>the</strong> Freshwater Institute Institutional Animal<br />
Care and Use Committee.<br />
Water Quality Determination<br />
Dissolved oxygen, pH, temperature and flow probes were used to continuously monitor<br />
water quality and quantity within <strong>the</strong> system. Additionally, water samples were collected<br />
three times weekly (typically) to quantify <strong>the</strong> concentrations of total ammonia-nitrogen,<br />
nitrite-nitrogen, nitrate-nitrogen, dissolved carbon dioxide, pH, alkalinity, and total<br />
suspended solids, at several locations within <strong>the</strong> system.<br />
3
Figure 1. The partial-recirculating system at <strong>the</strong> Freshwater Institute serves as a nursery<br />
to grow rainbow trout fingerlings from 15 g to over 100 g. The CAD drafting was<br />
provided by PRAqua Technologies Ltd. (Nanaimo, British Columbia).<br />
Figure 2. A fabrication drawing depicting <strong>the</strong> ‘Cornell-type’ dual-drain tank used in <strong>the</strong><br />
Freshwater Institute’s partial-reuse system. The CAD drafting was provided by Red<br />
Ewald Inc. (Karnes City, TX).<br />
4
Results and Discussion<br />
Fish Growth and Production<br />
Over <strong>the</strong> production cycle 398 dead fish were removed (1.1%) and ano<strong>the</strong>r 553 fish were<br />
culled (1.5%). Over <strong>the</strong> same period, <strong>the</strong> culture tank’s fish density increased from 35<br />
kg/m 3 to as much as 148 kg/m 3 , before fish were harvested (Figure 3). Mean fish size<br />
increased from 15 grams on December 16 (1999) to 100 g on March 13 (2000), an<br />
interval of only 88 days. The fish’s specific growth rate was 2.14% of <strong>the</strong>ir body weight<br />
per day. During this same period, <strong>the</strong> fish biomass increased by 2,994 kg (6,586 lb) and<br />
<strong>the</strong> fish were fed 3,509 kg (7,719 lb) of feed, producing a feed conversion of 1.17.<br />
Fish density, kg/m 3<br />
160<br />
140<br />
120<br />
100<br />
80<br />
60<br />
40<br />
20<br />
0<br />
fish stocked into 2 tanks<br />
Figure 3. Fish densities within <strong>the</strong> partial-reuse system during <strong>the</strong> study.<br />
Overall Water Quality and Water Flowrates<br />
fish split into 3 tanks<br />
Mean water quality data recorded during <strong>the</strong> study is shown in Table 1. Relevant water<br />
flow rates during <strong>the</strong> study: 1142-1847 L/min total system flow, 237-357 L/min make-up<br />
flow, and 169 L/min total bottom-drain flow. Thus, <strong>the</strong> bottom drain flow and system<br />
make-up water flow were only, respectively, 12-15% and 19-21% of <strong>the</strong> total system flow<br />
throughout <strong>the</strong> study.<br />
5<br />
75 kg of fish harvested<br />
262 kg of fish harvested<br />
382 kg of fish harvested<br />
12/16/99 1/7/00 1/29/00 2/8/00 2/9/00 2/25/00 3/10/00 3/13/00 3/20/00<br />
Date (month/day/year)
Table 1. Mean values (± standard error) for water temperature (Temp), dissolved oxygen<br />
(DO), pH, dissolved carbon dioxide (CO2), un-ionized ammonia-nitrogen (NH3-N), total<br />
ammonia-nitrogen (TAN), and nitrite nitrogen (NO2 - ).<br />
Temp, DO,<br />
CO2, NH3-N,<br />
NO3,*<br />
°C mg/L pH mg/L μg/L mg/L mg/L mg/L<br />
12.6±0.1 9.9±0.2 7.27±0.02 26.7±0.7 12±5 2.7±0.1 0.28±0.03 1.8±0.1<br />
#<br />
Make-up water contained practically zero total ammonia-nitrogen and nitrite-nitrogen.<br />
*Nitrate-nitrogen did not increase in <strong>the</strong> system.<br />
Solids Control<br />
6<br />
TAN, #<br />
NO2, #<br />
The ‘Cornell-type’ dual-drain tank was found to rapidly and gently concentrate and flush<br />
78% (8.9 ± 0.7 kg/day) of <strong>the</strong> total suspended solids produced daily through <strong>the</strong> tank’s<br />
bottom-center drain (Table 2). This discharge leaving <strong>the</strong> system amounted to only 12-<br />
15% of <strong>the</strong> tank’s total water flow, but this flow flushed <strong>the</strong> majority of particles from <strong>the</strong><br />
system within only 1-5 minutes of <strong>the</strong>ir deposition into <strong>the</strong> culture tank (data not shown).<br />
The o<strong>the</strong>r source of solids discharge from <strong>the</strong> partial-reuse system, <strong>the</strong> system’s drum<br />
filter backwash, only contained 22% (2.5 ± 0.3 kg/day) of <strong>the</strong> daily solids produced (Table<br />
2). Solids fractionation within <strong>the</strong> culture tank was extremely effective -- <strong>the</strong> total<br />
suspended solids concentration discharged through <strong>the</strong> three culture tanks’ bottom-center<br />
drains (26.2 ± 2.1 mg/L) was ten times greater than <strong>the</strong> total suspended solids<br />
concentration discharge through <strong>the</strong> three culture tanks’ side-wall drains (2.5 ± 0.2 mg/L)<br />
(Table 2). Also amazingly, <strong>the</strong> recirculating flow returning to <strong>the</strong> culture tanks only<br />
contained an average of 1.3 ± 0.1 mg/L of total suspended solids (Table 2), due to fur<strong>the</strong>r<br />
solids removal across <strong>the</strong> partial-reuse system’s microscreen drum filter. The make-up<br />
water to <strong>the</strong> system typically only contain 0.5 mg/L of suspended solids, so <strong>the</strong> solids<br />
concentration of <strong>the</strong> water entering <strong>the</strong> culture tanks was nearly <strong>the</strong> equal of <strong>the</strong> site’s<br />
spring water supply! Fur<strong>the</strong>r treatment of <strong>the</strong> flow discharged from <strong>the</strong> tank’s bottomcenter<br />
drain using a commercial microscreen filter <strong>the</strong>n captured 82% (± 4%) of <strong>the</strong> TSS<br />
in <strong>the</strong> bottom discharge (Table 2), so that only an average of 3.5 ± 0.8 mg/L TSS would<br />
be discharged with <strong>the</strong> bottom flow. An off-line settling tank treating <strong>the</strong> drum filter<br />
backwash flow captured 97% of <strong>the</strong> TSS (data not shown), so overall solids capture was<br />
about 80% of <strong>the</strong> total solids produced in <strong>the</strong> partial-reuse system. This 80% solids<br />
capture efficiency (and thus total phosphorus captured) was much greater than could be<br />
captured from typical raceways operations (only 25-51% capture reported by Mudrak<br />
[1981]) containing quiescent zones and off-line settling ponds. Also, <strong>the</strong> solids filter<br />
treating <strong>the</strong> discharge from <strong>the</strong> partial-reuse system would be less than one-half <strong>the</strong> size<br />
and cost of a similar unit scaled to treat <strong>the</strong> much larger flow discharged from a raceway<br />
operation of relatively similar annual fish production. Additionally, because of its relatively<br />
small size, <strong>the</strong> system discharge could also be treated with an even finer cloth-covered disk<br />
filter or using some combination of settling tanks, wetlands, or sand filters if stringent state<br />
or federal discharge regulations required greater treatment.
Table 2. The average concentration and mass of total suspended solids (± standard error).<br />
Sampling Sites<br />
Conc. of total suspended solids,<br />
mg/L<br />
7<br />
Mass of total suspended solids,<br />
kg/day<br />
Bottom drain effluent<br />
Tank 1 25.3 ± 2.6 2.7 ± 0.3<br />
Tank 2 27.2 ± 4.3 3.1 ± 0.5<br />
Tank 3 26.6 ± 4.1 3.2 ± 0.6<br />
Overall Mean = 26.2 ± 2.1 Total = 8.9 ± 0.7<br />
Side drain effluent<br />
Tank 1 2.3 ± 0.3 2.1 ± 0.3<br />
Tank 2 2.9 ± 0.4 2.3 ± 0.3<br />
Tank 3 2.4 ± 0.3 2.2 ± 0.3<br />
Overall Mean = 2.5 ± 0.2 Total = 6.6 ± 0.5<br />
Drum filter backwash 1.2 ± 0.1 2.5 ± 0.3<br />
Culture tank influent 1.3 ± 0.1 3.3 ± 0.3<br />
Make-up water 0.5 ± 0.2 0.6 ± 0.2<br />
Ammonia and Carbon Dioxide Control<br />
Ammonia accumulations in <strong>the</strong> partial-reuse system were controlled simply by dilution<br />
with make-up water. Consequently, ammonia was <strong>the</strong> main form of dissolved nitrogen<br />
found within <strong>the</strong> partial-reuse system studied, with only small amounts of nitrite produced<br />
and practically no nitrate produced (Table 1). Thus, <strong>the</strong> little nitrification that did occur<br />
was incomplete, probably because inadequate surface area was provided to support<br />
complete nitrification. The nitrite levels recorded remained relatively safe because of <strong>the</strong><br />
high calcium levels naturally present in <strong>the</strong> water.<br />
As mentioned above, un-ionized ammonia accumulations were controlled using a<br />
combination of pH control and make-up water exchange rates of 19-21%. However, <strong>the</strong><br />
high alkalinity in <strong>the</strong> make-up water supply, about 265 mg/L as CaCO3, limited <strong>the</strong><br />
minimum pH were <strong>the</strong> system could safely operate and still avoid dissolved carbon dioxide<br />
limitations (as in Figure 2). Maintaining a culture tank pH of about 7.3 (Table 1) shifted<br />
<strong>the</strong> acid-base equilibrium of <strong>the</strong> carbonate system to produce dissolved carbon dioxide<br />
levels of 20-30 mg/L, which defined <strong>the</strong> lower pH limit within <strong>the</strong> culture tanks. This pH<br />
also defined <strong>the</strong> maximum un-ionized ammonia levels allowed to accumulate.<br />
Additionally, a nomographic method was developed to estimate <strong>the</strong> maximum total<br />
ammonia-nitrogen that could be allowed to accumulate in a partial-reuse system,<br />
depending upon <strong>the</strong> water’s alkalinity and assumed maximum limits on <strong>the</strong> concentrations<br />
of dissolved carbon dioxide and un-ionized ammonia (Figure 4). In Figure 2, <strong>the</strong> gray<br />
lines indicate how setting maximum limits on <strong>the</strong> concentrations of dissolved carbon
dioxide (1) and un-ionized ammonia (3), at a given alkalinity (2), will set <strong>the</strong> minimum<br />
operating pH and <strong>the</strong> maximum allowable TAN (4). Note that alkalinity is unchanged by<br />
carbon dioxide addition or removal. Stripping carbon dioxide increases pH levels as <strong>the</strong><br />
total carbonate content of <strong>the</strong> water is decreased, shifting <strong>the</strong> inorganic carbon system’s<br />
acid-base equilibrium as bicarbonate releases carbonate ions (Summerfelt et al., 2000b).<br />
Therefore, following a constant alkalinity line in Figure 4 (top graph), <strong>the</strong> water’s pH<br />
could be increased by some fraction of 1 pH-unit if stripping reduced a portion of <strong>the</strong><br />
carbon dioxide. Note, make-up water alkalinity is <strong>the</strong> controlling factor determining water<br />
reuse rates in partial-reuse systems. Water supplies with lower alkalinity levels would<br />
allow for much higher accumulations of total ammonia-nitrogen than a more alkaline<br />
water supply, such as used in this study. Therefore, coldwater fish farms located in<br />
regions that contain groundwater with low alkalinity, such as portions of North Carolina,<br />
Maine, and British Columbia (to name a few), could operate partial-reuse systems with<br />
make-up water flow rates < 5% of <strong>the</strong> total system flow rates.<br />
Literature Cited<br />
Mudrak, V. A. 1981. Guidelines for economical commercial fish hatchery wastewater<br />
treatment systems. pgs 174-182 In: Proceedings of <strong>the</strong> Bio-engineering <strong>Symposium</strong> for<br />
Fish Culture. American Fisheries Society, Be<strong>the</strong>sda, MD.<br />
Noble, A.C. and S.T. Summerfelt. 1996. Diseases encountered in rainbow trout cultured<br />
in recirculating systems. Annual Review of Fish Diseases 6:65-92.<br />
Summerfelt, S. T., J. Davidson, M. B. Timmons. 2000. Hydrodynamics in <strong>the</strong> ‘Cornelltype’<br />
dual-drain tank. In: 3 rd International Conference on Recirculating Aquaculture (July<br />
19-21, 2000, Roanoke, VA). Virginia Tech, Blacksburg, VA.<br />
Summerfelt, S.T., B.J. Vinci and R. H. Piedrahita. 2000b. Oxygenation and carbon dioxide<br />
control in water reuse systems. Aquacultural Engineering 22: 87-108.<br />
Timmons, M.B., S.T. Summerfelt, and B.J. Vinci. 1998. Review of circular tank<br />
technology and management. Aquacultural Engineering 18(1):51-69.<br />
Tsukuda, S., R. Wallace, S. Summerfelt, and J. Hankins. 2000. Development of a third<br />
generation acoustic waste feed monitor. In: 3 rd International Conference on Recirculating<br />
Aquaculture (July 19-21, 2000, Roanoke, VA). Virginia Tech, Blacksburg, VA.<br />
Wedemeyer, G. A. 1996. Physiology of Fish in Intensive Culture. International Thompson<br />
Publishing, New York, New York.<br />
8
Total ammonia-nitrogen, mg/L<br />
Equilibrium carbon dioxide, mg/L<br />
100<br />
30<br />
20<br />
10<br />
100.0<br />
30.0<br />
20.0<br />
10.0<br />
3.0<br />
2.0<br />
1.0<br />
0.3<br />
0.2<br />
0.1<br />
1 2<br />
1<br />
50 mg/L<br />
6.0 6.5 7.0 7.5 8.0<br />
4<br />
pH<br />
6.0 6.5 7.0 7.5 8.0<br />
pH<br />
Figure 3. These two graphs illustrate <strong>the</strong> dependence of dissolved carbon dioxide<br />
concentrations on pH and alkalinity (top graph) and <strong>the</strong> dependence of un-ionized<br />
ammonia concentrations on pH and total ammonia-nitrogen (bottom graph), according to<br />
acid-base equilibrium. The gray lines indicate how setting maximum limits on <strong>the</strong><br />
concentrations of dissolved carbon dioxide (1) and un-ionized ammonia (3), at a given<br />
alkalinity (2), will set <strong>the</strong> minimum operating pH and <strong>the</strong> maximum allowable TAN (4).<br />
9<br />
3<br />
Alkalinity<br />
400 mg/L<br />
300 mg/L<br />
200 mg/L<br />
100 mg/L<br />
Equil. NH3<br />
0.025 mg/L<br />
0.0125 mg/L
Comparative Growth of All-Female Versus Mixed Sex<br />
Yellow Perch (Perca flavescens) in Recirculating<br />
Aquaculture Systems<br />
Mark H. Schmitz<br />
Hatchery Manager<br />
Brookcrest Fisheries, LTD.<br />
W3698 Cty Hwy G<br />
Cedar Grove, WI 53013<br />
Nine production-scale recirculating aquaculture systems were utilized to compare<br />
<strong>the</strong> growth parameters between all-female and mixed sex yellow perch stocks. Each<br />
system was stocked with 455 fish m -3 and contained one of three different biofilter types:<br />
a rotating biological contactor, a trickling filter, or a bead filter. The all-female<br />
fingerlings (S1) used were originally derived from Lake Mendota, Wisconsin. The<br />
mixed-sex fingerlings (S2) used were originally derived from Lake Erie. Temperature<br />
and photoperiod (23 o C, 16H-L) were maintained at levels for optimal growth.<br />
Absolute growth rates ranged from 0.27-0.48 g/day. Mean final density within<br />
treatments was 42.8 kg/m 3 and ranged from 37.2-50.2 kg/m 3 . The main effect of stock<br />
did not have a significant effect on growth (p > .1). All-female treatments exhibited more<br />
uniform growth. The main effect of filter type did have a significant effect on fish<br />
growth (p < .01), with fish in tanks containing trickling filters exhibiting significantly<br />
higher growth. Total feed conversion averaged 1.61 across all treatments and ranged<br />
from 1.38-1.78. S1 treatments consumed a significantly higher percent body weight per<br />
day than S2 treatments (p < .05).<br />
Analysis of PIT tagged individuals revealed that <strong>the</strong> mean relative growth rate<br />
was significantly higher in S2 individuals (513.9%) compared to S1 individuals (315.3%:<br />
p < .01). S2 females (597.8%) grew 1.9 times faster than S1 females (315.3%: p < .01).<br />
Within S2 individuals, females (597.8%) grew 1.5 times faster than males (395.2%: p <<br />
.05). For all individuals, 33.6% of <strong>the</strong> variation in final weight was explained by <strong>the</strong><br />
variation in initial weight. Differences in <strong>the</strong> geographic strain or culture history of <strong>the</strong>se<br />
stocks may have had a larger overall effect on growth than sexual classification (allfemale<br />
or mixed sex).<br />
Dress percentage of skin-on butterfly fillets was examined in 20 individuals per<br />
stock and in six groups of 20 individuals per stock. Within S2 individuals, 73.7% were<br />
female. Mean fillet yield was significantly greater in S1 individuals (47.6%) compared to<br />
S2 individuals (43.0%: p < .01). Mean GSI in S1 individuals (1.01%) was significantly<br />
higher than S2 individuals (0.54%: p < .05). Within S2 individuals, mean GSI was<br />
significantly higher in females (0.70%) when compared to males (0.08%: p < .05). Fillet<br />
yield was significantly greater in S1 groups (47.2%) compared to S2 groups (44.9%: p <<br />
.01). Within each stock fillet yield increased slightly with size.<br />
1
The difference in fillet yield demonstrated between <strong>the</strong>se stocks may be a result of<br />
differences in strain of origin. The identification of superior yellow perch strains or<br />
strain crosses with regard to growth rate and fillet percentage is of considerable<br />
importance to <strong>the</strong> industry.<br />
2
Effects of Temperature and Feeding Rates Upon Growth<br />
and Feed Conversion Ratios in Tilapia<br />
Stephen P. Kirkup Lori S. Marsh<br />
Graduate Research Associate Associate Professor<br />
Dept. of Biological Systems Eng. Dept. of Biological Systems Eng.<br />
Viginia Polytechnic Inst. and State Univ. Virginia Polytechnic Inst. and State Univ.<br />
George S. Libey Alan G. Heath<br />
Research Associate Professor Professor<br />
Dept. of Fisheries and Wildlife Science Dept. of Biology<br />
Virginia Polytechnic Inst. and State Univ. Virginia Polytechnic Inst. and State Univ.<br />
Charles W. Coale C. Gene Haugh<br />
Professor Professor<br />
Dept. of Agric. and Applied Econ. Dept. of Biological Systems Eng.<br />
Viginia Polytechnic Inst. and State Univ. Virginia Polytechnic Inst. and State Univ.<br />
Introduction<br />
Tilapia are ideally suited for culture in recirculating aquaculture systems. They are<br />
tolerant of poor water quality and low oxygen levels and breed prolifically. Although<br />
native to Africa and <strong>the</strong> Middle East, tilapia have been introduced in developing nations,<br />
such as South and Central America, Sou<strong>the</strong>ast Asia, Africa, China and <strong>the</strong> Philippines, as a<br />
dietary supplemental source of protein. Except for some of <strong>the</strong> sou<strong>the</strong>rn most regions of<br />
<strong>the</strong> United States, tilapia cannot be over-wintered in ponds, and <strong>the</strong>refore have not been<br />
widely cultured in ponds in <strong>the</strong> US. But many of <strong>the</strong> same characteristics that make tilapia<br />
popular for pond and cage cultures throughout <strong>the</strong> world also make <strong>the</strong>m ideally suited for<br />
recirculating aquaculture systems. In <strong>the</strong> United States and Canada, live tilapia command<br />
a premium price and thus have become a significant aquacultural product in major cities<br />
having large ethnic oriental populations. Recirculating aquaculture systems are ideally<br />
suited for serving <strong>the</strong>se live tilapia markets, because <strong>the</strong>y allow for year-round production<br />
and <strong>the</strong>y can be located reasonably close to <strong>the</strong> market, thus reducing transportation costs,<br />
stress and moralities incurred during transportation.<br />
Several efforts have been made to analyze <strong>the</strong> economics of raising tilapia in recirculating<br />
aquaculture systems (Head and Watanabe 1995; Losordo and Westerman 1994; O’<br />
Rourke 1996). Two of <strong>the</strong> largest costs in <strong>the</strong> production of tilapia are feed and fixed or<br />
overhead costs. Feed represents <strong>the</strong> largest of <strong>the</strong> variable costs. Losordo and Westerman<br />
estimate that feed accounts for approximately 21 percent of <strong>the</strong> total production cost,<br />
thus, any management practice that significantly improves <strong>the</strong> feed conversion efficiently<br />
1
will have a large effect upon <strong>the</strong> cost of product. Fixed costs, which are an amalgamation<br />
of all costs that are independent of <strong>the</strong> rate of production, also represent a large part of <strong>the</strong><br />
cost of production. In reality, most costs are a combination of a fixed and a variable<br />
component, and thus estimates of fixed costs will vary greatly depending upon which costs<br />
are considered fixed costs.<br />
Losordo and Westerman (1994) state that capital costs and depreciation of capital<br />
equipment account for approximately 34 percent of <strong>the</strong> total production cost, but <strong>the</strong>se<br />
costs are just two of <strong>the</strong> larger fixed costs. Thus total fixed costs would represent a much<br />
larger percentage of <strong>the</strong> cost of production than <strong>the</strong> 34 percent noted previously.<br />
O’Rourke (1996) divided all of his costs into ei<strong>the</strong>r fixed or variable, and calculated that<br />
fixed cost were 56 percent of total costs. Included in <strong>the</strong> list of fixed costs were wages,<br />
water, and maintenance, which usually would not be considered total fixed. It is fair to say<br />
however that fixed cost represent somewhere between 34 and 56 percent of total<br />
production costs. By definition, once a production facility is operational, fixed expenses<br />
remain constant. Fixed or overhead costs per unit of production change as <strong>the</strong> production<br />
rate changes, thus fixed costs as a percentage of total production costs can be reduced by<br />
increasing <strong>the</strong> production rate.<br />
The production rate for a given facility can be increased by ei<strong>the</strong>r increasing <strong>the</strong> stocking<br />
density or <strong>the</strong> growth rate. While increasing stocking densities is an obviously attractive<br />
goal, <strong>the</strong>re are physiological as well as engineering and physical limitations that limit <strong>the</strong><br />
culture intensity. Stocking density has been shown to negatively affect growth rates in<br />
many species of fish, although <strong>the</strong> responses vary. Poorer growth rates have been<br />
associated with higher stocking densities of tilapia raised in ponds, irrigation ditches or<br />
cages (Coche 1982; Carro-Anzalotta and McGinty 1986; D'Silva and Maughan 1996; Yi<br />
et al. 1996; Siddiqui et al. 1989), but little research has be conducted on tilapia in<br />
recirculating systems. Huang and Chiu (1997) researched <strong>the</strong> effects of stocking density<br />
on growth rates on tilapia fry smaller than 10 g, and observed that increasing stocking<br />
densities had a significantly negative effect upon size, size variation and survival rate.<br />
Regardless, <strong>the</strong> effect of stocking density is beyond <strong>the</strong> scope of <strong>the</strong> experiments reported<br />
herein. For this research project, a density of 5 gallons per fish was selected to minimize<br />
<strong>the</strong> effects of crowding.<br />
Fish physiologists do not fully understand <strong>the</strong> biological mechanisms that control <strong>the</strong><br />
growth rates of fish. Although <strong>the</strong>re have been numerous ma<strong>the</strong>matical models to<br />
describe <strong>the</strong> growth characteristics of fish, most of <strong>the</strong>se models do not take into account<br />
such important factors as availability of food, food quality or <strong>the</strong> effect of environmental<br />
factors such as temperature. This has given rise to <strong>the</strong> scientific field of bioenergetics,<br />
which partitions <strong>the</strong> energy consumed into various metabolic processes including<br />
production or growth, and waste products. While <strong>the</strong> bioenergetic models account for<br />
changes in energy consumption, measuring each of <strong>the</strong> energy partitions is labor intensive,<br />
and are usually measured as a function of only one variable; thus ignoring <strong>the</strong> interactions<br />
with o<strong>the</strong>r biological factors. Bioenergetics provides a reasonable growth projection for<br />
fish in <strong>the</strong> natural environment, but its usefulness for describing growth in recirculating<br />
2
aquaculture systems, where <strong>the</strong> environmental conditions can be controlled and<br />
manipulated, is very limited.<br />
The approach taken in our experiments is a direct approach. Environmental and biological<br />
conditions representative of recirculating aquaculture systems were established. The two<br />
factors that are thought to have <strong>the</strong> most impact on growth, food consumption and<br />
temperature, were <strong>the</strong>n varied, and <strong>the</strong> resulting growth was measured. While a great deal<br />
of research addresses <strong>the</strong> growth rates of tilapia, unfortunately for <strong>the</strong> recycle<br />
aquaculturist, almost all of <strong>the</strong> research has been conducted outside, where temperature<br />
and feeding rate can not be precisely controlled. What little research has been conducted<br />
indoors under controlled conditions has generally been conducted using fry or fingerlings<br />
(Soderberg 1990) ra<strong>the</strong>r than adults, because of space, time and economic considerations.<br />
Many researchers have assumed that growth and feeding characteristics of adult fish are<br />
similar to those of fingerlings. Assuming that <strong>the</strong> cost of raising fry to 50 grams represents<br />
only about 1/10 <strong>the</strong> total production cost of a 500-g fish, <strong>the</strong>n <strong>the</strong> commercial<br />
aquaculturists should be most interested in <strong>the</strong> management practices which effect <strong>the</strong><br />
remaining 90 % of <strong>the</strong> production costs.<br />
To fully understand this experimental approach, it is instructive to address <strong>the</strong> <strong>the</strong>oretical<br />
relationships between growth, feed conversion and feeding rates. J. R. Brett (1979) cites<br />
Thompson (1941) as <strong>the</strong> first researcher to propose an asymptotic type relationship<br />
between <strong>the</strong> specific ration level and <strong>the</strong> specific growth rate. An example of this<br />
relationship is shown in Figure 1. The general shape of <strong>the</strong> curve is intuitively obvious<br />
using basic fish physiology and bioenergetic principles. Energy for growth is available<br />
once <strong>the</strong> metabolic energy requirements have been satisfied. Growth increases rapidly as<br />
<strong>the</strong> ration level is increased above <strong>the</strong> maintenance level because a greater percentage of<br />
<strong>the</strong> ingested energy is being diverted to growth requirements. But as <strong>the</strong> ration increases,<br />
digestion efficiency decreases, and thus as ration is increased above <strong>the</strong> optimal level, <strong>the</strong><br />
percentage of total energy consumed that is diverted to growth starts decreasing, although<br />
<strong>the</strong> total amount of energy, and <strong>the</strong>refore growth, is still increasing. Significant and easily<br />
recognizable points on this curve are <strong>the</strong> y-intercept of <strong>the</strong> curve (R0, Gstarv) which is<br />
where <strong>the</strong> ration is zero and <strong>the</strong> fish are losing weight to starvation. The next point is <strong>the</strong><br />
x-intercept (Rmaint, G0), where <strong>the</strong> growth rate is zero and <strong>the</strong> fish is just fed a sufficient<br />
amount to maintain its weight. The point Ropt, Gopt represents <strong>the</strong> point where <strong>the</strong> feed<br />
conversion ratio is at its optimal point. The point Rmax, Gmax represents both <strong>the</strong> maximum<br />
food consumption and growth rates. The aquaculturist wants to be located somewhere on<br />
<strong>the</strong> curve between Ropt, Gopt and Rmax, Gmax. As you move along that portion of <strong>the</strong> curve,<br />
increased growth rate is being traded off for a reduced feed conversion ratio (FCR)<br />
(weight of feed consumed divided by <strong>the</strong> weight gained) and <strong>the</strong> production of more waste<br />
products. Any feeding rate to <strong>the</strong> left of Ropt is undesirable, because it represents a suboptimal<br />
fed conversion ratio coupled with a slower growth rate. Thus <strong>the</strong> first objective or<br />
our experiments was to identify <strong>the</strong> optimal and maximum feeding and growth rates so<br />
that a rational economic tradeoff can be made between improving growth rate and lowing<br />
feed conversion efficiency.<br />
3
Figure 1. Specific Growth Rate of fingerling sockeye salmon (mean weight, 13 g) in<br />
relation to specific feed ration, at 10° C (Brett 1979) (Data from Brett et al. 1969).<br />
The graph shown in Figure 1 is applicable for one specific size and species of fish, at a<br />
specific temperature. As <strong>the</strong> fish grows, <strong>the</strong> specific growth and ration rates decline, but<br />
<strong>the</strong> general shape of <strong>the</strong> curve would be expected to remain roughly <strong>the</strong> same. While a<br />
large amount of information is available for <strong>the</strong> effect of temperature on Gmax, relatively<br />
little information is available on temperature effects on Gopt and Gstarv.<br />
Brett (1979) has plotted various specific growth curves as a function of temperature. In<br />
general, increasing culture temperature increases <strong>the</strong> food consumption and growth rate<br />
up to <strong>the</strong> point where higher temperatures start to inhibit <strong>the</strong> appetite. Above this<br />
temperature maximum, <strong>the</strong> lines of Gopt and Gmax should be nearly coincident due to <strong>the</strong><br />
rapidly increasing metabolic requirements at elevated temperatures coupled with <strong>the</strong><br />
inability to ingest more energy. Below <strong>the</strong> temperature that produces <strong>the</strong> maximum<br />
growth rate, difference between optimal and maximum growth rates increases rapidly with<br />
an increasing amount of energy available for growth.<br />
It should be noted that apparently <strong>the</strong> optimal growth temperature for salmonids, sockeye<br />
salmon (Brett 1974) and brown trout (Elliott 1975, as cited in Brett 1979) remains<br />
independent of size. Brett (1979) also cites <strong>the</strong> work of Oshima and Ihava (1969) that<br />
shows for <strong>the</strong> case of yellowtail (Seriola quinqueradiata) that <strong>the</strong> <strong>the</strong>rmal optima<br />
decreases from 27° C to 21° C for juveniles and adults respectively. Previous growth<br />
experiments coupled with <strong>the</strong> extremely <strong>the</strong>rmophilic nature of tilapia would tend to<br />
suggest that <strong>the</strong> optimal growth temperature for tilapia would be near <strong>the</strong> upper lethal<br />
temperature limit, somewhat in excess of 30° C.<br />
4
Figure 2. Growth relationships of young sockeye salmon as a function of temperature<br />
(Brett 1979) (data from Brett et al. 1969.)<br />
Materials and Methods<br />
A. Experimental Design<br />
The experiment design was a 3 (temperatures) by 4 (feeding levels) factorial design having<br />
two replicates. Tilapia are normally considered a strongly <strong>the</strong>rmophilic genus; juveniles of<br />
O. niloticus have a <strong>the</strong>rmal preference in <strong>the</strong> 30 to 36 °C range. Previous research on O.<br />
niloticus (Likongwe et al., 1996) and O. mossambicus, including our own in a preexperimental<br />
trial, indicated that culture temperatures near 30° C give far superior growth<br />
rates for juveniles than lower temperatures. To bracket what was considered <strong>the</strong> most<br />
likely optimal growth temperature, culture temperatures of 26, 29 and 32 °C were<br />
selected. The feeding treatments for each temperature were satiation feeding four times a<br />
day, and 87, 73 and 60 % of <strong>the</strong> specific satiation-feeding rate for that temperature. The<br />
fish were fed at about 4-hour intervals starting at 8 AM and ending at approximately 9<br />
PM. Timers operated <strong>the</strong> room lights, which were on daily from 6 AM to 9 PM. Fish on a<br />
restricted diet were fed approximate ¼ of <strong>the</strong>ir daily ration at each feeding. Those tanks<br />
fed to satiation were fed for approximately an hour, at <strong>the</strong> end of that period, any excess<br />
feed floating at <strong>the</strong> surface was collected and counted, and a corresponding number of<br />
pellets were returned to <strong>the</strong> container for each tank. At <strong>the</strong> end of <strong>the</strong> day, <strong>the</strong> amount of<br />
feed consumed by <strong>the</strong> tanks fed to satiation were calculated, <strong>the</strong> rates of <strong>the</strong> two replicates<br />
for each temperature were averaged, and <strong>the</strong> feed for <strong>the</strong> fish on restricted diets was<br />
weighted out for <strong>the</strong> following day.<br />
B. Experimental Set-Up and Materials<br />
The fish used for <strong>the</strong>se experiments are called “Rocky Mountain White Tilapia”, although<br />
a best guess is that <strong>the</strong>y are a white inter-specific species of <strong>the</strong> genus Oreochromis,<br />
primarily O. niloticus, O. aureus, and O. mossambicus (Hallerman 2000). This hybrid has<br />
been selectively bred at Blue Ridge Fisheries, Martinsville, Virginia, for its color and<br />
5
growth rate. The color makes this hybrid highly desirable in <strong>the</strong> live fish market because of<br />
<strong>the</strong>ir attractive appearance. This hybrid has relatively good growth and o<strong>the</strong>r physiological<br />
attributes that make it well suited to culture in high-density aquaculture systems. Although<br />
predominately white, <strong>the</strong> fish range in color from a pure white, a bluish and golden white,<br />
to a few natural reddish brown. The female fry were chemically sex reversed, and graded<br />
twice at Blue Ridge Fisheries to obtain a relative uniform size prior to delivery to Virginia<br />
Tech. The fish weighed approximately 30 g but were held for 18 days before starting <strong>the</strong><br />
experiments to insure that all <strong>the</strong> fish were acclimatized to <strong>the</strong>ir new environment and any<br />
stressed-induced moralities or infections associated with transportation and handling had<br />
subsided.<br />
Although <strong>the</strong> fish had initially been randomly distributed among <strong>the</strong> tanks, immediately<br />
prior to commencing <strong>the</strong> experiments, <strong>the</strong> fish were reshuffled. This ensured that any size<br />
bias due to <strong>the</strong> holding period was eliminated, and <strong>the</strong> fish were equally distributed among<br />
<strong>the</strong> tanks.<br />
The fish were kept in 24, 150-gallon, Rubbermaid agricultural watering troughs. These<br />
troughs had a large oval footprint, but were only approximately 24 in. deep. The troughs<br />
were placed in a two-tier arrangement on two sets of pallet shelves that were separated by<br />
a center walkway. This was done to raise <strong>the</strong> tanks off <strong>the</strong> floor so <strong>the</strong>y could be drained<br />
easily, and to minimize <strong>the</strong> required floor space.<br />
A cube, consisting of 36, 50-mm diameter by 325-mm long polypropylene biofilm media,<br />
was placed in each tank. The cubes were assembled by melting <strong>the</strong> ends of <strong>the</strong> media<br />
toge<strong>the</strong>r with a clo<strong>the</strong>s iron, and <strong>the</strong>n attaching a slab of concrete on one end to weigh it<br />
down. In addition to acting as a biofilter, it also served several o<strong>the</strong>r purposes. Aquarium<br />
heaters were caged in <strong>the</strong> cube to prevent damage to <strong>the</strong> tank, and air stones (one for<br />
oxygen and ano<strong>the</strong>r for compress air) were attached to <strong>the</strong> bottom of <strong>the</strong> cube to provide<br />
oxygen and water circulation.<br />
Pure oxygen was required to obtain acceptable levels of dissolved oxygen in <strong>the</strong> culture<br />
water. A central distribution system was used to distribute <strong>the</strong> oxygen to all of <strong>the</strong> tanks,<br />
and although <strong>the</strong>re was a pressure regulator for controlling <strong>the</strong> oxygen pressure within <strong>the</strong><br />
distribution system, <strong>the</strong> only mechanism that was available for controlling <strong>the</strong> flow to <strong>the</strong><br />
individual tanks was a brass needle valve. Thus <strong>the</strong>re was no effective means of regulating<br />
<strong>the</strong> oxygen flow to each tank. The shallow depth of <strong>the</strong> tanks made <strong>the</strong> oxygen transfer<br />
efficiency extremely low, thus <strong>the</strong> pressure in distribution system was adjusted to maintain<br />
at least <strong>the</strong> minimum oxygen flow to every tank. Although, one would expect greater <strong>the</strong><br />
oxygen demand from both <strong>the</strong> fish and <strong>the</strong> bacteria and poorer oxygen transfer efficiencies<br />
at higher temperatures, <strong>the</strong> average of all daily DO concentrations for all feeding<br />
treatments were strikingly similar for each temperature. The average measured DO was<br />
9.8, 9.5 and 9.8 for <strong>the</strong> 26, 29 and 32 ºC treatments respectively.<br />
Two 300-watt aquarium heaters per tank maintained water temperature. The response<br />
time was slow, producing a diurnal temperature cycle; i.e., water temperature was slightly<br />
6
greater than <strong>the</strong> desired temperature during <strong>the</strong> day, and slightly cooler than <strong>the</strong> desired<br />
temperature at night. Because <strong>the</strong> 300-watt aquarium heaters could not obtain 32 °C, <strong>the</strong><br />
maximum experimental temperature, a 500-watt aquarium heater having a separate<br />
temperature control and heating element was used for <strong>the</strong> warmest temperature treatment.<br />
To help maintain <strong>the</strong> water temperatures, <strong>the</strong> room temperature was held between 27 and<br />
29 °C depending upon <strong>the</strong> outside temperature. The high ceilings in <strong>the</strong> laboratory created<br />
<strong>the</strong>rmal stratification, thus, to maintain <strong>the</strong> desired temperatures, tanks receiving <strong>the</strong><br />
highest temperature treatments were assigned to <strong>the</strong> upper shelf and <strong>the</strong> lowest<br />
temperature-treatment tanks were on <strong>the</strong> lower shelf.<br />
Water quality was maintained by a daily water exchange. Initially <strong>the</strong> test protocol called<br />
for a daily exchange of approximately 1/3 of <strong>the</strong> volume, but it became apparent that<br />
water quality was poor due to <strong>the</strong> buildup of organics. In general, <strong>the</strong> more feed and <strong>the</strong><br />
lower <strong>the</strong> water temperature, <strong>the</strong> poorer <strong>the</strong> water quality. Thus some tanks had water<br />
exchanges of up to 80 % daily, while o<strong>the</strong>r tanks only required a 25 % replacement.<br />
Two Aqua Star 135,000-BTU liquid propane gas heaters were used to provide warm<br />
water. Soft water was always used to prevent chemical deposits from building up in <strong>the</strong><br />
heaters. A Kohler constant temperature valve was used to provide water at <strong>the</strong> proper<br />
temperature for each temperature treatment. Usually all <strong>the</strong> water exchanges were<br />
completed during <strong>the</strong> morning, between <strong>the</strong> 8 AM and noon feedings.<br />
C. Instrumentation and Data Collected<br />
Temperatures were measured every minute using copper-constantan <strong>the</strong>rmocouples in<br />
each tank. To prevent induced voltages from <strong>the</strong> aquarium heaters into <strong>the</strong><br />
<strong>the</strong>rmocouples, it was necessary to put a ground wire into each tank. The temperatures<br />
were recorded using a Campbell CR10 datalogger, in conjunction with a Campbell<br />
AM416 multiplexer. Average daily temperatures and <strong>the</strong> standard deviation of <strong>the</strong><br />
temperature were recorded daily. A 486 IBM-compatible computer was used to<br />
constantly monitor <strong>the</strong> water temperatures as well as some of <strong>the</strong> operating parameters of<br />
<strong>the</strong> data logger. Every morning prior to feeding, temperatures and DO levels were<br />
measured using a YSI Model 58 oxygen meter to ensure that <strong>the</strong> temperature and oxygen<br />
were within acceptable levels.<br />
At 5-week intervals, <strong>the</strong> fish were weighed and <strong>the</strong> formulas for calculating feeding rates<br />
were readjusted to adjust for <strong>the</strong> relative weight of fish in each tank. This compensated for<br />
any differences in <strong>the</strong> number of fish in each tank as well as <strong>the</strong> difference in <strong>the</strong> average<br />
weight in each tank. The fish were weighed and measured at <strong>the</strong> beginning, middle and<br />
end of <strong>the</strong> 20-week experiment. In order to weigh <strong>the</strong> individual fish, <strong>the</strong> tanks were<br />
completely drained, <strong>the</strong> fish were removed and placed in a tank contain MS 222, before<br />
being weighed and measured to <strong>the</strong> nearest gram and millimeter respectively. This process<br />
was hard on <strong>the</strong> fish, and fish would not eat well for several days following <strong>the</strong><br />
measurement procedures. At <strong>the</strong> interim 5 and 15-week points, all <strong>the</strong> fish were removed<br />
and placed in one or two water-filled buckets and were weighed to <strong>the</strong> nearest 5-g<br />
7
increment. This procedure stressed <strong>the</strong> fish much less and normal feeding patterns<br />
resumed in a matter of days. The fish were not fed <strong>the</strong> day prior to being measured. At <strong>the</strong><br />
termination of <strong>the</strong> experiments, <strong>the</strong> fish were taken off feed for three days prior to <strong>the</strong><br />
initiation of harvesting, which lasted approximately one and one half days. The tanks were<br />
drained, and <strong>the</strong> fish were placed on ice for approximately an hour or two, to anes<strong>the</strong>tize<br />
<strong>the</strong> fish and increase <strong>the</strong> rigor, making <strong>the</strong>m easier to fillet and reducing <strong>the</strong> amount of<br />
blood in <strong>the</strong> fillet. The fish were weighed and measured just prior to being filleted.<br />
Results<br />
A. Growth Rates<br />
As noted in <strong>the</strong> introduction, <strong>the</strong> most critical information to <strong>the</strong> aquaculturist is <strong>the</strong><br />
maximum specific feeding and growth rates, <strong>the</strong> optimal feeding and growth rates, and <strong>the</strong><br />
temperature that provides <strong>the</strong> best combination of growth and feed conversion. To reduce<br />
<strong>the</strong> data to manageable volume, it is important to first identify <strong>the</strong> treatments that provide<br />
<strong>the</strong> optimal and maximum growth rates.<br />
During <strong>the</strong> course of <strong>the</strong> experiments, <strong>the</strong>re were relatively few moralities. Since <strong>the</strong> tanks<br />
were left uncovered, a number of fish jumped out of <strong>the</strong> tanks during <strong>the</strong> course of <strong>the</strong><br />
experiment. Although <strong>the</strong> weights, lengths and location of <strong>the</strong> “leapers” were recorded,<br />
weights could not be accurately recorded due <strong>the</strong> condition of <strong>the</strong> carcass, and <strong>the</strong><br />
experimental unit of origin could not be conclusively identified. To calculate feed<br />
conversion ratios (FCRs), specific feed consumption and intermediate growth rates for<br />
intermediate intervals, assumptions had to be made regarding <strong>the</strong> leapers and <strong>the</strong> data<br />
ma<strong>the</strong>matically manipulated to account for changes in <strong>the</strong> number of fish between<br />
measurement intervals.<br />
Since <strong>the</strong> fish were taken off feed <strong>the</strong> day of and one day prior to <strong>the</strong> measurements, <strong>the</strong><br />
experimental interval was considered to be 33 days. The last experimental interval was<br />
only 31 days, since <strong>the</strong> fish were taken off feed 3 days prior to harvesting. The total<br />
duration of <strong>the</strong> test was thus considered to be 130 days. Each measurement interval was<br />
<strong>the</strong>n subdivided into thirds, or an 11-day interval. The number of fish was assumed to<br />
change evenly during <strong>the</strong> measurement interval, and thus fish lost during <strong>the</strong> experiment<br />
were assumed to have consumed some of <strong>the</strong> feed during <strong>the</strong> measurement interval. From<br />
<strong>the</strong>re, <strong>the</strong> average daily food consumption and daily FCRs were calculated. Using <strong>the</strong><br />
measured weights of <strong>the</strong> fish, <strong>the</strong> daily feed consumption, and <strong>the</strong> calculated FCRs,<br />
specific growth and feeding rates were calculated.<br />
A summary of <strong>the</strong> overall test results is shown in Table 1. As expected, <strong>the</strong> largest growth<br />
was observed in <strong>the</strong> three treatments that were fed to satiation. What is surprising is that<br />
<strong>the</strong> total amount of feed consumed by fish fed to satiation was virtually identical for all<br />
three temperature treatments. A plot of cumulative feed consumption verses time (Figure<br />
3) illustrates this point.<br />
8
Figure 3. Cumulative feed consumption over <strong>the</strong> course of <strong>the</strong> experiment for tilapia fed<br />
to satiation over <strong>the</strong> period of an hour, 4 times a day.<br />
Cumulative feed consumed (g)<br />
700<br />
600<br />
500<br />
400<br />
300<br />
200<br />
100<br />
0<br />
0 20 40 60 80 100 120 140<br />
Time (d)<br />
9<br />
26 deg C<br />
29 deg C<br />
32 deg C<br />
Figures 3 and 4 show that fish reared at 32 °C initially consumed more food than fish<br />
reared at lower temperatures. Figure 4 illustrates <strong>the</strong> daily feeding patterns of <strong>the</strong> fish fed<br />
to satiation. The higher <strong>the</strong> temperature, <strong>the</strong> more rapid <strong>the</strong> rise in daily feed consumption,<br />
but <strong>the</strong> sooner it plateaus and <strong>the</strong> lower <strong>the</strong> height of <strong>the</strong> plateau. At <strong>the</strong> midpoint of <strong>the</strong><br />
experiment, <strong>the</strong> fish were removed, anes<strong>the</strong>tized, and individually weighed and measured.<br />
It took more than two weeks for <strong>the</strong>ir appetite to fully recover from <strong>the</strong> trauma of this<br />
procedure. This can be seen in Figure 4, by <strong>the</strong> dip in average feed consumed around day<br />
70. The procedure used at <strong>the</strong> 5- and 15-week interval, where fish were removed,<br />
counted and weighed as a group in a bucket of water, had only minimal effect upon <strong>the</strong><br />
subsequent feeding behavior of <strong>the</strong> fish.<br />
The average weight change for each treatment is listed below in descending order of <strong>the</strong><br />
absolute weight gain. Statistical Analysis System (SAS) was used to perform a Duncan’s<br />
Multiple Range Test at α = 0.05 to compare <strong>the</strong> significance of <strong>the</strong> changes in weight.<br />
Since <strong>the</strong> fish fed to satiation consumed about <strong>the</strong> same amount of food cumulatively, it is<br />
not surprising that <strong>the</strong> fish within <strong>the</strong> various feeding level treatments are indistinguishable<br />
from each o<strong>the</strong>r, while <strong>the</strong>re are differences across feeding levels. The exception being <strong>the</strong><br />
satiation and 87 % of satiation treatments that are almost statistically indistinguishable as<br />
indicated by <strong>the</strong> A and B groupings. Worth noting is that within <strong>the</strong> feeding treatments,<br />
<strong>the</strong> lower <strong>the</strong> temperature, <strong>the</strong> lower or better <strong>the</strong> FCR. Thus, within each feeding<br />
treatment, <strong>the</strong> repositioning of <strong>the</strong> temperature treatments is primarily due to <strong>the</strong><br />
differences in <strong>the</strong> amount of food consumed, ra<strong>the</strong>r than <strong>the</strong> FCRs.
Table 1. Summary of Test Results for each treatment Average of two replicates of,<br />
weight gained, calculated food consumed and Feed Conversion Ratios<br />
Treatments<br />
Ave Weight Duncan’s Feeding<br />
Temp. °C Feeding Level Gain (g) Groupings g/fish FCR<br />
26 Satiation 441.9 A 631 1.43<br />
32 Satiation 408.8 A B 637 1.56<br />
29 Satiation 405.8 A B 621 1.53<br />
29 87 % 396.5 A B 528 1.33<br />
26 87 % 392.6 B 497 1.27<br />
32 87 % 363.6 B 527 1.45<br />
29 73 % 290.9 C 391 1.35<br />
32 73 % 279.7 C 393 1.41<br />
26 73 % 278.0 C 360 1.29<br />
26 60 % 205.6 D 275 1.34<br />
32 60 % 203.9 D 293 1.41<br />
29 60 % 200.8 D 268 1.34<br />
Figure 4. Average daily feed consumption over 11-day sampling interval of fish fed to<br />
satiation (averaged over <strong>the</strong> two replicates) for <strong>the</strong> three temperature treatments.<br />
Daily feed consumption (g/day)<br />
7<br />
6<br />
5<br />
4<br />
3<br />
2<br />
1<br />
0<br />
0 20 40 60 80 100 120 140<br />
Days<br />
If <strong>the</strong> average growth is plotted as a function of time, some interesting observations that<br />
are important to <strong>the</strong> following discussion can be made. Since <strong>the</strong> 60 %- and 73 %-of -<br />
satiation feeding treatments resulted in such poor growth results, only <strong>the</strong> satiation and 87<br />
% of satiation growth trends are shown in Figure 5. Each data point represents <strong>the</strong><br />
average size of <strong>the</strong> fish, plotted at <strong>the</strong> mid-point of <strong>the</strong> 5-week time interval. Note that as<br />
<strong>the</strong> fish grow, <strong>the</strong> temperature associated with <strong>the</strong> maximum growth rate is declining, and<br />
<strong>the</strong> growth rate for all treatments in <strong>the</strong> final 5-week period declines precipitously. The<br />
temperature corresponding to maximum growth shifts form 32 °C to 29 °C approximately<br />
10<br />
26 deg C<br />
29 deg C<br />
32 deg C
35 days into <strong>the</strong> experiment, and <strong>the</strong>n shifts again to 26 °C at approximately <strong>the</strong> 60-day<br />
mark.<br />
Figure 5. Average daily growth over a 5-week period for each temperature treatment fed<br />
to satiation or 87 %-of-satiation (averaged over <strong>the</strong> two replicates).<br />
Daily growth rate (g/day)<br />
5<br />
4.5<br />
4<br />
3.5<br />
3<br />
2.5<br />
2<br />
1.5<br />
1<br />
0.5<br />
0<br />
0 20 40 60 80 100 120 140<br />
Days<br />
11<br />
26 deg satation<br />
26 deg 87% sat<br />
29 deg satation<br />
29 deg 87% sat<br />
32 deg satation<br />
32 deg 87% sat<br />
B. The effects of temperature and feeding treatments on FCRs<br />
As noted previously, <strong>the</strong> aquaculturist is interested in two specific feeding rates, <strong>the</strong> one<br />
that produces maximum growth (Rmax), and <strong>the</strong> o<strong>the</strong>r that produces <strong>the</strong> best FCR (Ropt).<br />
Any specific rate between Rmax and Ropt is trading better fed utilization at <strong>the</strong> sacrifice of<br />
growth. Before addressing <strong>the</strong>se issues fur<strong>the</strong>r, it is worth addressing <strong>the</strong> FCRs calculated<br />
from <strong>the</strong> each of <strong>the</strong> treatments. The FCRs for each treatment for each of <strong>the</strong> 5-week<br />
intervals are shown below.<br />
Table 2. Summary of Calculated feed conversion ratios for each treatment. Ratios were<br />
calculated based of average growth and feed consumed over each 5-week interval.<br />
Treatments<br />
FCR 1<br />
Temp. °C Feeding Level<br />
st<br />
FCR 2<br />
5 weeks<br />
nd<br />
FCR 3<br />
5 weeks<br />
rd<br />
FCR 4<br />
5 weeks<br />
th<br />
5 weeks<br />
26 Satiation 1.30 1.33 1.19 2.06<br />
26 87 % 1.28 1.20 0.94 2.40<br />
26 73 % 1.25 1.31 1.08 1.64<br />
26 60 % 1.18 1.24 1.15 2.28<br />
29 Satiation 1.36 1.38 1.38 2.31<br />
29 87 % 1.24 1.18 1.21 1.91<br />
29 73 % 1.18 1.20 1.22 2.29<br />
29 60 % 1.17 1.24 1.28 2.22<br />
32 Satiation 1.37 1.56 1.49 1.94<br />
32 87 % 1.28 1.35 1.26 2.26<br />
32 73 % 1.20 1.33 1.35 2.09<br />
32 60 % 1.16 1.41 1.28 3.11
For each treatment, <strong>the</strong> FCR over <strong>the</strong> first 15 weeks remains relatively constant, where as<br />
<strong>the</strong> FCR increases markedly in <strong>the</strong> last quarter of <strong>the</strong> experiment. Even after<br />
ma<strong>the</strong>matically increasing <strong>the</strong> final weight 2 % for <strong>the</strong> days <strong>the</strong> fish were being depurated<br />
prior to being harvested, and adjusting <strong>the</strong> growth for <strong>the</strong> shortened feeding period,<br />
growth in <strong>the</strong> final 5-week interval was on average 32 % less than <strong>the</strong> prior 5-week<br />
period. Thus <strong>the</strong> primary cause of <strong>the</strong> increased FCRs was due to poor growth as opposed<br />
to an increase in fed consumption. Brett (1979) states that a large decrease in growth rate<br />
is associated with <strong>the</strong> onset of maturity, although he is not specific about whe<strong>the</strong>r he<br />
means sexual or physical maturity. The graph of FCR verses weight would seem to<br />
indicate that this sharp jump in FCR, which is normally associated with <strong>the</strong> onset maturity,<br />
is more a function of time ra<strong>the</strong>r than size of <strong>the</strong> fish. This conclusion was checked<br />
statistically using <strong>the</strong> GLM procedure of SAS. Nei<strong>the</strong>r of <strong>the</strong> treatment factors, i.e.<br />
temperature and feeding rate, or average size had a significant effect upon <strong>the</strong> FCR value<br />
in <strong>the</strong> final 5-week interval. Below is a graph of FCR verses weight for <strong>the</strong> 26 ºC<br />
treatments, which is of greater interest, but o<strong>the</strong>rwise representative of <strong>the</strong> o<strong>the</strong>r<br />
temperature treatments.<br />
Figure 6. Calculated FCR ratios for 5-week test intervals verse calculated average weight<br />
of tilapia<br />
FCR (g/g)<br />
3<br />
2.5<br />
2<br />
1.5<br />
1<br />
0.5<br />
0<br />
0 50 100 150 200 250 300 350 400 450 500<br />
Weight (g)<br />
12<br />
satiation<br />
87% of sat<br />
73% of sat<br />
60% of sat<br />
The differences in FCRs between <strong>the</strong> four feeding treatments are insignificant relative to<br />
<strong>the</strong> changes in FCR measured during <strong>the</strong> final interval. Thus <strong>the</strong> final interval represents<br />
<strong>the</strong> worst of all options to <strong>the</strong> aquaculturists, a rapidly declining absolute growth rate and<br />
feed conversion ratio, at a time when <strong>the</strong> fish are occupying <strong>the</strong> greatest volume and <strong>the</strong><br />
largest proportion of fixed costs. Although dangerous to project beyond limits of <strong>the</strong> data,<br />
it is reasonable to assume that <strong>the</strong> change in FCRs is representative of a gradual ra<strong>the</strong>r<br />
than an abrupt change. Since <strong>the</strong> FCRs were relatively constant during <strong>the</strong> preceding time<br />
intervals, it is fair to assume that FCRs and growth rates would have been even poorer for<br />
a subsequent 5-week time interval.
C. Maximum specific feed consumption rates<br />
It seems reasonable to assume <strong>the</strong> maximum growth rate is obtained on <strong>the</strong> maximum<br />
ration. Figure 7 presents <strong>the</strong> average specific feeding rates for each of <strong>the</strong> three<br />
experimental temperatures. A line has been fitted to each temperature data set, although<br />
<strong>the</strong> data points following <strong>the</strong> weighing and measuring, at <strong>the</strong> midpoint of <strong>the</strong> experiment<br />
were largely ignored when fitting <strong>the</strong>se curves. It should be noted that <strong>the</strong> amount of feed<br />
consumed each day varied greatly, <strong>the</strong> most usual pattern was a cycle of 6 or 7 days of<br />
increasing amounts, and <strong>the</strong>n a sudden drop followed by a repeat of <strong>the</strong> cycle. The origin<br />
of this cycle is unknown, but was not considered a water quality problem due to <strong>the</strong> large<br />
daily exchange of water, <strong>the</strong> relatively low level of nitrogenous waste products and <strong>the</strong><br />
maintenance of minimum dissolved oxygen concentrations. Thus it might be advisable to<br />
feed slightly below <strong>the</strong> levels specified in <strong>the</strong> graph to prevent <strong>the</strong> possibility of<br />
overfeeding.<br />
Figure 7. Maximum specific daily feed ratio as a function of weight<br />
Specific feed consumption (g/g/day)<br />
D. Weights of females verse males<br />
6<br />
5<br />
4<br />
3<br />
2<br />
1<br />
0<br />
0 100 200 300 400 500 600<br />
Weight (g)<br />
13<br />
26 deg C<br />
29 deg C<br />
32 deg C<br />
Although <strong>the</strong> female fry were chemically sex reversed, which should have yield all males,<br />
this procedure is not 100 % effective. At <strong>the</strong> termination of <strong>the</strong> experiment <strong>the</strong> fish were<br />
weighed, measured and filleted. During <strong>the</strong> filleting process, <strong>the</strong> sex of fish was based on<br />
<strong>the</strong>ir internal sex organs. Fifty-two out of a total of 579 fish were identified during <strong>the</strong><br />
filleting process as being female. The females were not distributed uniformly among <strong>the</strong><br />
experimental units, and thus a comparison of <strong>the</strong> mean female weight verses those of <strong>the</strong><br />
males could not be conducted because of <strong>the</strong> size and weight differences among <strong>the</strong><br />
treatments. Thus to compute an average size and weight difference, <strong>the</strong> measurements of<br />
each female were compared to <strong>the</strong> average measurement of <strong>the</strong> males in that test unit. The
percentage size differences for each female were <strong>the</strong>n averaged toge<strong>the</strong>r to produce an<br />
average difference. It was found that <strong>the</strong> females were 87.9 % of <strong>the</strong> length of <strong>the</strong> males,<br />
but only 66.6 % of <strong>the</strong> male weight. For tanks that had at least three females, a t-test was<br />
used to compare <strong>the</strong> weights of females to males. In each case, <strong>the</strong> males were<br />
significantly larger at <strong>the</strong> = 0.05 level.<br />
E. Coefficient of Variation<br />
The coefficient of variation is <strong>the</strong> standard deviation divided by <strong>the</strong> mean, thus <strong>the</strong> mean<br />
acts as a scaling factor so that standard deviations can be compared, from one sample to<br />
ano<strong>the</strong>r. If all <strong>the</strong> fish grow at <strong>the</strong> same specific growth rate, <strong>the</strong> coefficient of variation<br />
would remain constant. If, on <strong>the</strong> o<strong>the</strong>r hand, some fish grow proportionally faster than<br />
o<strong>the</strong>rs, possibly due to sex or aggressiveness, <strong>the</strong> coefficient of variation will increase with<br />
time or size.<br />
Table 3 provides <strong>the</strong> average value of <strong>the</strong> coefficient of variation for each treatment for<br />
<strong>the</strong> three measurement intervals. An ANOVA repeated measurement analysis was<br />
conducted using SAS. At <strong>the</strong> α = 0.05 level, nei<strong>the</strong>r time, temperature nor feeding level<br />
resulted in statistically significant differences in <strong>the</strong> coefficient of variation.<br />
Table 3. Summary of <strong>the</strong> average values of <strong>the</strong> coefficient of determination at <strong>the</strong><br />
beginning, midpoint, and end of <strong>the</strong> experiment for each treatment<br />
Treatments<br />
Temp. °C Feeding Level<br />
Discussion and Conclusions<br />
14<br />
Coefficient of Determination<br />
0 weeks 10 weeks 20 weeks<br />
26 Satiation 0.26 0.27 0.27<br />
26 87 % 0.27 0.27 0.47<br />
26 73 % 0.24 0.24 0.26<br />
26 60 % 0.25 0.32 0.29<br />
29 Satiation 0.27 0.29 0.33<br />
29 87 % 0.22 0.22 0.23<br />
29 73 % 0.29 0.25 0.26<br />
29 60 % 0.27 0.28 0.34<br />
32 Satiation 0.23 0.25 0.28<br />
32 87 % 0.28 0.29 0.28<br />
32 73 % 0.24 0.28 0.29<br />
32 60 % 0.24 0.32 0.35<br />
Average 0.25 0.27 0.30<br />
Std. Dev. 0.047 0.045 0.089<br />
It should be reiterated that <strong>the</strong> fish used in this experiment were sex-reversed, graded<br />
twice, and had been selectively bred for several generations. Thus <strong>the</strong> growth performance
of <strong>the</strong> fish used in this experiment may not be representative of <strong>the</strong> general population of<br />
tilapia in <strong>the</strong> United States.<br />
This research yielded some surprising results, which differentiates <strong>the</strong> grow-out cycle of<br />
<strong>the</strong> tilapia from most cold or cool water fishes. First, <strong>the</strong> optimal growth temperature of<br />
many cool water fish remains relatively constant as <strong>the</strong> fish grow, but <strong>the</strong> tilapia<br />
demonstrated a decrease in <strong>the</strong> optimal growth temperature. Fur<strong>the</strong>r research is required<br />
to determine if <strong>the</strong> ultimate growth performance would be obtained by gradually reducing<br />
<strong>the</strong> temperature as <strong>the</strong> fish grows. A sudden increase in <strong>the</strong> food conversion ratio and<br />
slowing of <strong>the</strong> growth rate in <strong>the</strong> final five-week period across all <strong>the</strong> treatments<br />
regardless of size is believed to be associated with <strong>the</strong> onset of sexual maturity. Most cool<br />
and cold water fish use environmental factors, such as light and temperature as cues to<br />
initiate <strong>the</strong> spawning cycles. But in tropical fish such as <strong>the</strong> tilapia, which may not have<br />
<strong>the</strong>se cues in nature, a temporal cycle may initiate sexual maturity.<br />
It should be reiterated that <strong>the</strong> fish used in this experiment were sex-reversed, graded<br />
twice, and had been selectively bred for several generations. Thus <strong>the</strong> growth performance<br />
of <strong>the</strong> fish used in this experiment may not be representative of <strong>the</strong> general population of<br />
tilapia in <strong>the</strong> United States.<br />
The onset of maturation in all treatments in <strong>the</strong> same time interval has reduced a seemingly<br />
complex management problem to a relatively simple management objective. The<br />
overriding objective for <strong>the</strong> tilapia producer is to grow <strong>the</strong> tilapia to a marketable size<br />
before <strong>the</strong> fish matures and <strong>the</strong> growth rate and feed conversion efficiency dramatically<br />
decline.<br />
The tilapia producer is blessed with an animal that is relatively insensitive to <strong>the</strong> effects of<br />
temperature, crowding and water quality, and thus has been successful up to this point<br />
inspite of poor management practices. Unfortunately for <strong>the</strong> recirculating aquaculturist,<br />
<strong>the</strong> large production benefits anticipated by being able to tightly control <strong>the</strong> culture<br />
environment are probably unattainable due to <strong>the</strong> relative insensitivity of performance to<br />
temperature.<br />
The growth and FCR dropped dramatically for all treatments in <strong>the</strong> final 5 weeks of <strong>the</strong>se<br />
tests, which has important economic implications for <strong>the</strong> tilapia producer. While <strong>the</strong><br />
aquaculturist has always had economic incentive to minimize <strong>the</strong> production cycle time,<br />
this experiment indicated <strong>the</strong> extent to which production expenses are rising while<br />
productivity is declining once <strong>the</strong> fish start to mature. The producer has much incentive to<br />
harvest at an age prior to maturation, within <strong>the</strong> constraint of <strong>the</strong> fish reaching marketable<br />
size. The whole price of tilapia is generally a based upon <strong>the</strong> size, fish greater than 600 g<br />
bring a premium price, those between approximately 350 and 600 an intermediate price,<br />
and those less than 350 g a lesser price (Fitzsimmons and Posadas 1997).<br />
While <strong>the</strong> specific economic effects will to vary greatly among producers, <strong>the</strong>re are several<br />
management practices that should be adopted to improve profitability. Because <strong>the</strong> males<br />
15
were found to be 50 % larger than <strong>the</strong> females, a much higher percentage of males will<br />
reach marketable size within a given production cycle. Thus, <strong>the</strong> first step is to try to sexreverse<br />
<strong>the</strong> females, or develop all-male breeding techniques. Selective breeding<br />
procedures for rapid growth should be used. Lastly, stunted fish should be culled early in<br />
<strong>the</strong> growth cycle and culling should continue thought <strong>the</strong> growout period.<br />
There are several management practices that <strong>the</strong> producer should avoid. Topping as a<br />
harvesting procedure should be avoided, because as <strong>the</strong> fish that are left represent <strong>the</strong><br />
poorest growth and feed conversion performances. As an alternative, creative methods<br />
for marketing undersize fish, such as smoking fish of appropriate size to be sold as an<br />
individual appetizer, or filleting fish for local fish fries, should be implemented.<br />
The management techniques of <strong>the</strong> fingerling supplier should be known by <strong>the</strong> producer to<br />
avoid suppliers that grade <strong>the</strong>ir fingerlings, but retain <strong>the</strong> culls. A producer should<br />
positively avoid purchasing end-of-<strong>the</strong>-season sales by pond producers, as <strong>the</strong>se fish are<br />
probably very poor performers.<br />
As noted in <strong>the</strong> introduction, <strong>the</strong> fish were stocked in our experiments at a density that<br />
would not inhibit growth. It is well documented that increasing densities inhibits <strong>the</strong><br />
growth of tilapia, but whe<strong>the</strong>r it also inhibits <strong>the</strong> maturation process has not been<br />
documented. Olivier and Kaiser (1997) reported that increasing density inhibited <strong>the</strong><br />
growth and <strong>the</strong> maturation of Xiphophorus helleri, if a similar process happens with<br />
tilapia, <strong>the</strong> drop in <strong>the</strong> growth rate due to higher stocking densities may also delay<br />
maturation and <strong>the</strong> precipitous rise in FCR. Although high stocking densities may extend<br />
<strong>the</strong> production cycle, <strong>the</strong>y may not be as detrimental to <strong>the</strong> FCRs as would be expected.<br />
References<br />
Brett, J.R., Environmental Factors and Growth, In: W.S. Hoar, D.J. Randall and J.R.<br />
Brett (eds.) Fish Physiology, Vol. VIII ( Bioenergetics and Growth), pp. 599 – 675. New<br />
York : Academic Press,. 1979.<br />
Brett, J.R., J.E. Shelbourn, and C.T. Shoop. 1969. Growth rate and body composition of<br />
fingerling sockeye salmon, Oncorhynchus nerka, in relation to temperature and ration size,<br />
J. of Fish. Res. Board Can. 26, pp. 2363-2394.<br />
Carro-Anzalotta A. E. and A.S. McGinty. 1986. Effects of Stocking Density on Growth<br />
of Tilapia nilotica Cultured in Cages in Ponds. J. of World Aquaculture Soc., Vol. 17. pp.<br />
52 - 57.<br />
Caulton, M.S. Feeding, metabolism and growth of tilapias: some quantitative<br />
considerations, pp. 157 - 180, In: R.S.V. Pullin and R.H. Lowe-McConnell (eds.) The<br />
Biology and Culture of Tilapias, Proceedings of <strong>the</strong> International Conference on <strong>the</strong><br />
Biology and Culture of Tilapias, 1980. International Center for Living Aquatic Resources<br />
Management, Manila. Philippines. 1982.<br />
16
Coche, A.G. Cage culture of tilapias, pp. 205-264. In: R.S.V. Pullin and R.H. Lowe-<br />
McConnell (eds.) The Biology and Culture of Tilapias, Proceedings of <strong>the</strong> International<br />
Conference on <strong>the</strong> Biology and Culture of Tilapias, 1980. International Center for Living<br />
Aquatic Resources Management, Manila. Philippines. 1982.<br />
Degani, G. 1991. Effect of diet, population density and temperature on growth of larvae<br />
and juveniles of Tichogaster trichopterus (Bloch and Schneider 1801). Journal of<br />
Aquaculture in <strong>the</strong> Tropics 6, pp. 135-141.<br />
Degani, G. 1993. Growth and body composition of juveniles of Pterophyllum scalare<br />
(Liechtenstein) (Pisces: Cichidae) at different densities and diets. Aquaculture and<br />
Fisheries Management 24, pp. 725-730.<br />
D'Silva, A.M. and O.E. Maughan. 1996. Optimum Density of Red Tilapia Oreochromis<br />
mossambicus x O. urolepis hornorum in a Pulsed-Flow Culture System. Journal of <strong>the</strong><br />
World Aquaculture Society. 27 (1): pp. 126-129.<br />
Elliott, J.M. 1975. The growth rate of brown trout, Salmo trutta L., fed on maximum<br />
rations J. Anim. Ecol. 44,pp. 805-821.<br />
Fitzsimmons, K. and B.C. Posadas. Consumer Demand for Tilapia Products in <strong>the</strong> U.S.<br />
and <strong>the</strong> Effects on Local Markets in Exporting Countries. In: Fitsimmons, K. (ed.) Tilapia<br />
Aquaculture Proceedings form <strong>the</strong> Forth International <strong>Symposium</strong> on Tilapia in<br />
Aquaculture. NRAES-106. Orlando, Florida. 1997.<br />
Hallerman, E.M. 2000. Personal Communication. Dept. of Fisheries and Wildlife Science<br />
Virginia Tech University. Blacksburg, Virginia.<br />
Head, W.D., A. Zerbi and W.O.Watanabe. 1995. Economic analysis of a commercialscale,<br />
recirculating brackishwater hatchery for Florida red tilapia. Journal of Applied<br />
Aquaculture 5:2 pp. 1-23.<br />
Ho, J. and D. A. McArdle. The Live Fish Industry: A Restaurant Owner’s Perspective. In:<br />
Paust B. and J.B. Peters (ed.) Marketing and Shipping Live Aquatic Products. NRAES-<br />
107. <strong>Sea</strong>ttle, Washington. 1996.<br />
Huang W.B. and Chiu, T.S. 1997. Effects of stocking density on survival, growth, size,<br />
variation, and production of Tilapia fry. Aquaculture Research, No 28: pp. 165-173.<br />
Jorgensen, E.H., J.S. Christiansen and M. Jobling. 1993. Effects of stocking density on<br />
food intake, growth performance and oxygen consumption in Arctic charr (Salvelinus<br />
aplinus). Aquaculture, 110: pp. 191-204.<br />
17
Khan, M.S. 1994. Effect of population density on <strong>the</strong> growth, feed and protein conversion<br />
efficiency and biochemical composition of a tropical freshwater catfish, Mystus nemurus<br />
(Cuvier & Valenciennes). Aquaculture and Fisheries Management 25: pp. 753-760.<br />
Likongwe, J.S., T.D. Stecko, J.R Stauffer, Jr., and R.F. Carline. 1996. Combined effects<br />
of water temperatures and salinity on growth and feed utilization of juvenile Nile tilapia<br />
Oreochromis niloticus (Linneaus). Aquaculture, 146: pp. 37 – 46.<br />
Losordo, T.M. and P.W. Westerman. 1994. An Analysis of Biological, Economic and<br />
Engineering Factors Affecting <strong>the</strong> Cost of Fish Production in Recirculating Aquaculture<br />
Systems. The Journal of <strong>the</strong> World Aquaculture Society 25:2, pp. 193-203.<br />
Olivier, A. and H Kaiser, 1997. A comparison of growth, survival rate, and number of<br />
marketable fish produced of swordtails, Xiphophorus helleri Heckel (Family Poeciliidae),<br />
between two types of culture systems. Aquaculture Research 28: pp. 215 – 221.<br />
Oshima, Y. and D. Ihava. 1969. “Fish Culture,” Vol. 4 “Yellowtail-Amber Jack.” Midori-<br />
Shobo, Tokyo.<br />
O’Rourke, P.D. The Economics of Recirculating Aquaculture Systems. In: G.S. Libey<br />
and M.B. Timmons (eds.) Successes and Failures in Commercial Recirculating<br />
Aquaculture. Aquacultural Engineering Society Proceedings II. Viginia Polytechnic<br />
Institute and State University, Roanoke, Virginia. 1996.<br />
. 1982.<br />
Philippart, J-CL. and J-Cl. Ruwet. Ecology and distribution of tilapias. In: R.S.V. Pullin<br />
and R.H. Lowe-McConnell (eds.) The Biology and Culture of Tilapias, Proceedings of<br />
<strong>the</strong> International Conference on <strong>the</strong> Biology and Culture of Tilapias, 1980. International<br />
Center for Living Aquatic Resources Management, Manila. Philippines. 1982.<br />
Siddiqui A.Q. , Howlader M.S. and Adam A.B. 1989. Culture of Nile tilapia,<br />
Oreochromis niloticus (L.), at three stocking densities in outdoor concrete tanks using<br />
drainage water. Aquaculture and Fisheries Management 20, pp. 49-58.<br />
Thompson, D.H. 1941. The fish production of inland streams and lakes. Symp.<br />
Hydrobiol., University of Wisconsin, Madison. pp. 206-217.<br />
Yi, Y., Lin, C.K. and Diana J.S. 1996. Influence of Nile tilapia (Oreochromis niloticus)<br />
stocking density in cages on <strong>the</strong>ir growth and yield in cages and in ponds containing <strong>the</strong><br />
cages. Aquaculture 146: pp.205-215.<br />
18
Predictive Computer Modeling of Growth and Feeding Rates<br />
for Pacific White Shrimp, Penaeus vanammei, in Hard<br />
Freshwater<br />
Abstract<br />
Anthony F. Pegel, Master of Science Candidate<br />
Dr. J. Richard Booth, Associate Professor<br />
Department of Chemical Engineering<br />
Tennessee Technological University<br />
If <strong>the</strong> United States is to find its niche in shrimp aquaculture production, non-traditional<br />
methods of shrimp farming must be used to overcome <strong>the</strong> climatic incompatibility and strict<br />
environmental regulations. Non-traditional shrimp production must also find ways to<br />
significantly reduce capital and operational costs. Recirculating aquaculture systems (RAS),<br />
which support high population densities and precise control of <strong>the</strong> suitable growth environment<br />
through water reuse, offer a method appropriate to addressing <strong>the</strong>se obstacles.<br />
The goal of this investigation was to determine whe<strong>the</strong>r a model based on a material balance of<br />
essential and required nutritional components could be used to evaluate <strong>the</strong> quality of<br />
experimental rations. The model used a material balance to predict <strong>the</strong> lipid and amino acid<br />
components required in <strong>the</strong> feed based on <strong>the</strong> analysis of <strong>the</strong>se components in <strong>the</strong> shrimp tail<br />
muscle.<br />
The preliminary data demonstrated feed rates based solely on protein content yield<br />
unpredictable growth. Rations ranging from 30% - 45% protein yielded growth rates varying<br />
as much as 20% irrespective of feed rate or protein level. This suggests that feed rates based<br />
on specific nutritional requirements may be more practical. The data also demonstrated an<br />
increase in mortality as feed decreased. The groups receiving <strong>the</strong> least feed exhibited<br />
significantly higher rates of predation. The data also yielded a directly proportional relationship<br />
between growth and temperature, with no optimum temperature found, but an inversely<br />
proportional relationship between specific growth and size. These preliminary results<br />
demonstrate <strong>the</strong> need for fur<strong>the</strong>r study in this area.<br />
Introduction<br />
Worldwide shrimp aquaculture production is currently dominated by pond cultures in tropical<br />
regions. Open pond systems, using Macrobrachium Rosenbergii, are spreading to freshwater<br />
ponds throughout <strong>the</strong> U.S. but <strong>the</strong>se systems are seasonally restricted and cannot compete with<br />
producers capable of year-round production. Research and demonstration based recirculating<br />
facilities have produced consistent harvests of shrimp in Florida and Hawaii, but <strong>the</strong>se facilities<br />
are too small to compete with established production facilities.<br />
1
If U.S. production is to approach its consumption level, non-traditional methods such as RAS<br />
must be utilized. Two of <strong>the</strong> main obstacles to growth of RAS in <strong>the</strong> U.S. are: (i) its relatively<br />
high capital and operating costs as compared to traditional open pond systems and; (ii) <strong>the</strong><br />
need for tight water quality control to allow for high population densities and meet stringent<br />
effluent standards. Shrimp ration is a major factor in both of <strong>the</strong>se areas. Feed costs represent<br />
<strong>the</strong> single highest operating cost for a RAS, often as high as 60% of <strong>the</strong> total operating cost.<br />
Excessive feeding is also a major contributor to poor water quality increasing ammonia levels<br />
and biological oxygen demand on <strong>the</strong> system.<br />
This research was proposed to investigate <strong>the</strong> usefulness of a material balance based model in<br />
predicting optimal feeding rates (1). The model's use was contingent on knowing three factors:<br />
(i) <strong>the</strong> maximum specific growth rate of <strong>the</strong> species, P. vannamei, as a function of temperature;<br />
(ii) which of <strong>the</strong> amino acids and lipids are essential as determined by autoradiography using<br />
C 14 labeled glucose and; (iii) <strong>the</strong> concentrations of essential and/or amino acids and lipids in <strong>the</strong><br />
species and ration as determined by chemical analysis.<br />
Materials And Methods<br />
The Tennessee Technological University’s RAS is a micro-scale system which contains<br />
approximately 1000 gallons of fresh water enriched with sea salts to 1000 ppm TDS. The<br />
grow-out area consists of four 300-gallon agricultural watering tanks filled to 125 gallons. The<br />
effluent from each grow-out tank overflows through a central standpipe and drains into <strong>the</strong><br />
biofilter system. The biofilter consists of a 300-gallon basin with a 1 ft 2 x 3 ft tall trickling filter<br />
and to a 6 ft 3 air-sparged, submerged biofilter both filled 1-inch bioballs. The effluent from <strong>the</strong><br />
submerged biofilter overflows into a 300-gallon clearwell. The water is <strong>the</strong>n pumped through a<br />
down-flow sand filter and a UV sterilizer with <strong>the</strong> majority of <strong>the</strong> water returning to <strong>the</strong><br />
clearwell. Approximately 0.8 gpm of <strong>the</strong> water flows to <strong>the</strong> four grow-out tanks (0.2 gpm per<br />
tank), providing an average residence time of 10 hours.<br />
Each grow-out tank is equipped with a circulation pump which circulates water through a UV<br />
sterilizer to a series of orifices which provide 0.5 gpm of circulation to each of eight<br />
experimental study tanks. The study tanks are kept at an approximate volume of 8 gallons by<br />
means of an overflow line yielding a 15 minute residence time.<br />
For this study, 12-day post-larval P. vannamei arrived every 50 days in seawater with an<br />
enriched oxygen atmosphere at 13 o C. Over <strong>the</strong> first 72 hours after arrival, <strong>the</strong> concentration of<br />
<strong>the</strong> post-larvae media was reduced to 1000 ppm TDS. At 62 days post-larvae, shrimp were<br />
selected according to length for <strong>the</strong> grow-out experiments to evaluate <strong>the</strong> growth rate and<br />
survival for test rations. Sets of 20 juvenile shrimp having <strong>the</strong> same length (±2 mm) were<br />
selected, weighed and placed into study tanks. The initial weight was used to model <strong>the</strong> first<br />
week's feeding schedule. The specimens in each experimental tank were fed one of three<br />
rations twice daily at rates of ranging from 120% to 80% of <strong>the</strong> optimum rates. For <strong>the</strong><br />
preliminary study, optimum feed rates were predicted by <strong>the</strong> model using available growth and<br />
composition data for <strong>the</strong> species and rations on a percent protein basis (1,2). For <strong>the</strong> 4 – 6<br />
week study period, <strong>the</strong> total weight of each study group was determined every week. The<br />
animals were <strong>the</strong>n returned to <strong>the</strong> grow-out tank. New study groups were <strong>the</strong>n established and<br />
2
new studies begun. Daily water quality measurements were performed and recorded for total<br />
ammonia, nitrite, nitrate, temperature, pH, conductivity and dissolved oxygen.<br />
Samples of <strong>the</strong> tail muscle of shrimp of various ages were freeze-dried, homogenized and<br />
solubilized in mineral acid. The lipids and amino acids were extracted and analyzed by FID<br />
gas-liquid chromatography in columns specific to <strong>the</strong> particular compound. Determination of<br />
essential amino acids was performed by injection of a radio-labeled glucose and determination<br />
of which became incorporated into <strong>the</strong> shrimp’s tissue. (2)<br />
Results And Conclusions<br />
Multiple Linear Regression of Specific Growth as a Function of Temperature and Weight<br />
For <strong>the</strong> data collected <strong>the</strong> weekly average temperatures ranged from 24.2 o C to 28.4 o C.<br />
Preliminary inspection of <strong>the</strong> data indicated that a modest decrease in temperature could<br />
significantly decrease <strong>the</strong> specific growth rate. The specific growth rate was also found to<br />
decrease as <strong>the</strong> weight increased. Figure 1 presents <strong>the</strong> specific growth rate as a function<br />
of temperature and weight based on <strong>the</strong> preliminary data collected.<br />
Specific Growth (days -1 )<br />
0.07<br />
0.06<br />
0.05<br />
0.04<br />
0.03<br />
0.02<br />
0.01<br />
0<br />
23 24 25 26 27 28 29<br />
Temperature ( o C)<br />
Figure 1: Specific Growth Rate as a Function of Temperature (24-28 o C) and Weight (0.5-4.0 g)<br />
The data demonstrate no optimum temperature. Preliminary results suggest that <strong>the</strong><br />
effects of weight and temperature may be independent and additive. Increased repetition<br />
of <strong>the</strong> study procedures should improve <strong>the</strong> precision of <strong>the</strong>se results.<br />
Regression of Fractional Model Predicted Feed Rates and Survival. Underfeeding can not<br />
only reduce production by slowing growth but can also reduce total harvest through<br />
predation of animals due to hunger. Preliminary inspection of <strong>the</strong> data demonstrated a<br />
reduction in survival at <strong>the</strong> lower feed rates. The survival rates of <strong>the</strong> animals fed at rates<br />
approaching or exceeding <strong>the</strong> optimum feed rates were in <strong>the</strong> range of 75%-80%. The<br />
animals fed at <strong>the</strong> lowest rate displayed a survival rate of 67%. Figure 2 presents <strong>the</strong><br />
survival rates as a function of feed rates.<br />
3<br />
0.5-1g<br />
1 - 3g<br />
3 - 4g
Percent Survival (%)<br />
100<br />
80<br />
60<br />
40<br />
20<br />
0<br />
Figure 2: Survival as a Function of Feed Rate<br />
The data suggest that when <strong>the</strong> availability of essential components is reduced below a<br />
critical level, survival is adversely affected. Once <strong>the</strong> levels of <strong>the</strong> essential components in<br />
<strong>the</strong> shrimp and in <strong>the</strong> rations are determined, this critical level should be determinable.<br />
Effectiveness of <strong>the</strong> Model in Feed and Growth Predictions. When <strong>the</strong> preliminary data<br />
was normalized using <strong>the</strong> size and temperature relationship in Figure 1, examination<br />
showed no statistical difference in growth due to feeding rates. However, <strong>the</strong> data did<br />
show that Ration #2 produced growth rates approximately 20% slower than o<strong>the</strong>r rations<br />
at all feed rates.<br />
The findings show that similar rations fed at comparable rates can yield significantly<br />
different growths. This demonstrates <strong>the</strong> importance of knowing <strong>the</strong> essential and<br />
required components of <strong>the</strong> animals and its ration. Continued feed studies using species<br />
and ration specific data should verify this importance and aid in promoting RAS in <strong>the</strong> U.S.<br />
References<br />
80<br />
75<br />
75<br />
1. Booth, J.R., “Feeding Rates and Conversions in Brown Shrimp, Penaeus aztecus”,<br />
Aquaculture Engineering Technologies for <strong>the</strong> Future, IChemE <strong>Symposium</strong> Series,<br />
No. 111, EFCE Publication No. 66, pp. 169-183.<br />
2. Shewbert, K.L., W.L. Mies and P.D. Ludwig, “A Study on <strong>the</strong> Effects of Feeding<br />
Syn<strong>the</strong>tic Diets to Brown Shrimp, Penaeus aztecus”, Biology (Berlin), Vol. 16, No. 1,<br />
pp. 64-67.<br />
4<br />
76<br />
67<br />
120 110 100 90 80<br />
Feed Rate (% of Optimum)<br />
Overall<br />
Ratio n #1<br />
Ratio n #2<br />
Ratio n #3
Development Rationale for <strong>the</strong> Use of Marine Recirculating<br />
BioFilters to Simplify Management Strategies and Reduce<br />
Costs Associated with Marine Aquaculture Systems<br />
Ronald F. Malone Douglas G. Drennan<br />
USA Chevron Professor Managing Member<br />
Civil and Environmental Aquaculture Systems<br />
Engineering Technologies<br />
Louisiana State University<br />
Christopher J. Stahl Lance E. Beecher<br />
Research Director Research Associate<br />
Aquaculture Systems Civil and Environmental<br />
Technologies Engineering<br />
Louisiana State University<br />
It is now generally recognized that <strong>the</strong> growing global demand for marine products has<br />
exceeded <strong>the</strong> sustainable limits of natural marine systems. The shortfall in fisheries<br />
production is now driving <strong>the</strong> development of marine aquaculture technologies on many<br />
fronts. Recirculating systems are regarded as critical components of many developmental<br />
schemes, whe<strong>the</strong>r as supporting systems for offshore cage culture, as broodstock and<br />
nursery facilities serving pond production sites, or as autonomous growout facilities. The<br />
recirculating format may avoid many of <strong>the</strong> land use and environmental conflicts that have<br />
been associated with pond aquaculture, especially those involving <strong>the</strong> development of<br />
marine aquaculture facilities in proximity with coastal wetlands and lowlands.<br />
Recirculating schemes are also well suited for maintenance of valuable broodstock, offseason<br />
spawning, and <strong>the</strong> production of healthy disease-free fingerlings.<br />
This paper presents <strong>the</strong> development rationale for a new class of floating bead bioclarifiers<br />
that have been under development for several years. These filters were developed in<br />
anticipation of an expanding interest in marine aquaculture.<br />
Motivations<br />
Malone and Beecher (2000) summarize design and performance characteristics for floating<br />
bead filters, which have been widely utilized over <strong>the</strong> last decade in educational, research,<br />
and commercial facilities. The criteria presented in this paper are based on <strong>the</strong><br />
performance of propeller-washed (Malone, 1992) and bubble-washed (Malone, 1993)<br />
bead filters. The paper describes <strong>the</strong> use of floating bead filters applied to recirculating<br />
systems as bioclarifiers that simultaneously provide both clarification and biofiltration<br />
support. These floating bead filters were developed and refined with continuous feedback<br />
from <strong>the</strong> commercial sector. This feedback provided an invaluable foundation for<br />
1
improvements in <strong>the</strong> floating bead filters, and, slowly identified <strong>the</strong> limitations associated<br />
with <strong>the</strong> current hull designs, washing strategies, and media.<br />
Approximately five years ago, research team members initiated an effort to develop a new<br />
class of filters that would be well suited to deal with some of <strong>the</strong> challenges that face <strong>the</strong><br />
recirculating industry in upcoming years (Table 1).<br />
Table 1: Motivations stimulating <strong>the</strong> development of <strong>the</strong> Marine Recircuating Bead<br />
Filter<br />
Objective Means Result Comment<br />
Improve Modified 50 percent DelosReyes et al. 1997<br />
Nitrification Media improvement in<br />
Capacities High<br />
Volumetric<br />
Frequency<br />
Backwashing<br />
Nitrification rates<br />
Reduce Modified Airlfit operation at DelosReyes et al., 1997<br />
Headloss Media high loadings Loyless and Malone, 1998<br />
High<br />
Frequency<br />
Backwashing<br />
demonstrated<br />
Eliminate Internal Sludge No backwashing Possible benefits and/or issues<br />
backwashing Separation loss; losses associated with anoxic sludge<br />
Waterloss<br />
associated with<br />
sludge removal<br />
negligible<br />
storage<br />
Eliminate Plastic or Metal parts<br />
corrosion Fiberglass parts completely<br />
eliminated<br />
Reduce Pneumatic Automated Backwash frequency control by<br />
backwashing backwashing Backwashing; air flow rates; sludge removal<br />
Labor<br />
manual sludge can be automated with minimal<br />
removal<br />
electronics<br />
Minimize Pneumatic No electronics<br />
electronics Triggers timers required<br />
Of foremost concern was <strong>the</strong> economic feasibility of recirculation technologies. Although<br />
bioclarification capabilities of bead filters can be used to simplify filtration configurations,<br />
capital and operating costs remain an obstacle to widespread adoption of recirculation as a<br />
production strategy. To attack this issue <strong>the</strong> research team first sought to develop filter<br />
designs that would display elevated nitrification capacities. The nitrification capacity<br />
controls that size of <strong>the</strong> filter used in any bioclarifier application, so, improvements in<br />
nitrification capacity would reduce <strong>the</strong> filter size, thus reducing capital costs.<br />
2
Fur<strong>the</strong>r, reduction in operating costs could be realized in some applications by utilization<br />
of airlift circulation to move water instead of water pumps. Airlift pumps rapidly loose<br />
efficiency as lift requirements increase and early bead filters were (and still are) often<br />
referred to a “pressurized” bead filters. Propeller-washed filters display <strong>the</strong>ir best<br />
nitrification capacity with a backwash frequency of once every two days (Malone et al.<br />
1993). They were frequently plumbed with additional pressurized devices downstream.<br />
Thus, influent pressures in <strong>the</strong> range of 10 psi were not uncommon in practice. Airlift<br />
pumps work best with influent pressures less than 10 psi, <strong>the</strong>refore headloss has to be<br />
minimized. Conversion of bead filters to airlift operation would require substantial<br />
reconsideration of bead filter design strategies.<br />
Saltwater recirculating systems are also different from freshwater systems by <strong>the</strong> corrosive<br />
nature of that culture medium. Consequently, although propeller-washed floating bead<br />
filters (Malone 1992) are capable of achieving only about two percent water loss with<br />
good management, <strong>the</strong>y are unfortunately, equipped with 316 stainless steel screens and<br />
mixing apparatus which do corrode. Virtually all individuals involved with marine<br />
aquaculture can testify to this issue. The technologies and methodologies, which are<br />
currently available to address <strong>the</strong>se problems, add capital and operational costs to a<br />
fledgling industry that is already under serious economic pressures.<br />
Obtaining (mixing, hauling, pumping) and maintaining a saltwater environment at a noncoastal<br />
location is expensive. Most freshwater recirculating systems replace 3 to 10<br />
percent of <strong>the</strong>ir make-up water per day (or more). A generally acceptable practice given<br />
<strong>the</strong> low cost of obtaining high quality, pathogen free freshwater commonly available in<br />
moderate quantities. However, it is expensive to operate a marine system in this range<br />
unless <strong>the</strong> facility is located in a prime coastal location. O<strong>the</strong>rwise, <strong>the</strong> practical problems<br />
of biofouling, variable salinity, high sediment loads, and disease introduction lead to<br />
significant costs for pre-treating replenishment water (Huguenin and Colt, 1989). It is not<br />
uncommon for fisheries biologists to specify pretreatment of influent waters, including<br />
solids removal to 1 micron and disinfection as standard practices for influent treatment<br />
systems. In fact, <strong>the</strong>se concerns have led many to adopt artificial sea salts exclusively for<br />
<strong>the</strong>ir systems. Clearly, <strong>the</strong>re is a need to minimize waterloss due to backwashing<br />
operations.<br />
It was also clear that <strong>the</strong>re are economic advantages to automating filter backwashing.<br />
Backwashing costs can be virtually eliminated while consistency is improved. This has<br />
been addressed in recent years by <strong>the</strong> development of customized solid state controllers<br />
that have an excellent record of performance providing for automatic backwashing and<br />
sludge removal. However, <strong>the</strong> boxes and associated automated control valves represent a<br />
significant cost factor for smaller bead filters. Additionally, application of electronics to<br />
marine systems is complicated by corrosion. It is clear that sophisticated electronics will<br />
play an important part in future marine aquaculture facilities, but <strong>the</strong>ir use should be<br />
clearly justified. A means of automatically backwashing with a minimum amount of<br />
electronic support was viewed as highly desirable.<br />
3
MRBF Layout<br />
The Marine Recirculating BioFilter (MRBF) is conceptually illustrated in Figure 1, and a<br />
summary of compartments can be found in Table 2. There are five distinct zones, which<br />
are identified by letter. The filtration bed (A) lies at <strong>the</strong> top of <strong>the</strong> filter. It is underlain<br />
typically by a diffuser screen (7) that evenly introduces <strong>the</strong> recirculating water into <strong>the</strong><br />
filter hull. The expansion zone (B) lies beneath <strong>the</strong> bead bed. This zone receives <strong>the</strong><br />
beads that have been displaced by air released from <strong>the</strong> pneumatic charge chamber (C).<br />
Backwash waters move from <strong>the</strong> expansion zone to <strong>the</strong> charge chamber via <strong>the</strong> chute (E).<br />
The charge chamber consists of an inverted airtight compartment that overlies <strong>the</strong> sludge<br />
storage compartment (D).<br />
Table 2. Description of MRBF compartments and function.<br />
No. Compartment Function<br />
1 Filtration bed Provides for clarification and biofiltration of circulated<br />
waters.<br />
2 Expansion Zone Provides space for beads dropping down during<br />
backwashing.<br />
3 Chute Provides conduit for backwash waters to “discharged”<br />
charge chamber.<br />
Forms sediment trap preventing fine solids from reentering<br />
filtration path during charge cycle.<br />
4 Charge Chamber Develops pneumatic charge for backwashing.<br />
Displaces clarified backwash waters returning <strong>the</strong>m to<br />
<strong>the</strong> filtration path.<br />
Airflow determines backwash frequency.<br />
5 Sludge Compartment Consolidates accumulated sludge.<br />
Some sludge digestion occurs.<br />
Some denitrification occurs.<br />
The active components of <strong>the</strong> filter include <strong>the</strong> influent line (1) which typically injects <strong>the</strong><br />
water under <strong>the</strong> bead through a screening/ diffuser configuration (6 & 7) that is designed<br />
to minimize turbulence under <strong>the</strong> bed (A) and within <strong>the</strong> chute (E). Water exits <strong>the</strong> filter<br />
through a screen outlet (2) at <strong>the</strong> top of <strong>the</strong> static bead bed. Sludge is removed by an<br />
outlet (3) at <strong>the</strong> bottom of <strong>the</strong> sludge storage area. Air is slowly introduced into <strong>the</strong><br />
charge chamber through a regulated input line (4) and transferred from <strong>the</strong> pneumatic<br />
charge chamber to zones A and B intermittently by a trigger device (5).<br />
MRBF Operation<br />
4
The operation of <strong>the</strong> MRBF is dominated by <strong>the</strong> filtration mode (Figure 1).<br />
Water Flow<br />
(1)<br />
Water Flow<br />
(7)<br />
(6)<br />
E<br />
Figure 1: The basic MBRF filter has five distinct compartments<br />
A<br />
B<br />
D<br />
(2)<br />
During this mode of operation <strong>the</strong> inflow of water (1) and airflow (4) is held constant.<br />
Water flowing in through <strong>the</strong> influent line (1) moves up through <strong>the</strong> filtration bed where<br />
fine solids are captured and dissolved wastes are absorbed by <strong>the</strong> biofilm coated bead<br />
surface. The rate of water inflow is high, typically ranging from 600-900 lpm/m 3 -beads.<br />
These high flow rates are maintained to assure adequate oxygen and ammonia transport to<br />
<strong>the</strong> bed. The air inflow rate into <strong>the</strong> charge chamber is low, in <strong>the</strong> range of 3-6 lpm/m 3 -<br />
beads. The trigger (5) is tuned to engage when enough air has accumulated in <strong>the</strong> charge<br />
chamber to assure a good wash of <strong>the</strong> bead bed. Optimum filter performance under heavy<br />
loading can be expected to occur with a backwash frequency in <strong>the</strong> range of 1-6 hrs.<br />
Thus, <strong>the</strong> airflow rate is simply set to assure that <strong>the</strong> critical charge chamber volume will<br />
be reached at <strong>the</strong> desired time interval. Air flows into <strong>the</strong> charge chamber, dirty backwash<br />
water is slowly displaced back up <strong>the</strong> chute and into <strong>the</strong> filtration pathway. So <strong>the</strong> air<br />
flow rate divided by <strong>the</strong> cross sectional area of <strong>the</strong> chute (E) defines <strong>the</strong> vertical velocity<br />
of <strong>the</strong> escaping water column and, inversely by Stokes law, <strong>the</strong> size of particle that can<br />
escape. Thus, <strong>the</strong> chute’s cross sectional area determines <strong>the</strong> maximum rate that air can<br />
be bled into <strong>the</strong> chamber. Captured solids fall into <strong>the</strong> sludge chamber while <strong>the</strong> clarified<br />
backwash water exits <strong>the</strong> chute and are re-filtered by <strong>the</strong> filtration bed.<br />
The alternate mode of operation is <strong>the</strong> backwash mode (Figure 2). Backwashing occurs<br />
very rapidly, typically within 5-10 seconds. The inflow of water and air are not<br />
5<br />
(5)<br />
C<br />
Water<br />
Sludge<br />
Patent # 5,770,080<br />
Air<br />
Water<br />
(4) Air Flow<br />
(3)
interrupted during backwashing. Backwash water, which accumulates in <strong>the</strong> charge<br />
chamber, is completely displaced by new air entering <strong>the</strong> pneumatic charge chamber. The<br />
trigger rapidly releases <strong>the</strong> air in <strong>the</strong> pneumatic charge chamber and <strong>the</strong> dirty wash waters<br />
drop through <strong>the</strong> chute. The trigger is <strong>the</strong>n closed and ano<strong>the</strong>r filtration cycle initiated.<br />
Sludge is generally allowed to accumulate before it is removed through <strong>the</strong> sludge line (3).<br />
Consolidation of sludge is generally rapid, and sludge thickening and compaction usually<br />
control <strong>the</strong> maximum length of time between removal. In fish systems, problems can<br />
occur with sludge flow after a week or two.<br />
Figure 2. Backwashing mode of <strong>the</strong> MRBF.<br />
Significance<br />
(1)<br />
Water Flow<br />
(6)<br />
E<br />
(7)<br />
Air<br />
The MRBF’s pneumatic backwashing feature breaks <strong>the</strong> linkage between backwashing and<br />
waterloss. This linkage has limited optimization of backwash frequencies for a number of<br />
years. This new freedom is likely to be a significant advancement on bead filter bioclarifier<br />
application in both <strong>the</strong> freshwater and saltwater aquaculture areas.<br />
Wimberly (1990) and Sastry et al. (1999) demonstrated <strong>the</strong> advantages of high frequency<br />
backwashing in gently washed formats. In both of <strong>the</strong>se studies “gently-washed” formats<br />
6<br />
(2)<br />
Patent # 5,770,080<br />
(5)<br />
C<br />
Water<br />
(4)<br />
(3)<br />
Air Flow
equired a high frequency of washing (five to eight times daily) to maximize carrying<br />
capacities expressed in Kg-feed applied daily per cubic meter of beads (or kg/m 3 -day).<br />
Golz et al. (1999) attributed this to a reduction in heterotrophic competition within <strong>the</strong><br />
filter’s biofilm (Zhang et al., 1995). Solids accumulation between <strong>the</strong> beads represents <strong>the</strong><br />
principal food source for <strong>the</strong> heterotrophic bacteria, and rapid removal of <strong>the</strong>se solids<br />
dramatically reduces <strong>the</strong>ir population. The fraction of bacterial activity (measured by<br />
oxygen consumption) attributed to nitrifying bacteria dramatically increases once<br />
heterotrophic growth has been inhibited and substantial improvements in nitrification<br />
capacity result.<br />
One of <strong>the</strong> principle criticisms against <strong>the</strong> use of bead filters in <strong>the</strong> bioclarifier mode has<br />
been <strong>the</strong> recognized conflict (Malone et al. 1993) between solids accumulation and<br />
nitrification. Of course, bioclarifiers are designed to capture solids. Use of <strong>the</strong> high<br />
frequency strategy eliminates <strong>the</strong> issue of interstitial solids accumulation. Recent work in<br />
<strong>the</strong> LSU laboratory (DelosReyes et al. 1997) pushed high frequency washing to <strong>the</strong><br />
extreme in a demonstration of airlift recirculation, and backwashing <strong>the</strong> bubble-washed<br />
filter as often as once per hour. The combination of high frequency washing and modified<br />
plastic media produced <strong>the</strong> highest sustained volumetric conversion rates (about 700 g/m 3 -<br />
day) that have been observed in recent floating bead bioclarifier applications.<br />
The potential advantages of high frequency washing have been recognized for sometime<br />
(Wimberly, 1990). Full commercial implementation was at first limited by labor<br />
requirements. This obstacle has been recently been resolved (at least for larger units) by<br />
<strong>the</strong> development of control boxes. And yet, commercial implementation was still<br />
prevented in many applications by <strong>the</strong> waterloss issue. Even freshwater studies such as<br />
Sastry et al. (1999) and DelosReyes et al. (1997), had to utilize external settling tanks to<br />
recapture backwash waters to stay within <strong>the</strong> definition of a “closed” recirculation system<br />
(
The two initial filter configurations were constructed in-house and tested. Data from this<br />
work has shown that <strong>the</strong> nitrification rate can be significantly increase by a high rate of<br />
backwashing, up to 18 times per day in some cases. These have been replaced by a<br />
commercially manufactured prototype. These early studies have provided proof of<br />
concept data. But, <strong>the</strong> specific configurations tested were not able to achieve high<br />
performance levels desired because of design problems. The findings from <strong>the</strong>se, however,<br />
have dictated a number of essential structural modifications in <strong>the</strong> current configuration<br />
that is currently being stress tested. Three additional low profile MBRF units have been<br />
placed in o<strong>the</strong>r commercial/research saltwater facilities for evaluations under <strong>the</strong> same<br />
DOC-SBIR grant. These are located in New Hampshire, Alabama and Texas.<br />
A second research effort is employing two distinctly different filters in <strong>the</strong> MRBF format<br />
in support of warm, freshwater growout (Drennan 1997b). This study is supported <strong>the</strong><br />
USDA Small Business Innovative Research Program. Focus here was placed on<br />
maximizing nitrification rates using reformed-floating beads. After two years of study, <strong>the</strong><br />
system was re-configured with two screenless concentric filters (MRBF’s) with modified<br />
and tubular media. These filters are being evaluated against a propeller-washed filter with<br />
modified media in an attempt to set a new carrying capacity recommendation.<br />
Three low profile MBRF format filters are being utilized in <strong>the</strong> research facilities at<br />
Louisiana State University. Two of <strong>the</strong>se have been under use for over a year supporting<br />
a red drum breeding program under Louisiana <strong>Sea</strong> Grant College Program Funding. A<br />
third is being used to support a marine greenhouse pond configuration currently being<br />
evaluated for <strong>the</strong>rmal behavior at <strong>the</strong> LSU Ben Hur Aquaculture Farm. The Louisiana<br />
Board of Regents is currently funding this research. These units have all been installed in<br />
airlift formats. Data is currently being collected to document filter nitrification behavior in<br />
response to varying temperature regimes presented by <strong>the</strong> refrigerated indoor conditioning<br />
units and <strong>the</strong> manipulated environment of <strong>the</strong> greenhouse pond.<br />
Finally, several filters of <strong>the</strong> MBRF screenless concentric design have been subjected to<br />
testing over <strong>the</strong> last three years. Most of <strong>the</strong>se tests utilized units with volumes of about<br />
0.1 m 3 although <strong>the</strong> largest unit has a bead bed of 0.7 m 3 . The smaller units have been<br />
used to support a range of activities from high-density tilapia growout to filtration of<br />
ornamental koi ponds. Early designs suffered from inadequate air pump selection, and<br />
were primarily installed to verify long term pneumatic trigger stability. This area of<br />
concern has since been addressed and <strong>the</strong> team now has what we believe is a very robust<br />
filter design. The large unit has been placed in three large-scale facilities providing <strong>the</strong><br />
research team with direct commercial feedback.<br />
MBRF Findings<br />
Filters in <strong>the</strong> MBRF format have been under laboratory and field testing for <strong>the</strong> last three<br />
years. The introduction of this new technology has been associated with a rapid learning<br />
curve for all those involved.<br />
8
Several dramatically different hull configurations have been tested. A number of <strong>the</strong>se<br />
have displayed weaknesses that preclude <strong>the</strong>ir commercial introduction. The screenless<br />
concentric MRBF units are currently considered very favorably and this configuration will<br />
likely be dominant in early commercial production with no fewer than four models being<br />
positioned for commercial introduction during <strong>the</strong> 2000 year. A large-scale, low profile<br />
airlift design is currently undergoing final evaluation in a number of locations as well.<br />
These early testing programs have raised a number of issues.<br />
First, many trigger designs that have been evaluated, and several have shown to be<br />
extremely reliable. Clogging and/or biofouling of pneumatic trigger components are <strong>the</strong><br />
primary issues of concern. It was anticipated that many filters, particularly airlift<br />
configurations, would be buried, thus, reliable performance over a period of years will be<br />
demanded of trigger configurations. Although common sense will dictate that triggers in<br />
early commercial designs be accessible, trigger failure is not expected. The triggers are<br />
now delivering consistent backwashes every few hours, for months with only intermittent<br />
adjustments on <strong>the</strong> air delivery valve.<br />
Virtually all backwashing failures have been associated with pressurized filter<br />
configurations operated with relatively low backwash intervals (1-2 per day). These<br />
failures are caused by inadequate air pump selection. Air pumps (2-6 psi) and blowers (1-<br />
2 psi) commonly used in aquaculture applications have shutoff pressures below <strong>the</strong> most<br />
commonly used water pumps (10-30 psi). Air must be delivered to <strong>the</strong> pneumatic<br />
chamber at <strong>the</strong> same pressure as <strong>the</strong> water. With a clean open bed, pressures below <strong>the</strong><br />
filtration bed are low. A number of inexpensive aquarium pumps can deliver an adequate<br />
supply of air. However, when backwash frequencies are low, or system loading is heavy,<br />
transition pressure build-ups have a tendency to occur. If <strong>the</strong>se pressures exceed <strong>the</strong><br />
shutoff pressure of <strong>the</strong> air delivery system, failure is assured since <strong>the</strong> beds resistance to<br />
water flow only increases without washing. Careful attention to air pump selection<br />
eliminates this problem. This problem cannot occur if <strong>the</strong> shutoff pressure for <strong>the</strong> air<br />
pump is higher than that of <strong>the</strong> water pump.<br />
The research team has also observed that setting precise backwash intervals with <strong>the</strong><br />
pneumatic charge chamber is difficult. The varying hull pressures not only impact <strong>the</strong> rate<br />
of delivery, but also, compresses air already in <strong>the</strong> charge chamber. Since each filter<br />
pressurizes at a slightly different rate, it is difficult to precisely set backflush frequencies<br />
without some trial and error adjustment. Use of air delivery and pressure gauges can<br />
practically eliminate this problem for commercial applications since <strong>the</strong> filter’s nitrification<br />
response appears to be insensitive to small variations in backwash frequencies. The<br />
triggering mechanisms may have to be modified to facilitate experimental applications that<br />
demand reproducibility.<br />
Concerns have been raised in some sectors about <strong>the</strong> internal storage of sludge in <strong>the</strong><br />
MRBF sludge chamber. This remains a controversial issue and one that is worthy of<br />
fur<strong>the</strong>r consideration. The default position is to let <strong>the</strong> sludge accumulate in <strong>the</strong> internal<br />
storage chamber until it is convenient for removal. Convenience quickly translates into<br />
9
high sludge residence times (days to weeks). Accumulated sludge rapidly compresses and<br />
decays. It does not interfere with <strong>the</strong> backwashing of <strong>the</strong> filter. Researchers have<br />
observed volatile suspended solids reductions of 30 percent during <strong>the</strong> first 24 hours under<br />
warmwater conditions (Chen et al., 1997). Extended holding of sludge <strong>the</strong>n is not only<br />
more convenient, but also reduces waterloss as a very thick stabilized sludge can be<br />
produced. However, this sludge decay is progressing largely in an anoxic environment.<br />
Valid concerns can <strong>the</strong>n be raised about <strong>the</strong> possibility of deposited sludge producing toxic<br />
anaerobic bi-products. Of particular concern are sulfide compounds. Sulfide compounds<br />
are known to be toxic at some level to a variety of aquatic organisms. There is no doubt<br />
that thick accumulations of <strong>the</strong> organically rich aquaculture solids will rapidly induce low<br />
redox potentials allowing sulfide production. Clearly, if <strong>the</strong>re are concerns about sulfide<br />
sensitivity, sludge removable frequencies should be increased. This can be accomplished<br />
automatically in an airlift or pumped system for a few hundred dollars using simple<br />
controllers and an automated ball valve.<br />
However, <strong>the</strong>re are advocates of extending sludge retention times in recirculating systems.<br />
They argue that some form of anaerobic decay is essential to realistically close <strong>the</strong><br />
recirculating system (Arbiv and van Rjin, 1995, Whitson et al., 1993). The degree of<br />
control required to safely accomplish <strong>the</strong> benefits however, is more heavily debated (Lee,<br />
1993; 1994). Certainly, even at this early date it is becoming apparent that <strong>the</strong> sludge<br />
storage chamber in <strong>the</strong> MRBF format rapidly becomes an anaerobic reactor. Using current<br />
bioclarifier design recommendations for warmwater growout conditions (Malone and<br />
Beecher 2000) and a modest backwash frequency of 6 times per day, <strong>the</strong> entire system’s<br />
water volume is cycled through <strong>the</strong> sludge chamber every 4 days before returning to <strong>the</strong><br />
system. It is not surprising <strong>the</strong>refore, that no nitrate accumulations have been observed in<br />
both marine broodstock and fingerling growout systems that were included in <strong>the</strong> early<br />
testing programs. The cyclically charged sludge storage chamber is potentially a powerful<br />
water quality modifier. Inherent protection for <strong>the</strong> system is provided by <strong>the</strong> high dilution<br />
(about 200:1) that occurs when <strong>the</strong> charge chamber waters are re-introduced to <strong>the</strong><br />
filtration pathway. Additionally, it must be assumed that <strong>the</strong>se low levels of<br />
anoxic/anaerobic are subject to microbial attack as <strong>the</strong>y pass through <strong>the</strong> overlying<br />
filtration bed. Early users of <strong>the</strong> MRBF technology, however, should be cognoscente of<br />
this issue and realize that any degree of sludge retention can be facilitated in <strong>the</strong> MRBF<br />
format.<br />
Summary<br />
After nearly four years of development and two years of evaluations and refinements <strong>the</strong><br />
first commercial filters following <strong>the</strong> MRBF format are being introduced. The MBRF<br />
format features an internal pneumatic charge and sludge chamber combination that<br />
effectively eliminates <strong>the</strong> linkage between backwashing and waterloss for floating bead<br />
bioclarifiers. Early commercial units will utilize <strong>the</strong> stacked concentric design. These<br />
designs are relatively aggressive washers and have performed well during almost three<br />
years of testing. It will be followed shortly by a low profile configuration designed to<br />
10
support airlift applications. These units are expected to facilitate a thorough commercial<br />
evaluation of recently developed high frequency washing strategies. Care needs to be<br />
taken in <strong>the</strong> selection of air pumps delivering air to <strong>the</strong> pneumatic charge chamber so that<br />
<strong>the</strong> circulating water pump does not exceed <strong>the</strong> shutoff pressure of <strong>the</strong> air pump. Careful<br />
attention should be given to <strong>the</strong> management of sludge if potential benefits are to be<br />
realized without suffering adverse effects of anaerobic by-products such as sulfide that<br />
could be potentially introduced.<br />
References<br />
Arbiv R. and J. van Rijn. 1995. Performance of a Treatment System for Inorganic<br />
Nitrogen Removal in Intensive Aquaculture Systems. Aquacultural Engineering Vol.<br />
14:189-203.<br />
Chen S., D. E. Coffin and R. F. Malone. 1997. Sludge Production and Management for<br />
Recirculating Aquacultural Systems, Journal of World Aquacultural Systems, Vol. 28(4),<br />
pp. 303 –315.<br />
DeLosReyes, A. A. Jr., L. E. Beecher, and R. F. Malone. 1997. Design Rationale for an<br />
Air-Driven Recirculating Systems Employing a Bubble-Washed Bead Filter. In: Timmons<br />
M. B. and T. Losordo (Eds.). Advances in Aquacultural Engineering. Aquacultural<br />
Engineering Society Proceedings III, ISTA IV, Orlando, FL, November 9-12, 1997,<br />
NRAES, New York, pp. 287-294.<br />
Drennan D. (1997a) Development of an Extremely Low Water-loss Recirculating<br />
Floating bead Filter for Biofiltration and Solids Capture on Recirculating Marine Culture<br />
Systems, Project funded by <strong>the</strong> U.S. Department of Commerce Small Business Innovative<br />
Research Program. Aquaculture Systems Technologies, LLC., New Orleans, Louisiana.<br />
Drennan D. (1997b). High Frequency Wash Airlift Bioclarifier Using Modified Floating<br />
Media for Recirculating Systems. Project funded by <strong>the</strong> U.S. Department of Agriculture<br />
Small Business Innovative Research Program. Aquaculture Systems Technologies, LLC.,<br />
New Orleans, Louisiana.<br />
Golz, W. J., K. A. Rusch, and R. F. Malone. 1999. Modeling <strong>the</strong> major limitations on<br />
nitrification in floating-bead filters. Aquacultural Engineering 20, 43-61.<br />
Huguenin, J. E., and J. Colt. 1989. Design and Operating Guide for Aquaculture<br />
<strong>Sea</strong>water Systems, Developments in Aquaculture and Fisheries Science, Vol. 20,<br />
Elsevier,264 pp.<br />
Lee, P. G. 1993. Computer Automation for Recirculating Systems. In Techniques for<br />
Modern Aquaculture, edited by Jaw-Kai Wang. ASAE Publication 02-93. pp. 61-70.<br />
11
Lee, P. G. 1994. A Review of Automated Control Systems for Aquaculture and Design<br />
Criteria for <strong>the</strong>ir Implementation. Aquaculture Engineering, Vol. 14:3:205-227<br />
Malone, R. F. 1992. Floating Media Biofilter, United States Patent No. 5,126,042, June<br />
30, 1992.<br />
Malone, R. F. 1993. Floating Media Hourglass Biofilter, U.S. Patent No.5,232,586,<br />
August 3, 1993.<br />
Malone, R. F., B. S. Chitta, and D. G. Drennan. 1993. Optimizing Nitrification in Bead<br />
Filters for Warmwater Recirculating Aquaculuture Systems. In Techniques for Modern<br />
Aquaculture, edited by Jaw-Kai Wang. ASAE Publication 02-93 (ISBN 0-<br />
9293355-40-7;LCCN 93-71584)<br />
Malone, R. F. and A. A. DelosReyes Jr. 1997. Categories of Recirculating Systems. In:<br />
Timmons M. B. and T. Lorsordo (Eds) Advances in Aquacultural Engineering,<br />
Aquacultural Engineering Society Proceedings III, ISTA IV, Orlando FL. November 9-<br />
12 NRAES-105, New York pp. 197-208<br />
Malone, R. F. and L. E. Beecher. 2000. Use of Floating Bead Filters to Recondition<br />
Recirculating Waters in Warmwater Aquaculture Production Systems. Aquacultural<br />
Engineering, Vol. 22:1-2: 33-56.<br />
Sastry, B. N., A. A. DeLosReyes, Jr., K. A. Rusch, and R. F. Malone. 1999. Nitrification<br />
performance of a bubble-washed bead filter for combined solids removal and biological<br />
filtration in a recirculating aquaculture system, Aquacultural Engineering 19, 105 - 117.<br />
Whitson, J., P. Turk, and P. Lee. 1993. Biological Denitrification in a Closed<br />
Recirculating Marine Culture System. In Techniques for Modern Aquaculture, edited by<br />
Jaw-Kai Wang. ASAE Publication 02-93. <strong>Pages</strong> 458-466.<br />
Wimberly, D. M. 1990. Development and evaluation of a low-density media biofiltration<br />
unit for use in recirculating fish culture systems. Master’s Thesis, Louisiana State<br />
University, Baton Rouge, Louisiana, 162 pp.<br />
12
Enhancing Nitrification in Propeller-Washed<br />
Bioclarifiers with Modified Floating Bead Media<br />
Christopher J. Stahl Douglas G. Drennan<br />
Research Director Managing Member<br />
Aquaculture Systems Technologies Aquaculture Systems Technologies<br />
Lance E. Beecher Ronald F. Malone<br />
Research Associate USA Chevron Professor<br />
Civil and Environmental Engineering Civil and Environmental Engineering<br />
Louisiana State University Louisiana State University<br />
Introduction<br />
Floating bead bioclarifiers are used in recirculating systems to simplify <strong>the</strong> water treatment<br />
train by performing <strong>the</strong> traditional treatment processes of clarification and biofiltration<br />
(Malone and Delos Reyes, 1997). Thus, <strong>the</strong> bioclarifier replaces two or three components.<br />
The sizing criterion for bioclarifiers is controlled by <strong>the</strong>ir nitrification capacity. Thus, a fair<br />
amount of research has been conducted into management techniques that optimize this critical<br />
biofiltration function.<br />
The objective of a biofilm management program is to maximize <strong>the</strong> relative level of nitrifying<br />
bacteria found within a biofilm which is usually dominated by heterotrophic bacteria<br />
(Bovendeur et al., 1990). As organic loading increases, <strong>the</strong> mass of heterotrophic bacteria<br />
increases, clogging <strong>the</strong> filter and necessitating a backwash sequence (Man<strong>the</strong> et al., 1988).<br />
The washing sequence removes <strong>the</strong> bulk of <strong>the</strong> heterotrophic bacteria, <strong>the</strong> organically rich<br />
suspended solids trapped in <strong>the</strong> bead matrix, and unfortunately, a lot of nitrifying bacteria.<br />
A filter set with a low backwash frequency will tend to show failure due to loss of hydraulic<br />
conductivity (Chitta, 1993; Sastry et al., 1999), poor oxygen delivery due to dispersive and<br />
diffusion problems in <strong>the</strong> biofilm (Zhang et al., 1995; Golz et al., 1999), or, gelling of <strong>the</strong> bed<br />
which induces backwashing failure (Wimberly, 1990; Sastry et al., 1999). Accumulation of<br />
captured solids not only fosters rapid heterotrophic growth which controls <strong>the</strong> biofouling of<br />
<strong>the</strong> bed, but solids also contribute to <strong>the</strong> filters nitrogen loading as <strong>the</strong>y undergo decay and<br />
ammonification (Ning, 1996).<br />
The optimum backwash frequency for propeller-washed bead filters using <strong>the</strong> normal 3-5 mm<br />
spherical beads is known to be about once every two days This matter was thoroughly studied<br />
and analyzed by computer models (Golz et al., 1999). This work classified propeller-washed<br />
bead filters as “aggressively -washed” and indicated that fur<strong>the</strong>r improvement in nitrification<br />
capacity could be accomplished if <strong>the</strong> proportion of nitrifiers harvested during each back wash<br />
1
event could be reduced. This would permit <strong>the</strong> backwash frequency to be increased, helping<br />
to minimize <strong>the</strong> secondary effects of solids accumulations. By reducing <strong>the</strong> heterotrophic<br />
burden on <strong>the</strong> filter, an increase in nitrification capacity was projected.<br />
Filter Media<br />
In this study, <strong>the</strong> effectiveness of modifying <strong>the</strong> shape of <strong>the</strong> beads to provide for increased<br />
biofilm protection was examined. The performance of a filter equipped with normal spherical<br />
beads was compared against a bead reshaped to provide an externally protected surface and<br />
a tubular media that was selected to examine <strong>the</strong> effect of an internally protected surface.<br />
The three media tested in this study are illustrated in Figure 1. The figure displays, from<br />
left to right, <strong>the</strong> standard low density polyethylene 0.32 cm feedstock bead, a modified<br />
bead (CB-A), and 0.32 cm diameter X 0.48 cm cylindrical media (ACE-1400) provided by<br />
Mr. Keith Berg (Berg, 1995) of Berg Bennett and Associates Pty. Limited of Birchgrove,<br />
Australia. The spherical, low density, polyethylene bead has been used exclusively in<br />
commercial bead filters. It has capabilities of retaining a biofilm for nitrification, but<br />
careful management must be taken to ensure proper wash time is not exceeded, which may<br />
overwash <strong>the</strong> beads. Modified beads are feedstock beads modified into a distinctive boat<br />
like shape. The top of this bead is indented providing protected space for biofilm<br />
accumulating while <strong>the</strong> lateral cross members on <strong>the</strong> top and a longitudinal keel on <strong>the</strong><br />
bottom prevent close stacking of <strong>the</strong> beads. Mr. Vernon Rodrigue of Vacherie Louisiana<br />
developed <strong>the</strong>se beads with <strong>the</strong> assistance of Dr. Malone.<br />
Figure 1. Examples of standard beads, modified media and tubes (left to right) with an<br />
optimum biofilm layer used during <strong>the</strong> experiments.<br />
2
The last filter media used in this study was cylindrical media or tubes. Biofloc grows both on<br />
<strong>the</strong> outer and inner surface of <strong>the</strong> tubes. During <strong>the</strong> washing sequence, <strong>the</strong> biofloc growing<br />
on <strong>the</strong> inner surface is almost completely protected from <strong>the</strong> abrasion induced by <strong>the</strong> mixing<br />
operation. The exterior surfaces of <strong>the</strong> beads are not protected. The tubes also display a<br />
much higher porosity (85% versus 35%) than spherical beads and (85% verses 55%) <strong>the</strong><br />
modified beads. Finally, <strong>the</strong>y contain substantially less plastic per cubic foot and will<br />
<strong>the</strong>refore display lower floatation energies reducing <strong>the</strong> inherent abrasion associated with <strong>the</strong><br />
washing process.<br />
Recirculating Systems<br />
Three identical recirculating systems were constructed in a greenhouse at <strong>the</strong> Aquaculture<br />
Systems Technologies, LLC. facility which is located in New Orleans, Louisiana. Each<br />
recirculating system was comprised of a 6,750-liter (1,800-gallon) fiberglass tank, an 85liter<br />
(3-ft 3 ) propeller-washed bead filter, a 1/6-Hp centrifugal water pump, and a 3-kW<br />
heater. The daily backwashing of all <strong>the</strong> filters were managed using an automated<br />
controller which allows <strong>the</strong> operator to set <strong>the</strong> time between backwashes, propeller mixing<br />
duration and <strong>the</strong> drain time. An automatic feeder was used to disperse a specific amount<br />
feed in <strong>the</strong> system throughout <strong>the</strong> entire day. This condition was better for <strong>the</strong> bead filter<br />
because of <strong>the</strong> relatively constant addition of nutrients to <strong>the</strong> system, which would allow<br />
consistent performance by <strong>the</strong> system. Blown air, which provided aeration to <strong>the</strong> system,<br />
was delivered to <strong>the</strong> system via a 2.5-Hp blower. In each tank, eight, 23-cm air stones<br />
were used to evenly distribute air into <strong>the</strong> system. Headloss through <strong>the</strong> filter bed was<br />
measured via a dial pressure gage that was tapped into <strong>the</strong> section of pipe preceding <strong>the</strong><br />
filter and after <strong>the</strong> pump. Small stopcock valves (0.64-cm or ¼-inch) were also tapped<br />
into <strong>the</strong> pipe preceding <strong>the</strong> filter and in <strong>the</strong> filter head, above <strong>the</strong> discharge screen, for <strong>the</strong><br />
collection of water samples. The fish that were used throughout <strong>the</strong> experiment were<br />
tilapia, Oreochromis mossanbicus, obtained from TilTech Aquafarms, which is located in<br />
Robert, Louisiana. Each system had sufficient amount of biomass (>360-kg) so that all of<br />
<strong>the</strong> daily feed ration would be completely consumed. The feed used throughout <strong>the</strong><br />
experiments was a 35% crude protein, tilapia diet (3/16-inch pellet; double vitamin pack)<br />
from Burris Feed Mills in Franklinton, LA.<br />
Experimental Design<br />
Table 1 summarizes <strong>the</strong> experimental design that was used. The experiments reflected<br />
different feed loading rates, combined with <strong>the</strong> backwash interval that <strong>the</strong> researchers found<br />
would result in <strong>the</strong> best filter performance depending on <strong>the</strong> characteristics of <strong>the</strong> different<br />
media. Experiment #1, <strong>the</strong> feed loading rate in each system was increased slowly to 24kg/m<br />
3 /day. Each filter was again washed at <strong>the</strong> baseline backwash frequency of once a day.<br />
In experiment #2, <strong>the</strong> feed rate was increased to 32- kg/m 3 /day. For <strong>the</strong> final experiment (#3),<br />
<strong>the</strong> feed rate was set at 36-kg/m 3 /day. As <strong>the</strong> feeding rates increased, <strong>the</strong> underlying factor<br />
which determined backwash frequency and mixing duration set by <strong>the</strong> researchers was water<br />
3
quality, specifically <strong>the</strong> tank ammonia and nitrite level.<br />
Table 1. Backwash regime and mixing duration for propeller-washed beadfilters using various<br />
media at different feeding rates<br />
Feed Loading<br />
Rate<br />
Backwash Frequency<br />
(per day)<br />
(kg/m 3 /day) Beads Modified<br />
Beads<br />
24<br />
32<br />
36<br />
Sampling Protocols<br />
4<br />
Mixing Duration<br />
(seconds)<br />
Tubes Beads Modified<br />
Beads<br />
Tubes<br />
4 3 3 15 20 20<br />
NA 3 3 NA 25 25<br />
NA 4 4 NA 25 30<br />
The objective of each experiment was to determine <strong>the</strong> filter’s performance once steady state<br />
was reached for two weeks at <strong>the</strong> target-feeding rate. Therefore, whenever <strong>the</strong> feeding or<br />
backwashing rate was adjusted, <strong>the</strong> systems were allowed to acclimate for <strong>the</strong> required<br />
period. During <strong>the</strong>se periods of adjustment water quality was monitored daily using a Hach<br />
2010 spectrophotometer and reagents. Once steady performance was achieved in all three<br />
systems, water samples were taken from filter influent and effluent ports from each system<br />
for 3 consecutive days.<br />
Influent and effluent water sampling was conducted according to a standardized analytical<br />
protocol. The protocol requires influent and effluent sampling for primary parameters (TAN,<br />
NO2, BOD5, TSS, and Turbidity), and determination of critical secondary parameters (pH,<br />
alkalinity, temperature, dissolved oxygen, and flow rate). These secondary parameters were<br />
analyzed immediately by <strong>the</strong> research team at AST due to instability of <strong>the</strong>se parameters. This<br />
sampling regime allows <strong>the</strong> filter’s physical performance (flow rate, headloss, airflow<br />
demands, and sludge loss rates) to be studied in light of actual loading regimes experienced<br />
by <strong>the</strong> filter. Water flow and temperature were also recorded at <strong>the</strong> time of sampling. The<br />
remaining portion of <strong>the</strong> sample was placed on ice and shipped immediately, via commercial<br />
bus line, to <strong>the</strong> CEASL water quality lab in <strong>the</strong> Department of Civil and Environmental<br />
Engineering at Louisiana State University for analysis of remaining parameters by<br />
standardized methods (Table 2) (APHA, 1996). Each water quality parameter was analyzed<br />
in triplicate and mean values were determined. All data was <strong>the</strong>n transferred to AST were<br />
it was transferred in spreadsheet format for complete analysis.
Table 2. Water quality analyses were conducted according to standardized procedures from<br />
<strong>the</strong> steady state sampling conducted for all experiments.<br />
Parameter Analysis Procedure<br />
Total Ammonia Nitrogen – (TAN) Distillation and Nesslerization- colorimetric<br />
Nitrite Diazotization Method-colorimetric<br />
Nitrate Mullin and Riley Reduction Method<br />
Oxygen Winkler with Azide Modification Method<br />
PH Orion Model 701A Digital Meter and Probe<br />
Alkalinity Sulfuric acid Titration (Potentiometric and<br />
colorimetric methods)<br />
Biochemical Oxygen Demand<br />
(5-Day)<br />
Winkler and Azide modification/thiosulfate titration<br />
Total Suspended Solids Vacuum filtration/drying oven 103-105 o C<br />
Turbidity Turner Designs Nephelometer<br />
Note: All procedures for Standard Methods (APHA, 1996)<br />
Results<br />
Volumetric Nitrification Rate<br />
The actual nitrification performance was estimated by calculating <strong>the</strong> volumetric nitrification<br />
capacity (VTR, in units of grams TAN converted per cubic meter of beads per day). This was<br />
determined by measuring <strong>the</strong> influent TAN concentration (TANI in mg-N/L), <strong>the</strong> effluent<br />
TAN concentration (TANE in mg-N/L) and <strong>the</strong> flow rate through <strong>the</strong> filter (Q in liters per<br />
minute) and applying <strong>the</strong>m into Equation 1:<br />
1.440 ( TANI<br />
- TANE)<br />
Q<br />
VTR =<br />
(V)<br />
where V is <strong>the</strong> volume of beads in <strong>the</strong> filter (meters 3 ), and 1.440 represents a conversion<br />
factor correcting for <strong>the</strong> differences in units of various terms.<br />
5<br />
(1)
Experiment #1<br />
At 2.04- kg feed/m 3 /day, <strong>the</strong> three systems showed very good nitrification performance (Table<br />
3). System 1 (spherical beads) system 2 (modified beads), and system 3 (tubes) recorded<br />
VTR values of 752.17, 1,014.65, and 1,190.05 g/m 3 /day, respectively (Table 3). All three<br />
filters performed well at this level. Systems #2 & #3 displayed <strong>the</strong> best tank water quality,<br />
particularly with respect to nitrite. System #1 had a chronic elevated nitrite level due to <strong>the</strong><br />
additional amount of mixing needed at this high feeding rate. None of <strong>the</strong> filters displayed<br />
problems with water flow rate.<br />
Table 3. Mean values for tank ammonia levels and Volumetric TAN Rates (VTR) are<br />
presented for all experiments followed by standard deviations in brackets.<br />
Data Set Media<br />
Experiment #1<br />
(n=3)<br />
Experiment #2<br />
(n=3)<br />
Experiment #3<br />
(n=3)<br />
Experiment #2<br />
Tank TAN<br />
(mg-N/L<br />
Beads 1.63[0.65]<br />
Modified 1.15 [0.11]<br />
Tubes 0.98 [0.57]<br />
Modified 0.70 [0.28]<br />
Tubes 0.81 [0.73]<br />
Modified<br />
1.0 [0.29]<br />
Tubes 1.07 [0.3]<br />
6<br />
VTR<br />
(g m -3 d -1 )<br />
Flow Rate<br />
(lpm)<br />
752 [208] 155 [9.9]<br />
1015 [296] 145 [0.4]<br />
1190 [507] 148 [7.2]<br />
727 [134] 179 [9.0]<br />
613 [447] 194 [20.1]<br />
482 [158] 153 [20.1]<br />
463 [66] 172 [19.3]<br />
As we attempted to increase <strong>the</strong> feeding rate in system 1 to <strong>the</strong> next feeding level, <strong>the</strong> nitrite<br />
level rose to lethal levels (>15 mg/l NO2) despite our best efforts to balance <strong>the</strong> mixing<br />
duration and backwashing frequency. The increased mixing simply prevented us from<br />
maintaining a sufficient amount of nitrifying bacteria on <strong>the</strong> beads following a backwashing<br />
event. Since this feeding level exceeded <strong>the</strong> recommended loading rates for normal beads, we<br />
<strong>the</strong>refore decided to remove this system from <strong>the</strong> study and use it as a holding system for<br />
extra fish. Although <strong>the</strong>y were operating at somewhat different VTR levels, systems 2 and 3<br />
overall performance was still good (VTR’s of 410.12 and 613.43 g-TAN m -3 day -1 ). There<br />
were no noticeable differences in substrate values between <strong>the</strong> systems. The research team<br />
feels that this was variability in <strong>the</strong> media reacting differently to <strong>the</strong> increased feeding rates<br />
and <strong>the</strong> beginning of a heterotrophic bacterium buildup. The results were similar with respect<br />
to nitrite levels in <strong>the</strong> two systems (Table 4). VNR for both systems 2 & 3 were 726.86 and
1193.67 g-NO2 m -3 d -1 with <strong>the</strong> nitrite levels of 0.67 and 0.71 mg/L respectively.<br />
Table 4. Mean values for tank nitrite levels and Volumetric Nitrite Rates (VNR) are<br />
presented for all experiments followed by standard deviations in brackets.<br />
Data Set Media<br />
Experiment #1<br />
(n=3)<br />
Experiment #2<br />
(n=3)<br />
Experiment #3<br />
(n=3)<br />
Experiment #3<br />
Tank Nitrite<br />
(mg-N/L)<br />
Beads 0.9.80 [1.42]<br />
Modified 0.5.52 [4.92]<br />
Tubes 0.1.09 [0.49]<br />
Modified 0.67 [0.23]<br />
Tubes 0.71 [0.38]<br />
Modified<br />
0.27 [0.06]<br />
Tubes 0.55 [0.28]<br />
7<br />
VNR<br />
(g m -3 d -1 )<br />
Flow Rate<br />
(lpm)<br />
1539 [582] 155 [9.9]<br />
1331 [509] 145 [0.4]<br />
1387 [564] 148 [7.2]<br />
727 [373] 179 [9.0]<br />
1194[897] 194 [20.1]<br />
503 [153] 153 [20.1]<br />
509[144] 172 [19.3]<br />
The next phase of <strong>the</strong> project was to attempt to reach <strong>the</strong> <strong>the</strong>oretical maximum loading rate<br />
for <strong>the</strong> two remaining media at 3.06-kg feed/m 3 /day. With backwash intervals shortened to<br />
every 6 hours in both systems (Table 1), it was also necessary to increase <strong>the</strong> mixing duration<br />
of <strong>the</strong> tubular media to 30 seconds. Although this time was not optimum for maximizing<br />
nitrification rates, it was necessary to keep <strong>the</strong> internal spaces of <strong>the</strong> tubes clear. Tank nitrite<br />
levels would rise to dangerous amounts in both systems due to over mixing if <strong>the</strong> mixing time<br />
was extended. The VTR value, for system 2 was almost <strong>the</strong> same as what was for system 3.<br />
Substrate TAN values were determined to be 1.00 (system 2) and 1.07 (system 3) mg/L. The<br />
performance of <strong>the</strong> modified beads and <strong>the</strong> tubes can be said to have reasonable VTR values<br />
at elevated loading regime, however, this could be contributed to excessive amounts of<br />
organic material (fish wastes as well as heterotrophic bacteria) within <strong>the</strong> bead bed. The<br />
problems with elevated nitrogen levels observed with <strong>the</strong> increase in feeding could be directly<br />
related to <strong>the</strong> washing of <strong>the</strong> media. If ei<strong>the</strong>r of <strong>the</strong> two media was over washed, nitrite levels<br />
increased to abnormal levels. Therefore, to maintain adequate water quality, consideration<br />
was taken more for sustained performance than maintaining optimum biofilm levels.<br />
Discussion<br />
During <strong>the</strong> course of <strong>the</strong>se experiments achieving <strong>the</strong> proper balance of mixing times and<br />
frequencies presented <strong>the</strong> most problems to confound our efforts to achieve 2 weeks of steady
state operating conditions prior to sampling. The overall VNR values displayed for <strong>the</strong>se<br />
filters demonstrate higher values than those observed in similar experiments undertaken at<br />
LSU over <strong>the</strong> last few years (Wimberly, 1990; Chitta 1993; Sastry, 1996). For example, in<br />
1996, Sastry completed a test with a bubble-washed filter filled with spherical beads at a<br />
backwash frequency of once a day. The VNR reported for Sastry’s test was 130 gms-N m -3<br />
d -1 . The results here with <strong>the</strong> tubes, modified beads, and spherical beads show VNR values<br />
levels of 915, 780, and 578 percent, respectively, of this baseline value.<br />
It is clear that both <strong>the</strong> tubes and modified beads performed better than <strong>the</strong> spherical beads.<br />
Although <strong>the</strong> beads displayed <strong>the</strong> satisfactory water quality values, <strong>the</strong>y could not handle <strong>the</strong><br />
increased loading (2.04 kg m -3 d -1 is <strong>the</strong>ir designed maximum loading capacity) using <strong>the</strong><br />
propeller-washed filter platform. In contrast, both <strong>the</strong> modified media and <strong>the</strong> tubes<br />
consistently displayed <strong>the</strong> good water quality. Under <strong>the</strong> most rigorous loading regime ei<strong>the</strong>r<br />
media would perform adequately with respect to both water quality and conversion rates. This<br />
ranking is consistent with <strong>the</strong> opinions of <strong>the</strong> researchers involved.<br />
Microscopic investigation of media removed from <strong>the</strong> filters at <strong>the</strong> end of experiment revealed<br />
that a significant percentage of <strong>the</strong> tubes had <strong>the</strong> inner side of <strong>the</strong> tube completely closed off.<br />
Sastry (1996) indicated this when tubes were subjected to loading rates higher than 2.0 kg<br />
feed m 3 beads per day. Once <strong>the</strong> tubes were filled with biofloc <strong>the</strong>y exhibited a dramatic<br />
collapse of effective surface area hinders performance. While some of <strong>the</strong> deeper depressions<br />
in <strong>the</strong> modified media became clogged, <strong>the</strong> vast majority remained open with a light biofilm.<br />
Acknowledgments<br />
The researchers of this project would like to thank United States Department of Agriculture<br />
for <strong>the</strong> award of a Small Business Innovation Research Grant Program who funded this<br />
research. Mr. Keith Berg for providing <strong>the</strong> tubular media used in <strong>the</strong> study.<br />
References<br />
APHA. 1996. Standard Methods for <strong>the</strong> Examination of Water and Wastewater, 20 th ed.<br />
American Public Health Administration, Washington, DC.<br />
Berg, K. 1995. Active Cylindrical Elements (ACE-1400). Australian Patent Application #<br />
PN4747. International Patent Cooperation Treaty Application # PCT AU96/00504.<br />
Keyword: Filtration Medium.<br />
Bovendeur, J., Zwaga, A. B., Lobee, B. G. J., and Blom, J. H. 1990. Fixed-biofilm Reactors<br />
in Aquacultural Water Recycle Systems: Effect of Organic Matter Elimination on Nitrification<br />
Kinetics. Water Research, Vol. 24, No. 2, pp. 207-213.<br />
Chitta, B. S. 1993. Effects of Backwash Frequency on <strong>the</strong> Nitrification in Plastic Bead Media<br />
8
Biofilters Used in Recirculating Finfish Culture Systems. M. S. Thesis, Louisiana State<br />
University, Baton Rouge, Louisiana.<br />
Golz W., K. A. Rusch, & R. F. Malone. 1996. Developing Backwash Protocols for Floating<br />
Bead Filters : A Model of Solids-Loading and Biofilm-Retention Effects on Nitrification.<br />
Aquacultural Engineering Society Proceedings II, Successes and Failures in Commercial<br />
Recirculating Aquaculture, a Publication of <strong>the</strong> Nor<strong>the</strong>ast Regional Aquaculture Engineering<br />
Service (NRAES-98, Volume 1:196-205).<br />
Golz, W. J., K. A. Rusch, and R. F. Malone. 1999. Modeling <strong>the</strong> major limitations on<br />
nitrification in floating-bead filters. Aquacultural Engineering 20, 43-61.<br />
Losordo, T. M. and Westerman, P. W. 1991. "An Analysis of Biological, Economic, and<br />
Engineering Factors Affecting <strong>the</strong> Cost of Fish Production in Recirculating Aquaculture<br />
Systems," pp. 1-9 In Workshop Proceedings on Design of High Density Recirculating<br />
Aquaculture Systems, 1993, Louisiana State University, Baton Rouge, Louisiana, September<br />
25-27.<br />
Losordo, T.M., M.P. Masser, and J.E. Rakocy. 1992. Recirculating aquaculture tank<br />
production systems: an overview of critical considerations, Sou<strong>the</strong>rn Regional Aquaculture<br />
Center. Publication 451.<br />
Loyless, J. C. 1995. AA Feasibility Study of Using Air-lift Pumps for Aeration, Degasification<br />
and Water Movement in a Recirculating Aquaculture System. Master’s Thesis, Louisiana<br />
State University, Baton Rouge, Louisiana 116 pp.<br />
Malone, R. F. 1992. Floating Media Biofilter, U.S. Patent No. 5,126,042, June 30.<br />
Malone, R. F., B. S. Chitta, and D. G. Drennan. 1993. Optimizing Nitrification in Bead Filters<br />
for Warmwater Recirculating Aquaculture Systems. In Techniques for Modern Aquaculture,<br />
edited by Jaw-Kai Wang. ASAE Publication 02-93.<br />
Malone, R. F. And A. A. DeLosReyes. 1997. Interim Design Criteria for Warmwater<br />
Recirculating Systems Employing Floating Bead Filters and Blown Air. Published abstract.<br />
In Book of Abstracts, World Aquaculture >97, <strong>Sea</strong>ttle, Washington, U.S.A., pp. 306.<br />
Man<strong>the</strong>, D. P., R. F. Malone, and S. Kumar. 1988. Submerged Rock Filter Evaluation Using<br />
an Oxygen Consumption Criterion for Closed Recirculating System. Aquacultural<br />
Engineering, 7: 97-111.<br />
9
Ning, Z. 1996. Characteristics and Digestibility of Aquacultural Sludge. M.S. Thesis,<br />
Louisiana State University, Baton Rouge, Louisiana.<br />
O'Rourke, P. D. 1991. "Preproduction Analysis of Economic Profitability for Recirculating<br />
Aquaculture Systems," pp. 16-17 In Proceedings Workshop on Design of High Density<br />
Recirculating Aquaculture Systems, 1993, Louisiana State University, Baton Rouge,<br />
Louisiana, September 25-27.<br />
Sastry, B. N. 1996. A Comparison of Nitrification Capacity in Bead and Tubular Plastic<br />
Media. M.S. Thesis, Louisiana State University, Baton Rouge, Louisiana.<br />
Sastry, B. N., A. A. DeLosReyes, Jr., K. A. Rusch, and R. F. Malone. 1999. Nitrification<br />
performance of a bubble-washed bead filter for combined solids removal and biological<br />
filtration in a recirculating aquaculture system, Aquacultural Engineering 19, 105 - 117.<br />
Timmons M.B., and T.M. Losordo (eds.). 1994. Aquaculture Water Reuse Systems:<br />
Engineering Design and Management. Developments in Aquaculture and Fisheries Science,<br />
27. Elsevier, Amsterdam, xii + 333 pp.<br />
Wheaton, F. W. (1985) Aquacultural Engineering, 2nd ed., Wiley-Interscience, New York.<br />
708 pp.<br />
Wimberly, D. M. 1990. Development and Evaluation of a Low-Density Media Biofiltration<br />
Unit for Use in Recirculating Fish Culture Systems, Master's Thesis, Louisiana State<br />
University, Baton Rouge, Louisiana.<br />
Zhang, T. C., Y. C. Fu, & P. L. Bishop 1995. Competition for Substrate and Space in<br />
Biofilms. Water Environmental Resources. 67:992-1003.<br />
10
The Cyclone Sand Biofilter: A New Design Concept and<br />
Field Evaluation<br />
Background<br />
Michael B. Timmons, Professor<br />
Agricultural and Biological Engineering, Cornell University<br />
Ithaca, NY 14853<br />
Neil Helwig, Engineer<br />
Marine Biotech, Inc<br />
Beverly, MA 01915<br />
Steven T. Summerfelt, Research Engineer<br />
Conservation Fund Freshwater Institute<br />
Shepherdstown, WV 25443<br />
Being economically competitive in world fish production will require that we implement<br />
large scale fish farms that require ammonia assimilation rates on <strong>the</strong> order of 40 kg<br />
TAN/day (1,000,000 lb per year fish farms). This requires 40 m 3 of bed volume in a<br />
granular biofilter 1 or about 5x this volume (about 200 m 3 ) for a more typical biofilter<br />
using media with much lower specific surface areas than sand. Table 1 summarizes <strong>the</strong><br />
estimated costs associated just with <strong>the</strong> biofilter for a 1,000,000 lb (454 MTON) per year<br />
tilapia farm.<br />
Table 1. Capital costs associated with biofilter choices for a tilapia farm producing<br />
1,000,000 lb (454 MTON) annually. Cost is listed as $ per PPY (i.e., pound per year).<br />
Biofilter Type Farm Cost Cost, $ per PPY<br />
Rotating Biological Contactor 1<br />
$668,000 $0.68<br />
Trickling Biofilter 2<br />
$620,000 $0.62<br />
Bead Filter 3<br />
$296,000 $0.30<br />
Conventional Fluidized-Sand Biofilter 2<br />
$124,000 $0.12<br />
Cyclo Biofilter 3<br />
1<br />
Timmons et al. (1993).<br />
2<br />
Extrapolated from Summerfelt (1999).<br />
$76,000 $0.08<br />
3<br />
Prices provided by <strong>the</strong> commercial manufacturer or <strong>the</strong>ir catalogs.<br />
The manufacturers of alternate biofilters would probably argue with <strong>the</strong> above table and<br />
<strong>the</strong> authors do not intend to disparage alternatives. For example, <strong>the</strong> bubble wash filter<br />
can be used as a solids collection device as well, which reduces its "effective" cost for<br />
biofiltration. Yet, Table 1 is fairly demonstrative in showing <strong>the</strong> large economic<br />
advantage to a cyclone biofilter.<br />
1 See Timmons and Summerfelt (1998) to see methodology for estimating bed volume requirements.<br />
1
Biofilter Scale Effects and Risk<br />
The major advantage of <strong>the</strong> Cyclo-Bio ΤΜ is its ability to be scaled to capacities to<br />
assimilate ammonia production from standing fish biomasses on <strong>the</strong> order of 50,000 kg.<br />
In effect <strong>the</strong>se filters can be made as large as <strong>the</strong>y need to be to handle a specified fish<br />
biomass. O<strong>the</strong>r considerations will dictate <strong>the</strong> actual fish load with <strong>the</strong> primary one being<br />
risk associated with catastrophic failure. The biofilter is simply one source of failure. In<br />
our view it is more cost effective, substantially, to minimize <strong>the</strong> number of biofilters on a<br />
farm so that each can be designed with substantial redundancy and excess capacity. The<br />
simple construction of a Cyclo-Bio ΤΜ allows very large units to be designed cost<br />
effectively, since not “very many” are needed and <strong>the</strong>ir major cost is <strong>the</strong> cost of <strong>the</strong><br />
reactor vessel. Since one primarily pays for reactor vessels on materials used to<br />
manufacture, <strong>the</strong> advantage in <strong>the</strong> large units is that cost savings are obtained since <strong>the</strong><br />
volume goes up cubically while costs only increase by <strong>the</strong> square of <strong>the</strong> reactor vessel<br />
diameter. Thus, <strong>the</strong> bigger <strong>the</strong> vessel <strong>the</strong> cheaper <strong>the</strong> unit proportionately. The counter<br />
argument is to design small biomass systems with individual biofilters so that when a<br />
system fails, <strong>the</strong> severity of <strong>the</strong> economic loss is small because an individual system<br />
represents only a small fraction of <strong>the</strong> entire system.<br />
The Cyclo Biofilter TM : A New Biofilter Design Concept<br />
Outlet<br />
Figure 1. Cyclo-Bio ΤΜ upflow sand biofilter, patent filed by Marine Biotech (Beverly, MA).<br />
CycloBio<br />
2<br />
Inlet
Marine Biotech (Beverly, MA) 2 has filed for patent protection on <strong>the</strong> Cyclo-Bio ΤΜ<br />
biofilter design. The Cyclo-Bio ΤΜ biofilter’s design eliminates all internal piping and<br />
manifolds associated with conventional fluidized-sand biofilters, as described by<br />
Summerfelt and Cleasby (1996) and Summerfelt (1999). A typical header and pipelateral<br />
system can contribute up to 0.1-0.3 atm of additional operating pressure, which <strong>the</strong><br />
pumps must work against. In a Cyclo-Bio ΤΜ , this manifold and internal piping is<br />
replaced by an outside annulus (integral with <strong>the</strong> vessel wall) that supplies water into <strong>the</strong><br />
bottom of <strong>the</strong> vessel (i.e., at <strong>the</strong> base of <strong>the</strong> sand bed) through a continuous slot that<br />
circumscribes <strong>the</strong> vessel wall (see Figure 1). This design is very analogous to a slotted<br />
inlet used in animal housing to introduce air uniformly to <strong>the</strong> entire building. The<br />
pumping energy savings are a result of eliminating <strong>the</strong> conventional ‘pipe-lateral with<br />
distribution orifices’ type of distribution system a slotted inlet about <strong>the</strong> circumference of<br />
<strong>the</strong> vessel that incurs very little pressure drop due to <strong>the</strong> much lower water velocities<br />
employed. The Cyclo-Bio ΤΜ also decreases <strong>the</strong> cost associated with fluidized sand<br />
filters both in terms of equipment components and <strong>the</strong> time required to install and setup a<br />
new biofilter.<br />
Tests were conducted on a series of 0.9 m (3 ft) diameter units and several 3.5 m (11.5 ft)<br />
diameter units employed at Fingerlakes Aquaculture LLC growout production facility<br />
(Groton, NY). Sand expansion characteristics in <strong>the</strong> Cyclo-Bio ΤΜ biofilter are shown in<br />
Table 2. More extensive sand expansion tests (Figures 2 and 3) were also conducted<br />
within a 15 cm (6”) i.d. Cyclo-Bio ΤΜ vessel at Marine Biotech in Beverly, Massachusetts.<br />
Table 2. Bed expansions obtained for two sizes of reactors using 20/40 mesh sands and<br />
Cyclo-Bio ΤΜ sand filter design (courtesy of Fingerlakes Aquaculture LLC, Groton, NY)<br />
-------------------------------------------------------------------------------------------------------------------------<br />
Diam, ft cm/s Expan, % Farm<br />
3 0.84 2.9% a<br />
3 0.86 2.9% a<br />
3 0.85 2.9% a<br />
3 1.45 14.4% a<br />
3 1.45 14.4% a<br />
3 1.98 28.8% a<br />
3 1.93 28.8% a<br />
3 1.91 28.8% a<br />
3 2.55 22.0% b<br />
3 2.55 23.3% b<br />
3 2.55 31.3% b<br />
3 2.20 20.8% b<br />
11.5 1.44 39.3% c<br />
11.5 1.96 26.3% c<br />
--------------------------------------------------------------------------------------------------------------------------<br />
2 President and CEO James Aldridge (phone: 978-927-8720).<br />
3
These preliminary results suggest <strong>the</strong> following about a Cyclo-Bio ΤΜ biofilter:<br />
1. Sand bed can be fluidized with less than 50% of <strong>the</strong> design flow. This is important<br />
because sand filters with <strong>the</strong> typical pipe-lateral assembly in <strong>the</strong> bottom of <strong>the</strong> bed<br />
sometimes require greater than design flow rates to fluidize <strong>the</strong> bed initially.<br />
2. The use of <strong>the</strong> inlet plenum (Figure 1; it looks like a donut placed around <strong>the</strong> bottom<br />
circumference of <strong>the</strong> vessel) results in a circular flow being initiated around <strong>the</strong> long<br />
axis of <strong>the</strong> sand bed cylinder. This circular flow continues throughout <strong>the</strong> vessel and<br />
one can observe rotating flow even at <strong>the</strong> top of <strong>the</strong> reactor vessel. This is important<br />
because <strong>the</strong> outward circular flow can be used to advantageously move sand particles<br />
towards <strong>the</strong> vessel walls and away from a collection port removing water from <strong>the</strong><br />
center of <strong>the</strong> vessel. Some initial observations also showed that no sand loss occurred<br />
when intentionally introducing air bubbles into <strong>the</strong> sand column. This was attributed<br />
to <strong>the</strong> physics of air bubbles rising buoyantly in a vertical direction and sands that<br />
were being carried by rising bubbles were displaced by o<strong>the</strong>r sand particles that were<br />
rotating in a horizontal plane.<br />
3. The pressure drop through a Cyclo-Bio ΤΜ biofilter and <strong>the</strong> piping preceding <strong>the</strong> vessel<br />
are about 1/3 less than through a typical ‘pipe-manifold type’ fluidized-sand biofilter.<br />
Total pressure drop across <strong>the</strong> Cyclo-Bio ΤΜ biofilter is not significantly larger that <strong>the</strong><br />
expanded height of <strong>the</strong> sand column. This is to be expected because <strong>the</strong> pressure<br />
losses associated with <strong>the</strong> distribution manifold have (for all practical matters) been<br />
eliminated, e.g., <strong>the</strong> velocities through <strong>the</strong> slotted inlet plenum are less than 10% of<br />
<strong>the</strong> velocities used for <strong>the</strong> exhaust ports in a distribution manifold with conventional<br />
fluidized-sand biofilters.<br />
Literature Cited<br />
Summerfelt, S.T. and J. L. Cleasby. 1996. A review of hydraulics in fluidized-bed<br />
biological filters. Transactions of American Society of Agricultural Engineers<br />
39(3):1161-1173.<br />
Summerfelt, S.T. 1999. Chapter 13. Waste handling systems. <strong>Pages</strong> 309-350 In: E.H.<br />
Bartali and F. Wheaton (eds.), CIGR Handbook of Agricultural Engineering, Volume II:<br />
Animal Production and Aquacultural Engineering, American Society of Agricultural<br />
Engineers, St. Joseph, MI.<br />
Timmons, M.B. and S.T. Summerfelt. 1998. Application of fluidized-sand biofilters.<br />
<strong>Pages</strong> 342-354 In: The Second International Conference on Recirculating Aquaculture,<br />
G.S. Libey and M.B. Timmons (eds), Virginia Polytechnic Institute and State University,<br />
July 16-19, Roanoke, VA.<br />
Timmons, M.B., Youngs, W.D. and Ley, D, 1993. The Nor<strong>the</strong>rn Fresh Fish Cooperative:<br />
Formation and initial results and technology description with plans. Cornell ABEN<br />
Bulletin 465.<br />
4
120.0%<br />
100.0%<br />
80.0%<br />
60.0%<br />
40.0%<br />
20.0%<br />
0.0%<br />
0.0 2.0 4.0 6.0 8.0 10.0 12.0 14.0<br />
-20.0%<br />
Figure 2. Sand-bed expansion data as a function of water flow rate and sand size (e.g.,<br />
sieve size) within a 15 cm (6”) i.d. Cyclo-Bio ΤΜ vessel containing 15” of static sand.<br />
18<br />
16<br />
14<br />
12<br />
10<br />
8<br />
6<br />
flow (GPM)<br />
0 10 20 30 40 50 60 70<br />
Superficial velocity (gpm/ft 2 )<br />
(gpm/sq.ft.)<br />
Figure 3. A plot of pressure drop as a function of <strong>the</strong> superficial water velocity and sand<br />
size (e.g., sieve size) across a 15 cm (6”) i.d. Cyclo-Bio ΤΜ vessel containing 15” of static<br />
sand.<br />
5<br />
18/30 Media<br />
20/40 Media<br />
30/50 Media<br />
50/70 Media<br />
18/30 Media<br />
20/40 Media<br />
30/50 Media<br />
50/70 Media
U.S. EPA's Development of Aquaculture Effluent<br />
Limitation Guideline Regulations and <strong>the</strong> Role of <strong>the</strong> Joint<br />
Subcommittee on Aquaculture and O<strong>the</strong>r Stakeholders<br />
Michael L. Clipper<br />
United States Environmental Protection Agency<br />
Office of Water, Engineering and Analysis Division<br />
1200 Pennsylvania Ave NW (4303)<br />
Washington, DC 20460<br />
clipper.mike@epa.gov<br />
EPA is in <strong>the</strong> process of developing national effluent limitation guideline regulations for<br />
<strong>the</strong> Aquaculture industry. As part of this regulatory development work, EPA will<br />
summarize available information on aquaculture wastewater characterization, waste<br />
collection, storage, and treatment systems, and management practices. EPA will ga<strong>the</strong>r<br />
information on industry demographics and trends and will examine available economic<br />
data. EPA will examine environmental impacts that are associated with wastewater from<br />
aquaculture operations and existing case studies of <strong>the</strong> costs and effluent reduction<br />
benefits of controls to mitigate <strong>the</strong>se impacts. This information will be used to develop a<br />
profile of <strong>the</strong> industry and to determine economically achievable aquaculture technology<br />
options.<br />
EPA is obtaining aquaculture industry information from a variety of contributing sources<br />
for review and analysis. As part of this process, <strong>the</strong> EPA and <strong>the</strong> interagency federal Joint<br />
Subcommittee on Aquaculture (JSA) have agreed to work toge<strong>the</strong>r to create a national<br />
forum and systematic process that can foster broad stakeholder input to generate and<br />
report information and data related to <strong>the</strong> needs of EPA. The JSA has developed <strong>the</strong><br />
Aquaculture Effluents Study Task Force to assist EPA in <strong>the</strong>se efforts. Numerous<br />
Technical Subgroups linked to <strong>the</strong> Aquaculture Effluents Study Task Force are being<br />
formed for specific production systems and practices that are often species related. One of<br />
<strong>the</strong> Technical Subgroups includes Recirculating Aquaculture Systems. Each Technical<br />
Subgroup will assist EPA in addressing <strong>the</strong>ir data needs and will participate in reviewing<br />
draft materials. This presentation will provide an update of EPA's activities.<br />
1
Nitrification Potential and Oxygen Limitation in Biofilters<br />
Introduction<br />
Brooks Saucier, Songming Zhu and Shulin Chen<br />
Department of Biological Systems Engineering<br />
Washington State University, Pullman, WA 99164 USA<br />
Nitrification rate is <strong>the</strong> most important parameter in biofilter design. Research on<br />
different aquaculture systems has suggested a wide range of nitrification rates for<br />
different types of biofilters. The maximum nitrification rate (or nitrification potential) for<br />
a given total ammonia concentration in a system, however, has not been well documented<br />
for aquacultural applications.<br />
Nitrification is <strong>the</strong> biological oxidization of ammonia nitrogen to nitrate (Sharma and<br />
Ahlert, 1977). The following energy yielding reactions are carried out by nitrifiers and<br />
nitrafiers, respectively:<br />
NH4 + + 1.5 O2 ⇒ 2 H + + H2O + NO2 - + 58 to 84 kcal (1)<br />
NO2 - + 0.5 O2 ⇒ NO3 - + 15 to 21 kcal (2)<br />
As autotrophs, nitrifying bacteria use carbon dioxide as <strong>the</strong> sole carbon source for <strong>the</strong><br />
syn<strong>the</strong>sis of cell material. Reactions for carbon dioxide assimilation into cell biomass of<br />
<strong>the</strong> respective bacteria are:<br />
15 CO2 + 13 NH4 + ⇒ 10 NO2 - + 3 C5H7NO2 + 23 H + + 4 H2O (3)<br />
5 CO2 + NH4 + + 10 NO2 - + 2 H2O ⇒ 10 NO3 - + C5H7NO2 + H +<br />
According to <strong>the</strong> above equations, ei<strong>the</strong>r ammonia nitrogen or dissolved oxygen (DO)<br />
can become a limiting factor when its concentration is at a relatively low level. Based on<br />
Michaelis-Menten kinetics, <strong>the</strong> nitrification process in suspended growth is represented<br />
by Lawrence and McCarty's modified form of Monod's steady-state growth model (Srna<br />
and Baggaley, 1975):<br />
r<br />
g<br />
S<br />
μ X<br />
(5)<br />
K + S<br />
= max<br />
S<br />
where rg = rate of bacterial growth (mass unit-volume -1 time -1 ), μmax = maximum specific<br />
growth rate (time -1 ), X = microorganism concentration (mass/unit-volume), Ks = substrate<br />
saturation constant (mass/unit-volume), and S = limiting substrate concentration<br />
(mass/unit-volume).<br />
Equation 5, developed for suspended growth, does not address diffusion problems<br />
encountered in <strong>the</strong> fixed-film processes. In a fixed film biofilter, <strong>the</strong> supply of essential<br />
nutrients to <strong>the</strong> nitrifier bacteria is through a diffusion process. Thus, <strong>the</strong> diffusion rates<br />
of ammonia nitrogen and oxygen are critical in determining <strong>the</strong> nitrification rate. Since<br />
nitrification reactions occur in <strong>the</strong> biofilm and not in <strong>the</strong> bulk liquid (Moreau et. al.,<br />
1994), <strong>the</strong> substrate utilization rate is dependent on local substrate concentrations within<br />
1<br />
(4)
<strong>the</strong> biofilm. At <strong>the</strong> local reaction sites, reactant concentrations are depressed; and<br />
product concentrations are elevated (Boller et. al., 1994). Horn (1994) observed that<br />
nitrifying populations deep within <strong>the</strong> biofilm are maintained by endogenous respiration<br />
during oxygen limitations and that nitrifying populations on <strong>the</strong> surface are <strong>the</strong> only<br />
survivors during ammonia limitations.<br />
Tanaka and Dunn (1982) developed penetration parameters to represent <strong>the</strong> diffusion<br />
distance of oxygen relative to ammonia within <strong>the</strong> biofilm. The substrate penetration is<br />
proportional to <strong>the</strong> oxygen to ammonia concentration ratio in <strong>the</strong> bulk liquid, and <strong>the</strong><br />
relative penetration depends only on <strong>the</strong> stoichiometric ratio divided by <strong>the</strong> diffusion<br />
coefficient ratio (3.4/[DO2/DNH4]). Assuming biofilm diffusivities are 80% of pure water<br />
diffusivities (Tanaka and Dunn 1982 and Wanner and Gujer 1985), <strong>the</strong> diffusion<br />
coefficient ratio equals 1.25; and <strong>the</strong> relative penetration criterion becomes 2.72.<br />
Therefore, oxygen is <strong>the</strong> limiting substrate if <strong>the</strong> oxygen to ammonia concentration ratio<br />
in <strong>the</strong> bulk liquid is less than 2.72. For instance, McHarness et. al. (1975) stated that<br />
nitrification rates were lower than normal for oxygen to ammonia ratios less than<br />
required by stoichiometry. In addition, Horn (1994) showed that oxygen concentrations<br />
reach zero within <strong>the</strong> biofilm when oxygen to ammonia ratios are 1.75. Zhang et. al.<br />
(1994) observed decreased nitrification activity when DO concentrations were lowered in<br />
feed solutions with oxygen to ammonia ratios below 1.8.<br />
Variations in maximum nitrification rates among biofilters are typically caused by<br />
differences in <strong>the</strong> bulk DO concentration. When ammonia concentration becomes<br />
relatively high, maximum nitrification rates are often dependent on oxygen concentration<br />
and independent of ammonia concentration. Experimental results showed that <strong>the</strong> firstorder<br />
relationship between TAN removal rate and TAN concentration could reach 100<br />
mg/l of ammonia nitrogen (Liu and Capdeville, 1994), and that oxygen to ammonia ratios<br />
greater than 3 mg O2/ mg NH4-N are necessary before nitrification rate stops increasing<br />
(Tanaka and Dunn, 1982). Hagopian and Riley (1998) report that an up-flow, packedbed<br />
biofilter can remove ammonia nitrogen at rates as high as 34,800 mg m -2 d -1 when<br />
TAN and oxygen maintained at 50 and 36 mg/l, respectively.<br />
The objective of this paper is to present <strong>the</strong> results of a study examining nitrification<br />
potential and oxygen limitation of biofilters in different substrate concentrations and<br />
surface hydraulic conditions.<br />
Methods and Material<br />
Reactor Series System<br />
A reactor series system (Zhu and Chen 1999, Figure 1) was set up in this study to<br />
evaluate <strong>the</strong> relationship between removal rate and concentration of total ammonia<br />
nitrogen (TAN) in salt water. Biocube (Keeton Industries, Inc., Colorado, USA) was<br />
used as biofilter media. The reactor vessels were placed in a water bath with a chiller<br />
(Aqua Logic, Inc.) and heater (Clepco) for temperature control. An ammonia nitrogen<br />
solution resulted from mixing <strong>the</strong> stock solution and <strong>the</strong> water from <strong>the</strong> bath was fed to<br />
<strong>the</strong> system. The ammonia nitrogen feed solution consisted of ammonium chloride,<br />
sodium bicarbonate, and micronutrients. Oxygen was supplied to each reactor with<br />
2
diffused aeration. The experiments were conducted at 10 and 20 °C, respectively. Once<br />
<strong>the</strong> ammonia nitrogen levels were stabilized, effluent samples from each reactor were<br />
collected for a week to be analyzed for ammonia concentration at <strong>the</strong> Water Quality and<br />
Waste Analysis Laboratory at Washington State University, a certified laboratory by <strong>the</strong><br />
Washington Department of Ecology. O<strong>the</strong>r related parameters such as pH (Oakton pH10<br />
Series Meter), ammonia loading rate, and NaHCO3 were recorded daily. Temperature<br />
was maintained within + 2 °C for each experiment. DO was kept above 5 mg/l and pH<br />
between 7.6 and 8.2. Salinity averaged 30+4 ‰. Alkalinity, nitrate, and nitrite were<br />
monitored twice a week.<br />
Figure 1 Series Reactor Schematic<br />
Hydraulic controlled system<br />
A second experimental system (Figure 2) was assembled for evaluating nitrification<br />
performances at different hydraulic conditions (Reynolds numbers). A flexible plastic<br />
tubing (30.5 m long and 0.038 m in diameter) was used as biofilm support media for <strong>the</strong><br />
nitrifying bacteria to grow on <strong>the</strong> surface of <strong>the</strong> inner wall. The bulk solution was<br />
pumped from a sump through a one-way valve, and <strong>the</strong>n returned to <strong>the</strong> sump by two<br />
paths: <strong>the</strong> short-circuit path for overflow and regular path through <strong>the</strong> flexible tubing.<br />
Two ball valves were used in both of <strong>the</strong> two paths to regulate water flow rates. The<br />
tubing was placed in a large water bath where water temperature was controlled by a<br />
computer-interfaced data acquisition and control board (ADC-1, Remote Measurement<br />
Systems, Inc., Washington, USA). An air diffuser was placed in <strong>the</strong> water bath to mix<br />
<strong>the</strong> water and keep <strong>the</strong> temperature homogeneous. The sump was also aerated with a<br />
diffuser, so that <strong>the</strong> dissolved oxygen concentrations were maintained 6.75±0.67 mg/l for<br />
sump water, and 5.41±0.89 mg/l for <strong>the</strong> effluent of <strong>the</strong> tubing. A syn<strong>the</strong>tic substrate<br />
solution containing ammonia chloride, sodium bicarbonate and o<strong>the</strong>r necessary nutrients<br />
was continuously fed into <strong>the</strong> sump by a peristaltic pump. The resultant wastewater was<br />
continuously pumped through <strong>the</strong> tubing until a steady-state was established. This<br />
required about six weeks of acclimation. In <strong>the</strong> steady state, TAN removal rates by <strong>the</strong><br />
reactor equaled <strong>the</strong> feeding rates. It was assumed that for a fixed TAN feeding rate, a<br />
biofilm had a fixed thickness. Thus, a series of TAN concentrations can be obtained for<br />
3
different feeding rates and water flow rates to <strong>the</strong> tubing. The pH value in <strong>the</strong> reactors<br />
was kept in <strong>the</strong> range of 7.3-8.6, which was optimal for nitrification bacteria growth<br />
(Winkler, 1981). The temperature of <strong>the</strong> reactor was maintained at 20.8±0.4°C.<br />
Figure 2 Schematic of <strong>the</strong> hydraulic controlled experimental system.<br />
Results and Discussion<br />
Nitrification kinetics<br />
Figure 3 illustrates <strong>the</strong> typical Michaelis-Menten type response obtained from <strong>the</strong> reactor<br />
series system at 20ºC. The relationship between TAN removal rate and TAN<br />
concentration started as first-order reaction at low concentrations and approached zeroorder<br />
above approximately 4 mg/l of TAN. Curve fitting <strong>the</strong> experimental data resulted<br />
in <strong>the</strong> following expression:<br />
S<br />
μ 20 = 2020 * ( )<br />
(6)<br />
1.<br />
8 + S<br />
Equation (6) implies that <strong>the</strong> maximum nitrification potential under <strong>the</strong> experimental<br />
conditions is 2,020 mg TAN-N/m 2 -day. The nitrification rate reaches <strong>the</strong> 50% potential<br />
at a TAN concentration around 1.8 mg/l.<br />
Both Figure 3 and equation (6) provide additional insights for understanding nitrification<br />
processes. At low concentrations, TAN is assumed to be <strong>the</strong> limiting substrate since <strong>the</strong><br />
dissolved oxygen concentration was maintained above 5 mg/l. As TAN concentration<br />
increased, nitrification rates limitation was switched to DO (Bovendeur et. al. 1990 and<br />
Zhang et. al. (1994). According to Tanaka and Dunn (1982), oxygen becomes <strong>the</strong><br />
limiting substrate when <strong>the</strong> bulk liquid concentration ratio of oxygen to ammonia drops<br />
below 2.72 based on <strong>the</strong> relative amounts of <strong>the</strong> two nutrients penetrated to <strong>the</strong> biofilm.<br />
For a DO concentration in bulk solution of 5.5 mg/l, oxygen becomes <strong>the</strong> limiting<br />
substrate when <strong>the</strong> bulk ammonia concentration reaches 2 mg/l. Therefore, <strong>the</strong> zeroorder<br />
response in Figure 3 is due to a second limiting substrate, oxygen.<br />
4
It needs to be pointed out that <strong>the</strong> Michaelis-Menten model is only valid for steady-state<br />
biofilms. In order to evaluate a zero-order reaction due to substrate saturation, <strong>the</strong><br />
microorganism concentration must be constant throughout <strong>the</strong> range of substrates. Since<br />
separate reactors cannot contain equal active biomass concentrations under different<br />
substrate concentrations, rate data must be normalized using <strong>the</strong> maximum rate for each<br />
reactor (Tanaka and Dunn, 1982).<br />
TAN removal rate (mg/m 2 /day)<br />
2500<br />
2000<br />
1500<br />
1000<br />
500<br />
0<br />
Mean value 2020 S/(1.8+S)<br />
0 4 8 12 16<br />
TAN concentration (mg/l)<br />
Figure 3 Relationship between nitrogen removal rate and TAN concentration obtained<br />
from <strong>the</strong> reactor series at 20°C. Diamond points and error bars indicate mean values and<br />
standard deviations (n=18).<br />
A similar relationship was demonstrated in <strong>the</strong> 10 °C experiment (Figure 4), and a similar<br />
equation can be obtained (equation 7).<br />
S<br />
μ 10 = 1948 * ( )<br />
(7)<br />
2.<br />
1 + S<br />
Apparently, <strong>the</strong> temperature effects on nitrification rates did not produce a pronounced<br />
difference between <strong>the</strong> kinetic constants in equations 6 and 7.<br />
Experimental error and dissolved oxygen limitations could explain why <strong>the</strong> temperature<br />
effect on substrate utilization was unsubstantial. Increased percentage error in analysis<br />
below 2 mg/l subjected removal rate calculations to more error than at high<br />
concentrations. Therefore, temperature effects were difficult to distinguish below 2 mg/l<br />
when ammonia is <strong>the</strong> limiting substrate.<br />
When ammonia removal rate calculations became more accurate at high ammonia<br />
concentrations, oxygen became <strong>the</strong> limiting substrate. The removal rate of ammonia at<br />
20 °C might be almost twice <strong>the</strong> rate at 10 °C, but <strong>the</strong> ammonia removal rates appear<br />
equal because of <strong>the</strong> limited oxygen supply.<br />
Equations (6) and (7) can be used only for estimating nitrification potentials. The actual<br />
nitrification rate in a commercial facility is often much lower than that predicted using<br />
5
<strong>the</strong>se equations. Concentrations of organics, total suspended solids and variations in<br />
operating conditions contribute to <strong>the</strong> lower nitrification rates in <strong>the</strong>se facilities.<br />
Fig. 4 Relationship between nitrogen removal rate and TAN concentration for <strong>the</strong><br />
reactor series operated at 10°C. Diamond points and error bars indicate mean values and<br />
standard deviations (n=13).<br />
BOD Impact<br />
In order to explore <strong>the</strong> effects of BOD5 on ammonia removal rate, sucrose was added to<br />
<strong>the</strong> ammonia feed solution at a carbon-to-nitrogen ratio (C/N) of 2. The impact of BOD5<br />
competition on nitrification is clearly demonstrated in Figure 5. Reactor 1 had <strong>the</strong><br />
highest organic concentrations that allowed heterotrophic growth to dominate <strong>the</strong> biofilm<br />
surface. Due to <strong>the</strong> quick growth of heterotrophic bacteria, <strong>the</strong> biofilm growth in <strong>the</strong> first<br />
two reactors was visually distinguishable from that in <strong>the</strong> remaining reactors. The<br />
TAN Removal Rate (mg m -2 d -1 )<br />
2500<br />
2000<br />
1500<br />
1000<br />
500<br />
0<br />
TAN removal rate (mg/m 2 /day)<br />
2500<br />
2000<br />
1500<br />
1000<br />
500<br />
0<br />
1 2 3 4 5<br />
Reactor Number<br />
Mean value 1948 S/(2.1+S)<br />
0 4 8 12 16<br />
TAN concentration (mg/l)<br />
Figure 5 TAN Removal Rates in Series Reactor with adding sucrose<br />
6
ammonia removal rate was low in <strong>the</strong> first reactor, peaked in <strong>the</strong> second reactor, and <strong>the</strong>n<br />
dropped in <strong>the</strong> remaining reactors. The influence of BOD5 was assumed to be less<br />
significant after <strong>the</strong> first reactor since nitrification rates increased with decreased organic<br />
concentrations. Similar results were observed in a full-scale, six-stage biological reactor<br />
where ammonia removal rate increased through <strong>the</strong> first four stages and <strong>the</strong>n decreased in<br />
<strong>the</strong> final two stages as BOD5 removal dropped through all six stages (Wanner and Gujer,<br />
1985).<br />
Hydraulic impact<br />
The maximum nitrification rate can be significantly affected by <strong>the</strong> hydraulic conditions<br />
as represented by Reynolds number at <strong>the</strong> biofilter surface due to <strong>the</strong> nature of <strong>the</strong><br />
diffusion transport processes. The relationship between nitrification rate and TAN<br />
concentration resulted from <strong>the</strong> second experimental system was plotted in Figure 6.<br />
According to <strong>the</strong> classic fluid <strong>the</strong>ory, laminar flow occurs when Reynolds number Re <<br />
2,000. There is a critical zone of Reynolds number from 2,000 to 4,000. Figure 6<br />
indicates that <strong>the</strong>re was no significant difference of <strong>the</strong> maximum TAN removal rates<br />
between Re = 1,668 and 4,003. TAN removal rates corresponding to <strong>the</strong> two Reynolds<br />
TAN removal rate (g m -2 d -1 )<br />
8<br />
6<br />
4<br />
2<br />
0<br />
Re1 Re2 Re3 Re4 Re5<br />
0 2 4 6 8 10<br />
TAN concentration (g m -3 )<br />
Figure 6 Relationship between TAN concentration and removal rate under different<br />
Reynolds numbers (Re1 = 1,668, Re2 = 4,003, Re3 = 10,006, Re4 = 26,684, Re5 =<br />
66,710).<br />
numbers were much lower than those at higher Reynolds number. For a fixed TAN<br />
concentration, TAN removal rate at Re=66,710 was about 5 times of that at Re=1,668.<br />
This demonstrates that hydraulic condition was a major factor affecting TAN removal<br />
rate. A higher Reynolds number corresponds to a thinner liquid layer on <strong>the</strong> biofilm<br />
surface and a more rapid mass transfer of nitrogen and oxygen into <strong>the</strong> biofilm. This is<br />
7
important for <strong>the</strong> design and optimal operation of biofilters. When dealing with a shock<br />
load, for example, nitrification rate of a biofilter can be improved through increasing<br />
Reynolds number, by raising rotation speed of a RBC, or increasing turbulence of <strong>the</strong><br />
flow over a trickling filter.<br />
Conclusions<br />
(1) Nitrification potential was a function of substrate concentration. The relationship<br />
between nitrification rate of a biofilm reactor and substrate concentration followed<br />
Michaelis-Menten type equation. The maximum ammonia removal rate was above<br />
2000 mg-N/m 2 -day.<br />
(2) At steady-state, temperature impact to nitrification rate was not significant, especially<br />
under high substrate concentration condition when oxygen limitations became<br />
apparent.<br />
(3) Oxygen limitation became more pronounced when organic substance was present.<br />
The availability of organic matter stimulated <strong>the</strong> growth of heterotrophic bacteria,<br />
which in turn competed with nitrifiers for limited available oxygen.<br />
(4) Hydraulic condition was an important factor affecting oxygen and TAN mass transfer<br />
from bulk solution to biofilms, and thus limited TAN removal rate for a nitrification<br />
biofilm. For <strong>the</strong> same TAN concentration level, TAN removal rate at Re=66710 was<br />
about 5 times that at Re=1668.<br />
References<br />
Boller, M., Gujer, W., and Tschui, M. 1994. Parameters Affecting Nitrifying Biofilm<br />
Reactors. Water Science Technology 29(10-11):1-11.<br />
Bovendeur, J., Zwaga, A., Lobee, B., and Blom, J. 1990. Fixed-Biofilm Reactors in<br />
Aquacultural Water Recycle Systems: Effect of Organic Matter Elimination on<br />
Nitrification Kinetics. Water Research 24(2):207-213.<br />
Hagopian, D. and Riley, J. 1998. A Closer Look at <strong>the</strong> Bacteriology of Nitrification.<br />
Aquaculture Engineering 18(4):223-250.<br />
Horn, H. 1994. Dynamics of a Nitrifying Bacteria Population in a Biofilm Controlled by<br />
an Oxygen Microelectrode. Water Science Technology 29(10-11):69-76.<br />
Liu, Y. and Capdeville, B. 1994. Kinetic Behaviors of Nitrifying Biofilm Growth in<br />
Wastewater Nitrification Process. Environmental Technology 15:1001-1013.<br />
McHarness, D., Haug, R., and McCarty, P. 1975. Field Studies of Nitrification with<br />
Submerged Filters. Journal of <strong>the</strong> Water Pollution Control Federation 47(2):291-309.<br />
Moreau, M., Liu, Y., Capdeville, B., Audic, J.M., and Calvez, L. 1994. Kinetic<br />
Behavior of Heterotrophic and Autotrophic Biofilms in Wastewater Treatment<br />
Processes. Water Science Technologies. Vol. 29, No. 10-11. pp. 385-391.<br />
Sharma, B. and Ahlert, R.C. 1977 Nitrification and Nitrogen Removal. Water Research<br />
11:897-925.<br />
Srna, R.F. and Baggaley, A. 1975. Kinetic Response of Perturbed Marine Nitrification<br />
Systems. Journal of <strong>the</strong> Water Pollution Control Federation 47(3):472-786.<br />
8
Tanaka, H. and Dunn, I. 1982. Kinetics of Biofilm Nitrification. Biotechnology and<br />
Bioengineering 24:669-689.<br />
Wanner, O. and Gujer, W. 1985. Competition in Biofilms. Water Science Technology<br />
29(10-11):263-270.<br />
Winkler M. 1981. Biological treatment of wastewater. Ellis Horwood Ltd,<br />
New York, 301pp.<br />
Zhang, T., Fu, Y., and Bishop, P. 1994. Competition in Biofilms. Water Science<br />
Technology 29(10-11):263-270.<br />
Zhu, S. and Chen, S. 1999. An Experimental Study on Nitrification Biofilm<br />
Performances Using a Series Reactor System. Submitted to Aquaculture Engineering<br />
1999.<br />
9
Nitrification Performance of Nitrifiers Immobilized in PVA<br />
(Polyvinyl alcohol) for Marine Recirculating<br />
Aquarium System<br />
Sung-Koo Kim<br />
Department of Biotechnology and<br />
Bioengineering Pukyong <strong>National</strong><br />
University, Pusan 608-737, Korea<br />
Eun-Ju Park<br />
Department of Biotechnology and<br />
Bioengineering Pukyong <strong>National</strong><br />
University, Pusan 608-737, Korea<br />
Introduction<br />
1<br />
Jae-Koan Seo<br />
Department of Biotechnology and<br />
Bioengineering Pukyong <strong>National</strong><br />
University, Pusan 608-737, Korea<br />
Kuen-Hack Suh<br />
Department of Chemical Engineering<br />
Pukyong <strong>National</strong> University,<br />
Pusan 608-737, Korea<br />
Nitrification is one of <strong>the</strong> most important processes in recirculating aquarium system<br />
for <strong>the</strong> storage of high density of fishes, because ammonia is <strong>the</strong> major excretory<br />
production of fish and has toxicity to <strong>the</strong>m (Huguenin et al., 1989). In <strong>the</strong> biological<br />
ammonia removal system of seawater, <strong>the</strong> nitrifying activity of bacteria have been<br />
reported to be extremely low due to <strong>the</strong> slow growth rate of nitrifying bacteria, <strong>the</strong><br />
inhibition of nitrification by nitrite ion and high salt concentration (Bower et al.,<br />
1981, Furukawa et al., 1993). However, immobilization techniques can be used to<br />
overcome in <strong>the</strong>se problems. Immobilization of nitrifier microorganism in support gel<br />
is one way to maintain high cell density and prevent washout of <strong>the</strong> slow-growing<br />
autotrophic nitrifiers under low temperature or high flow rate condition.<br />
In this study, characteristics of nitrification processes with immobilized nitrifier<br />
consortium in PVA were studied for <strong>the</strong> development application of marine<br />
recirculating aquarium system for raw fish restaurant.<br />
Immobilization of nitrifiers and activity recovery of immobilized nitrifiers in<br />
PVA<br />
One portion of concentrated nitrifiers (4.5% dcw/v) was mixed thoroughly with one<br />
portion of PVA-HC aqueous solution (30% w/v). This mixture was <strong>the</strong>n dropped into<br />
gently stirred saturated boric acid solution to form spherical beads (Susumu et al.,<br />
1987). In order to complete gelation inside beads, <strong>the</strong>se beads were kept in a saturated<br />
boric acid solution for 24h under gentle stirring. Then <strong>the</strong> beads were taken out and<br />
washed with distilled water. The beads containing nitrifiers were reactivated by<br />
feeding ammonia in <strong>the</strong> 50L continuous reactor.
Ammonia removal activity was increased with operating times, and ammonia removal<br />
rate reached to 67 ammonia g/m 3 /day after 22 days of operation. The activity of<br />
recuperated nitrifiers beads were higher than that of free cell. The PVA-immobilized<br />
nitrifiers were used for <strong>the</strong> application seawater system.<br />
Conversion of freshwater to seawater system<br />
Four bioreactors were used to determine nitrification activities with various salt<br />
concentrations. Nitrification characteristics in seawater system were evaluated and <strong>the</strong><br />
results are shown in Fig. 1. Thirty ppt of salt concentration (seawater), 15 ppt, 7.5 ppt<br />
and freshwater were used for reactors, respectively. Influent average ammonia<br />
concentration was 10 mg/L and HRT of <strong>the</strong> reactor was controlled to 12 hours. Salt<br />
added reactors were showed a similar pattern on ammonia removal and <strong>the</strong> initial<br />
effluent ammonia concentrations were high due to <strong>the</strong> incomplete nitrification. The<br />
initial ammonia removal activity was low when <strong>the</strong> salt concentration was high<br />
because of <strong>the</strong> damage to <strong>the</strong> nitrifier by salt.<br />
Influent ammonia was completely removed after 25 days of operation by addition salt<br />
of 3 reactors. However, nitrite concentration reached up to 7 mg/L until 18 days of<br />
operation for <strong>the</strong> reactors with salt, and decreased to lower than 0.1 mg/L after 30-40<br />
days of operation. The salt concentration affected <strong>the</strong> activity of nitrification.<br />
Especially, Nitrobactor was damaged by <strong>the</strong> salt. Consequently, reactor with high salt<br />
concentration took long period for <strong>the</strong> stabilization of <strong>the</strong> system without <strong>the</strong><br />
formation of nitrite. Therefore, initial nitrite accumulation occurred due to more<br />
damage to Nitrobactor ra<strong>the</strong>r than Nitrosomonas by <strong>the</strong> addition of salt. After<br />
obtaining stable system with seawater, optimum HRT was obtained by <strong>the</strong> increase of<br />
flow rate. The HRT was set in <strong>the</strong> range of 6.12-0.7 hours as shown in Fig. 2. The<br />
ammonia removal efficiency of <strong>the</strong> system operated with 6.12 h of HTR was 83 %<br />
and it dropped to 12 % with 0.7 h of HRT.<br />
Considering HRT and amount of ammonia removed, <strong>the</strong> ammonia removal rate and<br />
ammonia removal efficiency were calculated and shown in Fig. 3. The removal rate<br />
becomes highest when HRT was 1 h. The rate increased to 63 g/m 3 /day when HRT<br />
decreased to 1 h. However, <strong>the</strong> removal rate decreased with a fur<strong>the</strong>r decrease in HRT.<br />
The decrease in HRT lower than 1 h caused <strong>the</strong> removal efficiency to decrease<br />
drastically which indicated <strong>the</strong> limitation of external diffusion and wash out of<br />
ammonia. This indicated that <strong>the</strong> maximum capacity of <strong>the</strong> immobilized nitrifiers to<br />
convert NH4 + -N to NO3 - was obtained when <strong>the</strong> HRT was 1 h. At a higher flow rate<br />
(low HRT), <strong>the</strong> NH4 + -N did not have sufficient contact time to be converted to NO3 - .<br />
The actual setup for <strong>the</strong> nitrifier reactor also needs much shorter HRT to reduce <strong>the</strong><br />
size of reactor. Therefore, this study is still in progress.<br />
2
TAN (mg/L)<br />
TAN (mg/L)<br />
TAN (mg/L)<br />
TAN (mg/L)<br />
12<br />
10<br />
8<br />
6<br />
4<br />
2<br />
10<br />
8<br />
6<br />
4<br />
2<br />
10<br />
8<br />
6<br />
4<br />
2<br />
A(30ppt, seawater)<br />
0<br />
12 B(15ppt, salt)<br />
0<br />
C(7.5ppt, salt)<br />
12<br />
0<br />
12 D(fresh water)<br />
10<br />
8<br />
6<br />
4<br />
2<br />
Time (days)<br />
Figure 1. Nitrification activity of immobilized nitrifiers in continuous reactor<br />
with various salt concentration<br />
3<br />
Inf. of TAN<br />
Eff. of TAN<br />
Eff. of Natrate<br />
Eff. of Nitrite<br />
0<br />
0 5 10 15 20 25 30 35 40 45 50 55 60<br />
12<br />
10<br />
8<br />
6<br />
4<br />
2<br />
0<br />
12<br />
10<br />
8<br />
6<br />
4<br />
2<br />
0<br />
12<br />
10<br />
8<br />
6<br />
4<br />
2<br />
0<br />
12<br />
10<br />
8<br />
6<br />
4<br />
2<br />
0<br />
Nirate, Nitrite (mg/L) Nirate, Nitrite (mg/L) Nirate, Nitrite (mg/L)<br />
Nirate, Nitrite (mg/L)
Ammonia Conc. (mg/NH 4 + -N/L)<br />
12<br />
10<br />
8<br />
6<br />
4<br />
2<br />
6.12hrs<br />
0<br />
0 5 10 15 20 25 30 35<br />
Figure 2. Ammonia removal profile in seawater Figure 3. Change of ammonia removal rate<br />
nitrification process with immobilized and efficiency of immobilized nitrifier in<br />
nitrifier by changing HRT seawater nitrification process with<br />
airlift bioreactor by changing HRT<br />
Reference<br />
3.47hrs<br />
1.54hrs<br />
Operating Time (Days)<br />
Influent conc.<br />
HRT<br />
Effluent conc.<br />
1.01hrs 0.90hrs 0.80hrs 0.70hrs<br />
7<br />
6<br />
5<br />
4<br />
3<br />
2<br />
1<br />
0<br />
Hydrauric Residence Time (Hours)<br />
Bower, C. E., and D. T. Turner. “Accelerated nitrification in new seawater culture<br />
systems.” Aquaculture. 24(1981):1-9<br />
Furukwa, K., A. Ike, S. Ryu, and M. Fujita. “Nitrification of NH4-N polluted seawater<br />
by immobilized acclimated marine nitrifying sludge (AMNS).” J. Ferment. Bioeng.<br />
76. (1993): 515-520.<br />
Huguenin, J. E., and J. Colt. Design and operating guide for aquaculture seawater<br />
systems. Developments in aquaculture and fisheries science (ed. by J. E. Huguenin<br />
and J. Colt). Elservier. Amsterdam. Oxford. New York. Tokyo. 20. p.168-170. 1989.<br />
Susumu, H., and K. Furukawa. “Immobilization of activated sludge by PVA-boric<br />
acid method.” Biotech. and Bioeng. 30(1987):52-59.<br />
4<br />
Ammonia Removal Rate<br />
+ 3<br />
(g NH4 -N/m /day)<br />
70<br />
60<br />
50<br />
40<br />
30<br />
20<br />
10<br />
0<br />
0<br />
0 1 2 3 4 5 6 7<br />
Hydrauric Residence Time (Hours)<br />
Removal rate<br />
Efficiency<br />
100<br />
90<br />
80<br />
70<br />
60<br />
50<br />
40<br />
30<br />
20<br />
10<br />
Ammonia Removal Efficiency (%)
Recirculating Systems for Maintenance and<br />
Propagation of Freshwater Mussels (Unionidae)<br />
William F. Henley, Lora L. Zimmerman,<br />
Mark R. Kidd, and Richard J. Neves<br />
Virginia Cooperative Fish and Wildlife Research Unit<br />
Department of Fisheries and Wildlife Sciences<br />
Virginia Tech, Blacksburg, VA 24061<br />
whenley@vt.edu.<br />
Air driven recirculating systems, an automated feeding system for delivery of algae, and<br />
water conditioning and air delivery systems have been developed and tested for <strong>the</strong><br />
maintenance and propagation of freshwater mussels at <strong>the</strong> Fisheries and Wildlife<br />
Department, Virginia Tech. The twelve-350 L, one-200 L, and twelve-145 L air-driven<br />
recirculating trough systems are powered by a 1 hp air blower creating water outputs of<br />
44.3 L/min. Over an 8-week period, water quality virtually did not change in 350 L<br />
experimental units that contained 200 mussels (160 mussels/m 2 ). The means and standard<br />
deviations of concentrations of total ammonia nitrogen (TAN), NH3, NO2, and NO3 in <strong>the</strong><br />
experimental units over <strong>the</strong> 8-week period were 0.10 mg/L (0.07), 0.02 mg/L (0.01), 0.01<br />
mg/L (0.005), and 2.7 mg/L (0.7), respectively. The means and standard deviations of<br />
dissolved oxygen (DO) and percentage saturation DO in <strong>the</strong>se treatment units over <strong>the</strong><br />
same period were 7.8 mg/L (0.6) and 83.4% (4.5), respectively. All systems have been<br />
successful in long-term holding of adult and juvenile mussels. Over 2,000 animals of 25<br />
species of adult freshwater mussels have been held over a 3 year period with an<br />
approximate mortality of 4%. In addition, fertilization and hermaphroditic shifts in<br />
mussels have been observed in <strong>the</strong>se systems. Algae is cultured in Kalwall tubes and<br />
pumped to treatment units via PVC pipes and timed solenoid valves. Designs for water<br />
conditioning and air delivery systems are also discussed in <strong>the</strong> presentation.<br />
1
Antifouling Sensors and Systems for Continuous Dissolved<br />
Oxygen, Ph, and Temperature Measurements<br />
<strong>Sea</strong>n M. Christian, Paul Grems Duncan, John A. Schroeder<br />
Airak, Inc., 9058 Euclid Avenue, Manassas, Virginia 20110-5308<br />
Voice: (703) 330-4961, Fax: (703) 330-4879<br />
ContactUs@airak.com http://www.airak.com<br />
Abstract<br />
Conventional sensor technology to continuously monitor water quality parameters is<br />
outdated. In general, when sensor technologies are placed in water for extended periods,<br />
<strong>the</strong>ir measurements drift due to a phenomenon known as biofouling. Biofouling, or<br />
contamination from algae, bacteria, or a combination of both, restricts <strong>the</strong> useful<br />
timeframe that conventional sensors can be placed in-situ for continuous readings to less<br />
than a week, and often less than 24 hours. Before today, <strong>the</strong> only way to address <strong>the</strong><br />
effects of biofouling was to physically clean and recalibrate <strong>the</strong> sensor and support<br />
system – an extremely labor intensive and costly maintenance requirement that most<br />
industries have been reluctant to adopt. Airak, Inc. is developing proprietary, patentpending<br />
technologies for its state-of-<strong>the</strong>-art fiber optic water quality sensors that address<br />
and mitigate <strong>the</strong> biofouling problem. This enabling technology will open <strong>the</strong> door for<br />
continuous, long-term monitoring of water quality parameters, specifically those in<br />
demanding applications, such as recirculating systems for aquaculture, differential<br />
monitoring of industrial effluent points, and <strong>the</strong> monitoring of ecosystems containing<br />
endangered species.<br />
Airak, in conjunction with <strong>the</strong> Virginia Tech Aquaculture Center (VTAC), is preparing to<br />
validate <strong>the</strong>se newly developed sensors in demanding fish culture settings, starting in<br />
August 2000. Specifically, <strong>the</strong> sensor technologies will be subjected to extremes<br />
concerning temperature, high-suspended solids, and high algal, bacterial, and fungal<br />
content, and <strong>the</strong>ir performance documented.<br />
This paper presents an overview of <strong>the</strong> sensor and system technology, highlights of <strong>the</strong><br />
planned research, expected outcomes based upon existing research, and a synopsis of <strong>the</strong><br />
impact this technology could have on increasing aquaculture production.<br />
1
Intensive Recirculating Aquaculture Facility at <strong>the</strong><br />
Hackettstown State Fish Hatchery<br />
Warren County, New Jersey<br />
Thomas L. Johnson<br />
Senior Fisheries Biologist<br />
FishPro Consulting Engineers & Scientists<br />
5201 South Sixth Street Road<br />
Springfield, Illinois 62703, USA<br />
Phone Number: (217) 585-8333<br />
Fax Number: (217) 585-1890<br />
Email address:tjohnson@FishPro.com<br />
A modern, $2.9 million dollar, three-temperature recirculating aquaculture facility for<br />
coldwater, coolwater and warmwater sport fish production is reviewed and illustrated by<br />
a 35mm slide presentation. The hatchery is located in Hackettstown, NJ is operated by<br />
<strong>the</strong> New Jersey Department of Environmental Protection, Division of Fish, Game and<br />
Wildlife. The facility is enclosed in an 11,000 square foot pre-engineered building that<br />
includes offices, laboratory, crew support, shop, feed storage, fish production area and<br />
process water treatment/recirculation system. Fish rearing units include 16 linear<br />
fiberglass raceways, 10 circular tanks, McDonald jar and vertical flow egg incubation<br />
systems with a combined volume of 92 cubic meters. The 9,800 lpm recirculation<br />
system, which includes two 40-micron rotary drum microscreens, two air-driven rotary<br />
biological contactors (RBC’s), low-pressure ultraviolet disinfection units, high efficiency<br />
natural gas boilers interfaced with two-stage flat-plate heat exchangers, variable speed<br />
water pumps and oxygen-based aeration/degassing are discussed. The recirculation<br />
system is a Semi-Recirculating Aquaculture System (SRAS) and utilizes variable (1% to<br />
10%) percent of <strong>the</strong> recirculating flow rate make-up water addition combined with heat<br />
recovery/heat exchanging technology. Process monitoring and alarm functions are<br />
provided by a programmable logic controller (PLC)-based system. System design criteria<br />
and cost data for this integrated, multi-species facility are presented. A brief overview of<br />
<strong>the</strong> planning, design, engineering, construction and operational phases of project are<br />
included.<br />
1
The Vic Thomas Striped Bass Hatchery at<br />
Brookneal, Virginia<br />
Thomas L. Johnson<br />
Senior Fisheries Biologist<br />
FishPro Consulting Engineers & Scientists<br />
5201 South Sixth Street Road<br />
Springfield, Illinois 62703, USA<br />
Phone Number: (217) 585-8333<br />
Fax Number: (217) 585-1890<br />
Email address:tjohnson@FishPro.com<br />
A modern, $2.1 million dollar, 6,900 square foot aquaculture facility operated by <strong>the</strong><br />
Virginia Department of Game and Inland Fisheries for production of striped bass and<br />
hybrids will be reviewed and illustrated by a 35mm slide presentation. The hatchery<br />
water supply includes a 5,300 lpm Staunton River water pump station and screened river<br />
intake. The intake includes an debris air-burst and water jetting system for management<br />
of river bed alluvial material. The process water treatment system includes pressure<br />
media filters, high efficiency propane-fired boilers interfaced with two-stage heat<br />
exchangers, low-pressure ultraviolet disinfection units and liquid oxygen-based<br />
aeration/degassing components. Fish rearing units include circular fiberglass tanks for<br />
adult holding and spawning, McDonald jar egg incubation and rectangular fiberglass<br />
early rearing tanks with a combined indoor rearing unit volume of 45 cubic meters. In<br />
addition to direct flow through operation with heat recovery, <strong>the</strong> hatchery can operate in a<br />
semi-recirculation based mode with 2,000 lpm flow capacity that includes <strong>the</strong> use of a 40<br />
micron drum microscreen, air-driven rotary biological contactor (RBC), variable speed<br />
water pumps and <strong>the</strong> previously described water heating and aeration components.<br />
Intensive Phase 2 striped bass production is provided by four outdoor 5.8-meter diameter<br />
stainless steel circular tanks with a total volume of 89 cubic meters. Also located<br />
adjacent to <strong>the</strong> aquaculture building are two multi-temperature linear concrete raceways<br />
(volume 20 cubic meters) used to hold of pond reared striped bass fingerlings prior to<br />
stocking. System design criteria and cost data for this facility are presented. A brief<br />
overview of <strong>the</strong> planning, design engineering, construction and operational phases of <strong>the</strong><br />
project are also discussed.<br />
1
Abstract<br />
Use of a Recirculating Aquaculture System to Hold<br />
Sacramento Splittail and Native Fish Species<br />
Louis A. Helfrich<br />
Department of Fisheries and Wildlife Sciences<br />
Virginia Polytechnic Institute and State University<br />
Blacksburg, Virginia 24061, USA<br />
Brent Bridges, Lloyd Hess, and Don Ferris<br />
U.S. Bureau of Reclamation<br />
Tracy Fish Collection Facility<br />
Tracy, California<br />
Diana L. Weigmann, and Charles Liston<br />
U.S. Bureau of Reclamation<br />
Denver Technical Services Center<br />
Denver, Colorado 80225, USA<br />
A recirculating aquaculture system was developed to hold native fishes for experimental<br />
pumping trails at <strong>the</strong> U.S. Bureau of Reclamation’s Tracy Fish Collection Facility<br />
(TFCF), Sacramento-San Joaquin Delta, California. The TFCF operates to prevent <strong>the</strong><br />
entrainment of juvenile and adult fishes, including endangered species, into <strong>the</strong> Delta<br />
Mendota Canal. TFCF uses louvers to direct into <strong>the</strong> collection facility where <strong>the</strong>y are<br />
held in tanks, identified, measured, and <strong>the</strong>n transported and stocked at selected sites into<br />
Delta daily. A high diversity (52 species) and large numbers (2-23 million) fish are<br />
salvaged annually from over 2.5 billion cubic meters of water exported to <strong>the</strong> canal.<br />
From <strong>the</strong>se wild fish, <strong>the</strong> Sacramento splittail (Pogonichthys macrolepidotus) a<br />
threatened species, was selected and held in <strong>the</strong> recirculation system for 6 months prior to<br />
pumping trials. The recirculation system consisted of two sets of six tanks (235 gal/tank)<br />
each set with a biofilter, swirl separator, ultraviolet filter, and oxygen injection. After six<br />
months, splittail were randomly assigned to control or treatment groups and used to<br />
examine <strong>the</strong> efficacy of an experimental fish-friendly. Fish in <strong>the</strong> control group were<br />
used to characterize overall effects of <strong>the</strong> recirculating aquaculture system. Wild splittail<br />
exhibited rapid acclimation to <strong>the</strong> system and artificial feed, fast growth, high survival<br />
(>95%), and good condition (minimal scale loss, abrasion, and abnormalities to skin,<br />
eyes, head, and fins). Experimental fish were used to examine <strong>the</strong> effect of a Hidrostal<br />
pump to move large volumes of water and a diversity of fish species and sizes. At<br />
optimum discharge and velocity, fish mortality, descaling, and injury rates were minimal<br />
after pump passage.<br />
1
Introduction<br />
In <strong>the</strong> Central Valley of California, <strong>the</strong> Sacramento River flowing from <strong>the</strong> north and San<br />
Joaquin River flowing from <strong>the</strong> south converge to form <strong>the</strong> Sacramento-San Joaquin<br />
Delta. Once a large complex area of natural wetlands, bays, and meandering river<br />
channels, <strong>the</strong> Delta has been extensively modified by levees and canals to permit water<br />
export. In <strong>the</strong> Delta, <strong>the</strong> Tracy Pumping Plant (TPP) and its associated Tracy Fish<br />
Collection Facility (TFCF), operated by <strong>the</strong> U.S. Bureau of Reclamation, exports over 2.5<br />
billion cubic meters of water per year at a rate near 4,000 cfs into <strong>the</strong> Delta Mendota<br />
Canal for irrigation, municipal, and industrial needs.<br />
The TFCF operates to “salvage” juvenile and adult sport and non-game fish such as<br />
striped bass (Morone saxitilis) and Delta smelt (Hypomesus transpacificus), which<br />
inhabit <strong>the</strong> San Joaquin and Sacramento rivers, by preventing <strong>the</strong>ir entrainment into <strong>the</strong><br />
Delta Mendota Canal. Small planktonic organisms and fish eggs and larvae are incapable<br />
of avoidance behavior. At <strong>the</strong> canal intake, fish are intercepted and directed by louvers<br />
(vertical slats) into a bypass-collection system where <strong>the</strong>y are held in tanks, identified,<br />
measured, and transported and stocked at selected sites back into <strong>the</strong> Delta. Released fish<br />
are considered “salvaged” because <strong>the</strong>y represent those saved from export into <strong>the</strong> Delta<br />
Mendota Canal, a source of irrigation and domestic water supply for central and sou<strong>the</strong>rn<br />
California.<br />
The TFCF fish salvage effort is one of <strong>the</strong> largest, most intensive, and most consistent<br />
long-term fisheries monitoring efforts nationwide. Over <strong>the</strong> past 40 years, large numbers<br />
(2-23 million fish per year) have been salvaged, providing a wealth of information on<br />
species assemblages, relative abundances, size distributions, and seasonal movement of<br />
fish in <strong>the</strong> Delta. The Tracy Aquaculture Center (TAC) was constructed to assist in fish<br />
salvage and conservation activities in <strong>the</strong> Delta. TAC was built to hold and supply<br />
experimental fish necessary for research projects focused on fish transport (trucking<br />
protocol), and fish-friendly pump development. The facility was intended to provide a<br />
year-round supply of robust, disease-free experimental fish, especially Delta species of<br />
special concern such as <strong>the</strong> Sacramento splittail. Healthy experimental fish are essential<br />
to support research projects focused on fish collection (louver and screen efficiency),<br />
fish-friendly pumps, and fish transport and survival over a range of seasonal<br />
environmental conditions. Providing healthy fish reared under optimal environmental<br />
conditions will exclude fish health and acclimation concerns as major experimental<br />
variables.<br />
The purposes of this study were to characterize: (1) <strong>the</strong> recirculation aquaculture<br />
developed at <strong>the</strong> Tracy Aquaculture Center, (2) to describe <strong>the</strong> survival and condition of<br />
native fish species held at <strong>the</strong> facility and (3) to assess survival and condition of <strong>the</strong><br />
experimental fish held in <strong>the</strong> recirculation system to be used in Hidrostal pumping trials.<br />
2
System Description and Methods<br />
TAC consists of a 1,040 square foot metal frame building housing two recirculation<br />
aquaculture systems and one flow-through system. Each recirculation system contains a<br />
swirl separator (hydrocyclone, 32” dia. x 52 h”) for <strong>the</strong> removal of settelable solid waste<br />
particles, an upflow biofilter with honey-comb design of hard plastic media bed for <strong>the</strong><br />
detoxification of ammonia via nitrification, an ultraviolet filter for sterilization and<br />
pathogen control, an oxygenation system (AirSep), an emergency bottled oxygen system,<br />
a air blower system, a 1 hp pump for water circulation, and a series of growing tanks. An<br />
automatic phone alarm system (ISACC-Phonetics) verifies water flow, water and air<br />
pressure, and electricity.<br />
Well water was supplied to reduce <strong>the</strong> need for settling <strong>the</strong> high suspended (colloidal)<br />
humic (peat) loads and, to cool and disinfect raw canal (Delta) water. The current three<br />
wells have a total capacity of 160 gpm serving each system at a maximum capacity of 40<br />
gpm. The initial single well system did not provide adequate water supply, <strong>the</strong>reby<br />
requiring recirculation systems. Ground water was pumped to an elevated 1,500 gallon<br />
reservoir tank and gravity-fed to both recirculation and <strong>the</strong> flow-through systems. High<br />
carbon dioxide (120% saturation) required <strong>the</strong> incorporation of a stripping column<br />
(bioballs) between <strong>the</strong> reservoir tank and <strong>the</strong> water well.<br />
System I consisted of five large-capacity tanks (367 gal each, 1,835 gal system capacity).<br />
System II consists of six tanks (235 gal each, 1,410 gal system capacity). Maximum<br />
recirculation holding capacity is approximately 3,000 pounds of fish. The flow-through<br />
system consisted of six tanks (1,200 gal total). The facility design comprised of a<br />
number of relatively small tanks allowed for <strong>the</strong> ability to hold a variety of species and<br />
densities of test fish. Recirculation system flow rates average 8, 6.5, and 5 gpm in <strong>the</strong><br />
three systems, respecitively, and resulted in turnover times of approximately 1 and 2 hr<br />
each for <strong>the</strong> small and large tanks, respectively, or 12 to 24 water replacements per tank<br />
per day. Four outdoor tanks (235 gal) provide additional capacity to hold and acclimate<br />
fish to ambient surface water quality, light, and water temperature regimes.<br />
Settleable solids were managed with a swirl separator (hydrocyclone cone) designed into<br />
<strong>the</strong> lower part of <strong>the</strong> biofilter tank. The swirl separator is flushed and backwashed daily.<br />
Influent water from <strong>the</strong> fish tanks enters <strong>the</strong> hydrocyclone tangentially resulting in a<br />
swirling (centrifuge-like) motion forcing suspended particles to settle toward <strong>the</strong> wall and<br />
bottom of <strong>the</strong> tank where <strong>the</strong>y can be periodically flushed into <strong>the</strong> waste water system.<br />
The effectiveness of <strong>the</strong> swirl separator depends on <strong>the</strong> amount of centrifugal force,<br />
particle density, particle mass, and o<strong>the</strong>r variables. Swirled water with most solids<br />
removed upflows into <strong>the</strong> biofilter media. The swirl separator was designed to remove<br />
80-95% of <strong>the</strong> solids in one pass, but this was not evaluated and likely was not achieved.<br />
The separator is located directly at <strong>the</strong> end of <strong>the</strong> drain line, minimizing fractionation of<br />
solids. Solids large and intact are removed efficiently, diminishing organic loads.<br />
Secondary solids removal was by tube clarification in <strong>the</strong> biofilers.<br />
3
Each of <strong>the</strong> two recirculation systems were fitted with one Nova Culture biofilter module<br />
(Mark 11-30) purchased from Aquacare Environment, Inc., Bellingham, Washington.<br />
This biofilter was designed to support moderate fish densities in relatively high water<br />
quality. The submerged upflow biofilters have a honeycomb design with overall<br />
dimensions of 0.76 m (30”) in diameter by 0.48 m (l9”) in height, providing a filter<br />
volume of 0.22m 3 and a specific surface area of 106 m 2 .<br />
The biofilter capacity is rated at 0.28 g TAN per day per m 2 at 10C, suggesting that <strong>the</strong><br />
filter can process about 30 g of TAN per day or 1 kg of feed (typically requiring 100 m 2<br />
of nitrifying surface) or 100 kg fish fed at 1% body weight per day. The biofilter media<br />
can be periodically backflushed to remove particulates or can be removed from <strong>the</strong><br />
biofilter tank for more complete cleaning when necessary. At times we stocked some<br />
fish at <strong>the</strong> top of <strong>the</strong> biofilter to consume organics. An in-line particle filter placed after<br />
<strong>the</strong> biofilter was used to remove fine suspended solids. Removable biofilter media<br />
allowed for convenient fish disease treatment in <strong>the</strong> system without compromising <strong>the</strong><br />
efficiency of nitrifying bacteria. The Nova Culture Filter used has not been fully<br />
evaluated hydrologically or biologically.<br />
Fish were fed by belt feeders on a continuous basis for 10 hours throughout <strong>the</strong> day using<br />
Silvercup brand crumbles and pellets (2-8 mm) depending on <strong>the</strong> size and species.<br />
Theraputics consisted of salt (8 ppt), formalin (80-100 ppm), and nitrofurazone (10 ppm)<br />
when required.<br />
Fish survival, descaling, and injury rates were evaluated monthly for those splittail<br />
and chinook salmon randomly selected as quality control fish from <strong>the</strong> recirculation<br />
systems. Quality control fish were subsequently compared for descaling and<br />
physical injury to those selected for use as controls and treatment fish in <strong>the</strong><br />
pumping trials. For descaling analyses, 100% of <strong>the</strong> total scaled body surface was<br />
microscopically examined and scale loss (% of body) was estimated according<br />
Kostecki et al. (1987). Body injury rates (% fish) were used to enumerate any<br />
abnormalities, abrasions, or distortions occurring to <strong>the</strong> head, eyes, skin, and fins.<br />
Results and Discussion<br />
The recirculation systems were designed to hold a variety of fish species and sizes, both<br />
warm- and cold-water, freshwater and brackish species, in good condition and adequate<br />
numbers (relatively low density compared to commercial aquaculture operations) to<br />
provide test fish for experiments. In addition to Sacramento splittail and chinook<br />
salmon, <strong>the</strong> primary experimental fishes, o<strong>the</strong>rs including striped bass, Morone saxitilis<br />
Delta smelt, Hypomesus transpacificus white catfish, Ictalurus catus, American shad,<br />
Alosa sapidissima, Threadfin shad, Dorosoma petenense Steelhead, Oncorhynchus<br />
mykiss, channel catfish, Ictalurus punctatus , bluegill, Lepomis macrochirus, and white<br />
sturgeon were held with high survival (>90%) in <strong>the</strong>se recirculating systems.<br />
Sacramento splittail, a threatened native species, and juvenile Fall-run chinook<br />
salmon, exhibited good growth and survival throughout <strong>the</strong> year-long testing. Adult<br />
4
splittail were collected from <strong>the</strong> Delta during <strong>the</strong> summer l998 and held until<br />
completion of <strong>the</strong> 1999 summer trials in <strong>the</strong> Tracy Aquaculture Facility. Mean<br />
lengths (TL) of splittail during <strong>the</strong> pump study (December 1998 to July 1999)<br />
increased from 83 to 107mm and those of juvenile Fall-run chinook salmon obtained<br />
from <strong>the</strong> hatchery Mokelmumne River Hatchery, increased from 44 to 97mm in<br />
February and May, respectively. Growth was relatively good considering that <strong>the</strong>se<br />
fish were held on a maintenance diet (< 1% body weight).<br />
Descaling rates for splittail and chinook salmon (Table 1) were low, averaging 1.9<br />
and 2.4% of <strong>the</strong> body, respectively. Comparisons among quality control (handling<br />
effect), control (no pump passage) indicated no effect on descaling for ei<strong>the</strong>r splittail<br />
or chinook salmon. Scale loss was in both species, and generally increased at warmer<br />
water temperatures.<br />
Table 1. Descaling (% body) and injury analysis (% fish) for quality control<br />
(recirculation system) groups of splittail and chinook salmon at Tracy Pumping Plant,<br />
California.<br />
Fish Descalin<br />
g<br />
Body Injury (% fish)<br />
Month (N) (% body)<br />
Group<br />
Splittail:<br />
Head Eyes Skin Fins<br />
Quality<br />
Control<br />
Dec. 40 1.4 20 55 2.5 53<br />
Quality<br />
Control<br />
Feb. 36 3.1 0 3 0 31<br />
Quality<br />
Control<br />
March 32 1.4 0 6 0 9<br />
Quality<br />
Control<br />
April 44 1.1 0 0 0 0<br />
Quality<br />
Control<br />
May 40 1.6 0 0 0 0.2<br />
Quality<br />
Control<br />
June 50 3.9 0 5 0 7<br />
Quality<br />
Control<br />
July 40 2.4 0 0.3 0 0.1<br />
Chinook Salmon:<br />
Quality<br />
Control<br />
Feb. 28 0.1 14 0 4 4<br />
Quality<br />
Control<br />
March 38 0.3 0 0 0 18<br />
Quality<br />
Control<br />
April 44 0.7 0 0 0 0<br />
Quality<br />
Control<br />
May 40 4 0 0 0 0<br />
5
Body injury rates (% of fish) to <strong>the</strong> head, eyes, skin, and fins of splittail and chinook<br />
salmon were relatively low did not differ between groups. The relatively high injury<br />
rate exhibited by splittail in our first pump trial in December occurred was related to<br />
nitrogen supersaturation in <strong>the</strong> holding tanks prior to pump experiments, but <strong>the</strong>se<br />
were unrelated to <strong>the</strong> recirculation aquaculture systems.<br />
This recirculation system was relatively simple to operate, offered low capitol and<br />
operational costs, and proved efficient in reducing water usage and holding sensitive fish<br />
species for experimental purposes. It was designed to support moderate fish densities by<br />
providing relatively good water quality and appeared to function well in this respect.<br />
Acknowledgements<br />
We greatly appreciate <strong>the</strong> assistance and sound advice from Cal McNabb, Sandy<br />
Borthwick, Harry Westers, Herb Ng, Ray Bark, Tom LaCass, Judy Lyons, Cathy Karp,<br />
and o<strong>the</strong>rs who contributed to this project.<br />
References<br />
Kostecki, P. T., P. Clifford, S. P. Gloss, and J. C. Carlisle. 1987. “Scale loss and<br />
survival in smolts of Atlantic salmon (Salmo solar) after turbine passage.”<br />
Canadian Journal of Fisheries and Aquatic Science 44:210-214.<br />
6
Abstract<br />
Recirculating Aquaculture Systems in Australia:<br />
A Syn<strong>the</strong>sis of Systems, Species, and <strong>the</strong><br />
Networking Approach<br />
Brendan Larkin<br />
Aquaculture Extension Officer<br />
Marine and Freshwater Resources Institute<br />
Private Bag 20<br />
Alexandra<br />
Victoria 3714<br />
Australia<br />
Telephone: +61 3 5774 2208 facsimile: +61 3 5774 2659<br />
E-mail: brendan.larkin@nre.vic.gov.au<br />
Interest in recirculating aquaculture systems in Australia is growing. All states have<br />
experienced increased numbers of developments over <strong>the</strong> last few years. Systems range<br />
in value from $US3,000 to more than $US1,200,000, and in production capacity from 1<br />
tonne per annum to more than 250 tonnes per annum. Some of <strong>the</strong> issues facing new and<br />
existing operators of recirculating aquaculture systems in Australia include; system<br />
design and function that may be idiosyncratic to particular Australian species, a lack of<br />
operators with fish husbandry experience, a lack of baseline water quality requirements<br />
of native Australian finfish, and <strong>the</strong> question of <strong>the</strong> economic viability of systems in a<br />
country with high wage and cost structures. Species currently being farmed with<br />
promising results in recirculating aquaculture systems in Australia include Atlantic<br />
salmon, Barcoo grunter, barramundi, Murray cod, and eels. Several o<strong>the</strong>r species are at<br />
<strong>the</strong> experimental and pilot stage of industry development and showing varying degrees of<br />
potential for intensive tank culture. Networks of growers have formed an integral part of<br />
successful farming, both in terms of increasing <strong>the</strong> information flow between all<br />
concerned, and for helping new proponents enter recirculating aquaculture developments.<br />
The networking approach to information flow for existing producers and suppliers, and to<br />
aiding <strong>the</strong> approval process for new proponents of recirculating aquaculture systems is<br />
discussed, and case studies presented.<br />
1 Introduction<br />
In common with many o<strong>the</strong>r countries, Australia is experiencing a boom in private<br />
aquaculture investment, due in part to increasing recognition and support for<br />
development by Government. The private sector is also demonstrating increasing<br />
investment confidence, driven by increasing demand for seafood and falling prices for<br />
traditional farm commodities in developed countries.<br />
While enthusiasm for industry development remains high in Australia, some aquaculture<br />
investment is fraught with danger for <strong>the</strong> uninitiated. A combination of unrealistic<br />
1
usiness expectations and limited technical and business planning skills can result in poor<br />
investment decisions. There is also recognition that Australian production and labour<br />
costs are too high to compete on <strong>the</strong> world stage with nations producing fish as a cheap<br />
source of protein. These countries usually have wage and cost structures far below<br />
Australia’s. As in many o<strong>the</strong>r agribusiness sectors, <strong>the</strong> identification and management of<br />
risk is critical to distinguishing success from failure. This is particularly <strong>the</strong> case with<br />
Recirculating Aquaculture Systems (RAS), which represent relatively new technology,<br />
with a wide variation in system design and quality. The technology offers <strong>the</strong><br />
aquaculturist relative independence from <strong>the</strong> external environment, providing a basis for<br />
improved risk management. The trade off is an increased dependence on technology and<br />
<strong>the</strong> expertise to manage it. There are various advantages of RAS cited by proponents.<br />
The compact nature of <strong>the</strong> systems enables <strong>the</strong> centres of high production intensities to be<br />
located close to larger markets or cities. There is a higher degree of control of <strong>the</strong><br />
environment in which <strong>the</strong> crop is being grown, <strong>the</strong>reby enabling <strong>the</strong> culture of warmwater<br />
species in a cold environment or vice-versa. This is particularly important in Victoria<br />
and o<strong>the</strong>r sou<strong>the</strong>rn states of Australia, where <strong>the</strong> climate does not lend itself to high levels<br />
of production in every season.<br />
Recognising <strong>the</strong> key imperatives of <strong>the</strong> Australian aquaculture industry, toge<strong>the</strong>r with<br />
potential for RAS in Australia has resulted in products targeted at <strong>the</strong> premium price and<br />
quality end of <strong>the</strong> market. Several new (with respect to aquaculture) and exciting species<br />
are farmed in fully enclosed RAS systems, fetching prices between $US8.40/kg and<br />
$US21.00/kg on both <strong>the</strong> domestic and international markets. A general description of<br />
systems, numbers, sizes, and species produced in Australia is presented in Section 2<br />
Categories of RAS and <strong>the</strong> Australian experience. A description of some of <strong>the</strong> attributes<br />
and requirements of some of <strong>the</strong>se unique Australian species is presented in section 3<br />
Species currently being farmed in RAS.<br />
In response to <strong>the</strong> management needs of this new and developing aquaculture sector<br />
Fisheries Victoria 1 and Marine and Freshwater Resources Institute 2 (MAFRI) has<br />
established Vic-RAS-Net (Victorian Recirculating Aquaculture Systems Network) to<br />
facilitate best practice development of small and large-scale RAS ventures. Vic-RAS-<br />
Net commenced in 1998, with four dedicated and several informal meetings to date. The<br />
success of <strong>the</strong> network has seen several o<strong>the</strong>r states in Australia adopt similar networking<br />
models. Two conceptual models for RAS industry development based on Australian and<br />
Vic-RAS-Net experiences are presented in section 4 Networking of RAS operators in<br />
Australia.<br />
For <strong>the</strong> purposes of this paper RAS refers to commercial production units producing fish<br />
flesh and juveniles eventually targeted for human consumption. Some RAS found in<br />
Australia have not been included in this discussion as <strong>the</strong>ir purpose is generally more as a<br />
hobby for <strong>the</strong> proponent, or utilised as a holding system for a variety of species not<br />
1<br />
Fisheries Victoria is <strong>the</strong> organisation legislated responsible for management of <strong>the</strong> Victoria’s fisheries<br />
resources<br />
2<br />
Marine and Freshwater Resources Institute is <strong>the</strong> fisheries research arm of <strong>the</strong> Department of Natural<br />
Resources and Environment, with its main client being Fisheries Victoria.<br />
2
cultured solely within <strong>the</strong> system. These RAS are generally smaller, less sophisticated,<br />
carry lower densities or weights of fish than commercially viable mainstream RAS, and<br />
are established for a variety of purposes including:<br />
• Holding facilities for wild caught species such as rock lobster and abalone<br />
• Holding systems for seafood retailers and restaurants<br />
• Back yard facilities for ornamental breeders and holders<br />
2 Categories of RAS and <strong>the</strong> Australian experience<br />
A recent literature search for information published since 1985 regarding RAS in<br />
Australia resulted in over 50 references. The nature of RAS systems and control <strong>the</strong>y<br />
provide for <strong>the</strong> operator open <strong>the</strong> door to a variety of species (often within a single unit),<br />
which may or may not be endemic to <strong>the</strong> region in which <strong>the</strong>y are being cultured.<br />
Fur<strong>the</strong>rmore <strong>the</strong> nature of RAS enables quarantine of a sufficient level for<br />
experimentation on aspects of biology such as hybridisation between species and subspecies,<br />
and associated potential improved growth rates and conversion ratios to be<br />
investigated with relative safety compared to open systems, where biological integrity to<br />
<strong>the</strong> surrounding environment may not be assured.<br />
Many different RAS are offered for sale within Australia, but <strong>the</strong>re are very few that<br />
could be considered tried and tested. Sometimes promoters are just naive, even though<br />
<strong>the</strong>y are quite committed to seeing <strong>the</strong>m work, however <strong>the</strong>y do not have <strong>the</strong> experience<br />
or training to make <strong>the</strong> RAS work (O'Sullivan 2000, in press). Within Australia RAS fall<br />
within two broad categories based on cost, <strong>the</strong>y are:<br />
• Small rudimentary systems varying in cost from $US3,000 to $US30,000. These<br />
systems may be installed (and sometimes serviced) by commercial turnkey suppliers,<br />
or made by <strong>the</strong> proponents <strong>the</strong>mselves. Low cost, small-scale entry into RAS in<br />
Australia is a recognised means of limiting financial exposure while gaining valuable<br />
experience in management. This approach is widespread but it can lead to complex<br />
retrofitting of equipment, higher production risk margins, technological shortcuts that<br />
may be costly in <strong>the</strong> medium to long term and an overall lack of economic viability.<br />
• Commercially available systems may be imported, or made in Australia. These<br />
systems vary in cost from $US12,000 to more than $US1,200,000. The success or<br />
failure of most of <strong>the</strong>se systems is typically commensurate with <strong>the</strong> cost. That is, <strong>the</strong><br />
more expensive systems purchased from reputable suppliers are generally proving<br />
successful, both in terms of fish growth, and economic viability.<br />
While <strong>the</strong>re may be a cost incentive to add or subtract from established recirculating<br />
system designs for Australian species, in practice this must be considered carefully.<br />
Water reuse systems involve complex water chemistry in a finely tuned balance, and<br />
deviation from proven designs increases risks significantly. Some system suppliers from<br />
overseas are now altering components within systems to allow for <strong>the</strong> special<br />
requirements of native Australian species. For example, <strong>the</strong> tanks in a Dutch RAS<br />
primarily designed for eels (Anguillid spp) have now been altered to accommodate <strong>the</strong><br />
3
needs of <strong>the</strong> endemic Murray-Darling finfish Murray cod (Maccullochella peelii peelii).<br />
These fish require high-density conditions (>~10kg/m 3 ), to alleviate o<strong>the</strong>rwise natural<br />
territorial behaviour. Instead of two different sized tanks (2m 3 and 10m 3 ) in <strong>the</strong><br />
conventional eels system <strong>the</strong> Dutch RAS now accommodates at least four different sized<br />
tanks (ranging from 1.5m 3 to 10m 3 ) in <strong>the</strong> same capacity of systems which have recently<br />
been built. This enables sufficient crowding of fish after grading or an increase in tank<br />
size (both operations effectively reduce density within tanks), <strong>the</strong>reby reducing<br />
mortalities and stress related to low stocking densities.<br />
Recent experience with small and large-scale operations in Australia has highlighted a<br />
number of key investment issues that need to be considered prior to investing in RAS<br />
technology. These include:<br />
Fish husbandry skills.<br />
There is currently a real shortage of people able to operate RAS systems proficiently.<br />
There are currently more than 30 registered training organisations and institutions in<br />
Australia, some of which have teaching modules relating directly to RAS, however it is<br />
recognised <strong>the</strong>re is no replacement for hands on experience.<br />
Water quality maintenance.<br />
Optimal water quality requirements for species previously farmed in RAS in o<strong>the</strong>r<br />
countries (such as eels and tilapia), appear to be similar, but are largely undetermined for<br />
most Australian native finfish.<br />
System design and function.<br />
Some RAS have been adapted from European or British systems designed to farm such<br />
species as Anguilla anguilla (European eel) and tilapia to successfully farm Australian<br />
native species of finfish. This process is ongoing, and continual refinements have already<br />
seen marked improvements in husbandry and economic performances in RAS.<br />
Farm viability.<br />
The commercial history of RAS in Australia may be described as sketchy at best.<br />
However some excellent software packages have been developed to aid proponents make<br />
a more informed business decision before investing. One of <strong>the</strong> greatest problems<br />
associated with RAS is that technical feasibility and economic viability are not<br />
necessarily synonymous. In response to <strong>the</strong>se observations and <strong>the</strong> need for cautious and<br />
informed investment decision-making processes when contemplating RAS, Fisheries<br />
Victoria has developed AQUAFarmer V1.1 3 . In developing AQUAFarmer V1.1<br />
particular attention was focused on generating feasibility reports that reveal <strong>the</strong> critical<br />
link between key bio-economic variables (eg. feed conversion, growth rates, stocking<br />
density) and financial performance. AQUAFarmer V1.1 provides a model or platform<br />
that can be used to run different case studies based on new information input by <strong>the</strong><br />
proponent, resulting in <strong>the</strong> generation of a series of best-case/worst-case scenarios. These<br />
3 For fur<strong>the</strong>r information about AQUAFarmer visit <strong>the</strong> web site at<br />
http://www.nre.vic.gov.au/web/root/domino/cm_da/nrenfaq.nsf/frameset/NRE+Fishing+and+Aquaculture?<br />
OpenDocument<br />
4
scenarios <strong>the</strong>n assist in <strong>the</strong> development and/or fine-tuning of an aquaculture business<br />
plan or feasibility study. As producers intensify <strong>the</strong>ir aquaculture activities, <strong>the</strong> margin<br />
for management error becomes more acute as more intense “biofeedback’s” occur. The<br />
inevitable link between stocking densities, necessary to cover <strong>the</strong> higher fixed and<br />
variable costs associated with all species in RAS must be overlayed on largely unknown<br />
biological requirements of different species in Australia.<br />
3 Species currently being farmed in RAS in Australia<br />
Many species are farmed in intensive RAS systems in Australia, most of which are still in<br />
<strong>the</strong> developmental phase. The number of RAS operations within each state varies from<br />
two in Tasmania to 44 in Queensland (see Table 2). While <strong>the</strong> numbers of farms and<br />
quantities of fish produced are not large on a world scale, <strong>the</strong> variety of species currently<br />
grown, and <strong>the</strong> number of species with potential for farming in RAS highlights <strong>the</strong><br />
significant potential for RAS in Australia. In terms of industry growth in Queensland <strong>the</strong><br />
numbers of RAS operations increased from 37 farms in 1997/98 to 44 in 1998/99, with<br />
similar trends observed in NSW, South Australia, Western Australia and Victoria. Some<br />
of <strong>the</strong> primary commercial species currently being produced and some with potential are<br />
summarised in <strong>the</strong> paragraphs following.<br />
Murray cod<br />
Murray cod is an endemic Murray-Darling finfish, which is highly valued for<br />
recreational, commercial and conservation purposes. It is highly sought after as a table<br />
fish on <strong>the</strong> domestic market (see Figure 1). Murray cod is undisputedly <strong>the</strong> largest<br />
freshwater fish in Australia, with specimens up to 113.5kg (1.8m in length) being<br />
recorded (Merrick and Schmida 1984). Application of recirculation technology to<br />
Murray cod aquaculture is a recently proven method of sustainable commercial<br />
production in Australia. The growth characteristics under culture (see Table 1) and ready<br />
market acceptance of cultured Murray cod make this species a definite candidate for an<br />
expanding and potentially lucrative industry (Ingram 2000).<br />
Barramundi<br />
Among native Australian fishes barramundi (Lates calcarifer) has a national and<br />
international reputation as a splendid sporting fish with good eating qualities.<br />
Barramundi's ready market acceptance and <strong>the</strong> high price it commands make its culture<br />
an attractive proposition (Wingfield 1999; see Table 1). Application of recirculation<br />
technology to barramundi aquaculture is now a proven method of sustainable commercial<br />
production in Australia. Several states within Australia (including Victoria, New South<br />
Wales and South Australia) have adopted policies of risk aversion to enable farming of<br />
barramundi where it is a non-endemic species. These policies include aspects of<br />
quarantine (which may be easily included, or are inherent in RAS), to ensure <strong>the</strong> risk of<br />
escape of biological material to <strong>the</strong> surrounding environment is low.<br />
Anguillid Eels<br />
Of <strong>the</strong> eels commercially produced in Australia, shortfinned eels Anguilla australis (see<br />
Figure 1) form <strong>the</strong> majority of sales, with some longfinned eels Anguilla reinhardtii also<br />
5
sold (Gooley et al. 1999). The distribution of A. reinhardtii extends along <strong>the</strong> east coast<br />
of Australia from 10 0 S to 43 0 S. A. australis has a distribution overlapping with that of<br />
A. reinhardtii, extending from 27 0 S to 44 0 S (Beumer and Sloane 1990). It is apparent<br />
that existing RAS technologies developed for commercially established species such as<br />
Anguilla japonica and Anguilla anguilla are generally adaptable for A. autralis, albeit in<br />
many cases with some degree of refinement and/or o<strong>the</strong>r modification (Gooley et al.<br />
1999). There are currently small quantities of A. australis being produced in Australian<br />
RAS, with a high level of domestic and export market acceptance.<br />
Salmonids<br />
Atlantic salmon, Salmo salar and rainbow trout, Oncorhynchus mykiss are <strong>the</strong><br />
predominant salmonid species produced in RAS in Australia, both in terms of tonnage<br />
and numbers of individuals produced. Atlantic salmon is cultured primarily in Tasmania<br />
where it supports an industry based on marine cage culture. Of <strong>the</strong> 4,500,000 smolts<br />
required for this industry in 1999, 1,500,000 were supplied from smolts produced in<br />
RAS. In 1999 <strong>the</strong> Tasmanian salmon industry produced approximately 10,000 tonnes of<br />
product valued at approximately $US60, 000,000.00 4 . While it is not considered<br />
economically viable to farm rainbow trout in RAS below a wholesale price of<br />
~$US6.00/kg, <strong>the</strong>re has been some niche market growing of trout. These niche markets<br />
primarily take <strong>the</strong> form of supply of advanced fingerlings for pond based rainbow trout<br />
farms. The size of this market is limited, and may only require one or two RAS to supply<br />
<strong>the</strong> expected requirement of approximately 1,000,000 fingerlings.<br />
Silver perch<br />
Silver perch, Bidyanus bidyanus (see Figure 1) is an endemic Murray-Darling finfish<br />
which is currently produced in large numbers in ear<strong>the</strong>n ponds for human consumption<br />
and stock enhancement purposes. Silver perch commonly reach a length of 350 to 400<br />
mm in length and weight of 0.75 to 1.5 kg (Merrick and Schmida 1984). Pond culture of<br />
silver perch currently produces around 300 tonnes of product, with tank culture occurring<br />
in some small RAS. The economic performance of <strong>the</strong>se operations is questionable, as<br />
<strong>the</strong> sale price of silver perch is frequently lower than <strong>the</strong> price economic models suggest<br />
is required to make RAS viable (see Table 1).<br />
Barcoo grunter<br />
A new species currently being trialed on a commercial scale in Australia is Barcoo<br />
grunter Scortum barcoo (see Figure 1). Barcoo grunter, is found naturally widespread in<br />
central and nor<strong>the</strong>rn Australia, and commonly attains a length of 350mm and weight of<br />
400g (Merrick and Schmida 1984). Preliminary results suggest Barcoo grunter is well<br />
accepted as a table fish, with farmed product sold and well accepted on <strong>the</strong> domestic or<br />
export markets. Barcoo grunter thrives in RAS, with high growth rate, and high stocking<br />
densities recorded.<br />
O<strong>the</strong>r species<br />
Many new and emerging aquaculture species are under development in Australia, and are<br />
being grown under experimental or pilot scale commercial conditions. Some of <strong>the</strong>se<br />
4 Personal communication, Harry King, Operations Manager, SALTAS<br />
6
include golden perch (Maquaria ambigua), sleepy cod (Oxyeleotris lineolatus), Snapper,<br />
(Pagrus auratus), black bream (Acanthopagrus butcheri), and sooty grunter (Hephaestus<br />
fuliginosus). The drive for experimental work on <strong>the</strong>se species is commercial, with<br />
higher value species targeted with a goal of future industry growth. Many of <strong>the</strong>se<br />
species appear well suited to culture in RAS, exhibiting high growth rates, good food<br />
conversion ratios (often on sub-optimal diets) and tolerances to a wide range of water<br />
qualities and stocking densities.<br />
4 Networking of RAS operators in Australia<br />
All Australian states tend to operate in a largely independent manner with respect to<br />
government policy for <strong>the</strong> management of fisheries resources. Accordingly, responses or<br />
advice required to deal with RAS development issues may be uncoordinated at best, and<br />
at worst may conflict from one side of <strong>the</strong> States border to ano<strong>the</strong>r. Up until now this has<br />
largely been <strong>the</strong> case with respect to issues associated with RAS component and system<br />
suppliers and general information dissemination associated with RAS. However <strong>the</strong>re are<br />
new developments being undertaken to establish a national network of extension<br />
practitioners. This national network will enable a more coordinated approach to positive<br />
and negative issues associated with RAS, and will help alleviate duplication of resources<br />
from state to state in Australia. Until <strong>the</strong> national network is fully established, each state<br />
is dealing with <strong>the</strong> issues associated with information dissemination largely in isolation.<br />
To assist <strong>the</strong> national network of extension practitioners, aquaculture managers and RAS<br />
proponents, work has commenced on a dedicated register of RAS consultants and to<br />
determine <strong>the</strong> management and technological needs of <strong>the</strong> rapidly developing RAS sector<br />
in Australia. This work commenced following a meeting of experts held to discuss RAS<br />
development issues, held in March 2000, at Marine and Freshwater<br />
Resources Institute, Victoria. Some of <strong>the</strong> perceived needs and strategies to deal with<br />
<strong>the</strong>se issues are presented in Table 3. While this is an on-going process specific<br />
individuals have been given responsibility to act on <strong>the</strong> immediate needs, with time-lines<br />
for completion ranging from two weeks to six months. The improved quality of<br />
information, linkages with o<strong>the</strong>r networks, and training is expected to facilitate <strong>the</strong><br />
responsible orderly and economically viable RAS development in Australia.<br />
The Victorian Experience<br />
Aquaculture is among <strong>the</strong> fastest growing primary industry sectors in Australia averaging<br />
15-18% growth per annum. Over <strong>the</strong> last year <strong>the</strong>re has been an 80% increase in private<br />
investment, predominantly throughout regional Victoria where employment multipliers<br />
of 3:5 are typical for <strong>the</strong> industry. Of <strong>the</strong> culture methods utilised for growout in Victoria<br />
during 1998 RAS produced 30% of <strong>the</strong> warmwater finfish, and 5% of <strong>the</strong> salmonids. The<br />
number of RAS units, and production from RAS in Victoria continues to grow and<br />
represent a significant proportion of <strong>the</strong> state aquaculture production. Victoria has<br />
established a network of RAS practitioners and proponents, and is presented below as an<br />
example of a networking approach to <strong>the</strong>se issues associated with RAS.<br />
7
In response to <strong>the</strong> large levels of interest expressed in RAS, and to reduce failed<br />
investment in RAS in Victoria, <strong>the</strong> Vic-RAS-Net was established. The Vic-RAS-Net<br />
provides a support network for commercial aquaculture proponents, and is seen as an<br />
important focus group for Government and industry. In addition to <strong>the</strong> well-documented<br />
advantages of networks as a whole, <strong>the</strong> Vic-RAS-Net has <strong>the</strong> advantage of increasing<br />
demand for product. There is also potential for integration with o<strong>the</strong>r industries such as<br />
hydroponics, fertiliser production and mainstream agricultural practices.<br />
Since its inception <strong>the</strong> Vic-RAS-Net has been a facilitating mechanism, working within<br />
Victoria but extending also to o<strong>the</strong>r states within Australia and internationally for<br />
information focused on RAS. In January 2000 <strong>the</strong> Vic-RAS-Net consisted of<br />
approximately 200 members. This number had grown from 100 in January 1999, with<br />
several meetings and information days occurring since <strong>the</strong> inaugural meeting in March<br />
1998. These have been well attended by upward of 100 people, consisting mostly of<br />
active RAS users, or individuals or organisations whose involvement is imminent. The<br />
support offered to members of <strong>the</strong> Vic-RAS-Net from o<strong>the</strong>r members is seen as essential,<br />
both in terms of information dissemination and for management in a responsible and<br />
sustainable manner. Vic-RAS-Net support takes various forms, including:<br />
• Direct advice from Vic-RAS-Net members straight to new proponents. This counsel<br />
includes knowledge gained from good and bad practical experiences, and knowledge<br />
gained in communication from o<strong>the</strong>r members.<br />
• The high profile of <strong>the</strong> organisation facilitates a focus point for new and existing<br />
proponents to gain basic and advanced knowledge of all aspects of RAS. The Vic-<br />
RAS-Net is now recognised as an incubator of ideas as well as providing an<br />
expanding knowledge base.<br />
• Both <strong>the</strong> farmer and <strong>the</strong> broader community may obtain realistic economic<br />
information associated with RAS. Product market prices and RAS component prices<br />
and efficiencies are readily available from Vic-RAS-Net members and <strong>the</strong><br />
organisation itself, as it exists as a facilitating organisation.<br />
• Suppliers of components of RAS and turnkey RAS use <strong>the</strong> network as a tool for<br />
gaining valuable feedback on components, systems and system design.<br />
A critical appraisal of two approaches to establishing and running RAS systems in<br />
Australia is presented in Figure 2 and Figure 3. Unfortunately <strong>the</strong>re are still examples of<br />
unsuccessful entries in to <strong>the</strong> RAS sector. The causes of this are many and varied, and<br />
usually involve ignorance by both <strong>the</strong> purchaser and suppliers of services, information,<br />
components or systems. The principal causes include poor advice from inexperienced<br />
consultants, misconceptions of <strong>the</strong> capabilities/requirements of RAS, and undercapitalisation.<br />
The route depicted in Figure 3 is time consuming and unnecessarily<br />
expensive. There have been examples of aquaculture proponents meeting hurdles and<br />
communicating between departments (usually those listed by numbers 3-7, Figure 3) for<br />
several years before establishment of <strong>the</strong> venture. The paths of <strong>the</strong> proponent depicted<br />
under <strong>the</strong> information flow column of Figure 3 are no exaggeration, and on occasion may<br />
be even more convoluted and include more regulatory bodies than those depicted.<br />
8
“One-Stop-Shop”<br />
As part of a regulatory review process held in 1999 a legislative audit was conducted<br />
(ORR 1999). The audit identified eleven pieces of Victorian legislation that have a high<br />
impact on <strong>the</strong> Victorian aquaculture industry. Some of <strong>the</strong> Government bodies affected<br />
by <strong>the</strong>se pieces of legislation include Department of Natural Resources and Environment<br />
(DNRE), Fisheries Victoria, Environment Protection Agency (EPA), Water Authorities,<br />
Local shires, and Catchment Management Authorities (CMAs). Less of <strong>the</strong> largely<br />
unsuccessful approach described in Figure 3 have been undertaken recently. This is<br />
largely due to <strong>the</strong> establishment of a one-stop shop dedicated to guide RAS applicants<br />
through planning and approval processes, and also to good advice given through <strong>the</strong><br />
various auspices of <strong>the</strong> Vic-RAS-Net.<br />
The concept of a one stop shop to guide applicants through <strong>the</strong> maze of processes<br />
involved in planning and approval processes at a local and state level is not a new one<br />
and not limited to <strong>the</strong> fish farming sector. However it has been seen as particularly<br />
important for new developments in aquaculture, due in large part to a lack of knowledge<br />
pertaining to what aquaculture entails.<br />
Within <strong>the</strong> state of Victoria <strong>the</strong> Department of Natural Resources and Environment<br />
(DNRE) is divided into four regions. Fisheries Victoria operates within DNRE and has<br />
adopted a model whereby a person for each of <strong>the</strong> four regions of <strong>the</strong> state is deemed<br />
responsible for new and existing aquaculture proponents to channel all <strong>the</strong> processes and<br />
requirements of planning authorities, and aid <strong>the</strong> aquaculture proponent establish his or<br />
her facility in <strong>the</strong> most expedient manner possible. These people form <strong>the</strong> core of <strong>the</strong> one<br />
stop shop, and have access to knowledge and contacts that enable <strong>the</strong>m to expedite<br />
processes that may o<strong>the</strong>rwise take a lot more effort and time.<br />
Overlaying <strong>the</strong> establishment of <strong>the</strong> one stop shop, <strong>the</strong>re is a growing recognition within<br />
regulatory authorities in Australia that <strong>the</strong>re is a lack of fundamental information<br />
necessary to assess and facilitate growth of aquaculture ventures. Fisheries departments<br />
are continuing <strong>the</strong> drive toward better education for all involved. This education process<br />
includes <strong>the</strong> coordination of meetings and seminars with local authorities, tours of<br />
aquaculture facilities, <strong>the</strong> development of brochures and information leaflets and working<br />
with <strong>the</strong> authorities and aquaculture proponents on a one to one basis through application<br />
and planning processes.<br />
5 Conclusion<br />
Work is continuing to elucidate <strong>the</strong> relevant RAS experience both nationally and at a<br />
global level to ensure <strong>the</strong> adoption of world’s best practice for RAS development in<br />
Australia, and to ensure long term viability of this new and developing sector.<br />
Murray cod, silver perch, Barcoo grunter, trout, salmon and eels all appear to grow well<br />
in recirculating systems. It is up to proponents and prospective proponents to establish<br />
<strong>the</strong> profitability of <strong>the</strong> species, set against <strong>the</strong> cost of establishment and running of <strong>the</strong><br />
system. Many new and existing members of industry appear incapable of marrying<br />
technological capabilities with business aspirations. Sound and objective business<br />
9
planning at <strong>the</strong> outset will, more than any o<strong>the</strong>r factor, determine <strong>the</strong> viability of a RAS<br />
business venture. The development of feasibility studies and business plans are seen as<br />
vital tools toward determining <strong>the</strong> viability of RAS. These plans must link key bioeconomic<br />
variables of <strong>the</strong> wide range of system designs and quality available with <strong>the</strong><br />
financial performance of <strong>the</strong> business. With this in mind AQUAFarmer V1.1 has been<br />
developed by Fisheries Victoria, providing a risk management and financial planning tool<br />
which may be used in <strong>the</strong> development or fine tuning of an aquaculture business plan or<br />
feasibility study.<br />
Experiences gained in <strong>the</strong> establishment and information flow being experienced from<br />
<strong>the</strong> Vic-RAS-Net are flowing to o<strong>the</strong>r states with similar models being adopted, with an<br />
eventual goal to link <strong>the</strong>m on a national level. Warning messages emanating from Vic-<br />
RAS-Net, and mirrored in o<strong>the</strong>r similar networks in Australia to be considered before<br />
investment in RAS include:<br />
• High establishment and running costs require <strong>the</strong> culture of high value species.<br />
• Culture of fish at high densities means high risk.<br />
• Before buying any system or components of a system ask for proponents currently<br />
using it, and consult with <strong>the</strong>m to verify <strong>the</strong> performance<br />
Fisheries Victoria has adopted a strategy of risk management, ra<strong>the</strong>r than risk aversion<br />
under <strong>the</strong> Fisheries Act 1995. This enables <strong>the</strong> deployment of recirculating aquaculture<br />
systems to farm a diverse range of species at various sites with an assorted range of<br />
technologies provided <strong>the</strong> appropriate risk management procedures are in place. With <strong>the</strong><br />
progressive approach adopted by Fisheries Victoria and <strong>the</strong> advent of <strong>the</strong> Vic-RAS-Net,<br />
Victoria is well placed to take a lead role in recirculating aquaculture systems for <strong>the</strong><br />
future.<br />
6 Acknowledgments<br />
The author wishes to thank <strong>the</strong> extension staff and individuals from each Australian State<br />
for <strong>the</strong>ir swift and positive response to requests for information relating to <strong>the</strong>ir states<br />
RAS industry. In particular my thanks go to Phil Read (New South Wales), Millin<br />
Curtis, Max Wingfield and Ross Loebegeiger (Queensland), Tara Ingerson and Geoff<br />
Todd (South Australia), Piers Hart and Harry King (Tasmania), and Dan Machin<br />
(Western Australia).<br />
The author wishes to thank <strong>the</strong> staff at Fisheries Victoria and <strong>the</strong> Marine and Freshwater<br />
Resources Institute, including Anthony Forster, Margaret Brett, Wayne Fulton, Geoff<br />
Gooley, Brett Ingram, and Peter Grant for <strong>the</strong>ir expert advice. My Special<br />
acknowledgment goes to Stuart Vallis for <strong>the</strong> graphic support.<br />
10
7 References<br />
Gooley, G.J., L.J. McKinnon, B.A. Ingram, B. Larkin, R.O. Collins, and S.S. de Silva.<br />
(1999). Assessment of Juvenile Eel Resources in South Eastern Australia and<br />
Associated Development of Intensive Eel Farming for Local Production. Marine<br />
and Freshwater Resources Institute, Alexandra, Australia. 124 pp.<br />
Ingram, B.A. (Ed.) (2000). Murray Cod Aquaculture A Potential Industry for <strong>the</strong> New<br />
Millennium. Proceedings of a Workshop (18th January 2000, Eildon, Vic.).<br />
Marine and Freshwater Resources Institute, Alexandra. 43 pp.<br />
Merrick, J.R., and G.E. Schmida. (1984). Australian Freshwater Fishes, Biology and<br />
Management. John R. Merrick, North Ryde, NSW. 409 pp.<br />
ORR. (1999). Review of Regulatory Arrangements in <strong>the</strong> Victorian Aquaculture<br />
Industry. Discussion Paper. Aquaculture Regulatory Task Force, Office of<br />
Regulation Reform, Melbourne. 63 pp.<br />
O'Sullivan, D. (2000). Advice for Buyers of Recirculating Aquaculture Systems. In<br />
Austasia Aquaculture. Vol. In Press.<br />
Wingfield, M.J. (Ed.) (1999). Proceedings of <strong>the</strong> Australian Barramundi Farming<br />
Workshop, held at Joondoburri Conference Centre, Bribie Island, 12 & 13<br />
August 1999. Department of Primary Industries, Queensland, Walkamin. 61 pp.<br />
11
Table 1 Summaries of selected species performance in RAS systems and market prices in<br />
Australia from 1996-1999<br />
Species Stocking<br />
density (kg/m 3 Sale weight (g) Market price Growth to sale<br />
)<br />
($US/kg) (months)<br />
Atlantic salmon 5-60 60-100 N/A 11-18<br />
Barcoo grunter 30-100 300-1000 7-9 6-18<br />
Barramundi 5-40 300-750 5-8 6-12<br />
Golden perch N/A 300-1000 5-8 N/A<br />
Murray cod 30-100 500-2000 8-18 12-18<br />
Rainbow trout 5-50 50-200 ~6 3-8<br />
Shortfinned eels 100-180 250-750 2-9 12-24<br />
Silver perch 5-30 300-600 4-8 12-24<br />
Table 2 Summaries of RAS information for various Australian states in 1999<br />
Australian<br />
state<br />
Number of<br />
farms<br />
Capacity<br />
(tonnes<br />
produced per<br />
annum)<br />
12<br />
Species<br />
NSW 25 1-25 Murray cod, silver perch, barramundi<br />
Queensland 44 1-250 Barcoo grunter, barramundi, silver perch,<br />
golden perch, sleepy cod, Murray cod.<br />
South<br />
Australia<br />
Western<br />
Australia<br />
30 2-30 Murray cod, barramundi, snapper, silver<br />
perch, black bream.<br />
14 N/A Barramundi, silver perch, sooty grunter,<br />
black bream<br />
Tasmania 2 1,500,000<br />
atlantic salmon<br />
smolts<br />
Atlantic salmon, Rainbow trout.<br />
Victoria 20 1-120 Murray cod, Barcoo grunter, silver perch,<br />
shortfinned eels, barramundi
Table 3 Recirculating Aquaculture Systems Development Issues in Australia<br />
Needs Strategy/actions<br />
Improved<br />
extension<br />
material for<br />
new and<br />
recently<br />
commissioned<br />
proponents of<br />
RAS<br />
Register of<br />
RAS<br />
consultants<br />
Improved<br />
description of<br />
systems<br />
specifications.<br />
Review existing<br />
consultants<br />
accreditation<br />
processes<br />
Develop RAS<br />
stream for<br />
<strong>Sea</strong>food<br />
training<br />
package<br />
1 Prepare an article describing essential components, uses,<br />
specifications, performance data, size requirements, and cost of RAS<br />
systems.<br />
2 Develop a RAS communication strategy. This may take <strong>the</strong> form of:<br />
i The Victorian Recirculation Aquaculture Systems<br />
Network (Vic-RAS-Net)<br />
ii Overseas RAS and o<strong>the</strong>r aquaculture networks<br />
iii Economics models such as AQUAFarmerV1.1<br />
b. Prepare a RAS bibliography which may take <strong>the</strong> form of:<br />
i Hardcopies<br />
ii Internet sites and links to existing sites<br />
c. Identify and describe key performance indicators for RAS<br />
i Identify and document<br />
ii Encourage industry to develop a Code of practice to reflect<br />
“best practice” for RAS<br />
iii Identify and circulate guidelines for <strong>the</strong> preparation of<br />
aquaculture business plans<br />
3 Develop and list relevant criteria for consultants registration process.<br />
a. Implement periodic review process<br />
b. Review o<strong>the</strong>r registration processes<br />
4 List relevant criteria/specification for limiting “performance” of<br />
systems, for example:<br />
i Food in<br />
ii Water quality<br />
iii Water exchange<br />
iv Standing crop<br />
v Referees<br />
b. Advise of training needs and services<br />
5 Promote <strong>the</strong> aquaculture charter within <strong>the</strong> Australian Institute of<br />
Agricultural Science and Technology certified practicing aquaculture<br />
process.<br />
i Consult with DNRE regarding Government accredited<br />
referral processes with input from Victorian Government and<br />
Industry<br />
6 Working group to review draft material<br />
13
a)<br />
Photo courtesy of Neil Armstrong<br />
c)<br />
Photo courtesy Neil Armstrong<br />
e)<br />
Photo courtesy MAFRI<br />
b)<br />
Photo courtesy MAFRI<br />
d)<br />
Photo courtesy Neil Armstrong<br />
f)<br />
Photo courtesy Neil Armstrong<br />
Figure 1 Photographs depicting a) Murray cod, b) shortfinned eel, c) silver perch, d) golden<br />
perch e) barramundi and f) Barcoo grunter.<br />
14
Information<br />
flow<br />
Action Communication<br />
1. Initial concept, approach<br />
Vic-RAS-Net<br />
2. Approach system supplier<br />
or build own system<br />
3. Approach “one stop<br />
shop” facilitators<br />
4. Approach and inform<br />
DNRE, Shire, EPA,<br />
Catchment management<br />
Authorities, Water<br />
Authorities.<br />
5. Engage system<br />
supplier, purchase<br />
land and establish<br />
infrastructure<br />
6. Backup service by system<br />
supplier for equipment,<br />
system and training of<br />
operator. Additional<br />
information supplied<br />
from Vic-RAS-Net<br />
7. Successful, sustainable<br />
growth<br />
15<br />
Vic-RAS-Net advises to look<br />
at different systems, talk to<br />
RAS users and approach one<br />
stop shop facilitators<br />
Develop feasibility and<br />
business plans<br />
One stop shop facilitators<br />
advises of requirements of<br />
regulatory bodies and<br />
probable associated interest<br />
groups.<br />
Supplier and proponent<br />
advise of system requirements<br />
and impacts<br />
Work with one stop shop<br />
facilitators to establish<br />
different options for property<br />
purchase<br />
Figure 2 Entering RAS with Vic-RAS-Net involvement: Successful and rapid involvement in<br />
RAS
Information<br />
flow<br />
1. Initial concept<br />
2. Approach system supplier<br />
or build own system<br />
3. Approach shire<br />
4. Approach DNRE<br />
5. Approach EPA<br />
6. Approach CMA<br />
Action Communication<br />
7. Approach water authority<br />
8. Engage system<br />
supplier, purchase<br />
land and establish<br />
infrastructure<br />
9. Inadequate backup<br />
service by supplier for:<br />
• Equipment<br />
• establishing system<br />
• training of operator<br />
10. Approach Vic-RAS-Net,<br />
extension service for<br />
assistance<br />
11. Members of Vic-RAS-<br />
Net assist with<br />
management advice and<br />
retrospective fitting of<br />
components<br />
12. Successful, sustainable<br />
growth<br />
16<br />
Supplier advises of system<br />
requirements and likely<br />
impacts to environment.<br />
Shire advises of planning<br />
requirements and o<strong>the</strong>r<br />
appropriate bodies to<br />
approach<br />
DNRE advises of<br />
requirements of separate<br />
bodies and statutory acts <strong>the</strong>y<br />
operate within<br />
EPA advises of requirements,<br />
and o<strong>the</strong>r bodies to contact<br />
CMA advises of<br />
requirements, and o<strong>the</strong>r<br />
bodies to contact<br />
Water Authority advises of<br />
requirements, and o<strong>the</strong>r<br />
bodies to contact<br />
Vic-RAS-Net advise of<br />
coordinated approach and<br />
existence of one stop shop<br />
facilitators<br />
Free information flow from<br />
members of Vic-RAS-Net to<br />
new operator, learning<br />
outcomes shared between all<br />
parties involved.<br />
Figure 3 Entering RAS without Vic-RAS-Net involvement: The hard way to enter RAS
Program to Facilitate <strong>the</strong> Preliminary Design of Land-<br />
Based Recirculating Aquaculture Facilities<br />
Terrence McCallum<br />
Masters Student, Recirculating Aquaculture Research Group,<br />
Department of Chemical Engineering, University of New Brunswick<br />
Fredericton, New Brunswick<br />
Canada, E3B 5A3<br />
M. Rifai<br />
Masters Student, Recirculating<br />
Aquaculture Research Group,<br />
University of New Brunswick<br />
Introduction<br />
T. Pugsley<br />
Professor of Chemical Engineering,<br />
Recirculating Aquaculture Research<br />
Group, University of New Brunswick<br />
1<br />
M. Couturier<br />
Professor of Chemical Engineering,<br />
Recirculating Aquaculture Research<br />
Group, University of New Brunswick<br />
Sizing and costing equipment for land-based recirculating aquaculture facilities can be<br />
tedious and time consuming. Through <strong>the</strong> use of a Windows-based computer program,<br />
developed by <strong>the</strong> Recirculating Aquaculture Research Group at <strong>the</strong> University of New<br />
Brunswick, those calculations needed for a typical grow-out facility can be facilitated. This<br />
is a useful tool when trying to explore various operating scenarios of such facilities. This<br />
paper will describe <strong>the</strong> capabilities of this program and <strong>the</strong> typical outputs produced as well<br />
as sample cost breakdowns.<br />
Design Approach<br />
The program is designed to size equipment based on a desired level of annual production.<br />
In order to reduce equipment requirements, a continuous production strategy is employed.<br />
Continuous production is achieved by purchasing a new batch of juveniles or fry every 2<br />
to 4 months. Batches grow in parallel and reach final market size at uniform intervals. The<br />
advantages of this production strategy are that it reducing <strong>the</strong> size and cost of equipment<br />
by avoiding large peaks in biomass and allows for consistent cash flow since product is<br />
sold throughout <strong>the</strong> year.<br />
The preliminary steps performed by <strong>the</strong> program involve <strong>the</strong> determination of <strong>the</strong> growout<br />
period from juvenile or fry to <strong>the</strong> desired market size, <strong>the</strong> number of batches needed to
achieve continuous production, facility biomass, number of fry or juveniles needed per<br />
batch, daily feed requirements, and <strong>the</strong> daily oxygen requirements for fish respiration and<br />
biofiltration. These parameters provide <strong>the</strong> basis for <strong>the</strong> sizing of <strong>the</strong> equipment in a landbased<br />
facility. The layout in Figure 1 shows <strong>the</strong> major unit operations in a recirculating<br />
facility. Each will be discussed in more detail in <strong>the</strong> following section. The requirements<br />
and growth parameters for Atlantic halibut and rainbow trout have so far been included in<br />
<strong>the</strong> database of <strong>the</strong> program.<br />
Figure1: Simplified Land-Based Recirculating Facility Layout<br />
Water Source: Since <strong>the</strong> purity of <strong>the</strong> incoming water is site specific, it is assumed that <strong>the</strong><br />
water from <strong>the</strong> source does not need any treatment before entering <strong>the</strong> facility. Pumping<br />
head from <strong>the</strong> source is needed to determine pumping requirements. A default value of<br />
15m is included. The flow of makeup water is taken to be 4% of <strong>the</strong> facility flow rate (i.e.<br />
recirculating rate of 96%).<br />
Heating: To maintain optimal water temperatures in <strong>the</strong> facility incoming water is ei<strong>the</strong>r<br />
heated or cooled depending on <strong>the</strong> requirements of <strong>the</strong> fish and <strong>the</strong> temperature profile of<br />
<strong>the</strong> water source. A default temperature profile is included and can be modified. The<br />
2
program <strong>the</strong>n calculates <strong>the</strong> peak heating and cooling requirements and <strong>the</strong> annual heating<br />
and cooling requirements. A heat exchanger system is used to recover heat from <strong>the</strong> waste<br />
water to preheat <strong>the</strong> incoming water. The percentage of heat recovery can be modified and<br />
is preset to 75%.<br />
Water Reserve: Consists of a reservoir with a volume equal to 20% of <strong>the</strong> total volume of<br />
<strong>the</strong> tanks in <strong>the</strong> tank field. Water is pumped from <strong>the</strong> reservoir to <strong>the</strong> top of <strong>the</strong> biofilter<br />
and <strong>the</strong>n flow by gravity through <strong>the</strong> tank field and solids removal equipment back to<br />
reservoir.<br />
Water flow rate is based on a user-defined turnover time in <strong>the</strong> tanks. The default value is<br />
80 minutes.<br />
Biofiltration: The program uses fluidized sand biofilters. Media parameters are adjustable<br />
as is <strong>the</strong> diameter of <strong>the</strong> typical unit. The program calculates <strong>the</strong> number of biofilters<br />
needed and <strong>the</strong> volume of media needed to remove <strong>the</strong> ammonia from <strong>the</strong> system.<br />
Degassing and Oxygenation: Degassing is performed using 2m high atmospheric packed<br />
columns. The program calculates <strong>the</strong> number of columns needed and <strong>the</strong> volume of media<br />
for costing purposes. The bulk of <strong>the</strong> oxygenation is performed using a pressurized packed<br />
column. DO trimming to maintain 100% saturation in <strong>the</strong> tanks is achieved through direct<br />
injection of oxygen in <strong>the</strong> tanks using diffusing stones.<br />
Tank Field: The program uses circular tanks, with diameters varying from 2m to 15m.<br />
Calculation of <strong>the</strong> minimum number of tanks of <strong>the</strong> desired size range is performed.<br />
Options to change stocking densities, tank depth, and <strong>the</strong> inclusion of shelves (i.e. for<br />
halibut) are available. The size of <strong>the</strong> building housing <strong>the</strong> tank field is based on <strong>the</strong><br />
surface area covered by <strong>the</strong> tanks.<br />
Solids Removal: This includes swirl separation, drum filtration, and foam fractionation.<br />
These are sized based on <strong>the</strong> flow rate through <strong>the</strong> facility.<br />
Sample Results<br />
Figures 2 and 3 summarize, in <strong>the</strong> form of pie charts, typical results obtained with <strong>the</strong><br />
program. Figure 2 is a capital cost breakdown while Figure 3 is <strong>the</strong> annual operating cost<br />
breakdown of a land-based recirculating farm producing 100 tonnes of halibut annually<br />
from a juvenile size of 5g to a final market size of 2.5 kg.<br />
3
Solids Removal (9.71%)<br />
Electricity (3.64%)<br />
Contingencies (9.23%)<br />
Design (8.39%)<br />
Pumping and Piping (18.37%)<br />
Depreciation (7.18%)<br />
Contingencies (4.76%)<br />
Insurance and Health (4.02%)<br />
Maintenance (1.54%)<br />
Oxygen (3.44%)<br />
Labour (14.07%)<br />
Capital Cost Breakdown<br />
2.5 kg Market Size<br />
Operating Cost Breakdown<br />
2.5 kg Market Size, $5.50 US/ Juvenile<br />
4<br />
Heating (5.62%)<br />
Total Capital Cost of $1,145,000 US<br />
Tank Field (19.14%)<br />
Feed (23.93%)<br />
Juveniles (37.41%)<br />
Total Annual Operating Cost of $770,000 US<br />
Installation Cost (9.63%)<br />
Biofiltration (5.48%)<br />
Degassing and Oxgenation (2.63%)<br />
Land and o<strong>the</strong>r Buildings (11.81%)<br />
Figure 2: Capital Cost Breakdown of Halibut Farm<br />
Figure 3: Annual Operating Cost Breakdown for Halibut Farm
Conclusions<br />
This program is a useful tool for performing <strong>the</strong> preliminary design and economic<br />
evaluation of land-based recirculating facilities. Equipment and raw material requirements<br />
are calculated for <strong>the</strong> desired level of continuous production. This facilitates <strong>the</strong><br />
examination of <strong>the</strong> effect of market size and production level on size and cost of land based<br />
facilities.<br />
Acknowledgements<br />
This project was funded by <strong>the</strong> New Brunswick Department of Fisheries and Aquaculture.<br />
5
The Effect of Fish Biomass and Denitrification on <strong>the</strong><br />
Energy Balance in African Catfish Farms<br />
E.H. Eding 1 , O. Schneider 1 , E.N.J. Ouwerkerk 2 , A. Klapwijk 3 ,<br />
J.A.J. Verreth 1 and A.J.A Aarnink 2<br />
1 Fish Culture and Fisheries Group, Wageningen University and Research centre (WUR),<br />
P.O. Box 338, 6700 AH, Wageningen, <strong>the</strong> Ne<strong>the</strong>rlands<br />
2 IMAG, WUR, Wageningen, The Ne<strong>the</strong>rlands.<br />
3 Environmental Technology, WUR, Wageningen, <strong>the</strong> Ne<strong>the</strong>rlands<br />
Problem: The Dutch aquaculture industry is based on fish production in recirculating<br />
aquaculture systems. Enforced by legislation <strong>the</strong> fish farmers have to reduce <strong>the</strong> waste<br />
discharge and are not allowed to discharge farm effluents on <strong>the</strong> surface waters. The<br />
government expresses waste discharge in inhabitant equivalents (I.E = average daily<br />
waste production of 1 person during 1 year, expressed in g O2 and measured as COD and<br />
Kjeldahl nitrogen) and charges levies between $ 29 and $ 60 per I.E. depending on <strong>the</strong><br />
local water authority. In <strong>the</strong> near future, <strong>the</strong> government will impose stricter effluent and<br />
ground water permits and control procedures, which will force <strong>the</strong> farmers to invest in<br />
additional monitoring equipment and in waste water treatment. The latter may decrease<br />
<strong>the</strong> environmental load of a farm but may increase production costs considerably. Farm<br />
gate prices of African catfish are low and fluctuates around $1.50 per kg fish at an annual<br />
production of ±1000 kg/m 3 tank volume and a water discharge of ± 100 l/kg feed per day.<br />
To create financial space for additional water treatment methods energy and production<br />
costs must be reduced fur<strong>the</strong>r. The incorporation of denitrification may decrease <strong>the</strong><br />
environmental load and energy costs for heating makeup water but can result in a demand<br />
for cooling during summer months.<br />
Objectives: (1) to simulate <strong>the</strong> heat/energy balance of a 'standard' 100 tons catfish farm<br />
and to indicate <strong>the</strong> space for reduction of production costs.; (2) to predict <strong>the</strong> (significant)<br />
heat production of <strong>the</strong> standing stock in <strong>the</strong> total heat balance which for simplification<br />
was assumed to be negligible in a study of Singh and Marsh (1996); (3) to study <strong>the</strong><br />
effect of denitrification (reduction of water, nitrogen and COD discharge) on <strong>the</strong> energy<br />
balance.<br />
Material and methods: Two production system configurations were compared: a<br />
'standard' commercial 100 tons configuration (default situation) and an experimental<br />
configuration incorporating a denitrification unit. These systems were compared for:<br />
a. effluent (make up water, nitrate and organic matter)<br />
b. energy balance (calculated with <strong>the</strong> model ANIPRO, van Ouwerkerk, 1999)<br />
a). Effluent data were collected from a pilot RAS configuration operated and loaded as<br />
under scale up conditions, (3 fish tanks, final biomass ± 280 kg/m 3 , lamella<br />
1
sedimentation, bio-reactor) and (2) and an configuration incorporating a denitrification<br />
unit, (3 fish tanks, drumfilter (60μm), bio-reactor, denitrification reactor (an Upflow<br />
Sludge Blanket reactor). Both systems were identical in biomass stocking and daily feed<br />
load. pH, Conductivity, O2, NH4-N, NO2-N, NO3-N, COD, Dry Matter, Ash, Kjeldahl-N,<br />
NaHCO3, water discharge (volume and composition) and nutrient retention in fish were<br />
measured to produce mass balance criteria for system comparison.<br />
The fish culture module of <strong>the</strong> ANIPRO model developed for <strong>the</strong> EU fish project Blue<br />
label was used to simulate <strong>the</strong> heat balance of both 100 tons system configurations. The<br />
model allows to design energy efficient and cost effective heating and cooling systems<br />
for fish farms in different geographical regions. The calculated heat production in <strong>the</strong><br />
model is based on 1) conversion of feed (heat production from standing stock and water<br />
treatment) 2) pumps, 3) lighting (including UV for disinfecting); heat transmission into<br />
<strong>the</strong> building (especially solar radiation). Heat is lost from <strong>the</strong> system by : 1) ventilation<br />
air (sensible and latent heat); transmission of heat through floor, walls and roof; 3)<br />
makeup water. The indoor and basin temperatures iterate until <strong>the</strong>re is a balance between<br />
heat production and heat loss (Aarnink et al. 2000). The parameters in <strong>the</strong> model have<br />
been obtained from Dutch catfish farmers and were calibrated with on farm<br />
measurements for <strong>the</strong> culture of African catfish.<br />
The number of I.E. per farm is calculated by: Q/136*(COD+4.57 Kjeldahl nitrogen)<br />
(Q=waste waterflow).<br />
2
Marine Denitrification of Denitrifier Consortium<br />
Immobilized in Polyvinyl Alcohol<br />
Sung-Koo Kim<br />
Department of Biotechnology and<br />
Bioengineering Pukyong <strong>National</strong><br />
University, Pusan, 608-737, Korea<br />
Jae-Koan Seo<br />
Department of Biotechnology and<br />
Bioengineering Pukyong <strong>National</strong><br />
University, Pusan, 608-737, Korea<br />
Introduction<br />
1<br />
Eun-Ju Park<br />
Department of Biotechnology and<br />
Bioengineering Pukyong <strong>National</strong><br />
University, Pusan, 608-737, Korea<br />
Kuen-Hack Suh<br />
Department of Chemical Engineering<br />
Pukyong <strong>National</strong> University,<br />
Pusan, 608-737, Korea<br />
Nitrate, <strong>the</strong> end product of biological nitrification, is accumulated unless<br />
denitrification or <strong>the</strong> hydroponic system is connected to <strong>the</strong> water treatment process.<br />
Although nitrate is not generally regarded as an acute toxic compound to fish[1, 8], it<br />
should not be left to accumulate, because phytoplankton blooms, inhibition of<br />
nitrification and toxicity problems eventually occur at certain concentrations of<br />
nitrate[6]. Since <strong>the</strong> 1980s, biological denitrification has been performed using<br />
immobilized cells[4, 5]. However, <strong>the</strong> study on <strong>the</strong> denitrification process into marine<br />
aquacultural systems and aquaria has not been carried out except for denitrification by<br />
gram negative halophilic bacteria reported by Shieh et al.[7]. Therefore, <strong>the</strong><br />
possibility of acclimation from fresh water denitrification to <strong>the</strong> marine system, <strong>the</strong><br />
optimum acclimation method and <strong>the</strong> effect of HRT on marine denitrification were<br />
evaluated by <strong>the</strong> addition of sea water into fresh water denitrification system and total<br />
sea water exchange.<br />
Preparation of denitrifiers immobilized in PVA<br />
The immobilization of denitrifier consortium was carried out using <strong>the</strong> activated<br />
sludge acclimated to <strong>the</strong> denitrifier consortium(JangLim sewage treatment facility,<br />
Pusan, Korea) by feeding nitrate and glucose for 120 days. Immobilized denitrifiers<br />
were prepared by <strong>the</strong> PVA (polyvinyl alcohol)-boric acid method[2]. The experiment<br />
was run by four completely mixed continuous flow reactors. The working volume of<br />
each reactor is 1 L. The feed tank was in a cooling bath of 4 o C to maintain <strong>the</strong><br />
composition of feed solution. To acclimate denitrifier of <strong>the</strong> freshwater system to<br />
seawater, salinity was controlled by diluting seawater. The composition of <strong>the</strong> feed<br />
solution was KNO3 72.2 mg/L, Glucose 66.5 mg/L, Na2HPO4 40 mg/L, and MnSO4 2<br />
mg/L. Reactor 1(R-1) was kept in <strong>the</strong> fresh water denitrification system as <strong>the</strong> control<br />
and <strong>the</strong> salinity of reactor 2~4(R-2~4) were stepwise increased with increased sea<br />
water addition in order to evaluate <strong>the</strong> acclimation characteristics from <strong>the</strong> fresh water<br />
denitrification system to <strong>the</strong> marine system. The nitrate nitrogen loading rate was 20<br />
g/m 3 /day. After <strong>the</strong> marine denitrification system was reached at a steady state, <strong>the</strong>
HRT was reduced from 12 hours to 1 hour to get <strong>the</strong> highest removal rate. The<br />
influent nitrate nitrogen concentration was 3.5 mg/L.<br />
The effect of salinity on <strong>the</strong> denitrification process.<br />
The effect of <strong>the</strong> salinity on <strong>the</strong> denitrification process was evaluated by <strong>the</strong> addition<br />
of sea water. The salinity of <strong>the</strong> raw coastal sea water was about 30 ppt and <strong>the</strong><br />
salinity of each reactor was controlled to 0, 7.5, 15 and 30 ppt for R-1 to 4,<br />
respectively.<br />
Fig. 1(a) shows <strong>the</strong> nitrate nitrogen concentrations of <strong>the</strong> influent and effluent at each<br />
reactor with different salinity levels. The average influent nitrate nitrogen<br />
concentration was 10.3 mg NO3 - -N/L and <strong>the</strong> effluent nitrate nitrogen concentration<br />
was stable from <strong>the</strong> start of <strong>the</strong> operation for <strong>the</strong> control reactor, R-1, and its<br />
concentration was average 1.5 mg NO3 - -N/L. However, <strong>the</strong> reactors containing salt<br />
showed less nitrate nitrogen removal in <strong>the</strong> reactor for 4 days of operation. The<br />
concentrations reached 3.4 mg NO3 - -N/L at a salinity level of 7.5 ppt in R-2, 4.5 mg<br />
NO3 - -N/L at salinity level of 15 ppt in R-3 and 7.2 mg NO3 - -N/L at salinity level of 30<br />
ppt in R-4. Therefore, <strong>the</strong> addition of salt inhibited <strong>the</strong> denitrification reaction at <strong>the</strong><br />
initial operation periods. When salinity was high, <strong>the</strong> inhibition for denitrification was<br />
severe and showed 30% of removal efficiency with sea water. However, effluent<br />
nitrate nitrogen concentrations of all reactors became similar to that of <strong>the</strong> control<br />
reactor after 10 days of operation and <strong>the</strong>y reached 2 mg NO3 - -N/L with a steady state<br />
condition.<br />
Effluent nitrite nitrogen concentration was shown in Fig. 1(b). At <strong>the</strong> control reactor,<br />
R-1, <strong>the</strong> concentration was lower than 0.05 mg NO2 - -N/L without nitrite<br />
accumulation. However, at <strong>the</strong> reactor with a salinity level of 7.5 ppt, <strong>the</strong> nitrite<br />
nitrogen concentration suddenly increased to 0.75 mg/L and was maintained for 15<br />
days of operation and <strong>the</strong>n decreased to lower than 0.05 mg NO2 - -N/L after 18 days of<br />
operation. When <strong>the</strong> salinity level was higher than 15 ppt, <strong>the</strong> nitrite concentrations<br />
were maintained at 0.5 0.75 mg NO2 - -N/L as soon as <strong>the</strong> sea water was added.<br />
According to Wickins[9], nitrite toxicity was more severe than ammonia toxicity in an<br />
intensive fish culture facility, especially in <strong>the</strong> recirculation culturing system. Nitrite<br />
could accumulate in a recirculating system as a result of incomplete bacterial<br />
reduction. Although nitrite is a considerable toxic compound, <strong>the</strong> toxicity of nitrite to<br />
marine and estuarine fish might be low. Therefore, Wickins[9] recommended a<br />
maximum of 1.0 mg NO2 - -N/L in sea water. This indicates that <strong>the</strong> process in this<br />
study is safe for <strong>the</strong> fish because <strong>the</strong> nitrite concentrations were maintained lower than<br />
1.0 mg NO2 - -N/L.<br />
Fig. 1(c) shows that denitritication efficiency was affected by salinity. In <strong>the</strong> early<br />
stage of <strong>the</strong> operation, when <strong>the</strong> salinity was high, denitrification efficiency<br />
decreased, however, <strong>the</strong> activity recovered after 10 days of operation regardless of<br />
salinity. The denitrifiers were surrounded by extracellular polymers, which enabled<br />
<strong>the</strong>m to endure <strong>the</strong> changes in cultivation conditions[2] and adjust to a new<br />
environment<br />
2
(a)<br />
(b)<br />
(c)<br />
Nitrate conc.<br />
(mg NO 3 - -N/L)<br />
Effluent nitrite conc.<br />
(mg NO -<br />
2 -N/L)<br />
Denitrification<br />
efficiency (%)<br />
12<br />
9<br />
6<br />
3<br />
1.0<br />
0.8<br />
0.6<br />
0.4<br />
0.2<br />
100<br />
80<br />
60<br />
40<br />
20<br />
0<br />
0 10 20 30<br />
Operating periods (day)<br />
R-1(o ppt)<br />
R-2(7.5 ppt)<br />
R-3(15 ppt)<br />
R-4(30ppt)<br />
Fig. 1. Operation of denitrifying reactor with<br />
immobilized denitrifier ; Nitrate nitrogen<br />
concentrations of <strong>the</strong> influents and effluent of<br />
reactors (a), nitrite nitrogen concentrations of <strong>the</strong><br />
effluent of reactors (b) and denitrification<br />
efficiency(c) with different salinity<br />
Influent R-1(●) Effluent R-1(❍) ; 0ppt of salinity<br />
Influent R-2(▲) Effluent R-2(u) ; 7.5ppt of salinity<br />
Influent R-3(■) Effluent R-3(y) ; 15ppt of salinity<br />
Influent R-4(▼) Effluent R-4(v) ; 30ppt of salinity<br />
The effect of acclimation method on <strong>the</strong> denitrification process.<br />
Fig. 2. shows nitrate removal rates and nitrite nitrogen concentrations of <strong>the</strong><br />
acclimation method from <strong>the</strong> fresh water denitrification system to <strong>the</strong> marine system.<br />
R-1 was maintained to <strong>the</strong> fresh water system as <strong>the</strong> control reactor to correct changes<br />
in cultivation conditions, for example temperature, pH and DO, because all reactors<br />
were operated at room temperature and 4 months were required for <strong>the</strong> operation.<br />
In <strong>the</strong> control reactor, R-1, <strong>the</strong> nitrate nitrogen removal rates were reduced to 18.5,<br />
13.3 and 8.6 g NO3 - -N/m 3 /day at each step and <strong>the</strong> nitrite nitrogen concentration was<br />
lower than 0.05 mg NO2 - -N/L during operating periods and temperatures in <strong>the</strong><br />
reactor were measured 27~28, 20~23 and 17~18 o C at each step, respectively.<br />
Decrease in room temperature might cause reductions of nitrate nitrogen removal<br />
rates[3]. In R-2, <strong>the</strong> salinity was increased to 30 ppt by 3 steps, and <strong>the</strong> nitrate<br />
removal rates were 18.2, 12.6 and 7.9 g NO3 - -N/m 3 /day and <strong>the</strong> rates were reduced on<br />
salinity, however, <strong>the</strong>se were 98.4, 94.7 and 91.5 % compared to <strong>the</strong> control of <strong>the</strong><br />
same periods, respectively. Nitrite nitrogen concentration was 0.05, 0.15 and 0.27 mg<br />
NO2 - -N/L, respectively. In R-3, salinity was increased to 30 ppt by 2 steps nitrate<br />
nitrogen removal rates were 16.3 and 11.9 g NO3 - -N/m 3 /day and nitrite nitrogen<br />
concentrations were 0.68 and 0.70 mg NO2 - -N/L. As <strong>the</strong> nitrate nitrogen removal rate<br />
was compared to <strong>the</strong> same method of R-2, <strong>the</strong>se were 88.1 and 89.5 %. In R-4 with<br />
seawater, <strong>the</strong> nitrate nitrogen removal rate was 17.4 g NO3 - -N/m 3 /day and it was 94.1<br />
% compared to <strong>the</strong> control and nitrite nitrogen concentration was 0.69 mg NO2 - -N/L.<br />
Therefore, direct acclimation was more efficient than stepwise acclimation when <strong>the</strong><br />
freshwater denitrification system was converted to <strong>the</strong> marine system, although <strong>the</strong><br />
nitrite nitrogen concentration showed 0.69 mg NO2 - -N/L. However, nitrite<br />
concentrations could be maintained within <strong>the</strong> criteria in <strong>the</strong> marine system[9]. Also,<br />
<strong>the</strong> direct acclimation method required less time periods to convert <strong>the</strong> fresh water<br />
system to <strong>the</strong> marine system.<br />
3
The effect of HRT on <strong>the</strong> marine denitrification system.<br />
Fig. 3 shows <strong>the</strong> nitrate nitrogen removal rate and denitrification efficiency on HRT<br />
(hydraulic retention time). As HRT was reduced <strong>the</strong> nitrate nitrogen removal rate<br />
increased until 3 hours of HRT. However, <strong>the</strong> rate suddenly decreased at HRT under 3<br />
hours. The denitrification efficiency decreased by <strong>the</strong> decrease in HRT. Even though<br />
<strong>the</strong> efficiency decreased, <strong>the</strong> nitrate removal rate increased with <strong>the</strong> decrease of HRT<br />
due to <strong>the</strong> high flow rate until 3 hours of HRT. Considering <strong>the</strong> nitrate removal rate<br />
and denitrification efficiency, <strong>the</strong> optimum HRT was limited to 3 hours although<br />
denitrification efficiency was somewhat low as 36%. The maximum nitrate nitrogen<br />
removal rate was 10 g NO3 - -N/m 3 /day at 3 hours of HRT.<br />
Nitrate removal rate<br />
- 3<br />
(g NO3 -N/m /day)<br />
Nitrite conc.<br />
(mg NO 2 - -N/L)<br />
20<br />
15<br />
10<br />
5<br />
0<br />
1.0<br />
0.8<br />
0.6<br />
0.4<br />
0.2<br />
0.0<br />
R-1 R-2 R-3 R-4<br />
Step 1, 27-28 o C<br />
Step 2, 20-23 o C<br />
Step 3, 17-18 o C<br />
R-1 R-2 R-3 R-4<br />
Fig. 2. Nitrate removal rate and nitrite concentration Fig. 3. Nitrate removal rate and denitrification<br />
by <strong>the</strong> acclimation method of <strong>the</strong> fresh water system efficiency on HRT in marine denitrification<br />
to marine system. system.<br />
REFERENCES<br />
1. Colt, J. and G. Tchobanoglous. “Evaluation of <strong>the</strong> short-term toxicity of<br />
nitrogenous compounds to channel catfish.” Ictalurus punctatus. Aquaculture<br />
8(1976):209-24.<br />
2. Hashimoto, S., and K. Furukawa. “Immobilization of activated sludge by PVAboric<br />
acid method.” Biotech. Bioeng. 30(1987): 52-59.<br />
3. Henze, M., and P. Harremoes. “Biological denitrification of sewage; A literature<br />
review.” Prog. Water Technol. 8(1977): 509-55.<br />
4. Mattiasson, B., M. Ramstorp, I. Nilsson, and B. Hahn. “Comparison of <strong>the</strong><br />
performance of a hallow fiber membrane reactor with a reactor containing alginate<br />
entrapped cells denitrification of water using Pseudomonas denitrificans.”<br />
Biotechnol. Lett. 3(1981): 561-566.<br />
5. Nilsson, I., and S. Ohlson. “Immobilized cells in microbial nitrate reduction.”<br />
Appl. Biochem. 7(1982): 39-41.<br />
4<br />
Nitrate removal rate (g/m 3 /day)<br />
12<br />
10<br />
8<br />
6<br />
4<br />
2<br />
0<br />
0 2 4 6 8 10 12<br />
Hydraulic Retention Time (hr)<br />
Removal rate<br />
Efficicency<br />
100<br />
80<br />
60<br />
40<br />
20<br />
0<br />
Denitrification efficiency (%)
6. Poxton, M. G. and S. R. Allouse. “Water quality criteria for marine fisheries.”<br />
Aquacul. Eng. 1(1982): 153-191.<br />
7. Sheih, W. Y. and C. M. Lim. “Denitrification by novel halophilic fermentation<br />
bacterium.” Can. J. Microbiol. 42(1996): 507-514.<br />
8. Westin, D. T. “Nitrate and nitrite toxicity to salmon fishes.” Prog. Fish. Cult<br />
36(1974): 86-9.<br />
9. Wickins, J. F. “Water quality requirements for intensive aquaulture : A review.”<br />
In: Proc. World. Symp. on aquaculture in heated effluents and recirculation<br />
systems. ed. K. Tiews. Berlin. 1(1981): 17-37.<br />
5
Introduction<br />
Basic Design Considerations for Small Fish Holding<br />
Facilities: For <strong>the</strong> Biologist/Aquarist<br />
Todd S. Harmon<br />
Aquaculturalist<br />
Walt Disney World Co.<br />
P.O. Box 10,000, Lake Buena Vista, FL 32830<br />
With an increasing number of aquariums, zoos, and educational institutions holding<br />
aquatic animals, <strong>the</strong>re is much to be mentioned as to <strong>the</strong>ir needs for aquatic facilities.<br />
Universities and high schools often use aquatic systems for studying aquatic animals and<br />
<strong>the</strong>ir behaviors, while o<strong>the</strong>r universities may stock tanks for aquacultural research. Public<br />
aquariums and zoological institutions which have aquatic exhibits may also have holding<br />
facilities for receiving and dispositioning animals as well as for caring for ill animals. All<br />
aquatic systems should be designed according to <strong>the</strong>ir intended use. Moreover, a facility<br />
or system often turns into ano<strong>the</strong>r with a different use later on. This is resourceful by<br />
utilizing existing equipment, but we must consider <strong>the</strong> components and <strong>the</strong> original design<br />
before placing a load of fish into an existing system and expecting good results.<br />
Holding accommodations can be as advanced as having multiple recirculation systems in a<br />
temperature controlled building or simple as basic single tank systems. Facility or system<br />
design depends directly upon <strong>the</strong> desired use of <strong>the</strong> system as well as many o<strong>the</strong>r factors.<br />
Typical uses may include: display exhibits, quarantine, hospital tanks, holding, breeding,<br />
growout, spawning or any combination of <strong>the</strong>se. Even after <strong>the</strong> original application is<br />
decided <strong>the</strong> actual components may depend yet upon ano<strong>the</strong>r set of factors which also<br />
need to be evaluated. These may include: water availability and cost, feeding rates, fish<br />
density, electrical availability, maintenance, and climate.<br />
Design Considerations<br />
Systems<br />
There are two basic types of systems, recirculating and flow through or somewhere in<br />
between. A flow through system consists of water entering tanks and leaving at <strong>the</strong> o<strong>the</strong>r<br />
end and is not recycled through <strong>the</strong> system again. In water reuse systems, water is reused<br />
multiple times and in some instances it is filtered and reused, which is referred to as a<br />
recirculation system. Most practical water reconditioning systems recycle 90-95% of <strong>the</strong><br />
water (Piper et al. 1982). A daily partial water loss is necessary for backwashing of filters<br />
as well as to remove nitrates and to replace minerals and trace elements (Lawson 1995).<br />
Recirculating systems consist of various components, some of <strong>the</strong> basic requirements<br />
include: mechanical filter, biological filter, sterilization/disinfection, and a temperature<br />
1
control unit. Two distinct advantages of this type of system is <strong>the</strong> control over certain<br />
water quality parameters, and water conservation.<br />
Good water quality and an inexpensive source of water must be available for flow through<br />
systems to be considered economically feasible. A higher flow rate is needed to keep water<br />
quality conditions favorable when high densities of fish are housed. However, such<br />
systems can be beneficial when a continual water supply is offered at little expense.<br />
Isolation of ill fish or quarantining fish where <strong>the</strong> water may become contaminated by<br />
pathogenic organisms is also a motive for using a flow through system. Water quality is<br />
usually not a problem in <strong>the</strong>se types of systems as long as <strong>the</strong> incoming water is optimal<br />
for <strong>the</strong> species involved and turnover rates are adequate.<br />
Holding Containers<br />
There are many different types, shapes, and sizes of holding tanks that are available today.<br />
The most popular being circular or rectangular in shape. Much of <strong>the</strong> selection with<br />
container shapes is based on personal preferences. Although, some have distinct<br />
advantages over o<strong>the</strong>rs. A major difference outlined by Piedrahita (1991) is <strong>the</strong> water<br />
quality in circular tanks tends to be uniform and follow <strong>the</strong> continuous flow stirred tank<br />
reactor model (CFSTR), while raceways follow a plug flow reactor (PFR) model by a<br />
distinct degradation of water quality between <strong>the</strong> inlet and outlet.<br />
Rectangular tanks can be placed side by side with little wasted space between <strong>the</strong>m. Ellis<br />
(1994) found rectangular tanks to be superior over circular designs in survivability, feed<br />
conversion, yield, and growth in Florida red tilapia fry. If flow rates are not adjusted<br />
correctly in raceways <strong>the</strong>y can act as a solids settling device. Boersen and Westers (1986)<br />
added baffles in raceways to help move solids to <strong>the</strong> end of raceways where <strong>the</strong>y could be<br />
easily vacuumed out. Rectangular tanks are often used for fry and for hatching purposes<br />
in aquacultural operations, whereas circular tanks are often used as growout tanks.<br />
Dividers can also be placed in narrow rectangular tanks with little effort compared to ones<br />
in circular tanks.<br />
Circular tanks offer <strong>the</strong> distinct advantage of being “self-cleaning”. Incoming water can be<br />
angled to create a circular motion in <strong>the</strong> tank with <strong>the</strong> solids being swept towards <strong>the</strong><br />
middle where <strong>the</strong>y are removed by a center drain. Lawson (1995) reminds us that flow<br />
velocity must not be so great that <strong>the</strong> fish expand all of <strong>the</strong>ir energy swimming.<br />
Moreover, water velocities high enough to keep particulate matter suspended may also<br />
create conditions in which gill irritation develops from <strong>the</strong> suspended particles, thus<br />
possibly leading to bacterial gill disease (Wedemeyer 1996). Circulation and mixing are<br />
such that solids are more evenly distributed, making <strong>the</strong> water quality more uniform<br />
throughout <strong>the</strong> tank. This could have a beneficial effect or a negative impact depending<br />
upon <strong>the</strong> water quality conditions. The capture of fish from circular tanks can be difficult<br />
if <strong>the</strong> proper equipment such as a swinging crowder gate is not available, whereas in<br />
rectangular tanks a simple screen can be used to crowd <strong>the</strong> fish to one end.<br />
2
Aeration<br />
Dissolved oxygen (D.O) is a limiting factor in fish culture (Piper et al. 1982). Inadequate<br />
D.O. levels may lead to reduced growth, increase of disease problems, and can cause mass<br />
mortality (Colt and Tchobanoglous 1981). As <strong>the</strong> density increases in a system, so must<br />
<strong>the</strong> amount of available oxygen. Species, life stage, environmental conditions, size, and<br />
physiological condition are all variables in <strong>the</strong> amount of oxygen needed for fish to<br />
survive. In most cases, long-term D.O. levels above 6.0 mg/l will prevent any problems<br />
associated with oxygen deficiency in any species of fish.<br />
Subsurface aeration techniques are <strong>the</strong> most common among small fish holding systems.<br />
Aerating water not only adds valuable oxygen to <strong>the</strong> water, but it can also off-gas CO2 ,<br />
which is a byproduct of fish metabolism that is toxic to fish at elevated levels. Facilities<br />
that are planning for high densities of fish, pure oxygen injection may be preferred, which<br />
is typically designed by an engineer. Speece (1981), and Colt and Watten (1988) go into<br />
detail with different types of pure oxygen systems and <strong>the</strong>ir uses. For low densities of fish,<br />
using a professional judgment from previous setups or colleagues can be a great help and<br />
save time with calculations. If previous experience is limited, it is recommended that <strong>the</strong><br />
actual amount of oxygen consumed by <strong>the</strong> fish be taken into consideration (Table 1.0).<br />
Even among <strong>the</strong> same species, oxygen uptake can be very inconsistent because of<br />
Table 1.0<br />
Oxygen consumption values for various freshwater fish species.<br />
Species Size Feeding Temp O2 consumption Original Source<br />
(g) Status (°C) mg/kg/day<br />
Cyprinus carpio 806 + 12 1,921 Nakanishi and Itzawa<br />
1974 (1)<br />
100 + 10 4,080 Beamish 1964 (2)<br />
100 + 20 11,520 Beamish 1964 (2)<br />
100 + 25 16,800 Beamish 1964 (2)<br />
Oncorhynchus nerka 28.6 + 15 6,600 Brett and Zala 1975 (3)<br />
28.6 15 5,600 Brett and Zala 1975 (3)<br />
Ictalurus punctatus 100 + 26 14,600 Andrews and Matsuda<br />
1975 (1)<br />
100 30 13,440 Andrews and Matsuda<br />
1975 (2)<br />
100 + 30 19,440 Andrews and Matsuda<br />
1975 (2)<br />
Onchorhynchus mykiss 73 + 11 2,917 Nakanishi and Itazawa<br />
1974 (1)<br />
100 15 7,200 Liao 1971 (2)<br />
Sources: (1) Kepenyes and Varadi (1983)<br />
(2) Creswell (1993)<br />
(3) Colt (1981)<br />
3
<strong>the</strong> many variables that are involved with <strong>the</strong> rate of oxygen consumption. Considerations<br />
such as <strong>the</strong> D.O. level entering <strong>the</strong> tank and turnover rates are also important in designing<br />
an aeration system. Computing for an incoming D.O. level of 0 mg/l can provide a safety<br />
margin of not relying on <strong>the</strong> systems run performance to maintain proper D.O. levels.<br />
Air blowers or air compressors are usually <strong>the</strong> choice for subsurface aeration devices. Air<br />
blowers are designed to provide large volumes of air at low pressures (
Recirculation systems generally utilize pumps for moving water from <strong>the</strong> tank through<br />
filters or from a sump through a filtering system. Four items are needed to correctly size a<br />
pump:<br />
(1) Desired flow rate (gpm or lpm)<br />
(2) Friction loss from <strong>the</strong> piping and fittings (suction & discharge side)<br />
(3) Vertical distance in which <strong>the</strong> water is to be pumped<br />
(4) Pressure required by filters (1 psi = 2.31 head feet)<br />
Creswell (1993) and Lawson (1997) ga<strong>the</strong>red information on friction losses for selected<br />
valves and fittings as “equivalent length of pipe”. Using this information, <strong>the</strong> total length<br />
of all fittings is added to <strong>the</strong> length of straight pipe needed to give a total length of pipe<br />
which is <strong>the</strong>n used in <strong>the</strong> Hazen-Williams Formula. Major pipe sizes and <strong>the</strong>ir<br />
corresponding friction losses are shown in Table 2. Lawson (1997) recommends using a<br />
C-value of 100 for permanent installations of PVC piping due to future biofouling; new<br />
PVC pipe has a C-value of 150. This calculation along with vertical lift and pressures<br />
required by any filters will give <strong>the</strong> total dynamic head (ft or m). This information along<br />
with <strong>the</strong> desired flow rate and a manufacturers pump graph will present <strong>the</strong> correct size<br />
pump for <strong>the</strong> system.<br />
Table 2.0<br />
Losses are given in head feet per 100’ pipe using <strong>the</strong> Hazen-Williams formula. A C-value<br />
of 130 is used as <strong>the</strong> coefficient using Schd. 40 PVC pipe. Velocities (v) are given in<br />
ft/sec.<br />
0.75 1<br />
Pipe Size (in)<br />
1.5 2 3<br />
Loss v Loss v Loss v Loss v Loss v<br />
GPM<br />
5 10.17 3.63 9.05 2.04<br />
10 36.73 7.26 32.67 4.09 1.26 1.82 0.31 1.02<br />
20 132.58 14.52 69.21 8.17 4.53 3.63 1.12 2.04<br />
30 117.9 12.26 9.61 5.45 2.37 3.06 0.33 1.36<br />
40 178.24 16.34 16.37 7.26 4.03 4.09 0.56 1.82<br />
50 24.75 9.08 6.10 5.11 0.84 2.27<br />
60 34.68 10.89 8.54 6.13 1.19 2.72<br />
70 10.99 7.15 1.58 3.18<br />
80 13.43 8.17 2.02 3.63<br />
90 15.89 9.19 2.51 4.09<br />
100 18.37 10.21 3.05 4.54<br />
110 3.64 4.99<br />
120 4.28 5.45<br />
130 4.97 5.90<br />
140 5.70 6.35<br />
150 6.47 6.81<br />
Note: Generally 5 ft/sec is considered to be safe. Higher velocities may be used in cases where <strong>the</strong><br />
operating characteristics are known and that sudden changes in flow velocity can be controlled.<br />
5
Filtration<br />
Recirculation systems rely upon filtration to take out waste products and to carry out <strong>the</strong><br />
nitrification processes. Basic components of a recirculation system typically include:<br />
mechanical filtration, biological filtration, sterilization, and heating/cooling. Various o<strong>the</strong>r<br />
components such as: fractionators, carbon filters, and degas towers may also be additional<br />
features to a system. Many combinations and variations of filters can be used.<br />
Mechanical filters are typically <strong>the</strong> first filter in a filtration sequence. These filters remove<br />
any suspended solids in <strong>the</strong> system. Mechanical filters are generally sized according to <strong>the</strong><br />
flow rate, which manufacturers will give for different size filters. A good review of<br />
mechanical filters are found in Wheaton 1977; Chen et al. 1997; and Lawson 1997. The<br />
biological filtration of interest for fisheries professionals is <strong>the</strong> nitrification process in<br />
which two genera of autotrophic bacteria oxidize unionized ammonia (NH 3 ) to nitrite<br />
(NO 2 ) <strong>the</strong>n to nitrate (NO 3 ). Biofilters serve as a source of surface area for nitrifying<br />
bacteria to colonize in which <strong>the</strong> water has to pass over or through. . A biological filtering<br />
device should be located following <strong>the</strong> mechanical filter. Popular reviews in biological<br />
filtration devices used in fish systems include: Wheaton 1977; Rogers 1985; Malone et al.<br />
1993; Westerman et al. 1993; and Wheaton et al. 1997.<br />
Biological filtration design is not an exact science in fish systems due to limited scientific<br />
literature on ammonia production by fish and inconsistent data (Wheaton 1997).<br />
Biological filters are sized according to <strong>the</strong> amount of surface area that is needed for<br />
nitrifying bacteria. Meade (1985) reviewed information on ammonia production and<br />
found ranges of 20-78.5 g/kg of diet per day. Three out of <strong>the</strong> five sources cited by Meade<br />
found production rates between 31-37.4g/kg-diet/day. Piper (1982) found that much of<br />
<strong>the</strong> literature on trout and salmon total ammonia production rates which were fed a drypelleted<br />
food produced 32 g/kg-food. For smaller lightly-loaded systems submerged or<br />
trickling biofilters are commonly <strong>the</strong> preferred choice and are relatively inexpensive.<br />
Wheaton (1977) reviewed literature on nitrification rates for a submerged gravel biofilter<br />
to be 1.0 g/NH 3 N/m 2 -day at 20° C. Miller and Libey (1985) found a trickling filter to<br />
have removal rates from 0.14-0.25 g N/m 2 -day. Using <strong>the</strong>se data or findings by o<strong>the</strong>rs <strong>the</strong><br />
following formula is used in determining <strong>the</strong> surface area needed.<br />
ammonia produced (g)<br />
ammonia removed (g/m 2 /day)<br />
Poor performance is often caused by uneven flow across all of <strong>the</strong> media. All of <strong>the</strong><br />
nitrifying bacteria must have an ample supply of nutrients and an adequate supply of<br />
oxygen to survive. Hochheimer and Wheaton (1991) also review light to be an inhibiting<br />
factor on nitrifying bacteria growth. Like aeration design, a mass-balance approach is<br />
commonly used for high density fish systems.<br />
6<br />
= m 2 surface area
Calculations<br />
The following example is for a recirculating system used as a holding area for freshwater<br />
fishes. The following information is used in <strong>the</strong> design considerations:<br />
A. Low- density system with 10-1000g. fish. Total biomass not to exceed 50 kg.<br />
B. Total feed is not to exceed 2kg/day.<br />
C. 750 gal. system (2- 250 gal circular tanks and 1-250 gal rectangular trough).<br />
D. Components will consist of a sand filter, trickling biofilter, UV sterilizer, and<br />
supplemental aeration.<br />
1. FLOW RATE: Turnover rate 1x/hr. (750 gal./60 min = 13 gpm flow rate)<br />
1” PVC pipe will be used, which has a velocity of about 5 ft/sec and a head loss of<br />
around 40 head feet/100’ pipe (Table 2.0).<br />
2. PLUMBING FITTINGS: From Creswell (1993), <strong>the</strong> following losses are given:<br />
Discharge: Suction:<br />
(8) 90° elbows = 20 ft. pipe (2) 90° elbows = 5 ft. pipe<br />
(4) 45° = 5.3 Straight pipe = 3<br />
(2) Tees (branch flow) = 10 TOTAL SUCTION 8 feet pipe<br />
(6) Gate Valves (Open) = 6.5<br />
Straight pipe = 10<br />
TOTAL DISCHARGE 51.8 feet pipe<br />
3. FILTRATION COMPONENTS:<br />
Vertical distance from sump water to <strong>the</strong> highest point where <strong>the</strong> water is<br />
discharged into <strong>the</strong> trickle filter = 7’<br />
Sand filter = 1 psi = 2.3 head feet<br />
UV = minimal<br />
4. TDH (total dynamic head) = friction head + pressure head + static head<br />
59.8’ pipe (suction + discharge)<br />
Head loss 40’/100’ pipe (from #1) (59.8’)(40’)=(100’)a<br />
a= 24’<br />
TDH = 24’ + 2.3’ + 7’ = 33 head feet<br />
Therefore, a pump that would supply 13 gpm at 33 feet of head is needed.<br />
5. AERATION REQUIREMENTS:<br />
From Table 1. we find 14,600 mg/kg/day O2 consumption for catfish at 26°C.<br />
According to a supplier, 6” airstones output is 8g O2/hr (192,000 mg O2/day).<br />
(50kg fish)(14,600mg/kg/day) = 730,000 mg/day O2 consumption<br />
730,000 mg/day O2 consumption<br />
192,000 mg O2/day output each<br />
= (4) 6” airstones<br />
7
6. AERATION DEVICE:<br />
6” airstones are suggested to run at 0.5 CFM (supplied from manufacturer) each.<br />
0.5 (4) = 2.0 CFM<br />
Friction loss due to flow and pipe size is minimal for this volume of air (Creswell<br />
(1993). With a depth of 2’, about 1 psi of pressure is required.<br />
This minimal air volume will require a small air pump capable of 2-3 CFM @ 1.5-<br />
2 psi, and at <strong>the</strong>se figures <strong>the</strong>re is a buffer.<br />
7. BIOLOGICAL: Feeding at a rate of 2 kg/day and using a production rate of<br />
35g/kg.feed. = 70 g. N produced/day<br />
Using a removal rate of 0.14g/m 2 /day<br />
70 g. N<br />
0.14 g./m 2 /day<br />
= 500m 2 surface area<br />
1” bioballs = 532m 2 /m 3 (given by supplier)<br />
Therefore, one cubic meter of 1” bioballs is needed for <strong>the</strong> trickling filter.<br />
If a round cylinder of 0.5m diameter is used, <strong>the</strong> height of <strong>the</strong> container would be<br />
calculated by <strong>the</strong> following: V = π r 2 h<br />
1m 3 = (3.14) (0.5) 2 (h)<br />
1m 3 = 0.785h<br />
h = 1.2 m<br />
The considerations mentioned are a few of many for <strong>the</strong> design of an aquatic holding<br />
system, although <strong>the</strong>y will give a starting point in <strong>the</strong> design phase and eliminate some of<br />
<strong>the</strong> guess work in system design. Much of <strong>the</strong> information for system design is limited,<br />
and for <strong>the</strong> most part, very inconsistent because of <strong>the</strong> many variables that are involved.<br />
In <strong>the</strong> end, <strong>the</strong> most versatile facility/system will work out <strong>the</strong> best over time.<br />
Literature Cited<br />
Boersen, G. and H. Westers. “Waste solids control in hatchery raceways.” The<br />
Progressive Fish Culturalist, 48 (1986):151-154.<br />
Chen, S., D. Stechey, and R.F. Malone. “Suspended solids control in recirculating<br />
aquaculture systems”. In: M.B. Timmons and T.M. Lorsordo, eds., Nitrification filter<br />
design methods in Aquaculture water reuse systems: engineering design and<br />
management. Elsevier, New York, New York, (1997): 61-99.<br />
8
Colt, J.E. and G. Tchobanoglous. “Design of aeration systems for aquaculture”. In: L.J.<br />
Allen and E.C. Kinney, eds., Proceedings of <strong>the</strong> Bio-Engineering <strong>Symposium</strong> for Fish<br />
Culture. Be<strong>the</strong>sda, MD:American Fisheries Society. (1981), 138-148.<br />
Colt, J. and B. Watten. “Applications of Pure oxygen in Fish Culture.” Aquacultural<br />
Engineering 7 (1988): 397-441.<br />
Creswell, R.L. Aquaculture desk reference. New York, New York: Chapman and Hall.<br />
1993.<br />
Ellis, S.C. and W. Watanabee. “Comparison of raceway and cylindroconical tanks for<br />
brackish-water production of juvenile florida red tilapia under high stocking densities.”<br />
Aquacultural Engineering, 13 (1994): 59-69.<br />
Hochheimer, J.N. and F.W. Wheaton. “Understanding Biofilters, Practical Microbiology<br />
for Ammonia Removal”. In: Engineering Aspects of Intensive Aquaculture, Proceedings<br />
from <strong>the</strong> Aquaculture <strong>Symposium</strong>. Cornell University, Ithaca, New York, (1991): 57-79.<br />
Kepenyes, J. and L Varadi. “Aeration and oxygenation”. Aquaculture in Inland<br />
Aquaculture Engineering. United Nations development programme, ADCP/REP/84/21,<br />
Rome, Italy, (1983): 473-507.<br />
Lawson, T.B. Fundamentals of Aquacutural Engineering. New York, New York:<br />
Chapman and Hall. 1995.<br />
Lorsordo, T.M. and H. Westers. “System carrying capacity and flow estimation”.<br />
In: M.B. Timmons and T.M. Lorsordo, eds. Nitrification Filter Design Methods in<br />
Aquaculture Water Reuse Systems: Engineering Design and Management. Elsevier, New<br />
York, New York, (1997): 9-60.<br />
Malone, R.F., B.S. Chitta, and D.G. Drennan. “Optimizing nitrification in bead filters for<br />
warmwater recirculating aquaculture systems.” In: Techniques for Modern Aquaculture<br />
(Proc.), 21-23 June 1993, Spokane, WA. American Society of Agricultural Engineers. St.<br />
Joseph, MI. 315-325.<br />
Meade, J.W. “Allowable Ammonia for Fish Culture”. The Progressive Fish Culturalist,<br />
47(2), (1985): 135-145.<br />
Miller, G.E. and G.S. Libey. “Evaluation of Three Biological Filters Suitably for<br />
Aquacultural Applications”. Journal of World Mariculture Society, 16(1985): 158-168.<br />
Piedrahita, R.H.. “Engineering aspects of warmwater hatchery design.” In: Aquaculture<br />
Systems Engineering (Proc.), 16-20 June 1991, San Juan, Puerto Rico. American Society<br />
of Agricultural Engineers. St. Joseph, MI. 85-100.<br />
9
Piper, R.G., I.B. McElwain, L.E. Orme, J.P. McCraren, L.G. Fowler, and J.R. Leonard.<br />
Fish Hatchery Management. Washington, DC: US Dept. Interior Fish and Wildlife<br />
Service. 1982.<br />
Rogers, G.L. and S.L. Klemetson. “Ammonia removal in selected aquaculture water<br />
reuse biofilters.” Aquacultural Engineering 4(1985): 135-154.<br />
Speece, R.E. “Management for dissolved oxygen and nitrogen in fish hatchery waters”.<br />
In: Allen, L.J. and E.C. Kinney, eds., Proceedings of <strong>the</strong> Bio-Engineering <strong>Symposium</strong> for<br />
Fish Culture., Be<strong>the</strong>sda, MD:American Fisheries Society, (1981): 53-70.<br />
Wedemeyer, G.A. Physiology of Fish in Intensive Culture Systems. New York, New<br />
York: Chapman and Hall. 1996.<br />
Westerman, P.W., T.M. Lorsordo, and M.L. Wildhaber. “Evaluation of various biofilters<br />
in an intensive recirculating fish production facility.” In: Techniques for Modern<br />
Aquaculture (Proc.), 21-23 June 1993, Spokane, WA. American Society of Agricultural<br />
Engineers. St. Joseph, MI.<br />
Wheaton, F.W.. Aquacultural engineering. New York, New York: John Wiley and<br />
Sons. 1977.<br />
Wheaton, F.W., J. Hochheimer, G.E. Kaiser, R.F. Malone, M.J. Krones, G.S. Libey, and<br />
C.C. Easter. “Nitrification filter design methods in Aquaculture water reuse systems:<br />
engineering design and management”. In: M.B. Timmons and T.M. Lorsordo, eds.,<br />
Aquaculture water reuse systems:Engineering Design and Management. Elsevier, New<br />
York, New York, (1997):127-172.<br />
10
Heat Budget Model for Predicting Water Temperature in<br />
Outdoor Intensive Fish Tanks Under Greenhouse Cover<br />
Introduction<br />
Arik Ashkenazi 1* ; Noam Mozes 1 ; Ido Seginer 2<br />
1 – <strong>National</strong> Center for Mariculture, IOLR, P.O. Box 1212, Eilat, 88112, Israel<br />
2 – Department of Agricultural Engineering, Technion, Haifa 32000, Israel<br />
Intensive fish culture in Israel is generally practised in covered out door tanks.<br />
The transparent covers trap solar energy, resulting in water temperature that enables<br />
fish to overwinter successfully in nor<strong>the</strong>rn Israel and even to achieve some growth in<br />
sou<strong>the</strong>rn Israel. Common cover materials are semi-transparent white or green PVC and<br />
PE sheets.<br />
The objectives of this study were : (a) to examine experimentally <strong>the</strong> influence of<br />
different cover materials on tank water temperature and (b) to develop energy budget<br />
models to quantify energy fluxes in a covered tank and to predict tank water<br />
temperature.<br />
Data were collected between 1996-1999 at <strong>the</strong> experimental aquaculture<br />
research station at Genosar (nor<strong>the</strong>rn Israel) and at <strong>the</strong> <strong>National</strong> Center for Mariculture<br />
(NCM) in Eilat (sou<strong>the</strong>rn Israel). Two models were developed : (a) an extended<br />
dynamic model (EM), which was used to estimate <strong>the</strong> relative importance of <strong>the</strong><br />
various energy fluxes, and (b) an equilibrium radiation model (RM), which was used to<br />
predict mean water temperatures.<br />
Experimental procedure<br />
The effect of several cover types on water temperature was studied in ten 50 m 3<br />
concrete tanks at Genosar. Materials used were semi-transparent white or green PVC<br />
and PE sheets. The tanks were occupied by overwintering tilapia fish. All tanks had <strong>the</strong><br />
same water exchange rate (10-50%/day, depending on <strong>the</strong> year) and <strong>the</strong> same number<br />
of paddlewheel aerators. Data were collected on an hourly basis for 3 months over<br />
three winters (1996/97 to 1998/99). These included wind speed and direction, as well<br />
as inside and outside solar radiation, air temperature and humidity. Also measured<br />
were <strong>the</strong> temperatures of <strong>the</strong> tank water, inflow water, tank cover and sky.<br />
At <strong>the</strong> NCM in Eilat, similar tests, utilizing three 100 m 3 sea water tanks for sea<br />
bream culture, were conducted in <strong>the</strong> winters of 1996/97 and 1997/98. One tank was<br />
covered with green semi-transparent PVC, ano<strong>the</strong>r with white PVC and <strong>the</strong> third<br />
remained cover-less. All three tanks had <strong>the</strong> same high water exchange rate<br />
(240%/day) and <strong>the</strong> same number of paddlewheel aerators.<br />
The air exchange rate under <strong>the</strong> covers was determined by <strong>the</strong> tracer (here CO2)<br />
decay method (Nederhoff et al., 1985; Boulard et al., 1996). The measurements were<br />
1
carried out for both <strong>the</strong> 50 m 3 and <strong>the</strong> 100 m 3 tanks (air volumes of 85 m 3 and 200 m 3 ,<br />
respectively).<br />
Extended energy budget Model (EM)<br />
The EM consists of three energy balance equations, corresponding to <strong>the</strong> three<br />
components of <strong>the</strong> system (tank water, inside air and cover, see Figure 1), and one<br />
mass balance equation of water vapor in <strong>the</strong> air.<br />
1. energy balance of <strong>the</strong> water: αwSi–Li–Hw–λEw–Hr–Hm=ρwdCwdT/dt<br />
2. energy balance of <strong>the</strong> air: Hw–Hc–Hv+λEw–λEc–λEv=0<br />
3. energy balance for <strong>the</strong> greenhouse cover : So–Si+Li–Lo+Hc+λEc–Ho=0<br />
4. mass balance of water vapor: Ew–Ec–Ev=0<br />
Hc<br />
Ho<br />
λEc<br />
Hw λEw<br />
Figure 1: Energy fluxes in <strong>the</strong> covered tank system.<br />
The explicit expressions for <strong>the</strong> various fluxes utilized conductive, convective<br />
and radiative transfer coefficients, which were adapted from experiments and from <strong>the</strong><br />
greenhouse literature (Kittas, 1985; Papadakis et al., 1992; Seginer et al.,1988). The<br />
meteorological and control variables were taken from <strong>the</strong> experiments.<br />
Radiation Model (RM)<br />
An analysis of <strong>the</strong> results obtained with <strong>the</strong> EM (to be described briefly in <strong>the</strong><br />
Results and Discussion section) indicated that <strong>the</strong> convective fluxes were relatively<br />
unimportant when <strong>the</strong> structure over <strong>the</strong> tank was not ventilated (as in winter). For<br />
such conditions a simplified model, RM, with emphasis on <strong>the</strong> radiative fluxes was<br />
developed (after Seginer et al.; 1988).<br />
The EM consists of only two energy balance equations, one for <strong>the</strong> tank water<br />
and one for <strong>the</strong> cover.<br />
5. Energy balance for <strong>the</strong> water : αwτcG–(Fw–Fc)–β(Fc–Fs)–Hr = 0<br />
6. Energy balance for <strong>the</strong> cover : αcG+(1–γ)(Fw–Fc)+(β–η)(Fc–Fs) = 0<br />
where Fi is a shorthand notation for σTi 4<br />
Lo<br />
Li<br />
Si<br />
So<br />
2<br />
λEv<br />
Hv<br />
Hr<br />
Hm
The RM requires only two meteorological inputs: solar radiation and air<br />
temperature (sky temperature is estimated from air temperature), while <strong>the</strong> EM<br />
requires wind speed and humidity as well. The RM was used to predict quasiequilibrium<br />
(monthly mean) water temperature.<br />
Results & Discussion<br />
Greenhouse experiments. The different types of cover material resulted in<br />
similar tank water temperatures, meaning that <strong>the</strong>ir role as convective barriers was far<br />
more important than <strong>the</strong> differences in <strong>the</strong>ir spectral properties. At Genosar <strong>the</strong> covers<br />
raised tank water temperature (on average) by 3 o C relative to <strong>the</strong> incoming water<br />
temperature, which was 16 o C, and by 6 o C relative to <strong>the</strong> uncovered (control) tank. In<br />
Eilat, both covered tanks maintained water temperature at 22 o C, <strong>the</strong> same as that of<br />
<strong>the</strong> incoming sea water. The water in <strong>the</strong> control tank was cooler by 4 o C.<br />
Ventilation rate. The exchange rate of <strong>the</strong> inside air (k) was found to be linearly<br />
related to <strong>the</strong> external wind speed (V). With V in m/s and K in 1/h, <strong>the</strong> mean<br />
relationship, valid for both <strong>the</strong> small and large tanks, up to a wind speed of 7m/s, is :<br />
K = 0.22 V + 0.44 (R 2 =0.91)<br />
This is similar to <strong>the</strong> results of Nederhoff et al. (1985).<br />
Energy fluxes estimated with <strong>the</strong> EM. The EM, with calculated coefficients<br />
(from <strong>the</strong> literature and experiments), was used to estimate <strong>the</strong> winter-time energy<br />
fluxes. Results for February 1998 in Genosar are presented in Figure 2.<br />
Heat fluxes [W/m 2 ]<br />
250<br />
200<br />
150<br />
100<br />
50<br />
0<br />
-50<br />
Heat fluxes in Genosar greenhouse<br />
(mean water temperature 20 o C) February 1998<br />
Si Li Lo Hw Hr Hc Ho Hv Hm λEw λlEw<br />
λEc lEc λEv<br />
lEv<br />
Figure 2: Average energy fluxes in a covered tank. Genosar, February 1998<br />
The results show that <strong>the</strong> main dissipation routes are via long-wave radiation and<br />
convection from <strong>the</strong> cover to <strong>the</strong> surroundings, as well as by loss of heat to <strong>the</strong> cold<br />
fresh water. Condensation on <strong>the</strong> inside of <strong>the</strong> cover is also a significant energy flux.<br />
These results are in agreement with Zhu et al., 1998, who reported a radiative loss of<br />
70 W/m 2 , compared to 90 W/m 2 in this study.<br />
Temperature prediction with <strong>the</strong> RM. Meteorological data available to fish<br />
farmers is generally just from monthly means. On <strong>the</strong> basis of such data, it is only<br />
3
possible to predict mean monthly tank temperatures. The RM was fitted to <strong>the</strong><br />
Genosar 1997/98 winter data, utilizing regression analysis. The resulting values for <strong>the</strong><br />
four coefficients are: (β−η)/αc=–2.43, (1–γ)/αc=6.55, αwτc=0.6 and β=0.3. The<br />
calibrated RM was <strong>the</strong>n tested with <strong>the</strong> 1998/99 data from Genosar and Eilat (Table<br />
1).<br />
Table 1: Measured and predicted water temperature of covered tanks. First two data<br />
sets were used for training.<br />
Location Period Measured<br />
temperature<br />
[ o C]<br />
4<br />
Predicted<br />
temperature<br />
[ o C]<br />
Deviation<br />
[ o C]<br />
Deviation<br />
Genosar Jan 98 18.3 18.2 0.1 0.5<br />
Genosar Feb 98 19.6 19.6 0.0 0.0<br />
Genosar Jan 99 19.7 18.8 0.9 4.6<br />
Genosar Feb 99 20.5 20.2 0.3 1.5<br />
Eilat Jan 99 22.2 22.0 0.2 0.9<br />
Eilat Feb 99 21.3 21.3 0.0 0.0<br />
Table 1 shows that <strong>the</strong> RM produced good predictions (less than 1 o C deviation<br />
from measured values) of tank temperature.<br />
In conclusion it seems that <strong>the</strong> EM can be used to estimate energy fluxes and <strong>the</strong><br />
RM can be used to predict water temperatures in covered aquaculture tanks.<br />
References<br />
Bet Dagan, Meteorological Service, Meteorological notes, 41 1983.<br />
Boulard, T.; Meneses, J.F.; Mermier, M.; Papadakis, G. “The mechanisms involved in<br />
<strong>the</strong> natural ventilation of greenhouses”. Agricultural and Forest Meteorology, 79<br />
61-77, 1996.<br />
Kittas C. “Greenhouse cover conductances”. J. Boundary-Layer Meteorology, 36 213-<br />
225, 1986.<br />
Nederhoff, E.M.; van de Vooren, J.; Udink ten Cate, A.J. “A practical tracer gas<br />
method to determine ventilation in greenhouses”. J. agric. Engng. Res. 31 309-<br />
319, 1985.<br />
Papadakis, G.; Frangoudakis, A.; Kyritsis, S. “Mixed, forced and free convection heat<br />
transfer at <strong>the</strong> greenhouse cover”. J. Agric. Engng. Res. 51 191-205, 1992.<br />
Seginer, I.; Kantz, D.; Peiper, U.M.; Levav N. “Transfer coefficients of several<br />
polyethylene greenhouse covers”. J. agric. Engng. Res., 39 19-37, 1988.<br />
Zhu, S.; Deltour, J.; Wang, S. “Modeling <strong>the</strong> <strong>the</strong>rmal characteristics of greenhouse tank<br />
systems”. J. Aquacultural Engineering, 18 201-217, 1998.<br />
[%]
Appendix - List of Symbols<br />
EM model fluxes (W/m2)<br />
So-solar radiation that reaches <strong>the</strong> cover (minus reflection)<br />
Si-solar radiation that penetrates into <strong>the</strong> greenhouse via <strong>the</strong> cover<br />
Li-long wave radiation between <strong>the</strong> tank surface and <strong>the</strong> cover<br />
Hr- sensible heat resulting from water exchange<br />
Lo- long wave radiation between <strong>the</strong> cover and <strong>the</strong> surrounding outer air<br />
Hw-sensible heat between <strong>the</strong> tank surface and <strong>the</strong> greenhouse air<br />
Hc- sensible heat between <strong>the</strong> cover and <strong>the</strong> greenhouse air<br />
Ho- sensible heat between <strong>the</strong> cover and <strong>the</strong> surrounding outer air<br />
Hm- sensible heat from <strong>the</strong> sides of <strong>the</strong> tank<br />
Ec- latent heat between <strong>the</strong> cover and <strong>the</strong> greenhouse air<br />
Ew- latent heat between <strong>the</strong> tank surface and <strong>the</strong> greenhouse air<br />
Hv- sensible heat in exchange between <strong>the</strong> greenhouse air and <strong>the</strong> surrounding outer air<br />
Ev- latent heat in exchange between <strong>the</strong> greenhouse air and <strong>the</strong> surrounding outer air<br />
RM model fluxes (W/m 2 )<br />
G - solar radiation<br />
Fc - long wave radiation from <strong>the</strong> cover<br />
Fw - tank water long wave radiation<br />
Fs - sky long wave radiation<br />
Hr - heat flux due to water exchange<br />
Symbols<br />
T- temperature<br />
V - wind speed m/s<br />
K - ventilation rate 1/h<br />
Cw – specific heat of water J/(kg/K)<br />
d – water depth m<br />
t – time s<br />
ρ – density kg/m 3<br />
α – absorptivity<br />
λ - latent heat of vaporization of water J/kg[water]<br />
σ - Boltzman’s constant W/(m 2 K 4 )<br />
τ - transmissivity<br />
Subscripts<br />
a – air<br />
c – cover<br />
i – inside structure<br />
m – walls of tank<br />
o – outside structure<br />
r - incoming water<br />
s – sky<br />
v – ventilation<br />
w - water<br />
K<br />
5
Recirculation Systems for Farming Eel in<br />
Western Europe: Towards a Certified<br />
Environmental Performance<br />
Andries Kamstra<br />
Ne<strong>the</strong>rlands Institute for Fisheries Research (RIVO)<br />
IJmuiden, The Ne<strong>the</strong>rlands<br />
Peter Rand Kees Kloet<br />
Danish Institute for Fisheries Hesy Bergambacht bv<br />
Technology and Aquaculture (DIFTA) Bergambacht,<br />
Hirtshals, Denmark The Ne<strong>the</strong>rlands<br />
Andre Aarnink<br />
Institute of Agricultural and Environmental<br />
Engineering (IMAG)<br />
Wageningen University, The Ne<strong>the</strong>rlands<br />
Present status of eel farming in recirculation systems<br />
Eels are considered a delicacy in some countries in Western Europe and have<br />
traditionally fetched high prices, in <strong>the</strong> near past in <strong>the</strong> order of 8-10 US$/kg. The high<br />
value and decreasing landings from fisheries have been a strong impetus for developing<br />
eel culture over <strong>the</strong> last 30 years. Eels need a water temperature of 23 to 25 °C for<br />
optimal growth. Given <strong>the</strong> climate in Western Europe, farming of eel is only an option<br />
using warm effluent from power stations or recirculation technology. Although some<br />
of <strong>the</strong> early initiatives were utilising warm effluent in a flow-through mode, this<br />
approach has been virtually abandoned because it proved not to be reliable. The first<br />
recirculation systems for eel were built at <strong>the</strong> end of <strong>the</strong> seventies. Slowly and with<br />
much difficulty eel farming has expanded, mainly in Denmark and The Ne<strong>the</strong>rlands, to<br />
a business comprising approximately 100 farms with a production of 6700 tonnes in<br />
1999.<br />
Although o<strong>the</strong>r species like sea bass, sea bream, turbot, sturgeon and African catfish<br />
are reared in recirculation systems occasionally, farming of eel is still <strong>the</strong> backbone for<br />
application of recirculation technology in Western Europe.<br />
Developments in design and management of systems<br />
To our knowledge, no studies are available which compare long-term technical<br />
performance of systems at a commercial level. Studies available usually cover<br />
instantaneous performance or only a certain aspect of performance (Gousset, 1990;<br />
Heinsbroek & Kamstra, 1990). Moreover, failure or success of certain systems in <strong>the</strong><br />
strict technical sense is often difficult to disentangle from o<strong>the</strong>r factors regarding for<br />
example <strong>the</strong> management of <strong>the</strong> fish or <strong>the</strong> economic peformance.<br />
In <strong>the</strong> early days a range of techniques was used for removal of suspended solids:<br />
sedimentation bassins, swirl separators, fixed-bed upflow filters and some mechanical<br />
filtration. Today, only microscreens are used, which have shown strong technical<br />
development. Fine solids (bioflocs) are sometimes removed with upflow filters or UV;<br />
1
exact criteria for design are lacking here however. Nitrification and removal of soluble<br />
COD is usually performed in fixed-bed reactors in upflow or downflown (trickling)<br />
mode. Clogging, a frequent problem in <strong>the</strong> early days, is countered with high hydraulic<br />
loads and facilities for cleaning. In The Ne<strong>the</strong>rlands, most systems currently operate at<br />
a low pH (5-6) which seems to be beneficial for fish growth but results in incomplete<br />
nitrification. In Denmark denitrification is applied in most farms, using methanol or<br />
sludge as a carbon source. Some farms are using chemical phosphorus removal as an<br />
end-of-pipe method. Methods for collection and treatment of waste water differ<br />
considerably according to differences in local regulations with regard to waste water.<br />
Technical (liquid) oxygen is applied in all cases.<br />
The ‘Blue Label project’; towards a certified environmental performance<br />
In 1998 ‘Hesy’, one of <strong>the</strong> largest producers of systems in <strong>the</strong> Ne<strong>the</strong>rlands, decided to<br />
evaluate its design of farms toge<strong>the</strong>r with a number of manufacturers of systemcomponents<br />
and research institutes. This idea was developed into an EU-sponsored<br />
project which started at <strong>the</strong> end of 1998 and will end in 2001. Participants in <strong>the</strong><br />
project are Hydrotech (microscreens), Distrimex (pumps), Hoekloos (Linde;<br />
oxygenation), van Cooten (eel farming), RIVO, DIFTA and IMAG. The aim of <strong>the</strong><br />
project was to:<br />
- develop an integrated recirculation system able to meet <strong>the</strong> strictest regulations<br />
concerning effluents in a certifiable way;<br />
- reduce <strong>the</strong> consumption of energy and water<br />
- develop a tool to calculate heat balances of farms in order to decide on options for<br />
cooling, heating and insulation.<br />
The technical objectives are to reduce consumption of water from 500 to 100 l per kg<br />
of fish produced and energy consumption from 10 to 6 kWh per kg produced. The<br />
final effluent should be within <strong>the</strong> limits mentioned below.<br />
Table 1. Water quality criteria for effluent from <strong>the</strong> ‘blue label’ system.<br />
Parameter In any 24-hour composite sample (mg/l)<br />
Biochemical oxygen demand (BOD5) < 20<br />
Chemical oxygen demand (COD)
of this pilot-system will be evaluated as a final milestone in <strong>the</strong> project. In this paper<br />
some of <strong>the</strong> results achieved sofar will be highlighted.<br />
System lay-out and design philosophy of <strong>the</strong> ‘Blue Label system’<br />
Formerly, <strong>the</strong> water treatment of <strong>the</strong> Hesy-system basically consisted of a microscreen<br />
filter (drum or disc) and a trickling filter. In most systems an upflow filter was<br />
incorporated for removal of small suspended solids. Denitrification was not applied<br />
standardly; oxygen was dissolved at a relatively high pressure of 1.3 bar. In figure 1<br />
<strong>the</strong> lay-out of <strong>the</strong> new system (Blue Label) is given.<br />
In <strong>the</strong> Blue Label system, denitrification is achieved in a moving bed biofilter fed with<br />
sludge from <strong>the</strong> disc filter and approximately 5% of <strong>the</strong> recirculating water flow. The<br />
effluent from this reactor is mixed with a flocculant and fed to a belt-filter which<br />
separates it into sludge and a clean water fraction. Part of this effluent, from which<br />
nitrate and phophorus are largely removed, is bled to a sewer. The main advantage of<br />
this system is that all treatment processes work continuously. Fluctuations in water<br />
quality by back-flushing of filters and <strong>the</strong> associated labour are much reduced this way.<br />
The oxygen reactor is re-designed and built in a sump in order to reduce pressure loss.<br />
The recirculating flow is increased.<br />
Figure 1. Lay-out of <strong>the</strong> Blue Label system<br />
9<br />
2<br />
5<br />
3<br />
Legend<br />
1 - Fish tanks 2 - Microscreen filter<br />
3 - Trickling filter 4 - Oxygen reactor<br />
5 - Denitrification reactor 6 - Belt filter<br />
7 - Storage sludge 8 - Sewer or surface water<br />
9 - UV-treatment<br />
The effect of mesh size on microscreen efficiency<br />
During a large scale feeding trial at DIFTA, three different mesh sizes (100, 60 and 30<br />
micron) were tested in a Hydrotech drum-filter for <strong>the</strong>ir effectiveness in removing<br />
suspended solids, COD, nitrogen and phosphorus. The water treatment in <strong>the</strong> system<br />
consisted of a drum-filter, two submerged biofilters, a trickling filter and a<br />
denitrification filter. In each experimental period of roughly three weeks a different<br />
3<br />
6<br />
4<br />
1<br />
7<br />
8
mesh was used. The system was stocked with eels of 40 grams and <strong>the</strong> daily feed load<br />
to <strong>the</strong> system was approximately 10 kg.<br />
Water consumption was measured routinely; at <strong>the</strong> end of each experimental period a<br />
mass-balance over <strong>the</strong> drum-filter was established by intensive sampling over 24-hour.<br />
The relative water consumption of <strong>the</strong> drum filter (expressed per kg of feed fed)<br />
increased during <strong>the</strong> experimental period with <strong>the</strong> 30 micron mesh but was stable with<br />
<strong>the</strong> o<strong>the</strong>r mesh sizes tested. Table 2 gives <strong>the</strong> results. Water consumption is<br />
significantly increased with smaller mesh size.<br />
Table 2. The average water consumption of a drum filter in stable conditions<br />
Mesh size (micron) 30 60 100<br />
Water consumption (l/kg feed) 239 106 75<br />
There are many ways in which <strong>the</strong> mass balance over <strong>the</strong> drum filter can be calculated<br />
and <strong>the</strong> efficiency expressed. The most straight-forward calculation of <strong>the</strong> efficiency is:<br />
(“in sludge” * 100) / ((“with feed” - (“in fish” + “respiration/excretion”))<br />
This efficiency is a measure of <strong>the</strong> fraction of particulate material, originating from<br />
feed loss and faeces, that is recovered in <strong>the</strong> sludge from <strong>the</strong> drum filter. Because <strong>the</strong><br />
drum-filter also catches bioflocs from <strong>the</strong> biological treatment, this figure has to be<br />
corrected for this contribution. Table 3 summarises <strong>the</strong> results.<br />
Table 3. The removal efficiency of a drum filter using 30, 60 or 100 micron mesh.<br />
Mesh size\substance Suspended<br />
solids<br />
COD Nitrogen Phosphorus<br />
30 micron 75% 62% 62% 43%<br />
60 micron 36% 36% 29% 39%<br />
100 micron 16% 13% 14% 20%<br />
Table 2 shows that <strong>the</strong>re is a significant effect of mesh size on removal efficiency of<br />
different substances. It is obvious that this effect has strong implications for <strong>the</strong> design<br />
of o<strong>the</strong>r parts of <strong>the</strong> water treatment which have to deal with <strong>the</strong> fraction that is not<br />
removed directly.<br />
The heat-balance of an eel farm<br />
The main idea behind recirculation of water in eel farming is to reduce costs for<br />
heating water. For this purpose, expensive well-insulated buildings are used which<br />
require a high productivity. Practical experience shows that in this type of building,<br />
cooling of water may become a problem when water consumption is reduced. In order<br />
to assess different options for insulation and energy-management in relation to climate,<br />
a simulation model was developed. The model ANIPRO has been developed for<br />
husbandry of livestock like pigs and chicken (van Ouwerkerk, 1999). A special module<br />
was added to simulate conditions for farming eel. The model uses information on<br />
climate, design of <strong>the</strong> building and system, feeding and feed utilisation to calculate a<br />
heat balance of <strong>the</strong> farm and <strong>the</strong> energy used (Figure 2). The model has been validated<br />
by measurements at two commercial eel farms.<br />
4
Figure 2. The main screen of <strong>the</strong> energy simulation model ANIPRO, giving access to<br />
o<strong>the</strong>r parts of <strong>the</strong> model.<br />
The main control strategy in <strong>the</strong> model is that at increasing outdoor temperatures <strong>the</strong><br />
ventilation is increased from minimum to maximum and that subsequently <strong>the</strong> water<br />
suppletion to <strong>the</strong> system is increased to reach <strong>the</strong> desired water temperature. One of<br />
<strong>the</strong> results of simulations with <strong>the</strong> model is that increasing ventilation through <strong>the</strong><br />
trickling filter by applying a larger fan is a very efficient option for temperature<br />
control. Depending on local conditions, alternative techniques can be used.<br />
Future developments<br />
Currently, a pilot-system with a production capacity of 25 tonnes of eel is being built<br />
according to <strong>the</strong> Blue Label principle. At <strong>the</strong> end of this year, <strong>the</strong> performance of this<br />
system will be evaluated. Apart from specific design of systems, interesting work<br />
remains to be done on design of buildings for farming fish.<br />
The example of <strong>the</strong> development of eel farming in Western Europe clearly shows that<br />
a main drive for system development is business opportunity for farming certain<br />
species in closed systems.<br />
References<br />
Gousset, B. “European eel (Anguilla anguilla) farming technologies in Europe and<br />
Japan: application of a comparative analysis”. Aquaculture 87 (1990): 209-235.<br />
Heinsbroek, L.T.N. and Kamstra. A. “ Design and performance of water recirculation<br />
systems for eel culture”. Aquacult. Eng. 9 (1990): 187-207.<br />
Ouwerkerk, E.N.J. van. “ANIPRO klimaat- en energiesimulatiesoftware voor stallen”.<br />
IMAG Internal Report V 99-109, Wageningen, 87 pp.<br />
5
Introduction<br />
Business Planning for Urban Aquaculture<br />
Lawrence D. Tagrin<br />
Turner, Harper & Associates, Inc.<br />
http://www.turnharp.com/<br />
Your business plan is a critical document in <strong>the</strong> development of a successful enterprise.<br />
The quality of your business plan may determine whe<strong>the</strong>r or not you get <strong>the</strong> financing you<br />
need in order to start or expand your business and whe<strong>the</strong>r or not you can manage your<br />
business for long-term success.<br />
Lenders or venture capital providers may not have significant knowledge of <strong>the</strong><br />
aquaculture business, but <strong>the</strong>y know how to read a business plan and judge from that plan<br />
<strong>the</strong> risk involved in providing <strong>the</strong> financial resources you need.<br />
Who will use your business plan?<br />
Rule Number 1: Understand who will read and use your business plan and write<br />
it accordingly.<br />
� Lenders will use <strong>the</strong> business plan as a major element in determining your eligibility for<br />
a loan<br />
� Venture capital providers will use <strong>the</strong> plan to determine if <strong>the</strong>y should invest in your<br />
enterprise<br />
� You and your executive staff will use <strong>the</strong> plan to provide a road map for your long<br />
term goals and immediate milestones which will let you know if you are on track to<br />
meet your goals.<br />
Questions answered by your business plan:<br />
The business plan answers a number of questions categorized as who, what, where, how,<br />
and when.<br />
Who:<br />
Who are you?<br />
Who will be running your business?<br />
Who are your customers?<br />
Who are your competitors?<br />
Who are your suppliers?<br />
1
What:<br />
What is your business structure?<br />
What are your (measurable) goals?<br />
What is <strong>the</strong> time span of this plan?<br />
What products and/or services will you offer?<br />
What of resources will you already have?<br />
What of resources will you need?<br />
Where:<br />
Where your business operate?<br />
Where are your customers located?<br />
Where are your competitors located?<br />
Where are your suppliers located?<br />
How:<br />
How will <strong>the</strong> business acquire <strong>the</strong> resources it needs?<br />
How will <strong>the</strong> business manage its finances?<br />
How will <strong>the</strong> business manage its o<strong>the</strong>r resources?<br />
How will <strong>the</strong> business manage its operations?<br />
When:<br />
When are <strong>the</strong> major decision points?<br />
When will <strong>the</strong> business be fully operational?<br />
When will it be profitable?<br />
Business Plan Structure:<br />
Following some boilerplate preliminary items (cover sheet, statement of purpose, table of<br />
contents), all business plans have three major sections; detailed information about <strong>the</strong><br />
business, financial data, and supporting documentation.<br />
Rule Number 2: Don't get creative with your business plan structure. Give <strong>the</strong><br />
users <strong>the</strong> kind of plan <strong>the</strong>y expect. It makes <strong>the</strong>m comfortable.<br />
The Business<br />
Rule Number 3: Let your enthusiasm for <strong>the</strong> business show through.<br />
In general, <strong>the</strong>re are a number of sections to this part of <strong>the</strong> business plan. I will use <strong>the</strong><br />
sections listed in <strong>the</strong> Small Business Administration's web site. Various pieces of business<br />
planning software will usually display a similar structure.<br />
2
A. Description of business<br />
This is a critical element to your plan. Just as a novelist has only a few pages (called "<strong>the</strong><br />
hood") in which to capture a reader's attention, you must make a positive impression in<br />
<strong>the</strong> first few pages or risk losing your audience. You already start off with <strong>the</strong><br />
disadvantage that <strong>the</strong> banker or potential investor you approach with your plan is probably<br />
not familiar with aquaculture, and even if <strong>the</strong>y are, <strong>the</strong>y are even less likely to be familiar<br />
with <strong>the</strong> concept of operating an aquaculture business in an urban center. You should<br />
briefly describe:<br />
• The legal form your business will take<br />
• Any licenses or permits you will need and how you will go about getting <strong>the</strong>m<br />
• Your products and/or services (i.e., fresh fish for <strong>the</strong> seafood trade, high quality<br />
ornamental fish for <strong>the</strong> pet shop trade, high quality fry for grow out by established<br />
aquaculture businesses).<br />
• Whe<strong>the</strong>r this is a new venture, an expansion of an existing business, or a franchise<br />
• A short list of reasons why your business will succeed.<br />
• Why you have chosen aquaculture as <strong>the</strong> business you wish to enter and what<br />
knowledge and skills you bring that apply to this field. Include both work experience<br />
and academic resources.<br />
Above all, show commitment and enthusiasm for <strong>the</strong> business in this section. This section<br />
is a sales pitch. While you may not enjoy writing <strong>the</strong> plan, unless your enthusiasm for <strong>the</strong><br />
venture shines through, you will have a hard time convincing someone to risk <strong>the</strong>ir<br />
finances backing you. If you are not a good writer, get professional help.<br />
B. Marketing and <strong>the</strong> Marketing Plan<br />
What are you selling and why (from <strong>the</strong> customer's perspective) should <strong>the</strong>y buy from<br />
you? This is what you must address in this section. Talk about <strong>the</strong> benefits you offer<br />
compared to your competition and how you will communicate those benefits to your<br />
customers.<br />
When dealing with Urban Aquaculture, you have <strong>the</strong> opportunity to sell to a broader<br />
spectrum of potential customers than more traditional fish farms do. A single business<br />
could provide:<br />
• Fresh seafood to grocery stores and restaurants, thus cutting out some of <strong>the</strong><br />
middlemen.<br />
• Fry and fingerlings to o<strong>the</strong>r aquaculture businesses for grow out.<br />
• High quality tropical fish and aquatic plants to local pet stores.<br />
• Direct specialty sales to <strong>the</strong> public.<br />
This should be a major point used to offset <strong>the</strong> potentially higher costs of operating a<br />
business in an urban center ra<strong>the</strong>r than a rural area. Access to this diverse marketplace<br />
3
should more than offset <strong>the</strong> costs of doing business in an urban center.<br />
Most growers in traditional aquaculture grow a single product and sell to a small number<br />
of customers. In <strong>the</strong> urban marketplace you have many more choices. This will require<br />
<strong>the</strong> development of a complete Marketing Plan which will cover a number of detailed<br />
topics. These include:<br />
1. Detailed descriptions of your customers, <strong>the</strong>ir requirements, and any cyclical factors<br />
which can be determined about <strong>the</strong> needs of those customers. If you are selling a variety<br />
of products, you will have to provide a separate section for each product segment.<br />
2. Data indicating <strong>the</strong> current and projected health of your markets. You must make <strong>the</strong><br />
case that your market will support you and that your potential market will remain large<br />
enough to support your desired business expansion.<br />
3. Your strategy for gaining market share, including your advertising and marketing<br />
channels.<br />
4. Your pricing strategy, which will take into account both your customers and your<br />
competition.<br />
5. Your Internet strategy. In today's world, all businesses must look at <strong>the</strong> Internet as a<br />
major marketing channel. If you can't answer <strong>the</strong> question "How will you use <strong>the</strong><br />
Internet?" you are ignoring a valuable resource.<br />
C. Competition<br />
You must take a realistic approach to your competition. Recognize that you have<br />
competitors and those competitors have <strong>the</strong> advantage of incumbency.<br />
In <strong>the</strong> urban marketplace you will be dealing with both local and remote competitors.<br />
Against each of <strong>the</strong>se groups you will have advantages and disadvantages, so be careful to<br />
differentiate your competitors by location, customer, and product. Try to develop a file<br />
on each major competitor and identify <strong>the</strong>ir strengths and weaknesses. Show how you<br />
will counter <strong>the</strong>ir strengths, exploit <strong>the</strong>ir weaknesses, and turn competition into an<br />
opportunity for your own enterprise. Attending conferences and obtaining price and<br />
product lists from your competitors is a good way to build your file on <strong>the</strong> competition.<br />
D. Operating procedures<br />
In order to convince potential lenders or investors that your business has a reasonable<br />
chance for success, you must show how your business will be run and that you have <strong>the</strong><br />
requisite knowledge and skills to operate <strong>the</strong> firm. Areas you will need to address include:<br />
• Your applicable business experience<br />
4
• Your weaknesses and how you will compensate for <strong>the</strong>m<br />
• A description of your management team and <strong>the</strong> abilities <strong>the</strong>y bring to <strong>the</strong> table<br />
• Your plans for compensating for <strong>the</strong> loss of a key individual<br />
• A clear description of <strong>the</strong> duties of each member of your management team<br />
E. Personnel<br />
In today's labor market, a staffing plan is an absolute necessity. You should be prepared<br />
to define:<br />
• The knowledge and skills you will need<br />
• How you will locate and hire <strong>the</strong> required staff<br />
• Your plans for properly adhering to all applicable labor regulations<br />
• Your employee training strategy<br />
• Your salary and benefits plan<br />
F. Business insurance<br />
You will need a number of types of insurance for your business. Some of <strong>the</strong>m are<br />
standard types of insurance, but o<strong>the</strong>rs, such as crop loss insurance, are more specialized.<br />
Financial data<br />
Rule Number 4: What impresses lenders are thoroughness, accuracy, and<br />
attention to detail.<br />
There are a number of financial documents you will need for a comprehensive business<br />
plan. Some of <strong>the</strong>m include:<br />
Loan applications<br />
Capital equipment and supply list<br />
Balance sheet<br />
Break-even analysis<br />
Projected profit & loss for three years<br />
Projected cash flow for three years<br />
Supporting documentation<br />
There are a number of additional documents you will need to compete your package.<br />
• Last three years of your tax returns and those of any partners<br />
• Personal financial statement (all banks have <strong>the</strong>se forms)<br />
• Copies of any legal documents referring to <strong>the</strong> facilities you intend to occupy<br />
• Copies of licenses and o<strong>the</strong>r legal documents<br />
• Resumes of all principals<br />
5
• Any o<strong>the</strong>r documents indicating agreements with suppliers, customers, etc...<br />
Finding Help With Business Planning:<br />
There are a number of web sites and pieces of software which may help you with this<br />
process. The following resources indicate help on <strong>the</strong> Internet:<br />
US Department of Commerce (DOC), Minority Business Development Agency (MBDA)<br />
Aquaculture Center<br />
http://www.mbda.gov/Virtual_Centers/Aquaculture/index.html<br />
DOC Economic Development Administration<br />
http://www.doc.gov/eda<br />
Small Business Administration Business Plans page<br />
http://www.sba.gov/starting/indexbusplans.html<br />
Planware business planning software and information site<br />
http://www.planware.org/<br />
Palo Alto Software<br />
http://www.palo-alto.com/<br />
Plan Magic Software<br />
http://www.planmagic.com/<br />
CCH Business Owner's Toolkit<br />
http://www.toolkit.cch.com/<br />
EntreWorld Resources for Entrepreneurs<br />
http://www.entreworld.com/<br />
6
Designing a Research Protocol for Economic and<br />
Financial Analysis Phase I<br />
Alice T. Spradlin, Undergraduate Ryan A<strong>the</strong>arn, Undergraduate<br />
Virginia Tech Agricultural and Applied Economics Virginia Tech Biology<br />
221 West Payne 1211 Progress St. Apt 7100B<br />
Blacksburg, VA 24060-0008 Blacksburg, VA 24060<br />
Dr. Charlie Coale, Professor 1<br />
Mark Kidd, Manager<br />
Virginia Tech Agricultural and Applied Economics Virginia Tech Aquaculture Center<br />
322 Hutcheson Hall 100 Cheatham Hall<br />
Blacksburg, VA 24060-0401 Blacksburg, VA 24060-0321<br />
Dr. George Libey, Associate Professor Dr. Greg Boardman, Professor<br />
Virginia Tech Fisheries and Wildlife Science Virginia Tech Civil and Environmental Engineering<br />
146 Cheatham Hall NEB 417<br />
Blacksburg, VA 24060-0321 Blacksburg, VA 24060<br />
Dr. George Flick, Univ. Distinguished Professor Dr. Stephen Smith, Associate Professor<br />
Virginia Tech Food Science and Technology Virginia Tech Biomed. Science and Pathobiology<br />
FST Building Room 25C Phase II Room 121College of Veterinary Medicine<br />
Blacksburg, VA 24060-0418 Blacksburg, VA 24060-0442<br />
Eric Herbst, Graduate Student Simonel Sandu, Graduate Student<br />
Virginia Tech Fisheries and Wildlife Science Virginia Tech Fisheries and Wildlife Science<br />
900-A Palmer Dr. 211 Pheasant Run Dr.<br />
Blacksburg, VA 24060 Blacksburg, VA 24060<br />
Introduction<br />
As <strong>the</strong> demand for fish and shellfish grows, pressure on natural or wild stocks becomes<br />
intense. Aquaculture, <strong>the</strong> husbandry of aquatic organisms, can provide a consistent<br />
supply of palatable, high quality protein, and relieve pressure on <strong>the</strong> harvesting of natural<br />
resources. Recirculating aquaculture systems are relatively new to <strong>the</strong> arena of<br />
commercial aquaculture production. Only within <strong>the</strong> last few years have <strong>the</strong>se systems<br />
proven to be economically competitive. To insure that usage of this method of fish<br />
production continues to expand, research on improving <strong>the</strong> efficiency of recirculating<br />
aquaculture firms is needed.<br />
The purpose of this project is to provide economic and financial protocols for aquaculture<br />
research projects at Virginia Tech. This will allow physical data to be collected in a<br />
manner that facilitates subsequent financial and economic evaluation of <strong>the</strong> research upon<br />
its completion.<br />
Specific objectives are to identify (<strong>the</strong> type and form) physical data that can be measured<br />
in typical aquaculture production projects and to match those data sets with <strong>the</strong> type and<br />
form needed for economic and financial analysis of <strong>the</strong> results from typical aquaculture<br />
1 Please use Dr. Charlie Coale as <strong>the</strong> principal contact for information concerning this particular project.<br />
1
production projects. Once <strong>the</strong>se parameters are established, <strong>the</strong> project will proceed to<br />
design financial and economic protocols for typical aquaculture projects that enhance <strong>the</strong><br />
transfer of information from <strong>the</strong> research phase to <strong>the</strong> industry in <strong>the</strong> form of an<br />
economic analysis of <strong>the</strong> results obtained.<br />
Virginia Tech has established one of <strong>the</strong> world’s premier centers for research on<br />
recirculating aquaculture. Much of <strong>the</strong> work conducted at <strong>the</strong> center is focused on<br />
improving <strong>the</strong> probability of success of firms using recirculating aquaculture technology.<br />
Any given project may be associated with several different objectives. For example, a test<br />
of a new biofilter configuration may involve students examining <strong>the</strong> efficiency of <strong>the</strong><br />
biofilter performance while o<strong>the</strong>r students are involved with evaluation of <strong>the</strong> candidate<br />
species being grown in <strong>the</strong> system. Additional students may be involved in monitoring<br />
and maintaining <strong>the</strong> health of <strong>the</strong> fish during <strong>the</strong> test while still o<strong>the</strong>rs may be conducting<br />
research on water chemistry and effluent makeup. As you can see <strong>the</strong> variety of research<br />
possibilities produces a wealth of data. Most of this data is relevant to <strong>the</strong> economics of<br />
<strong>the</strong> operation. The goal of <strong>the</strong> researcher should be to make <strong>the</strong> data applicable not only<br />
in a research setting, but in an industry setting as well. This will allow <strong>the</strong> data to be<br />
utilized to its fullest potential.<br />
A standard set of economic and financial protocols for data collection would greatly<br />
enhance <strong>the</strong> process of translating generated results into business terms. We propose to<br />
examine <strong>the</strong> prototypical physical data generated by research projects, enumerate <strong>the</strong> data<br />
required for economic and financial analyses, and derive a set of protocols that would<br />
allow <strong>the</strong> physical data generated to be quickly and easily translated to an economic and<br />
financial analysis.<br />
Spreadsheet templates will be generated into which <strong>the</strong> physical data from research can<br />
be entered into a computer and applied. Micro economic and financial management<br />
principles will be applied to <strong>the</strong> aquaculture models for structuring spreadsheet analyses.<br />
The spreadsheet display clarifies and answers <strong>the</strong> economic questions by illustrating<br />
resulting budgets, unit cost, cash flow and operating statements, and balance sheets.<br />
Fur<strong>the</strong>r, <strong>the</strong> application of ratio analysis will show <strong>the</strong> relationship of a particular study to<br />
obtainable results from o<strong>the</strong>r fish and shellfish industries.<br />
The availability of economic and financial analysis based on solid scientific research will<br />
enable aquaculture entrepreneurs to better judge <strong>the</strong> potential economic benefits to be<br />
gained from various practices and equipment changes suggested by research conducted at<br />
Virginia Tech and everywhere else as well.<br />
Physical Relationships of <strong>the</strong> Recirculating System<br />
The following is a description of a recirculating system where <strong>the</strong> main purpose is to<br />
provide a healthy environment for fish while maintaining a way to minimize <strong>the</strong> total<br />
amount of water consumed by recirculation.<br />
2
Each recirculating system contains a series of grow-out tanks, a biofiltration vessel, a<br />
microscreen drum filter, an airlift distribution manifold, an airlift pump, biofilters, a<br />
regenerative blower, a vacuum line, air lines, a discharge pipe, and a supply of fresh<br />
water. There are four complete recirculating systems within <strong>the</strong> project's physical design.<br />
Each recirculating system consists of two grow-out tanks, which are 20 feet long, 5 feet<br />
wide, and 3.3 feet deep. Each of <strong>the</strong>se grow-out tanks holds 2468 gallons (9342 liters) of<br />
water.<br />
There is one biofilter vessel in each recirculating system. The biofilter vessel is 22 feet<br />
long, 2 feet wide, and 2.25 feet deep. The vessel holds 740 gallons (2802 liters) of water<br />
and contains <strong>the</strong> filtration equipment.<br />
The microscreen drumfilter is 22 inches in diameter covered with a 120M stainless steel<br />
mesh screen. It contains a 10 inch diameter outlet pipe, stainless steel frame, vacuum<br />
suction head, and a 120 volt gearmotor. The microscreen drum filter removes solids<br />
from <strong>the</strong> water.<br />
There is one airlift distribution manifold, also called an airlift header, per recirculating<br />
system. Each airlift distribution manifold contains one 6 inch PVC (poly vinyl chloride)<br />
pipe and one 6-inch in PVC tee. Each airlift tube provides 25 GPM (gallons per minute)<br />
of water. The airlift distribution manifold distributes water to <strong>the</strong> eight airlift pumps.<br />
Each airlift pump uses 3 cubic feet of air per minute. Each airlift pump consists of eight<br />
PVC airlift tubes that are 2 inches wide and 30 inches long with 2 inch PVC long-sweep<br />
elbows, plastic, PVC pipes that pump <strong>the</strong> water. The airlift pumps move 200 gallons per<br />
minute of water per tank. The airlift pumps lift <strong>the</strong> water, carrying <strong>the</strong> water from <strong>the</strong><br />
distribution manifold, returning it from <strong>the</strong> filtration area to <strong>the</strong> grow out tank.<br />
There are four biofilters (rotating biological contactors or RBC) in a recirculating system.<br />
Each biofilter is 4 feet in diameter and 20 inches wide. The corrugated surfaces of each<br />
RBC provide a surface area of approximately 1500 square feet. The biofilters provide<br />
surfaces for nitrogen-fixing bacteria, which convert ammoniacal metabolic wastes to<br />
nitrite and <strong>the</strong>n to harmless nitrate.<br />
Two regenerative blowers are required for <strong>the</strong> four recirculating systems. Each<br />
regenerative blower has 1.5 horsepower and 96 Standard Cubic Feet per Minute (SCFM)<br />
at 30 inches of water. The regenerative blower produces energy that moves <strong>the</strong> water<br />
through <strong>the</strong> airlift pumps.<br />
Each recirculating system has one vacuum line. The vacuum line uses <strong>the</strong> inlet port of<br />
<strong>the</strong> regenerative blower to provide suction for <strong>the</strong> microscreen drum filter vacuum head.<br />
Two separate air lines are in each recirculating system. The air lines provide pressurized<br />
air from <strong>the</strong> regenerative blower to <strong>the</strong> airlift tubes and to <strong>the</strong> RBC’s.<br />
3
A single discharge pipe works to remove effluent from <strong>the</strong> microscreen drum filter<br />
vacuum head and discharges <strong>the</strong> waste into <strong>the</strong> sewer system. The fresh water supply<br />
line is used for water replacement.<br />
The pilot-scale project includes four Low Head Recirculating Aquaculture Systems<br />
(LHRAS). Each system consists of two grow-out tanks and one filtration vessel (See<br />
Figure 1 LHRAS). Water flows from each grow-out tank through an 8 inch diameter<br />
PVC pipe into <strong>the</strong> first section of <strong>the</strong> filtration vessel. The first section of <strong>the</strong> filtration<br />
vessel contains a 120 micron microscreen drumfilter. The microscreen drumfilter<br />
removes solid waste (i.e: feces and uneaten feed) from <strong>the</strong> system water. The waste<br />
material collected by <strong>the</strong> microscreen drumfilter is lifted by a vacuum head and <strong>the</strong>n<br />
transferred to a sewer line. The water <strong>the</strong>n flows into <strong>the</strong> second section of <strong>the</strong> filtration<br />
vessel after <strong>the</strong> solid waste removal. This section contains four Rotating Biological<br />
Contactors (RBC). RBC’s use nitrifying bacteria to convert toxic metabolic fish waste<br />
(ammonia) to a non-toxic form (nitrate). The filtered water <strong>the</strong>n moves through a 6 inch<br />
FIGURE 1: Top View of <strong>the</strong> Low Head Recirculating Aquaculture System<br />
Growout<br />
tank<br />
Fresh water<br />
supply<br />
6-inch pipe<br />
8-inch<br />
pipe<br />
Biofilter vessel<br />
Microscreen drum filter<br />
4<br />
Airlift header w/ 8 airlifts pumps<br />
Vacuum line<br />
Biofilter (4)<br />
Discharge pipe<br />
Air lines<br />
Regenerative blower
PVC pipe to eight 2 inch diameter airlift pumps. The airlift pumps lift <strong>the</strong> water from <strong>the</strong><br />
biofilter vessel into <strong>the</strong> grow-out tanks. Each airlift pump provides 25 gallons of water<br />
per minute for a flow rate of 200 GPM’s per tank. The airlift pumps also add oxygen to<br />
<strong>the</strong> water and remove carbon dioxide. All of <strong>the</strong> system water passes through <strong>the</strong><br />
filtration vessel six times per hour.<br />
The water recirculation occurs simultaneously in opposite directions through <strong>the</strong> filter<br />
tank and both grow-out tanks. Water is constantly being recirculated by moving through<br />
<strong>the</strong> biofilter vessel and both grow out tanks.<br />
Standard Operating Procedures<br />
Standard Operating Procedures for <strong>the</strong> Virginia Tech Aquaculture Center will be used to<br />
evaluate <strong>the</strong> procedures and help those who work in <strong>the</strong> facility to train o<strong>the</strong>rs. These<br />
procedures are used in most industries to keep <strong>the</strong> different processes working efficiently.<br />
Standard Operating Procedures are usually written by individual processing plants and<br />
facilities to meet <strong>the</strong> particular needs of those using <strong>the</strong> procedures.<br />
Standard Operating Procedures are used to standardize <strong>the</strong> procedures used within any<br />
physical plant. These standard operating procedures are important because <strong>the</strong>y provide<br />
any facility with regular, systematic procedures. These procedures help in avoiding<br />
research, production, or safety emergencies within <strong>the</strong> facility.<br />
1. Prechecks<br />
1.1. Test water supply (both quality and quantity) by obtaining samples of all water<br />
sources (municipal, well, spring, surface) and sending <strong>the</strong>se samples to certified<br />
laboratories for testing. These laboratories can be found by speaking with a<br />
county agent. The water supply should be tested every 1 to 2 years.<br />
1.2. Check utilities and drainage situation, site preparation.<br />
1.3. Investigate and obtain any necessary federal or state permits by contacting state<br />
aquacultural extension personnel and Game and Inland Fisheries Department for<br />
requirements.<br />
1.4. Choose particular species for specific environment and document <strong>the</strong> temperature<br />
for fingerlings. This must be decided by declaring which species (which can be<br />
obtained by doing a literature search) will meet <strong>the</strong> objectives of <strong>the</strong> research.<br />
1.4.1 Change species depending on availability.<br />
This information needs to be documented and kept on record.<br />
1.4.2 Ensure supplier certification.<br />
This information needs to be documented and kept on record.<br />
1.5. Analyze tank space and water volume, which can be accomplished once for <strong>the</strong><br />
entire system, by measuring <strong>the</strong> physical dimensions of <strong>the</strong> tanks. It is important<br />
to decide <strong>the</strong> appropriate volume for <strong>the</strong> tank shape.<br />
1.6. Check system capacity.<br />
1.6.1. Calculate <strong>the</strong> stocking density which is <strong>the</strong> weight of fish per volume unit<br />
of water (lbs/gallon). Stocking densities are dependent upon two factors:<br />
5
1. Oxygen recharge rates or <strong>the</strong> ability of <strong>the</strong> culture system to add<br />
oxygen back to <strong>the</strong> water per unit of time (mg O2/gal/sec).<br />
2. The oxygen consumption rate per unit weight of fish (mg O2/pound of<br />
fish/sec).<br />
When <strong>the</strong> ratio of factor 2 to factor 1 is equal to 1, <strong>the</strong>re is a maximum<br />
stocking density of pounds of fish per gallon. Also note that oxygen<br />
consumption rates are dependent upon species and fish size.<br />
1.6.2. Check <strong>the</strong> oxygen recharge rates. Investigate oxygen recharge rates by<br />
using standard methods to determine units of oxygen added to system per<br />
unit of time. This is helpful in determining stocking densities.<br />
1.6.3. Check <strong>the</strong> feeding rates.<br />
1.6.4. Check <strong>the</strong> filtering capacity and analyze <strong>the</strong> solids removal capacity.<br />
1.7. Perform hydrodynamic testing.<br />
1.7.1. Perform <strong>the</strong> flow test (gallons per minute / gpm): this should be done once<br />
on a new system and can be accomplished by measuring <strong>the</strong> water velocity<br />
through a pipe, measuring <strong>the</strong> outflow of a pipe or pump, or by water<br />
draw-down.<br />
1.7.2. Test for leaks and repair those leaks once on a new system.<br />
1.7.3. Perform <strong>the</strong> dye test. This is done by adding dye to <strong>the</strong> water at only one<br />
point and observing how <strong>the</strong> dye moves through <strong>the</strong> system. This is used<br />
to determine flow patterns of water through a particular system (called <strong>the</strong><br />
water mixing patterns). This test should be done once on a new system.<br />
1.8. Acclimate <strong>the</strong> biofilters to assure <strong>the</strong> nitrification process is occurring by adding<br />
an ammonia source to each system and recording <strong>the</strong> TAN, NO2, and NO3<br />
concentrations.<br />
1.9. Check feed.<br />
1.9.1. Investigate feed composition for particular species by a literature search<br />
or inter-personal communication.<br />
1.9.2. Determine <strong>the</strong> ordering schedule, amount, and source for feed supply.<br />
These decisions may depend on bulk or bag feed.<br />
1.10. Establish parameters for water quality by doing a literature search for<br />
species requirements.<br />
1.11. Take inventory of and test analytical equipment with standard solutions<br />
and obtain required reagents. Obtain additional equipment if needed.<br />
1.12. Take inventory of emergency equipment. Obtain additional equipment if<br />
needed.<br />
1.12.1. Develop a chemical and emergency action plan.<br />
1.12.1.1. Develop a chemical hygiene plan.<br />
1.12.1.2. Develop an emergency escape route.<br />
1.12.1.3. Develop an emergency lighting system.<br />
1.12.2. Install a generator and test it regularly.<br />
1.12.3. Install a fire extinguisher.<br />
1.12.4. Install a first aid kit.<br />
1.13. Use approved chemo<strong>the</strong>rapuetics. These drugs and chemicals used in <strong>the</strong><br />
treatment of fish diseases should be researched for <strong>the</strong> particular species.<br />
6
This information should be obtained through a literature search and<br />
contact aquatic medical specialist.<br />
1.14. Conduct hazard analysis and develop Hazard Analysis and Critical<br />
Control Point plan (HACCP) to keep research facility clean and disease or<br />
pathogen free.<br />
1.15. Develop marketing plan for fish.<br />
1.16. Develop waste disposal plan.<br />
1.17. Install and test alarm system.<br />
1.17.1. Install and test pumps.<br />
1.17.2. Install and test o<strong>the</strong>r equipment.<br />
2. System Operations<br />
2.1. Visit supply sites to analyze fish health and to ensure <strong>the</strong> quality and integrity of<br />
supplier.<br />
2.2. Purchase eggs, fry, and genetic strains from a disease and pathogen free,<br />
reputable supplier. The source of <strong>the</strong>se purchases needs to be documented; and<br />
this documentation can be provided by <strong>the</strong> supplier. The suppliers will be<br />
different for each species.<br />
2.3. Obtain sample fish from delivery truck for examination by aquatic medicine lab.<br />
Have fish analyzed for a widespread number of diseases.<br />
2.4. Quarantine stock for 45 to 60 days to ensure no health hazards to facility.<br />
2.5. Hatch eggs (if not using fingerlings).<br />
2.6. Stock tank.<br />
2.6.1. Record <strong>the</strong> size and number of count going in.<br />
2.7. Perform periodic tasks.<br />
2.7.1. Obtain feed sample and store batches for examination of composition for<br />
hazards such as aflatoxins only if a problem arises with fish by observing<br />
<strong>the</strong>ir behavior.<br />
2.7.2. Check waste discharge.<br />
2.7.3. Perform harvesting.<br />
2.7.4. Perform sampling.<br />
2.7.5. Ship sample to veterinary offices for health analysis. Six fish should be<br />
sampled every month and sent for testing of diseases, infections, and<br />
health hazards. There should be histological, bacteriological, virological,<br />
and biological testing done on <strong>the</strong> samples.<br />
2.7.6. Enter data from hard copy (paper) into <strong>the</strong> computer system.<br />
2.7.7. Analyze solids and record data.<br />
2.7.8. Wash RBC monthly.<br />
2.8. Perform <strong>the</strong> general tasks.<br />
2.8.1. Perform visual examinations and record data.<br />
2.8.1.1. Examine <strong>the</strong> water level.<br />
2.8.1.2. Examine <strong>the</strong> pump operations.<br />
2.8.1.3. Run biofilter.<br />
2.8.1.4. Remove dead fish.<br />
2.9. Analyze water chemistry and record data.<br />
2.9.1. Perform daily tests.<br />
2.9.1.1. Measure pH.<br />
7
2.9.1.2. Measure ammonia.<br />
2.9.1.3. Measure temperature.<br />
2.9.1.4. Measure dissolved oxygen.<br />
2.9.2. Perform bi-weekly tests.<br />
2.9.2.1. Measure nitrates.<br />
2.9.2.2. Measure nitrites.<br />
2.9.2.3. Measure hardness.<br />
2.9.2.4. Measure alkalinity.<br />
2.10. Perform feeding and record data.<br />
2.10.1. Check label to ensure proper feed for species.<br />
2.10.2. Determine <strong>the</strong> pre-weight of feed and record.<br />
2.10.3. Administer feed.<br />
2.10.3.1. Determine feeding behavior. This information should be observed<br />
by a trained individual and recorded.<br />
2.10.3.2. Remove uneaten feed.<br />
2.10.3.3. Determine <strong>the</strong> post-weight of feed and record <strong>the</strong> amount of feed<br />
that was consumed by subtracting post-weight feed from preweight<br />
feed.<br />
2.11. Perform preventative maintenance.<br />
2.11.1. Perform daily maintenance.<br />
2.11.1.1. Flush vacuum filters.<br />
2.11.1.2. Wash screens.<br />
2.11.1.3. Clean tank lip (ledges of walls).<br />
2.11.1.4. Top up tank.<br />
2.11.2. Perform weekly maintenance.<br />
2.11.2.1. Clean tank walls.<br />
2.11.2.2. Clean intake screens as needed.<br />
2.12. Perform days end tasks.<br />
2.12.1. Perform ano<strong>the</strong>r visual inspection and record observations.<br />
2.12.2. Control lighting for fish environment.<br />
2.13. Measure <strong>the</strong> inputs into system.<br />
2.13.1. Measure <strong>the</strong> electricity used by all equipment.<br />
2.13.2. Measure water used.<br />
2.13.3. Measure labor used.<br />
2.13.3.1. Measure it daily.<br />
2.13.3.2. Measure it weekly.<br />
2.13.3.3. Measure it monthly.<br />
2.13.3.4. Calculate it yearly.<br />
2.14. Define and measure management.<br />
2.14.1. Measure it daily.<br />
2.14.2. Measure it weekly.<br />
2.14.3. Measure it monthly.<br />
2.14.4. Calculate it yearly.<br />
This manuscript is a work in progress and will not be complete until all three parts of <strong>the</strong><br />
project are finished. An additional paper will be written to include <strong>the</strong> final part of <strong>the</strong><br />
8
project which is <strong>the</strong> data collection and analysis. These final parts will draw conclusions<br />
about <strong>the</strong> entire project and describe how <strong>the</strong> recirculating system’s physical plant,<br />
standard operating procedures, and data collection and analysis are pieced toge<strong>the</strong>r to<br />
make a profitable system to grow fish, save water, and sustain <strong>the</strong> environment.<br />
In summary, it is critical to success that operators of a recirculating aquaculture system<br />
plan and outline <strong>the</strong>ir financial and operational processes. Management and employees<br />
must follow <strong>the</strong> established protocols and fine-tune <strong>the</strong>m as <strong>the</strong> operation grows and<br />
prospers.<br />
A Glossary of Terms Used<br />
Airlift distribution manifold (airlift header)<br />
Number used within each system: 1<br />
Equipment and dimensions: 1 6-inch PVC pipe, 1 6-inch in PVC tee<br />
Capacity: 25 gallons per minute.<br />
Purpose: To distribute water to <strong>the</strong> airlift pumps.<br />
Airlift pump<br />
Number used within each system: 8<br />
Equipment and dimensions: 8 PVC airlift tubes (2 inches wide and 30 inches long) and 2inch<br />
PVC elbows.<br />
Capacity: 3 cubic feet per minute or air and 200 gallons per minute per tank of water, 25<br />
gallons per minute.<br />
Purpose: To lift <strong>the</strong> water from <strong>the</strong> distribution manifold to <strong>the</strong> grow out tank.<br />
Air line<br />
Number used within each system: 2<br />
Purpose: To provide pressurized air from <strong>the</strong> regenerative blower to <strong>the</strong> airlift tubes and<br />
also to <strong>the</strong> RBC’s.<br />
Biofilter<br />
Number used within each system: 4<br />
Dimensions: 4 feet in diameter and 20 inches wide.<br />
Capacity: 1500 square feet in surface area per RBC.<br />
Purpose: To convert <strong>the</strong> metabolic waste known as ammonia to nitrite and <strong>the</strong>n nitrate.<br />
Biofilter vessel<br />
Number used within each system: 1<br />
Dimensions: 22 feet long, 2 feet wide, and 2.25 feet deep.<br />
Capacity: 740 gallons (2802 liters) of water.<br />
Purpose: To contain <strong>the</strong> filtration equipment.<br />
9
Discharge pipe<br />
Number used within each system: 1<br />
Purpose: To remove effluent from <strong>the</strong> drum filter vacuum head and discharge <strong>the</strong> waste<br />
into <strong>the</strong> sewer system.<br />
Grow out tank<br />
Number used within each system: 2<br />
Dimensions: 20 feet long, 5 feet wide, and 3.3 feet deep.<br />
Capacity: 2468 gallons (9342 liters) of water.<br />
Purpose: To contain and hold <strong>the</strong> water and <strong>the</strong> fish.<br />
Microscreen drumfilter<br />
Number used within each system: 1<br />
Equipment and Dimensions: 22 inch diameter drum with 120 micron stainless steel mesh<br />
screen, 10 inch diameter outlet pipe, a stainless steel frame, a vacuum suction head, and a<br />
120 volt gearmotor.<br />
Purpose: To contain and hold <strong>the</strong> water and fish.<br />
Regenerative blower<br />
Number used within each system: 2<br />
Capacity: 1.5 horsepower and 96 SCFM at 30 inches of water per blower (533 gpm/hp).<br />
Purpose: To produce energy that moves <strong>the</strong> water through <strong>the</strong> airlift pumps.<br />
Vacuum line<br />
Number used within each system: 1<br />
Purpose: Uses <strong>the</strong> inlet port of <strong>the</strong> regenerative blower to provide suction for <strong>the</strong><br />
microscreen drum filter vacuum head.<br />
10
Economic Viability of an Aquaculture Producer/Processor<br />
Coop (APPC) in a North Central Location<br />
Patrick D. O'Rourke, Kerry Tudor, Patrick Foley<br />
Illinois State University<br />
Department of Agriculture<br />
Campus Box 5020<br />
Normal, IL 61709-5020<br />
porourke@ilstu.edu<br />
www.ilstu.edu<br />
With this project and this report researchers evaluate <strong>the</strong> potential economic<br />
viability of an aquaculture producer/processor cooperative, here referred to as <strong>the</strong><br />
APPC. The project is focused on a new APPC in Illinois, which has <strong>the</strong> distinction of<br />
being specifically authorized by state legislation and allocated substantial state sales tax<br />
revenues to support it. This project identifies and evaluates <strong>the</strong> issues important to new<br />
or improved cooperative business approaches for solving farmer-producer problems such<br />
as those <strong>the</strong> APPC might face.<br />
A primary objective was to develop an operational and financial computer based<br />
simulation model of <strong>the</strong> APPC to evaluate alternative economic viability scenarios for <strong>the</strong><br />
APPC and similar cooperative ventures. A goal of this research was to ascertain <strong>the</strong> most<br />
likely of <strong>the</strong> possible future scenarios for <strong>the</strong> APPC, taking into consideration <strong>the</strong> natural<br />
endowments, market opportunities, and constraints on production and processing <strong>the</strong><br />
APPC might face. The results may be helpful to current and potential farmers as <strong>the</strong>y<br />
look for ways to diversify, develop "value added" options and, in o<strong>the</strong>r ways, attempt to<br />
improve <strong>the</strong>ir survivability in an increasingly competitive, global and industrial<br />
agriculture industry and market.<br />
The simulation model may assist aquaculture producer/processor cooperative<br />
ventures as <strong>the</strong>y plan and as <strong>the</strong>y evaluate <strong>the</strong>ir organization’s potential economic<br />
viability in a North Central location or o<strong>the</strong>r areas of <strong>the</strong> country with similar natural<br />
endowments as well as market opportunities and constraints on aquaculture production<br />
and processing.<br />
Historically, <strong>the</strong> size of <strong>the</strong> fish farming or aquaculture producer industry in<br />
Illinois has been difficult to measure with any degree of accuracy. The first detailed<br />
Agriculture Census data on aquaculture producers in Illinois was published in February<br />
of this year. The Census of Aquaculture – 1998 reported 20 farms in Illinois sold<br />
aquaculture products with a total value of $2,871,000. Sixteen of those farms reported<br />
selling food fish with a total value of $1,546,000.<br />
1
Previous efforts by <strong>the</strong> Illinois Department of Agriculture and <strong>the</strong> North Central<br />
Regional Aquaculture Center to describe commercial aquaculture production in Illinois<br />
also indicated that it involved a small number of producers and limited volume of<br />
commercial fish production. Additional production, most likely in <strong>the</strong> sou<strong>the</strong>rn part of <strong>the</strong><br />
region, may be necessary to support <strong>the</strong> economic viability of an APPC of commercial<br />
scale.<br />
2
Economics of Shrimp Culture in a Freshwater<br />
Recirculating Aquaculture System<br />
Peter Van Wyk<br />
Research Associate<br />
Harbor Branch Oceanographic Institution<br />
5600 Highway US1 N<br />
Ft. Pierce, FL 34946<br />
A series of commercial-scale production trials were carried out at Harbor Branch<br />
Oceanographic Institution (HBOI) over a one-year period to develop information on <strong>the</strong><br />
production parameters and costs associated with <strong>the</strong> production of Penaeus vannamei in a<br />
recirculating aquaculture system. These data were used to develop an economic model to<br />
analyze <strong>the</strong> commercial feasibility of producing shrimp in systems based on <strong>the</strong> designs<br />
developed at Harbor Branch.<br />
A 10-year cash flow analysis was developed for a hypo<strong>the</strong>tical commercial shrimp<br />
production facility using data ga<strong>the</strong>red from a prototype system operated by Harbor<br />
Branch. The hypo<strong>the</strong>tical commercial shrimp production facility consisted of twelve<br />
greenhouses, an acclimation/quarantine building, storage shed for feed and equipment,<br />
well and water pretreatment systems, and wastewater retention ponds. A twelvegreenhouse<br />
facility was modeled because this is <strong>the</strong> minimum facility size that could<br />
utilize a truckload of feed (20 tons) within <strong>the</strong> three-month shelf life of <strong>the</strong> feed.<br />
System Description and Capital Requirements<br />
The model assumed production takes place in a three-phase production system. In <strong>the</strong><br />
three-phase systems <strong>the</strong> culture period was divided evenly into 60-day nursery,<br />
intermediate, and final growout phases. The culture tank was partitioned into three<br />
sections with 10% of <strong>the</strong> area allotted to <strong>the</strong> nursery phase, 30% to <strong>the</strong> intermediate<br />
phase, and 60% to <strong>the</strong> final growout phase. Annual productivity in three-phase<br />
production systems averaged 1.7 times <strong>the</strong> productivity of single-phase systems in <strong>the</strong><br />
production trials carried out at Harbor Branch (Van Wyk, 2000). Construction and<br />
operating costs associated with <strong>the</strong> three-phase system were only marginally higher than<br />
for <strong>the</strong> single-phase system.<br />
Each of <strong>the</strong> greenhouses in <strong>the</strong> hypo<strong>the</strong>tical facility measures 9.15 m x 45.75 m and<br />
contains two three-phase production systems (188 m 2 ). The culture tanks consist of a<br />
wooden frame supporting a black high-density 30-mil polyethylene liner and are set up in<br />
a racetrack configuration in which water is circulated around a center divider baffle.<br />
Shrimp are transferred between sections through 4" bulkhead fittings. The sections are<br />
stair-stepped to provide <strong>the</strong> elevation differences necessary for <strong>the</strong> shrimp to be<br />
transferred between sections by gravity.<br />
Each three-phase culture tank is provided with a solids filter and a biofilter. The solids<br />
filter consists of a 1,000 L cylindro-conical tank filled with 0.5 m 3 of Kaldnes biofilter<br />
1
media. The water enters <strong>the</strong> filter near <strong>the</strong> bottom and flows up through static bed of<br />
filter media and exits by gravity through a slotted pipe near <strong>the</strong> water surface. The filtered<br />
water flows from <strong>the</strong> solids filter by gravity into a moving bed biofilter containing 1.0 m 3<br />
of <strong>the</strong> Kaldnes biofilter media. A 1.25-hp low-head centrifugal pump returns water to <strong>the</strong><br />
culture tank. A more complete description of <strong>the</strong> system can be found in Van Wyk<br />
(2000).<br />
The initial capital investment required to purchase <strong>the</strong> land and build <strong>the</strong> facility was<br />
$533,500. An additional $212,500 must be spent over <strong>the</strong> ten year life of <strong>the</strong> project to<br />
replace worn out equipment. The model assumed <strong>the</strong> facility was built over a three-year<br />
period, with four greenhouses put into production in each of <strong>the</strong> first three years of <strong>the</strong><br />
project. Each greenhouse cost approximately $35,000 to set up. This included <strong>the</strong> cost of<br />
<strong>the</strong> site preparation, greenhouse kit, construction labor, electrical installation, tanks,<br />
filtration equipment and a blower. The well and well water pretreatment system<br />
consisting of a degassing tower, biofilter, blowers, pumps, and water storage reservoirs<br />
cost approximately $22,000. Capital costs are summarized in Table 1.<br />
Table 1: Summary of capital requirements for a hypo<strong>the</strong>tical 12-greenhouse facility.<br />
Category Year 1 Year 2 Year 3 Years 4-10<br />
Agricultural Land $25,000 $ 0 $ 0 $ 0<br />
Buildings & Improvements $92,880 $84,380 $84,380 $60,000<br />
Tanks & Filtration Equipment $50,300 $46,800 $38,300 $21,600<br />
Machinery & Equipment $51,496 $28,846 $26,263 $127,520<br />
Office & Office Equipment $4,850 $ 0 $ 0 $3,350<br />
Total Investment $224,526 $160,026 $148,943 $212,470<br />
Production and Marketing Assumptions<br />
The values used for key production parameters defining <strong>the</strong> performance of <strong>the</strong> system<br />
were based upon averages from <strong>the</strong> five three-phase production trials carried out in HBOI<br />
in 1999. Table 2 summarizes <strong>the</strong> key production assumptions.<br />
Seed, feed, energy, and labor accounted for about 75% of <strong>the</strong> operating costs. Seed costs<br />
accounted for 18% of <strong>the</strong> total operating cost. The model assumed specific pathogen free<br />
(SPF) postlarvae were purchased at a price of $10/1000 PLs. Postlarvae were held in a<br />
quarantine/acclimation facility for one week, during which time <strong>the</strong>y were acclimated to<br />
freshwater at a cost of $2.61/1000 PLs, assuming a survival of 85% in <strong>the</strong> acclimation<br />
system. Feed costs represented about 20% of all operating costs. A 35% protein grower<br />
pellet costs $0.30/lb delivered when purchased by <strong>the</strong> truckload. Labor and energy costs<br />
each accounted for about 19% of total operating costs.<br />
2
Table 2: Key production parameters<br />
Item Nursery Intermediate Final<br />
Number of Days to Transfer or Harvest 60 60 60<br />
Acclimation Survival 85%<br />
Percent Survival - Phase (%) 80% 85% 90%<br />
Percent Survival - Overall (%) 80% 68% 61%<br />
Stocking Density (shrimp/m 2 ) 1,351 348 150<br />
Harvest Density (shrimp/m 2 ) 1,081 296 135<br />
Harvest Densitu (kg/m 3 ) 1.68 2.43 2.46<br />
Total Weight Harvested/Crop (kg) 29 137 271<br />
Feed Conversion Ratio 1.72 1.77 1.76<br />
The final phase of each culture tank was harvested six times per year, yielding an average<br />
of 271 kg/crop of 18 gram shrimp. In Years 4-10, when all 12 greenhouses were in<br />
production, <strong>the</strong> total annual production averaged nearly 39,000 kg/year (86,000 lbs/year).<br />
The total production cost per pound of shrimp was estimated to be $4.27/lb. Production<br />
costs were relatively high because recirculating systems are more capital-, energy-, and<br />
labor-intensive than semi-intensive pond production systems in <strong>the</strong> tropics. Because of<br />
this fact, shrimp produced in recirculating production systems can not compete directly<br />
with foreign-produced shrimp on <strong>the</strong> wholesale frozen tail market. Ra<strong>the</strong>r, <strong>the</strong>se shrimp<br />
must be direct-marketed to restaurants and specialty seafood markets as premium fresh<br />
product in order to bring a higher price. While few detailed market studies have been<br />
carried out to indicate <strong>the</strong> volume of fresh, whole shrimp that can be sold at various<br />
prices, our experience suggested that significant volumes can be sold at prices in <strong>the</strong><br />
range of $5.00-$6.00/lb. For <strong>the</strong> economic analysis it was assumed that <strong>the</strong> shrimp were<br />
sold for $5.25/lb of whole shrimp. At this price <strong>the</strong> annual gross revenues from shrimp<br />
sales averaged nearly $450,000 per year on sales of 86,000 lbs/year of whole shrimp.<br />
Cash Flow and Investment Analyses<br />
A pro forma cash flow analysis was carried out to determine <strong>the</strong> borrowing requirements<br />
and net cash income from <strong>the</strong> project over a ten-year period. The results of this analysis<br />
are summarized in Table 3. The cash flow analysis showed that <strong>the</strong> project would have<br />
to be financed through borrowing or investor paid-in capital during <strong>the</strong> first three years of<br />
<strong>the</strong> project, which are building years. Beginning in Year 2 all of <strong>the</strong> operating costs were<br />
covered by <strong>the</strong> revenues from shrimp sales, and some of <strong>the</strong> income from sales was<br />
available to apply against new capital investment. Never<strong>the</strong>less additional outside money<br />
was needed in Years 2 and 3 to cover new construction costs. A total of nearly $495,500<br />
of borrowed capital was paid into <strong>the</strong> project.<br />
3
Table 3: Summary of pro forma cash flow analysis.<br />
Category Year 1 Year 2 Year 3 Years 4-10<br />
Income $43,712 $199,833 $349,707 $449,623<br />
Operating Expenses $77,057 $173,489 $270,780 $300,377<br />
Income - Operating Expenses ($33,345) $26,343 $78,927 $149,246<br />
Capital Expenditures $224,526 $160,026 $148,943 $30,353<br />
Income - Expenses (Before Taxes) ($257,871) ($133,683) ($70,016) $118,893<br />
Taxes $0 $0 $3,906 $27,237<br />
Income - Expenses (After Taxes) ($257,871) ($133,683) ($73,922) $91,656<br />
Investor Paid-In Capital $287,871 $133,683 $73,922 $0<br />
Production and income stabilized in Years 4-10,with net revenues (before taxes)<br />
averaging $118, 893/year. After tax net revenues averaged $91,656.<br />
The net present value (NPV) of <strong>the</strong> investment was calculated based on before tax net<br />
revenues. A discount rate of 26% (6% opportunity cost for capital + 20% risk premium)<br />
was used to calculate <strong>the</strong> NPV. If <strong>the</strong> NPV of a stream of revenues from an investment<br />
were greater than zero, <strong>the</strong>n <strong>the</strong> investor would be favorably disposed towards <strong>the</strong><br />
investment. If <strong>the</strong> NPV was less than zero, <strong>the</strong> investor would reject <strong>the</strong> investment. In<br />
addition, <strong>the</strong> internal rate of return (IRR) was also calculated. The IRR is <strong>the</strong> discount<br />
rate for which <strong>the</strong> NPV would equal zero. Under <strong>the</strong> set of assumptions used in <strong>the</strong><br />
baseline scenario, <strong>the</strong> NPV for <strong>the</strong> project equaled -$134,341, and <strong>the</strong> IRR equaled 12%.<br />
In order for this investment to earn an IRR of 26% (<strong>the</strong> minimum acceptable rate of<br />
return) <strong>the</strong> producer would have to be able to sell <strong>the</strong> shrimp for $6.04/lb. Based on <strong>the</strong><br />
results of this analysis, this would not be a desirable investment unless <strong>the</strong> shrimp could<br />
be sold for greater than this price.<br />
Sensitivity Analysis<br />
While it is clear that we have not yet demonstrated <strong>the</strong> economic feasibility of producing<br />
shrimp in freshwater recirculating systems, <strong>the</strong>re certainly appears to be room for<br />
improvement with respect to several important variables affecting <strong>the</strong> cost of production<br />
in <strong>the</strong> system. Two key production variables that could be improved upon are <strong>the</strong><br />
survival rate and <strong>the</strong> growth rate of shrimp in <strong>the</strong> system. Four of <strong>the</strong> five crops used to<br />
calculate expected survival rates were carried out in systems with very shallow nursery<br />
tanks (depth = 20 cm). One production trial was carried out in a system with a deeper<br />
nursery tank (depth = 34 cm) with better water circulation. The survival in this trial was<br />
81%. In some recent trials carried out at HBOI in which artificial substrates were placed<br />
in <strong>the</strong> nursery and intermediate sections of <strong>the</strong> culture tank, survivals have averaged<br />
better than 70%. Growth rates in <strong>the</strong> 1999 production trials at HBOI averaged only 0.7<br />
g/week when temperatures were maintained above 28ºC. However in ponds, growth<br />
rates of 1.0 g/week are generally expected at this temperature. The slow growth rates<br />
observed in <strong>the</strong> 1999 HBOI trials might be related to <strong>the</strong> fact that <strong>the</strong> greenhouses were<br />
shaded with 95% shade cloth to minimize algal growth. Moss et al. (1992) demonstrated<br />
that green pond water enhanced <strong>the</strong> growth rate of shrimp raised in aquaria. Moss (1999)<br />
4
eported growth rates of 1.4 g/week in "greenwater" recirculating systems similar to <strong>the</strong><br />
HBOI systems. Subsequent to this study <strong>the</strong> shade cloths covering <strong>the</strong> HBOI<br />
greenhouses were removed, and growth rates have improved.<br />
A sensitivity analysis was carried out to determine <strong>the</strong> effect of improved survival and/or<br />
growth rates on <strong>the</strong> IRR of <strong>the</strong> hypo<strong>the</strong>tical 12-greenhouse enterprise. The results are<br />
summarized in Table 4. This analysis showed that <strong>the</strong> profitability of <strong>the</strong> enterprise was<br />
very sensitive to growth rates. If <strong>the</strong> shrimp were grown to an average weight of 18<br />
grams in 150 days (an average growth rate of 0.84 grams/week), <strong>the</strong> IRR improved to<br />
29% (holding survival at 60%). If <strong>the</strong> shrimp were grown to 18 grams in 150 days at a<br />
survival rate of 70%, <strong>the</strong> IRR improved dramatically to 46%. Improving survival to<br />
70% without any improvement in growth rates improved <strong>the</strong> IRR to 25%, or slightly less<br />
than <strong>the</strong> minimum acceptable return.<br />
Table 4: Sensitivity of NPV and IRR to Survival and Growth Rates<br />
Item<br />
60%<br />
Survival<br />
70%<br />
180 days to 18 grams<br />
Net Present Value @ $5.24/lb (Heads-on) ($152,310) ($7,197)<br />
Internal Rate of Return @ $5.24/lb (Heads-on)<br />
10% 25%<br />
Price Required for NPV to Equal 0 $6.04 $5.28<br />
150 days to 18 grams<br />
Net Present Value @ $5.24/lb (Heads-on) $27,864 $206,881<br />
Internal Rate of Return @ $5.24/lb (Heads-on)<br />
29% $46%<br />
Price Required for NPV to Equal 0 $5.13 $4.49<br />
Conclusion<br />
The commercial viability of shrimp production in freshwater recirculating systems is<br />
critically dependent on <strong>the</strong> ability to grow shrimp to at least 18 grams in 150 days, with<br />
consistent survival rates of better than 60%. Only efficient production systems are going<br />
to be successful, to minimize <strong>the</strong> capital cost per pound of production. The three-phase<br />
production system developed at HBOI allows system productivity to be increased without<br />
significantly increasing <strong>the</strong> capital costs of <strong>the</strong> system. Never<strong>the</strong>less, it is unlikely that<br />
shrimp grown in recirculating systems can be grown as cheaply as pond-reared shrimp, so<br />
<strong>the</strong>y will need to be sold at prices significantly higher prices. The volume of shrimp that<br />
can be sold at <strong>the</strong>se premium prices is presently unknown.<br />
Acknowledgements<br />
This research was funded by <strong>the</strong> Florida Department of Agriculture and Consumer<br />
Services Bureau of <strong>Sea</strong>food and Aquaculture (FDACS Contract No. 4520). The author<br />
would like to thank Jim Collins, Kevin McAllister, Robert McDaniels, and Sami Al-<br />
Hussein for <strong>the</strong>ir assistance with <strong>the</strong> production trials that provided <strong>the</strong> data for this<br />
project.<br />
5
References<br />
Moss, S.M. (1999) “Biosecure shrimp production: emerging technologies for a maturing<br />
industry.” Global Aquaculture Advocate 2: 50-52.<br />
Moss, S.M., G.D. Pruder, K.M. Leber, & J.A. Wyban (1992) “The relative<br />
enhancement of Penaeus vannamei growth by selected fractions of shrimp pond<br />
water.” Aquaculture 101: 229-239.<br />
Van Wyk, P. (2000) “Farming Marine Shrimp in Freshwater Systems: An Economic<br />
Development Strategy for Florida. Final Report.” In, Production of Marine<br />
Shrimp in Freshwater Recirculating Aquaculture Systems, pp. 1-39. Florida<br />
Department of Agriculture and Consumer Services. Tallahassee, Florida.<br />
6
Role of Biological Filters in <strong>the</strong> Maintenance of<br />
Water Quality in <strong>the</strong> Recirculation System<br />
JaiGopal Sharma*, Sunil Kumar and Rina Chakrabarti<br />
Department of Zoology<br />
University of Delhi,<br />
Delhi- 110007<br />
India.<br />
e-mail rina@ndf.vsnl.net.in<br />
Indian major carp Catla catla (catla) larvae were cultured in <strong>the</strong> recirculating systems<br />
maintained in <strong>the</strong> polyhouse. Three types of biological filtration systems: pebbles filter<br />
system, hydroponic system and ear<strong>the</strong>n pot filter system were used in this study. Fish<br />
were harvested after 90 days. More than 90% survival was obtained in all <strong>the</strong>se three<br />
treatments. There was no significant difference in <strong>the</strong> survival rate among <strong>the</strong>se three<br />
culture systems. Growth of catla was significantly (P < 0.05) higher in <strong>the</strong> pebbles filter<br />
system than o<strong>the</strong>r two systems. pH level was always around 7.0. Ammonia and nitrite<br />
levels were significantly lower (P < 0.05) in <strong>the</strong> ear<strong>the</strong>n pot filter system whereas, <strong>the</strong><br />
phosphate level was minimum in <strong>the</strong> hydroponic system. The study of water quality<br />
parameters in different hours of circulation showed some variations. This study suggest<br />
that <strong>the</strong> combination of ear<strong>the</strong>n pot and hydroponic systems will help to maintain better<br />
water quality.<br />
1
Propagation and Culture of Endangered<br />
Freshwater Juvenile Mussels in a<br />
Recirculating Aquaculture System<br />
Jess W. Jones and Richard J. Neves<br />
Virginia Cooperative Fish and Wildlife Research Unit<br />
Department of Fisheries and Wildlife Sciences<br />
Virginia Tech<br />
Blacksburg, VA 24061<br />
Phone: (540) 231-8865<br />
e-mail: vtaquaculture@hotmail.com<br />
Although North America contains <strong>the</strong> greatest diversity of freshwater mussels in <strong>the</strong><br />
world, roughly 300 species, this family of mollusks is <strong>the</strong> most imperiled group of<br />
animals in <strong>the</strong> U.S.. Already, 21 species are extinct and 69 species are listed as<br />
endangered or threatened. To help prevent additional species loss, biologists at <strong>the</strong><br />
Virginia Tech Aquaculture Center in Blacksburg, VA, have developed methods to<br />
propagate and culture endangered juvenile mussels for release into rivers of <strong>the</strong> upper<br />
Tennessee River drainage. Freshwater mussels have a unique life history, requiring <strong>the</strong><br />
use of fish in <strong>the</strong> life cycle. Thus, <strong>the</strong> process of producing juvenile mussels begins by<br />
collecting suitable host fish from <strong>the</strong> river and holding <strong>the</strong>m in captivity until gravid<br />
female mussels can be found. In <strong>the</strong> laboratory, <strong>the</strong> larvae (glochidia) in <strong>the</strong> gills of <strong>the</strong><br />
female mussel are flushed out using a hypodermic needle filled with water. This nonlethal<br />
method allows us to return females to <strong>the</strong> river once her progeny have been<br />
removed. The larvae can number more than 200,000 per female. These larvae are <strong>the</strong>n<br />
introduced into a bucket holding <strong>the</strong> host fish, and aeration is used to keep <strong>the</strong> water<br />
agitated to allow larvae to attach to <strong>the</strong> gills of <strong>the</strong> fish. After 1 hour of exposure, <strong>the</strong> fish<br />
are moved to large aquaria where <strong>the</strong> attached larvae begin <strong>the</strong> transformation process,<br />
which requires 2-3 weeks. Once <strong>the</strong>se young juveniles drop from <strong>the</strong>ir host fish, <strong>the</strong>y are<br />
collected by siphoning <strong>the</strong> tank bottoms. They are put in recirculating streams in a<br />
greenhouse facility, where <strong>the</strong>y are fed cultured algae until a desired size is achieved for<br />
release to <strong>the</strong> wild, usually 1-2 months. In 1998 and 1999, a total of 150,000 juvenile<br />
mussels of 8 species were released into <strong>the</strong> Clinch and Powell rivers in Tennessee.<br />
1
Use of Recirculating Aquaculture Systems (RAS) for<br />
Eel (Anguilla rostrata) Production in Virginia<br />
Marketing<br />
Scott Smith<br />
7760 Anguilla Dr.<br />
Prince George, VA 23875<br />
There are two markets for eels raised in <strong>the</strong> U.S. as food fish. The primary market<br />
is <strong>the</strong> value-added eel market in <strong>the</strong> U.S. and Japan. Kabayaki is a type of “value<br />
added” product made by steaming and grilling <strong>the</strong> eel fillet and adding a special blend<br />
of spices. The importation of Kabayaki from China and o<strong>the</strong>r Asian countries into <strong>the</strong><br />
U.S. exceed 5,000 MT per year with a wholesale value of 38 million dollars.<br />
The secondary market for eels, raised in <strong>the</strong> U.S., is <strong>the</strong> live export market to Asia<br />
and Europe. Japan imports in excess of 48,000 metric tons of live eels per year with an<br />
average wholesale value of 6.00 dollars per lb. ($576 million US). The demand for<br />
whole eel in Japan for Kabayaki production is increasing by 10% per year. Eels can be<br />
grown in <strong>the</strong> U.S. and shipped into Japan's live market for a wholesale price of $4.50<br />
per lb.<br />
Eel Culture Technology (ECT) is a company that produces fingerling eels for<br />
exportation to Asia, Europe, and South America. ECT utilizes Recirculating<br />
Aquaculture Systems (RAS) to produce over three million fingerling eels annually.<br />
ECT is located 22 miles sou<strong>the</strong>ast of Richmond.<br />
Facilities<br />
A 30,000 ft 2 building, two deep wells producing 30 gallons per min., and two, 56<br />
m 3 recirculating systems. Each system contains 24 3-m 3 fiberglass tanks, rotating drum<br />
filtration, biological filtration, propane heat exchanger, degassing tower, and ultraviolet<br />
irradiation. ECT has a permit with Virginia Marine Resource Commission for <strong>the</strong><br />
annual harvest of 600 kg of glass eels (approximately 3,000,000 glass eels).<br />
Inputs<br />
ECT uses a commercial trout diet produced by Sou<strong>the</strong>rn States to feed 1-5% eel<br />
biomass per day (45% crude protein, 10% crude fat, 4% crude fiber, 1% phosphorus).<br />
Each system is capable of receiving up to 75 kg/feed/d or 6 kg/N/d while maintaining<br />
adequate water quality parameters for eel culture. Oxygen cones are used to maintain<br />
oxygen saturation in <strong>the</strong> culture tanks from 100-250% saturation. Oxygen is used at a<br />
rate of 9-12 g O2/kg eel bio-mass/d or 0.9 kg O2/kg feed/d. Fluidized bead filters are<br />
used for <strong>the</strong> removal of ammonia and nitrite. Bio-barrels are used as <strong>the</strong> fluidized media<br />
1
at a rate of 2 ft 3 /kg feed/d. Sodium Hydroxide (50% Grade) is used at a rate of 1.5<br />
liters/10 m 3 refreshment water/d to maintain pH levels between 6.5 and 7.0. The<br />
refreshment water has <strong>the</strong> following characteristics: 120 ppm Alkalinity, 100 ppm<br />
Hardness. pH: 7.2, temperature: 55°F. Culture water is recirculated in <strong>the</strong> culture units<br />
from 100-300%/hr.<br />
Outputs<br />
Each system is capable of maintaining eel densities up to 200 kg eel biomass/m 3<br />
of culture space or 100 kg eel biomass/m 3 of total system water. Each system is capable<br />
of producing 18,000 kg of eel biomass per year.<br />
2
Use of Bead Filter Backwash to Enhance Shrimp Growth<br />
Shaun M. Moss * , Clete A. Otoshi and Anthony D. Montgomery<br />
The Oceanic Institute<br />
41-202 Kalanianaole Hwy.<br />
Waimanalo, HI 96795 USA<br />
smoss@teligentmail.com<br />
Floating bead filters used in recirculating aquaculture systems are designed to capture<br />
solids and provide habitat for nitrifying bacteria. Periodically, <strong>the</strong> bead bed needs to be<br />
cleaned or backwashed to remove accumulated solids that reduce water flow and interfere<br />
with biofiltration. Bead filter backwash typically is in <strong>the</strong> form of a sludge that contains<br />
uneaten feed, feces, live microbes and meiofauna, and o<strong>the</strong>r organic matter. Disposal of<br />
this nutrient-rich material can be problematic, so alternative uses need to be identified.<br />
The objective of this study was to determine if backwash from a propeller-washed bead<br />
filter (PBF) could be used as a feed supplement to enhance <strong>the</strong> growth of juvenile Pacific<br />
white shrimp, Litopenaeus vannamei.<br />
Twelve 120-L tanks were stocked with 1.49-g shrimp (SD + 0.09 g) at a density of 10<br />
shrimp/tank (40/m 2 ). Three treatments (four replicates/treatment) were tested for 43 days<br />
and consisted of: 1) shrimp grown in flow-through pond water from an intensive shrimp<br />
pond (Pond treatment), 2) shrimp grown in flow-through well water from a seawater<br />
aquifer (Well treatment), and 3) shrimp grown in static well water that received additions<br />
of bead filter backwash every o<strong>the</strong>r day (Backwash treatment). Backwash came from a<br />
PBF that was used to filter water from a 58-m 2 recirculating raceway stocked with L.<br />
vannamei at a density of 100 shrimp/m 2 . Shrimp in all three treatments received a 30%protein<br />
feed ad libitum throughout <strong>the</strong> experiment. In addition to shrimp growth and<br />
survival, carbon, nitrogen, and chlorophyll concentrations were determined for organic<br />
matter present in samples of pond water, well water, and bead filter backwash.<br />
There was a significant treatment effect on shrimp growth (P87.5% for all three treatments.<br />
This study indicates that bead filter backwash contains organic matter that can more than<br />
double shrimp growth, and <strong>the</strong>se results call into question <strong>the</strong> need to remove <strong>the</strong>se<br />
particles from <strong>the</strong> culture environment.<br />
1
Modification of D-Ended Tanks for<br />
Flat Fish Culture<br />
Abstract not available at time of printing.<br />
Greg Beckman<br />
Great Bay AquaFarms<br />
153 Gosling Road<br />
Portsmouth, NH 03801<br />
1
Effects of Chloramine-T and Hydrogen Peroxide on<br />
Nitrification in Fluidized-Sand<br />
Biofilters for Cold Water Fish Production<br />
Introduction<br />
Michael F. Schwartz<br />
Research Associate<br />
The Conservation Fund’s Freshwater Institute<br />
Graham L. Bullock<br />
Senior Research Scientist<br />
The Conservation Fund’s<br />
Freshwater Institute<br />
Steven T. Summerfelt<br />
Research Engineer<br />
The Conservation Fund’s<br />
Freshwater Institute<br />
1<br />
Joseph A. Hankins<br />
Program Director<br />
The Conservation Fund’s<br />
Freshwater Institute<br />
Jay A. Mathias<br />
Research Assistant<br />
The Conservation Fund’s<br />
Freshwater Institute<br />
In a previous study using fluidized-sand biofilters it was determined that formalin<br />
treatments, at levels commonly used in fish culture, caused no apparent significant effect<br />
on biofilter performance when tested under ambient conditions (Heinen et al. 1995).<br />
Given that most commonly used <strong>the</strong>rapeutants are biocides it was assumed that <strong>the</strong>y must<br />
have some effect on <strong>the</strong> microbial community within biofilters. Fluidized-sand biofilters<br />
are typically designed with excess nitrification capacity (Summerfelt 1996; Summerfelt<br />
and Cleasby 1996) in <strong>the</strong> form of surface area available for microbial colonization. This<br />
excess capacity allows fluidized-sand biofilters to nitrify more ammonia and nitrite than<br />
<strong>the</strong>y do under normal operating concentrations. Because of this property it was<br />
hypo<strong>the</strong>sized that, a change in <strong>the</strong> microbial community caused by a chemo<strong>the</strong>rapeutant<br />
treatment that was not evident when a biofilter was tested under ambient conditions,<br />
would become evident when <strong>the</strong> biofilter was “challenged” with a spike of higher than<br />
normal ammonia concentration. Challenging <strong>the</strong> biofilters under normal conditions<br />
should allow for <strong>the</strong> determination of <strong>the</strong>ir maximum instantaneous capacity, which could<br />
<strong>the</strong>n be used as a benchmark to compare biofilter performance after exposure to a<br />
chemo<strong>the</strong>rapeutant. If a chemo<strong>the</strong>rapeutant treatment caused an impairment of<br />
maximum biofilter nitrification capacity that was not apparent under ambient conditions,<br />
it should become apparent when <strong>the</strong> biofilters are challenged. Hence, it was thought that<br />
<strong>the</strong> effect of chemo<strong>the</strong>rapeutants on biofilter nitrification capability might be ascertained<br />
through <strong>the</strong> determination of diminished maximum capacity. With this in mind, an<br />
investigation into <strong>the</strong> effect of chloramine-T and hydrogen peroxide on biofilter<br />
efficiency was undertaken.
MATERIALS AND METHODS<br />
All tests were conducted using two identical recirculating systems. Each system<br />
contained: 1500-L culture tank; drum filter; pump sump; two degassers with sumps; and<br />
six identical biofilters operating in parallel.<br />
Before a given chemo<strong>the</strong>rapeutant test <strong>the</strong> ambient biofilter water chemistry was<br />
analyzed first, <strong>the</strong>n <strong>the</strong> biofilters were challenged with a spike of ammonium chloride<br />
solution (NH4Cl) approximately four times that of <strong>the</strong> ambient influent TAN<br />
concentration, and <strong>the</strong>n <strong>the</strong> chemo<strong>the</strong>rapeutant was added to <strong>the</strong> system immediately after<br />
<strong>the</strong> challenge. Twenty-four hours after each chemo<strong>the</strong>rapeutant treatment, ambient<br />
biofilter performance was measured and <strong>the</strong>n <strong>the</strong> biofilters were again challenged with a<br />
spike of ammonium chloride. Parameters measured during <strong>the</strong>se tests were: temperature,<br />
pH, dissolved oxygen, TAN, and nitrite-nitrogen. Water quality parameters were all<br />
analyzed according to standard methods (APHA, 1989). At least 4-6 weeks were allowed<br />
to elapse between tests with a given chemo<strong>the</strong>rapeutant to allow <strong>the</strong> biofilters time to<br />
stabilize from any perturbations caused by previous treatments. Two months were<br />
allowed to elapse between <strong>the</strong> conclusion of one set of chemo<strong>the</strong>rapeutant tests and <strong>the</strong><br />
onset of tests with <strong>the</strong> next chemo<strong>the</strong>rapeutant.<br />
Static bath treatments were conducted by turning off <strong>the</strong> make-up flow to prevent<br />
dilution of <strong>the</strong> chemo<strong>the</strong>rapeutant, and isolating <strong>the</strong> biofilters in a separate recirculating<br />
loop to maintain fluidization. The chemo<strong>the</strong>rapeutant was <strong>the</strong>n added to <strong>the</strong> static culture<br />
tank and <strong>the</strong> above conditions were maintained for an hour after which normal operating<br />
conditions were resumed. In this type of treatment biofilters were exposed to <strong>the</strong><br />
chemo<strong>the</strong>rapeutant only after normal operations were resumed, at which time <strong>the</strong><br />
chemo<strong>the</strong>rapeutant would have been diluted by water volume residing in o<strong>the</strong>r<br />
compartments of <strong>the</strong> system.<br />
Recycle bath treatments were conducted by leaving all processes in <strong>the</strong>ir normal<br />
mode with <strong>the</strong> only difference being that <strong>the</strong> make-up flow was turned off to prevent<br />
dilution of <strong>the</strong> chemo<strong>the</strong>rapeutant. The chemo<strong>the</strong>rapeutant was <strong>the</strong>n added in aliquots<br />
throughout <strong>the</strong> system. Normal make-up flow operating conditions were resumed after<br />
one hour. During recycle bath treatments <strong>the</strong> biofilters were left connected to <strong>the</strong> main<br />
flow and as such were continually exposed to <strong>the</strong> chemo<strong>the</strong>rapeutant during treatment.<br />
Single static bath and recycle bath treatments with 9 ppm of chloramine-T were<br />
conducted first and <strong>the</strong>n a multiple static bath treatment at 12 ppm consisting of three<br />
treatments given on alternate days. The hydrogen peroxide treatment consisted of one<br />
static bath treatment at 100 ppm.<br />
Biofilter nitrification efficiency was calculated by subtracting <strong>the</strong> outlet<br />
concentration from <strong>the</strong> inlet concentration and dividing <strong>the</strong> difference by <strong>the</strong> inlet<br />
concentration.<br />
2
The statistical significance of differences between removal efficiencies was<br />
determined using a one-tailed Wilcoxon paired-sample test (Zar 1974) on <strong>the</strong> mean of six<br />
biofilters. A non-parametric test was chosen because <strong>the</strong> data was not distributed<br />
normally.<br />
The experimental protocol and methods described are in compliance with Animal<br />
Welfare Act (9CFR) requirements and were approved by <strong>the</strong> Freshwater Institute<br />
Institutional Animal Care and Use Committee.<br />
Results and Discussion<br />
After <strong>the</strong> 9 ppm single chloramine-T static bath treatment, ambient ammonia<br />
removal (AAR) increased 20% and challenged ammonia removal (CAR) decreased 5%.<br />
The AAR decreased 10% and <strong>the</strong> CAR decreased 9% after <strong>the</strong> 9 ppm single chloramine-<br />
T recycle bath treatment. After <strong>the</strong> set of multiple 12 ppm chloramine-T static bath<br />
treatments <strong>the</strong>re was only a slight decrease in AAR while CAR decreased by 8%.<br />
The 100 ppm single hydrogen peroxide static bath treatment caused almost total<br />
impairment of nitrification. Twenty-four hours after treatment <strong>the</strong> AAR was reduced by<br />
84% and <strong>the</strong> CAR by 57%.<br />
The primary goal in this research was to determine which of <strong>the</strong><br />
chemo<strong>the</strong>rapeutants evaluated affect biofilter performance, and how acutely; with <strong>the</strong><br />
overall concern being <strong>the</strong> preservation of adequate water quality for fish rearing. As long<br />
as adequate water quality can be maintained, minor drops in biofilter efficiency can be<br />
tolerated. Within <strong>the</strong> recirculating aquaculture system used in <strong>the</strong>se experiments,<br />
biofilter nitrification efficiency often fluctuates from 5-10% over a period of several days<br />
without significant effects on water quality (unpublished data). The authors chose to<br />
make <strong>the</strong> distinction between significant (p
The single 100 ppm hydrogen peroxide treatment caused significant reduction of<br />
both AAR and CAR. As <strong>the</strong>re was limited literature available on <strong>the</strong> effect of hydrogen<br />
peroxide treatments on biofilters, <strong>the</strong> authors had to rely on anecdotal data for<br />
comparison. Bullock and o<strong>the</strong>rs at <strong>the</strong> Freshwater Institute observed hydrogen peroxide<br />
treatments at 100 ppm to cause a major impairment of biofilter efficiency (unpublished<br />
data).<br />
Only <strong>the</strong> single 9 ppm chloramine-T recycle bath, and <strong>the</strong> single 100 ppm<br />
hydrogen peroxide static bath had a highly significant impact on both AAR and CAR.<br />
These treatments should be avoided as <strong>the</strong>y could cause major changes in water quality.<br />
The multiple 12 ppm chloramine-T static bath treatment caused a highly<br />
significant effect on CAR only. This treatment could also cause significant impairment<br />
of water quality.<br />
Irregardless of treatment type or concentration, chloramine-T and hydrogen<br />
peroxide consistently impaired nitrification. The severe impact of hydrogen peroxide<br />
would make it suitable for use as a chemo<strong>the</strong>rapeutant in recirculating systems only if<br />
completely flushed out of <strong>the</strong> system before resuming normal operations. Chloramine-T<br />
could possibly be used with caution in a static bath treatment at <strong>the</strong> lowest concentration<br />
possible.<br />
The results support <strong>the</strong> hypo<strong>the</strong>sis that impairment of nitrification in fluidizedsand<br />
biofilters can be determined through challenging <strong>the</strong> biofilters with high<br />
concentrations of TAN. In all cases where AAR was significantly impaired, CAR was<br />
also significantly impaired.<br />
Acknowledgements<br />
This research was funded by <strong>the</strong> U.S. Dept. of Agriculture's Agriculture Research Service<br />
under agreement 59-1931-3-012 and any opinions, findings, conclusions, or<br />
recommendations expressed in this publication are those of The Conservation Fund or <strong>the</strong><br />
authors and do not necessarily represent those of <strong>the</strong> USDA.<br />
References<br />
American Public Health Association (APHA). Standard Methods for <strong>the</strong> Examination of<br />
Water and Wastewater. Washington, D.C.: APHA, 1989.<br />
Heinen, J. M.; Weber, A.L.; Noble, A.C.; Morton, J.D. “Tolerance to Formalin by a<br />
Fluidized-Bed Biofilter and Rainbow Trout in a Recirculating Culture System.”<br />
Journal of <strong>the</strong> World Aquaculture Society 26 (1995):65-71.<br />
Liao, P.B. and Mayo, R.D.. “Salmonid Hatchery Water Reuse Systems.” Aquaculture 1<br />
(1972):317-335.<br />
4
Noble, A.C. and Summerfelt, S.T. “Diseases Encountered in Rainbow Trout Cultured in<br />
Recirculating Systems.” Annual Review of Fish Diseases 6 (1996):65-92.<br />
Summerfelt, S.T. “Engineering Design of a Water Reuse System.” In Walleye Culture<br />
Manual, Summerfelt, R.C., editor. NCRAC Culture Series 101. Ames, Iowa:<br />
North Central Regional Aquaculture Center Publications Office, Iowa State<br />
University. 1996.<br />
Summerfelt, S.T. and Cleasby, J.L. “A Review of Hydraulics in Fluidized-Bed<br />
Biological Filters.” Transactions of <strong>the</strong> ASAE 39 (1996):1161-1173.<br />
Zar, J.H. Biostatistical Analysis. Englewood Cliffs, NJ: Prentice-Hall. 1974.<br />
5
The Potential for <strong>the</strong> Presence of Bacterial<br />
Pathogens in Biofilms of<br />
Recirculating Aquaculture Systems<br />
Robin K. King, George Flick, Jr.<br />
Department of Food Science and Technology<br />
Virginia Polytechnic Institute and State University<br />
Blacksburg, VA 24061<br />
Recirculating aquaculture offers <strong>the</strong> greatest potential for successful fish farming<br />
since it requires limited resources, and is independent of environmental conditions.<br />
However, this form of aquaculture presents a potential unacceptable public health risk.<br />
With growing concerns for increased antibiotic resistant organisms, controlling<br />
pathogenic microorganisms is paramount. Biofilms form on all aquaculture system<br />
components, incorporating microflora present in <strong>the</strong> water. Pathogenic microorganisms<br />
are found in this biofilm, causing recurring exposure to disease and <strong>the</strong> presence of<br />
asymptomatic carriers.<br />
The project objective is to increase <strong>the</strong> understanding of pathogen incorporation<br />
into biofilms in recirculating aquaculture systems by determining <strong>the</strong> relationship of <strong>the</strong><br />
various materials used in construction of those systems and <strong>the</strong> bacteria’s ability to<br />
attach.<br />
Six freshwater, two mariculture, and one hydroponics facilities were sampled,<br />
with eight different types of material tested. Pathogenic bacteria were identified using<br />
BAM methods and <strong>the</strong> Becton-Dickinson BBL Crystal ID Kit.<br />
Various pathogenic bacteria were identified, including Aeromonas hydrophila,<br />
o<strong>the</strong>r Aeromonads, Vibrios, Yersinias, and Bacillus cereus. Some of <strong>the</strong> microorganisms<br />
identified are pathogens for both fish and humans and can be significant in fur<strong>the</strong>r<br />
processed seafood. Bacillus cereus is a spore-forming bacteria which is <strong>the</strong>rmally<br />
resistant, making it difficult to eliminate with normal food processing techniques. Vibrio<br />
species were found in <strong>the</strong> biofilms in both freshwater and saltwater systems. Some<br />
Yersinia species, such as Yersinia enterocolitica, are becoming more recognized as food<br />
or water-borne pathogens.<br />
Whe<strong>the</strong>r <strong>the</strong> presence of <strong>the</strong>se organisms in biofilms could lead to food-borne<br />
illness is unclear, but <strong>the</strong> potential is <strong>the</strong>re. More research on pathogenic organisms in<br />
biofilms is required. The most significant variation in biofilm pathogens was observed in<br />
facility type and not construction material indicating increased biosecurity measures<br />
leading to pathogen elimination should also be investigated.<br />
Aquaculture is one of <strong>the</strong> most rapidly growing areas of agriculture. With <strong>the</strong><br />
decreasing numbers of wild fisheries, (Pauly et al., 2000) <strong>the</strong> demand for seafood will
need to be filled, and aquaculture will help to meet that demand. There are many<br />
methods of aquaculture including net pen farming, raceway systems, pond systems and<br />
recirculating systems. Recirculating aquaculture systems reuse water, making <strong>the</strong>m<br />
environmentally friendly because <strong>the</strong>re is less waste produced and <strong>the</strong> systems use less<br />
space. They also use less water than raceway systems, and <strong>the</strong>re is less danger of<br />
contamination of <strong>the</strong> food source when compared to some pond systems. A disadvantage<br />
of recirculating systems is that if a pathogenic organism is introduced into <strong>the</strong> system, it<br />
may survive in <strong>the</strong> system indefinitely. This can lead to tremendous economic losses for<br />
<strong>the</strong> facility, as well as <strong>the</strong> possibility of asymptomatic fish being ingested by humans.<br />
One component of <strong>the</strong> recirculating systems that may harbor pathogenic<br />
organisms is <strong>the</strong> biofilm that forms <strong>the</strong> water/solid interface on tanks and equipment.<br />
Biofilms are common in nature and grow at <strong>the</strong> water/solid interface in most all<br />
biological systems. They are found on medical implants, on surfaces in streams, and lead<br />
to plaque on teeth.(Costerton et al., 1987) Biofilms are responsible for <strong>the</strong> deterioration<br />
of ship hulls and underwater building supports. (Geesey et al., 1992) Research has also<br />
been done investigating <strong>the</strong> presence of biofilms formed by Listeria monocytogenes on<br />
food preparation surfaces. It was found that exposing L. monocytogenes in a biofilm to<br />
sublethal treatments of antimicrobials or stresses would result in a unique adaptive<br />
response and <strong>the</strong> stress of starvation was often accompanied by an increase in cell surface<br />
hydrophobicity and adhesiveness, with a decrease in cell size. (Smoot and Pierson,<br />
1998a; Smoot and Pierson, 1998b; Wong, 1998). These cellular changes could lead to<br />
food contamination if inadequate amounts of cleaners and sanitizers are used on food<br />
contact surfaces.<br />
Biofilms are often multispecies cultures attached to surfaces. The bacteria live in<br />
glycocalyx-enclosed microcolonies whose location, size and shape are determined by<br />
nonrandom species-specific factors. Primary colonizers may not all produce an<br />
exopolymer, but those that do may attract o<strong>the</strong>r bacteria which have no propensity for<br />
attachment from <strong>the</strong> planktonic phase. The multispecies biofilms form highly complex<br />
structures with cells arranged in clusters or layers with anastomosing water channels<br />
which bring nutrients to <strong>the</strong> lower layers and remove waste products. As <strong>the</strong> biofilm<br />
develops some cells will slough and become planktonic.<br />
Biofilm formation is a response by microorganisms to alterations in growth rate,<br />
exposure to subinhibitory concentrations of certain antibiotics, and growth on solid<br />
surfaces (Brown and Gilbert, 1993; Kerr et al., 1999; Sasahara and Zottola, 1993; Smoot<br />
and Pierson, 1998a; Smoot and Pierson, 1998b; Stoodley et al., 1999; Yu and McFeters,<br />
1994). The sessile cells of biofilms are very different from planktonic cells. There are<br />
differences noted in cellular enzymatic activity, cell wall composition, and surface<br />
structures between bacterial cells adherent to surfaces and planktonic cells of <strong>the</strong> same<br />
organism. The molecular composition of bacterial cell walls is essentially plastic and is<br />
very responsive to <strong>the</strong> cell’s growth environment. Environmental signals and cellular<br />
structures required for adhesion to intestinal epi<strong>the</strong>lium, nonnutritive abiotic surfaces and<br />
nutritive, abiotic surfaces are distinct. (de Franca and Lutterbach, 1996; Watnick et al.,<br />
1999).
The main advantage for microorganisms to form biofilms is that <strong>the</strong> organisms are<br />
protected from <strong>the</strong> effects of an adverse environment and host immune defenses. The<br />
multispecies culture can provide and maintain <strong>the</strong> appropriate physical and chemical<br />
environments for growth and survival. In many cases <strong>the</strong> organisms in <strong>the</strong> biofilm<br />
develop a resistance to antimicrobials including surfactants, heavy metals, antibiotics,<br />
phagocytic predators and drying.(Brown and Gilbert, 1993; Liltved and Landfald, 1995;<br />
Ronner and Wong, 1993; Yu and McFeters, 1994)<br />
There are many organisms in <strong>the</strong> aquatic environment affecting <strong>the</strong> health of<br />
aquaculture raised fish that can lead to disease in humans. Some are opportunistic<br />
pathogens, living freely in <strong>the</strong> environment and only causing disease if <strong>the</strong> individual is<br />
immunocompromised or if environmental conditions are sufficient. Some of <strong>the</strong>se<br />
organisms are obligate pathogens. Obligate pathogens usually do not remain viable in <strong>the</strong><br />
environment for long periods, though it is unknown if pathogens survive longer in<br />
biofilms.<br />
Most of <strong>the</strong> bacteria are ubiquitous in an aquatic environment and humans and<br />
fish are exposed to <strong>the</strong>m regularly. Examples of this are <strong>the</strong> Escherichia, Klebsiella,<br />
Enterobacter, Serratia, Citrobacter and Proteus species. These bacteria are found in <strong>the</strong><br />
normal intestinal flora of most animals. Coliform infections in man are most commonly<br />
caused by Escherichia coli, Klebsiella pneumoniae, Enterobacter aerogenes,<br />
Enterobacter cloacae, Serratia marcescens, and Proteus mirablis. Citrobacter species<br />
can also cause disease, though <strong>the</strong>y are not as significant and are usually pathogenic in<br />
individuals with predisposing conditions.<br />
Shigellosis and vibriosis are caused by organisms that are associated with poor<br />
sanitation. Shigella species are related to E. coli, with S. dysenteriae and S. flexneri <strong>the</strong><br />
most virulent, though in some parts of <strong>the</strong> world, Shigella sonnei is most virulent. (Hale<br />
and Keusch, 1996) The disease in humans is dysentery, a severe gastroenteritis. Vibrio<br />
cholerae, which causes cholera, is found in water and will persist in shellfish and<br />
plankton in beds that have been contaminated with polluted effluent. V. parahemolyticus<br />
causes enteric disease in humans who eat raw or improperly cooked seafood. Vibrio<br />
vulnificus can cause wound infections and septicemia in humans, though it is most<br />
commonly seen in immunocompromised patients. Vibriosis in fish is most common in<br />
marine species, though it has been isolated from freshwater fish. (Roberts, 1985) Disease<br />
outbreak varies with <strong>the</strong> temperature, <strong>the</strong> virulence of <strong>the</strong> strain present, and <strong>the</strong> amount<br />
of environmental stress present. V. anguillarum is <strong>the</strong> most common causative agent in<br />
vibriosis of fish, though V. vulnificus can also cause disease.<br />
Bacillus species are spore producing bacteria. The spores are resistant to host<br />
physical and chemical environments and can survive in harsh environments, such as<br />
deserts, hot springs, frozen ground, fresh water and marine environments. (Turnbull,<br />
1996) The most significant species is B. cereus. This bacterium is implicated in foodborne<br />
illnesses and is emerging as a very important pathogen due to its hardiness. It
produces two hemolysins that are necrotic and toxemic in nature. O<strong>the</strong>r Bacillus species<br />
may cause food poisoning, but <strong>the</strong>ir significance is unknown.<br />
Pseudomonas species are also ubiquitous in <strong>the</strong> environment. P. aeruginosa is<br />
<strong>the</strong> most common etiological agent of pseudomonas infections in man. P. maltophila<br />
causes opportunistic infection in man. In fish, P. anguilliseptica causes red spot disease.<br />
P. fluorescens, P. putida and P. putrefaciens are often isolated from <strong>the</strong> soil and water<br />
and may cause ei<strong>the</strong>r primary or secondary disease in fish.<br />
Yersinia enterocolitica and Y. pseudotuberculosis have been implicated in food<br />
borne illness. They both cause an acute gastroenteritis that mimics appendicitis. Y.<br />
enterocolitica can survive refrigeration temperatures and low oxygen environments, so it<br />
has been isolated from refrigerated foods. Yersinia ruckerii causes enteric redmouth<br />
disease in salmonid species of fish. It has been isolated from o<strong>the</strong>r fish species as well,<br />
indicating a possible reservoir. (Furones et al., 1993a; Roberts, 1985a) Y. ruckerii is<br />
considered to be an obligate pathogen, though it can survive in <strong>the</strong> aquatic environment<br />
for several months. It is felt that farmed fish may be more prone to clinical disease<br />
caused by this organism because of <strong>the</strong> environmental stress involved. (Plumb, 1999a;<br />
Plumb, 1999a)<br />
Paseturella multocida and P. hemolytica are bacteria that can cause disease in<br />
humans, though most often <strong>the</strong>y are related to cat and dog bites. Photobacterium<br />
damsela, previously known as Paseturella piscicida, causes a pseudotuberculosis type<br />
disease in marine fish. It has been found that P. damsela does not live in estuarine water<br />
for more than 4 – 5 days so transmission is most likely horizontal from carrier fish.<br />
(Toranzo et al., 1982)<br />
Aeromonas species are commonly found in <strong>the</strong> aquatic environment. Most<br />
aeromonads are opportunistic pathogens. A. hydrophila is found in <strong>the</strong> normal flora of<br />
fish. It has also been implicated in diseases in man, though it is not common. (Goncalves<br />
et al., 1992a) Aeromonas salmonicida is an obligate pathogen of fish. It causes<br />
furunculosis primarily in freshwater salmonid species such as trout.<br />
Streptococci are considered part of <strong>the</strong> normal flora of animals and man. There<br />
are many species of streptococci and many of <strong>the</strong>m are virulent. These bacteria cause<br />
multiple forms of human disease including scarlet fever, rheumatic heart disease,<br />
glomerulonephritis, and pneumococcal pneumonia. (Patterson, 1996) Group A<br />
streptococci are most commonly associated with human disease though o<strong>the</strong>r species can<br />
be pathogenic. Streptococcicosis can be seen in fresh water and saltwater fish. The<br />
susceptibility of fish to streptococcus infection is most probably due to environmental<br />
stress. It is believed that <strong>the</strong> bacteria are found in <strong>the</strong> water and sediment around fish<br />
cages. (Kitao et al., 1979) Seven species of Streptococcus which have been isolated<br />
from diseased fish are S. agalactiae, S. dysgalactiae, S. equi, S. equisimilis, S. faecium, S.<br />
pyogenes and S. zooepidemicus. Streptococcus iniae is ano<strong>the</strong>r Streptococcus species<br />
which is becoming more prevalent as a fish pathogen. There is some concern that this
organism causes disease in humans, though <strong>the</strong>re is little conclusive evidence to indicate<br />
this. (Plumb, 1999)<br />
O<strong>the</strong>r aquatic organisms associated with disease outbreaks in fish and humans are<br />
Plesiomonas shigelloides, Edwardsiella tarda and E. ictaluri. Plesiomonas shigelloides<br />
is considered to be an opportunistic pathogen mostly seen in young, overcrowded tilapia<br />
and in immunocompromised people. Edwardsiella species are primarily piscine<br />
pathogens causing non-specific lethargy, internal abcessation, and skin inflammation.<br />
Edwardsiellosis is not confined to fish, having been isolated from birds, humans and<br />
o<strong>the</strong>r animals. (Plumb, 1999)<br />
O<strong>the</strong>r organisms found in aquatic environments that are of public health<br />
significance are Clostridium botulinum, Listeria monocytogenes, and Campylobacter<br />
species. These are all considered food-borne pathogens which cause gastrointestinal<br />
disease or neurological symptoms.<br />
In recirculating aquaculture systems, it is possible that <strong>the</strong> pathogens causing a<br />
disease outbreak have become incorporated into <strong>the</strong> normal biofilm. When <strong>the</strong><br />
conditions are right, planktonic cells are released. If <strong>the</strong> fish are in a stressed condition,<br />
ano<strong>the</strong>r outbreak may occur. The purpose of this research was to determine <strong>the</strong> presence<br />
of piscine and human pathogenic bacteria in biofilms of recirculating aquaculture<br />
systems. If pathogens were isolated, <strong>the</strong> correlation between <strong>the</strong> number of pathogens<br />
recovered, <strong>the</strong> history of disease at <strong>the</strong> facility and <strong>the</strong> surface material was determined.<br />
METHODS:<br />
Biofilms were sampled by swabbing <strong>the</strong> surface with sterile culturettes. When<br />
pipes were sampled water flow was temporarily discontinued. Tank walls were sampled<br />
just above <strong>the</strong> water surface. Rotating biological contactors (RBC) and o<strong>the</strong>r filter types<br />
(e.g. fluidized beds) were sampled on surfaces that were out of <strong>the</strong> water.<br />
The culturettes were <strong>the</strong>n streaked onto McConkey’s Agar, Trypticase Soy Agar<br />
(TSA), 5% Blood Agar and Marine Agar if <strong>the</strong> sample was from a mariculture facility.<br />
The plates were <strong>the</strong>n incubated at 35 O C for 24 hours. Colonies were removed from plates<br />
by differing morphology and streaked on TSA plates. The TSA plates were <strong>the</strong>n<br />
incubated ano<strong>the</strong>r 24 hours at 35 O C. Using growth from <strong>the</strong> TSA plates <strong>the</strong> organism<br />
was Gram stained. Oxidase and indole tests were performed on Gram negative<br />
organisms, and <strong>the</strong> growth media for <strong>the</strong> non-fermenting enteric BBL Crystal ID Kit<br />
was inoculated. The morphology of Gram positive organisms was noted and <strong>the</strong> growth<br />
media for <strong>the</strong> Gram-Positive BBL Crystal ID kit was inoculated. The kits were incubated<br />
for 18 – 24 hours at 35 O C.<br />
Becton Dickinson Microbiology Systems, Becton Dickinson and Company, Cockeysville, MD 21030
RESULTS AND DISCUSSION:<br />
Nine different commercial or research recirculating aquaculture facilities were<br />
sampled. Two were mariculture facilities, growing flounder. The six freshwater<br />
facilities were all producing tilapia. There was one hydroponics research facility that was<br />
circulating filtered fish wastewater through plant beds before being sent back to <strong>the</strong> fish<br />
tanks.<br />
The nine facilities tested used different materials. Almost all of <strong>the</strong>m used<br />
polyvinyl chloride (PVC) for water pipes. Many of <strong>the</strong> systems used fiberglass and/or<br />
plastic tanks. O<strong>the</strong>r substances used in <strong>the</strong> aquaculture systems tested were glass,<br />
stainless steel, rubber, aluminum, foam and cement. An unbalanced random block<br />
statistical model was used to test whe<strong>the</strong>r pathogen growth was influenced by <strong>the</strong> type of<br />
material, <strong>the</strong> type of facility, and <strong>the</strong> history of disease, or whe<strong>the</strong>r all of <strong>the</strong>m were<br />
significant.<br />
Materials<br />
1 2 3 4<br />
Facilities<br />
5 6 7 8 9<br />
1<br />
Fiberglass/<br />
Plastic<br />
1 17 9 1 12 4 7 15 4<br />
2 PVC 3 6 3 3 11 2 1 - 6<br />
3 O<strong>the</strong>r 1 - - 3 - 5 2 16 10<br />
History of<br />
Disease<br />
N N N Y N N Y Y Y<br />
Figure 1.<br />
Figure 1 shows <strong>the</strong> data used to determine <strong>the</strong> statistical analysis. The SAS<br />
System for Windows V7 program was used to determine <strong>the</strong> relationship between <strong>the</strong><br />
growth of pathogens and <strong>the</strong> type of material. The p value was well above <strong>the</strong> 5%<br />
significance level, indicating <strong>the</strong> type of material was not a significant factor in<br />
determining <strong>the</strong> presence of pathogenic bacteria. A similar response was obtained when<br />
comparing <strong>the</strong> history of disease. Running a comparison of <strong>the</strong> least squares means and<br />
doing Tukey’s test supports this. However, when comparing facilities <strong>the</strong> p-value =<br />
0.0027. This indicates that at least one facility showed a significant difference in<br />
pathogen growth.<br />
SAS Institute, Inc., Cary, NC 27513
Bacteria No. of Facilities<br />
No. of Different<br />
Materials<br />
Acinetobacter spp. 4 3<br />
Aeromonas hydrophila 7 7<br />
Aeromonas spp. 5 7<br />
Bacillus cereus 3 4<br />
Bacillus spp. 1 2<br />
Citrobacter freundii 4 4<br />
Enterobacter cloacae 2 4<br />
Enterococcus spp. 2 3<br />
Escherichia coli 3 3<br />
Photobacterium damsela 2 2<br />
Plesiomonas shigelloides 2 2<br />
Serratia marcescens 2 4<br />
Shewanella putrefaciens 3 4<br />
Shigella spp. 1 1<br />
Sphingobacterium<br />
2 2<br />
multivorum<br />
Sphingomonas spp. 3 4<br />
Vibrio cholerae 2 2<br />
Vibrio spp. 3 3<br />
Vibrio-like spp. a<br />
4 4<br />
a Organisms were listed in this category if <strong>the</strong> test kit response was a Vibrio spp. or an<br />
Aeromonas spp. but not one or <strong>the</strong> o<strong>the</strong>r specifically.<br />
Figure 2.<br />
The isolated and identified organisms are listed in figure 2. All of <strong>the</strong> bacteria<br />
listed are potential human pathogens. Some of <strong>the</strong>m, such as A. hydrophila, o<strong>the</strong>r<br />
Aeromonas species, P. damsela, P. shigelloides and <strong>the</strong> Vibrio species, are also fish<br />
pathogens. Many of <strong>the</strong> organisms isolated could not be definitively identified. This is a<br />
shortcoming of any of <strong>the</strong> rapid test kits, as <strong>the</strong>y are designed to identify human<br />
pathogens. If <strong>the</strong> bacteria isolated are strictly fish pathogens or if <strong>the</strong>y are normal, nonpathogenic<br />
flora, <strong>the</strong> test kits will probably not identify <strong>the</strong>m. An example in this<br />
instance is that one organism isolated was identified as Yersinia pestis. Y. pestis is not<br />
considered a water borne bacteria. In this case <strong>the</strong> organism was probably misidentified,<br />
though a positive identity was not determined. It may have been Y. ruckerii or a normal,<br />
non-pathogenic organism that produced test results similar to Y. pestis. Misidentification<br />
with <strong>the</strong> test kits could occur if biofilm bacteria react differently to <strong>the</strong> biochemical tests<br />
than <strong>the</strong> planktonic counterparts. This raises <strong>the</strong> possibility of <strong>the</strong> presence of o<strong>the</strong>r<br />
pathogens which are unidentifiable with this method.
CONCLUSIONS:<br />
Bacterial pathogens, both fish and human, are present in <strong>the</strong> biofilms of<br />
recirculating aquaculture systems. Most of <strong>the</strong>m are ubiquitous in an aquatic<br />
environment and are opportunistic pathogens. The bacteria can grow on any surface<br />
tested in this case, and environmental conditions such as salinity and water temperature<br />
are <strong>the</strong> determinant factors for species of bacteria present. The numbers and types of<br />
organisms present may be underrepresented. If bacteria alter <strong>the</strong>ir chemical functions to<br />
survive as sessile organisms, <strong>the</strong>y may not respond to <strong>the</strong> chemical tests in a predictable<br />
manner.<br />
The potential for food-borne illness as a result of consuming fish raised in<br />
recirculating systems is unclear, but with <strong>the</strong> increased consumption of rare fish and <strong>the</strong><br />
increased survival of immunocompromised persons, <strong>the</strong>re is a possible risk. Also, cross<br />
contamination could occur in a processing facility between incoming and processed<br />
product. Raising fish in recirculating aquaculture systems exposes <strong>the</strong>m to high density<br />
populations and o<strong>the</strong>r stressors. The presence of pathogenic bacteria in biofilms in <strong>the</strong>se<br />
systems increases <strong>the</strong> possibility of recurring disease, with resultant economic losses to<br />
<strong>the</strong> aquaculturist.<br />
The next step in research would be to determine <strong>the</strong> most effective methods to<br />
decrease pathogen presence. The aquaculture industry is heavily regulated with regards<br />
to <strong>the</strong> use of antibiotics and chemicals in <strong>the</strong> water. The proliferation of species of<br />
antibiotic resistant organisms is a great concern because <strong>the</strong> antibiotics in use today are<br />
becoming increasingly ineffective. The environmental effect of antimicrobial treatment<br />
of wastewater must also be considered. Developing methods of elimination will require<br />
a better understanding of <strong>the</strong> viability of pathogens in biofilms, as well as a better<br />
knowledge of <strong>the</strong> sensitivity of sessile versus planktonic organisms to antimicrobials.<br />
Ano<strong>the</strong>r area of investigation would be in developing biosecurity measures in <strong>the</strong><br />
aquaculture industry similar to those in <strong>the</strong> poultry industry. In <strong>the</strong> poultry industry<br />
hatchlings are introduced into one building and <strong>the</strong>y never leave that building until time<br />
for slaughter. Then all <strong>the</strong> birds are removed, and <strong>the</strong> building is cleaned and sanitized.<br />
It is <strong>the</strong>n left empty for a short period of time to aid in <strong>the</strong> fur<strong>the</strong>r elimination of<br />
pathogenic bacteria which could affect <strong>the</strong> new flock. Keeping facilities pathogen-free is<br />
an impossible task, but if levels of pathogens can be kept below infective doses, <strong>the</strong><br />
chance of fish becoming infected would be very low. For economic and public health<br />
reasons, <strong>the</strong> aquaculturist should strive for this goal.<br />
References<br />
Alderman, D.J. and Hastings, T.S. (1998) Antibiotic use in aquaculture: development of<br />
antibiotic resistance - potential for consumer health risks. International Journal of<br />
Food Science and Technology 33, 139.
Assanta, M.A., Roy, D. and Montpetit, D. (1998) Adhesion of Aeromonas hydrophila to<br />
water distribution system pipes after different contact times. Journal of Food<br />
Protection 61, 1321.<br />
Austin, B. (1999) The effects of pollution on fish health. Journal of Applied<br />
Microbiology <strong>Symposium</strong> Supplement 85, 234S.<br />
Austin, B. and Austin, D.A. (1989) Methods for <strong>the</strong> Microbiological Examination of Fish<br />
and Shellfish. Ellis Horwood Limited, Chichester, England,<br />
Bal'a, M.F.A., Jamilah, I.D. and Marshall, D.L. (1998) Attachment of Aeromonas<br />
hydrophila to stainless steel surfaces. Dairy, Food and Environmental Sanitation<br />
18, 642.<br />
Bal'a, M.F.A., Jamilah, I.D. and Marshall, D.L. (1999) Moderate heat or chlorine<br />
destroys Aeromonas hydrophila biofilms on stainless steel. Dairy, Food and<br />
Environmental Sanitation 19, 29.<br />
Benenson, A.S. (1995) Control of Communicable Diseases Manual. American Public<br />
Health Association, Washington, DC.<br />
Blenkensopp, S.A. and Costerton, J.W. (1991) Understanding bacterial biofilms. Trends<br />
in Biotechnology 9, 42.<br />
Brown, M.R.W. and Gilbert, P. (1993) Sensitivity of biofilms to antimicrobial agents.<br />
Journal of Applied Bacteriology <strong>Symposium</strong> Supplement 74, 87S.<br />
Collins, F.M. (1996) Pasteurella, Yersinia, and Francisella. In: S. Baron (Ed.), Medical<br />
Microbiology. Vol.4, The University of Texas Medical Branch at Galveston,<br />
Galveston, TX, p. 379.<br />
Costerton, J.W. (1995) Overview of microbial biofilms. Journal of Industrial<br />
Microbiology 15, 137.<br />
Costerton, J.W., Cheng, K.J., Geesey, G.G., Ladd, T.I., Nickel, J.C., Dasgupta, M. and<br />
Marrie, T.J. (1987) Bacterial biofilms in nature and disease. Annual Review in<br />
Microbiology 41, 435.<br />
de Franca, F.P. and Lutterbach, M.T.S. (1996) Variation in sessile microflora during<br />
biofilm formation on AISI-304 stainless steel coupons. Journal of Industrial<br />
Microbiology 17, 6.
Dhir, V.K. and Dodd, C.E.R. (1995) Susceptibility of suspended and surface-attached<br />
Salmonella enteriditis to biocides and elevated temperatures. Applied and<br />
Environmental Microbiology May, 1731.<br />
Ferguson, H.W., Morales, J.A. and Ostland, V.E. (1994) Streptococcosis in aquarium<br />
fish. Diseases of Aquatic Organisms 19, 1.<br />
Finkelstein, R.A. (1996) Vibrio cholerae and O<strong>the</strong>r Pathogenic Vibrios. In: S. Baron<br />
(Ed.), Medical Microbiology. Vol.4, The University of Texas Medical Branch at<br />
Galveston, Galveston, TX, p. 323.<br />
Furones, J.D., Rodgers, D.J. and Munn, C.B. (1993) Yersinia ruckeri, <strong>the</strong> causal agent of<br />
enteric redmouth disease (ERM) in fish. Annual Review of Fish Diseases 105,<br />
32.<br />
Geesey, G.G., Stupy, M.W. and Bremer, P.J. (1992) The dynamics of biofilms.<br />
International Biodeterioration and Biodegradation 30, 135.<br />
Goncalves, J.R., Braum, G., Fernandes, A., Biscaia, I., Corriea, J.J.S. and Bastardo, J.<br />
(1992) Aeromonas hydrophila fulminant pneumonia in a fit young man. Thorax<br />
47, 482.<br />
Guentzel, M.N. (1996) Escherichia, Klebsiella, Enterobacter, Serratia, Citrobacter, and<br />
Proteus. In: S. Baron (Ed.), Medical Microbiology. Vol.4, The University of<br />
Texas Medical Branch at Galveston, Galveston, TX, p. 347.<br />
Hale, TL. and Keusch, G.T. (1996) Shigella. In: S. Baron (Ed.), Medical Microbiology.<br />
Vol.4, The University of Texas Medical Branch at Galveston, Galveston, TX, p.<br />
303.<br />
Howgate, P. (1998) Review of <strong>the</strong> public health safety of products from aquaculture.<br />
International Journal of Food Science and Technology 33, 99.<br />
Iglewski, B.H. (1996) Pseudomonas. In: S. Baron (Ed.), Medical Microbiology. Vol.4,<br />
The University of Texas Medical Branch at Galveston, Galveston, TX, p. 361.<br />
Inglis, V., Roberts, R.J. and Bromage, N.R. (1993) Bacterial Diseases of Fish. Halsted<br />
Press, New York, NY,<br />
Jass, J., Phillips, L.E., Allan, E.J., Costerton, J.W. and Lappin-Scott, H.M. (1994) Growth<br />
and adhesion of Enterococcus faecium L-forms. FEMS Microbiology Letters<br />
115, 157.
Jones, K. and Bradshaw, S.B. (1996) Biofilm formation by <strong>the</strong> Enterobacteriaceae: a<br />
comparison between Salmonella enteritidis, Escherichia coli and a nitrogenfixing<br />
strain of Klebsiella pneumoniae. Journal of Applied Bacteriology 80, 458.<br />
Karunasagar, I. and Otta, S.K. (1996) Biofilm formation by Vibrio harveyi on surfaces.<br />
Aquaculture 140, 241.<br />
Kerr, C.J., Osborn, K.S., Robson, G.D. and Handley, P.S. (1999) The relationship<br />
between pipe material and biofilm formation in a laboratory model system. The<br />
Society for Applied Microbiology <strong>Symposium</strong> Supplement 85, 29S.<br />
Kitao, T., Aoki, T. and Awata, K. (1979) Epidemiological study on streptococcicosis of<br />
cultured yellowtail (Seriola quinqueradiata). 1-Distribution of Streptococcus sp. in<br />
sea water and muds around yellowtail farms. Bull.Jap.Soc.Scient.Fish. 45, 567.<br />
Lewis, D.H. (1985) Vibriosis in channel catfish, Ictalarus punctatus (Rafinesque).<br />
Journal of Fish Diseases 8, 539.<br />
Liltved, H. and Landfald, B. (1995) Use of alternative disinfectants, individually and in<br />
combination, in aquacultural wastewater treatment. Aquaculture Research 26,<br />
567.<br />
McFeters, F.A., Pyle, B.H., Lisle, J.T. and Broadaway, S.C. (1999) Rapid direct methods<br />
for enumeration of specific, active bacteria in water and biofilms. Journal of<br />
Applied Microbiology <strong>Symposium</strong> Supplement 85, 193S.<br />
Newman, S.G. (1982) Aeromonas hydrophila: A review with emphasis on its role in fish<br />
diseases. In: D.P. Anderson, M. Dorson and P.H. Dubouret (Eds.), Antigens of<br />
Fish Pathogens: Development and Production for Vaccines and Serodiagnostics.<br />
Marcel Marieux, Lyon, France, p. 87.<br />
Patterson, M.J. (1996) Streptococcus. In: S. Baron (Ed.), Medical Microbiology. Vol.4,<br />
The University of Texas Medical Branch at Galveston, Galveston, TX, p. 199.<br />
Pauly, D., Christensen, V., Froese, R. and Palomares M.L. (2000) Fishing down Aquatic<br />
Food Webs. American Scientist 88, 46.<br />
Plumb, J.A. (1999) Health Maintenence and Principal Microbial Diseases of Cultured<br />
Fishes. Iowa State University, Ames, IA,<br />
Rielly, A. and Käferstein, F. (1999) Food safety and products from aquaculture. Journal<br />
of Applied Microbiology <strong>Symposium</strong> Supplement 85, 249S.
Roberts, M.S. (1985) Why ERM gives cause for concern. Fish Farmer Jan./Feb., 27.<br />
Roberts, R.J. (1989) Fish Pathology. Bailliere Tindall, London, England,<br />
Ronner, A.B. and Wong, S.C.L. (1993) Biofilm development and sanitizer inactivation of<br />
Listeria monocytogenes and Salmonella typhimurium on stainless steel and buna-<br />
N rubber. Journal of Food Protection 56, 750.<br />
Sasahara, K.C. and Zottola, E.A. (1993) Biofilm formation by Listeria monocytogenes<br />
utilizes a primary colonizing microorganism in flowing systems. Journal of Food<br />
Protection 56, 1022.<br />
Skillman, L.C., Su<strong>the</strong>rland, I.W. and Jones, M.V. (1999) The role of exopolysaccharides<br />
in dual species biofilm developemnt. Journal of Applied Microbiology<br />
<strong>Symposium</strong> Supplement 85, 13S.<br />
Smoot, L.M. and Pierson, M.D. (1998a) Effect of environmental stress on <strong>the</strong> ability of<br />
Listeria monocytogenes Scott A to attach to food contact surfaces. Journal of<br />
Food Protection 61, 1293.<br />
Smoot, L.M. and Pierson, M.D. (1998b) Influence of environmental stress on <strong>the</strong> kinetics<br />
and strength of attachment of Listeria monocytogenes Scott A to buna-N rubber<br />
and stainless steel. Journal of Food Protection 61, 1286.<br />
Stoodley, P., Dodds, I., Boyle, J.D. and Lappin-Scott, H.M. (1999) Influence of<br />
hydrodynamics and nutrients on biofilm structure. Journal of Applied<br />
Microbiology <strong>Symposium</strong> Supplement 85, 19S.<br />
Toranzo, A.E., Barja, J.L. and Hetrick, F.M. (1982) Survival of Vibrio anguillarum and<br />
Pasturella piscicida in estuarine and fresh waters. Bulletin of teh European<br />
Association of Fish Pathologists 3, 43.<br />
Turnbull, P.C.B. (1996) Bacillus. In: S. Baron (Ed.), Medical Microbiology. Vol.4, The<br />
University of Texas Medical Branch at Galveston, Galveston, TX, p. 233.<br />
Walker, J.T. and Morales, M. (1997) Evaluation of chlorine dioxide (ClO2) for <strong>the</strong><br />
control of biofilms. Water Science and Technology 35, 319.<br />
Watnick, P.I., Fullner, K.J. and Kolter, R. (1999) A role for <strong>the</strong> mannose-sensitive<br />
hemagglutinin in biofilm formation by Vibrio cholerae El Tor. Journal of<br />
Bacteriology Jun, 3606.
Wilderer, P.A. and Characklis, W.G. (1989) Structure and Function of Biofilms. In: W.G.<br />
Characklis and P.A. Wilderer (Eds.), Structure and Function of Biofilms. John<br />
Wiley and Sons, Ltd.,<br />
Wong, A.C.L. (1998) Biofilms in food processing environments. Journal of Dairy<br />
Science 81, 2770.<br />
Yu, F.P. and McFeters, G.A. (1994) Physiological responses of bacteria in biofilms to<br />
disinfection. Applied and Environmental Microbiology July, 2462.<br />
Yu, T. and Bishop, P.I. (1998) Stratification of microbial metabolic processes and redox<br />
potential change in an aerobic biofilm studied using microelectodes. Water<br />
Science and Technology 37, 195.<br />
Zlotkin, A., Hershko, H. and Eldar, A. (1998) Possible Transmision of Streptococcus<br />
iniae from Wild Fish to Cultured marine Fish. Applied and Environmental<br />
Microbiology Oct., 4065.
Transmission of Furunculosis and Enteric Redmouth by<br />
Means of Fluidized Sand Biofilters<br />
G. L. Bullock, Research Microbiologist, Conservation Fund’s<br />
Freshwater Institute, Shepherdstown, WV.<br />
W. B. Schill, Chemist, USGS, <strong>National</strong> Fish Health Research Laboratory, Kearneysville,<br />
WV.<br />
Abstract<br />
E. Burchard, Research Associate, Conservation Fund’s Freshwater Institute,<br />
Shepherdstown, WV.<br />
Two bacterial pathogens of salmonids, Aeromonas salmonicida cause of furunculosis, or<br />
Yersinia ruckeri, cause of enteric redmouth, were added for five days to <strong>the</strong> pump inlet of<br />
a recirculating culture system, without fish, in order to determine if <strong>the</strong> pathogens would<br />
become established in <strong>the</strong> fluidized sand biofilters and infect newly added salmonids.<br />
Before addition of <strong>the</strong> cultures, <strong>the</strong> biofilters were sampled and found free of both<br />
pathogens. However, both pathogens could be cultured from biofilters after cultures were<br />
added. When culture addition was completed <strong>the</strong> recycle system, except for biofilters,<br />
was disinfected with 200 ppm chlorine for two hours. Biofilters were continuously<br />
washed for 24 hr with springwater. Rainbow trout (Oncorhynchus mykiss) to detect Y.<br />
ruckeri, or Arctic char (salvelinus alpinus), to detect A. salmonicida, were <strong>the</strong>n added to<br />
<strong>the</strong> recycle system. Three weeks after addition of rainbow trout, Y. ruckeri was cultured<br />
from feces and trout began dying from enteric redmouth. Two weeks after char were<br />
added clinical furunculosis was diagnosed and A. salmonicida was isolated from<br />
survivors. After enteric redmouth or furunculosis had been transmitted from biofilters,<br />
fish were removed, and <strong>the</strong> entire system was treated with 10 ppm chloramine-T in an<br />
attempt to remove <strong>the</strong> pathogens from <strong>the</strong> biofilters. The system was <strong>the</strong>n restocked with<br />
ei<strong>the</strong>r char or rainbow trout. After six weeks nei<strong>the</strong>r furunculosis nor redmouth occurred<br />
and nei<strong>the</strong>r pathogen could be isolated from salmonids or bilofilters. Biofilter<br />
transmission experiments were repeated with both pathogens, and an additional<br />
procedure for disease transmission tested.<br />
Introduction<br />
Infectious diseases are a major cause of mortality in intensive aquaculture. Precautions<br />
such as use of specific pathogen frees stocks of fish, clean water supply, proper<br />
sanitation, and biosecurity are necessary to reduce disease outbreaks. In a recirculating<br />
culture system ano<strong>the</strong>r possible source of pathogens is biofilters. If a disease outbreak<br />
occurs <strong>the</strong>re is a possibility <strong>the</strong> pathogen may become established in biofilters and infect<br />
newly stocked fish. Several reviews have described disease problems in recirculating<br />
1
systems (Egusa, 1981; Mellergaard and Dalsgaard, 1987). Recently, Noble and<br />
Summerfelt (1996) described diseases that occurred in a rainbow trout (Oncorhynchus<br />
mykiss) recirculating system and mentioned that biofilters were cultured for A.<br />
salmonicida during a furunculosis outbreak, but <strong>the</strong> pathogen could not be isolated<br />
(Cipriano et al., 1996). The present work was undertaken to determine if ei<strong>the</strong>r A.<br />
salmonicida or Y. ruckeri could be established in fluidized sand biofilters and could<br />
infect newly stocked salmonids.<br />
Materials and Methods<br />
All infectivity trials were conducted in two recycle systems, each having <strong>the</strong><br />
configuration shown in Figure 1. The culture tank was 1.5 m in diameter and stocked<br />
with 60-80 kg of rainbow trout or arctic char (Salvelinus alpinus). Water flowed from <strong>the</strong><br />
culture tank into a drum filter containing 100 μm screen and was <strong>the</strong>n pumped at 8 L/min<br />
per filter to six fluidized sand biofilters, each 2.5 m tall and 0.17 m in diameter. Water<br />
leaving <strong>the</strong> biofilters fell by gravity through two columns containing 5-cm plastic Norpac<br />
media (NWS Corp., Roanoke, VA) to remove carbon dioxide. Water discharged from<br />
<strong>the</strong> two packed columns was piped into <strong>the</strong> culture tank (Figure 1). Water temperature in<br />
<strong>the</strong> system ranged from 14-17 °C and oxygen levels were maintained between 9-12 ppm.<br />
Samples of biofilm-coated sand from all biofilters were cultured before beginning<br />
infectivity trials to insure A. salmonicida or Y. ruckeri were not present. Bioparticle<br />
samples were taken, processed and quantified as previously described (Bullock et al.,<br />
1993) and cultured onto Coomassie brilliant blue (CBB) agar plates (Udey, 1982) to<br />
detect A. salmonicida and Shotts Waltman (SW) plates (Waltmann and Shotts , 1984) to<br />
detect Y. ruckeri. Suspect A. salmonicida colonies were dark blue and 1-2 mm in<br />
diameter after 48 hr growth on CBB. Blue colonies were transferred to tryptlc soy agar<br />
plates and confirmed as A. salmonicida if <strong>the</strong>y produced a brown water soluble pigment<br />
on TSA and were cyotchrome oxidase positive, fermentative in O/F glucose, and<br />
nonmotile in a hanging drop. After 48 hr growth on SW, suspect Y. ruckeri colonies<br />
were 1-2 mm in diameter and surrounded by a zone of precipitation caused by degraded<br />
Tween 20 and calcium chloride. Suspect colonies were confirmed as Y. ruckeri if <strong>the</strong>y<br />
showed an acid slant in triple iron agar slants and a positive slide agglutination test with<br />
type I anti Y. ruckeri antiserum. Stocks of rainbow trout were obtained from <strong>the</strong> <strong>National</strong><br />
Fish Health Research Laboratory and <strong>the</strong> Freshwater Institute, while arctic char<br />
(Labrador strain) were obtained from <strong>the</strong> Freshwater Institute. Although nei<strong>the</strong>r rainbow<br />
trout nor char had been exposed to furunculosis or enteric redmouth, feces from 25<br />
rainbow trout and mucus from 25 char were cultured onto CBB or SW plates to insure<br />
<strong>the</strong>se pathogens were absent. Two types of infectivity procedures were conducted in<br />
which all fish were removed from <strong>the</strong> system and broth cultures of A. salmonicida or Y.<br />
ruckeri were continuously added to <strong>the</strong> system at <strong>the</strong> pump intake, for five days using a<br />
peristaltic pump. On <strong>the</strong> first and fifth day, bacterial cells in <strong>the</strong> broth cultures were<br />
quantified using serial log10 dilutions and <strong>the</strong> drop plate technique of Miles and Misra<br />
(1938). Fish tank water and biofilters were <strong>the</strong>n cultured for <strong>the</strong> pathogen under study.<br />
In <strong>the</strong> first infectivity procedure <strong>the</strong> entire culture system, except for biofilters, was<br />
disinfected for 2 hr with 200 ppm chlorine and <strong>the</strong> biofilters continuously washed with<br />
spring water for 24 hr after which fish were added. Fish were observed for clinical<br />
2
disease and posterior kidney of mortalities streaked onto CBB or SW. If no mortality<br />
occurred in three to four weeks, mucus or feces from 25 fish and all biofilters were<br />
cultured on CBB or SW. In <strong>the</strong> second procedure, <strong>the</strong> entire system was treated with 10<br />
ppm chloramine-T for 1 hr and <strong>the</strong> system was <strong>the</strong>n rinsed with spring water for 1 hr. The<br />
system was stocked and fish observed for clinical disease. If no disease occurred in six<br />
weeks mucus or feces and all biofilters were cultured for <strong>the</strong> pathogen under study. In<br />
trials where chlorine was used to disinfect <strong>the</strong> system and spring water used to wash<br />
biofilters and disease occurred, fish were removed and <strong>the</strong> entire system disinfected with<br />
10 ppm chloramine-T and new fish added. These fish were observed for disease for six<br />
weeks and <strong>the</strong>n cultured if disease did not occur. The experimental protocol and <strong>the</strong><br />
methods described were in compliance with <strong>the</strong> Animal Welfare Act (9CFR)<br />
requirements and were approved by <strong>the</strong> Freshwater Institute Institutional Animal Care<br />
and Use Committee.<br />
Drum<br />
Filter<br />
Pump<br />
Sump<br />
Figure 1. Recirculating system used in bacterial transmission experiments.<br />
Results and Discussion<br />
Culture Tank<br />
Results of trials using <strong>the</strong> chlorine disinfection and biofilter washing procedure are given<br />
in Table 1. In all 3 trials, <strong>the</strong> pathogens were easily cultured from biofilters after <strong>the</strong> five<br />
day addition of culture and in 2 of <strong>the</strong> 3 trials <strong>the</strong>y could be cultured after <strong>the</strong> 24 hr<br />
washing of biofilters. Clinical furunculosis or enteric redmouth occurred within 11-21 d<br />
after <strong>the</strong> fish were stocked. Prevalence of <strong>the</strong> pathogens in mucus, feces or biofilters<br />
varied regardless of whe<strong>the</strong>r fish and biofilters were sampled before or after mortality<br />
occurred. In trial 1 with Y. ruckeri, where trout were sampled before mortality occurred,<br />
<strong>the</strong> pathogen occurred in 6 of 25 fecal samples and one biofilter. However, in trial 2, fish<br />
were sampled after mortality occurred and Y ruckeri was present in only 2 of 25 fecal<br />
samples and in none of <strong>the</strong> biofilters. In <strong>the</strong> A. salmonicida trial, char were sampled after<br />
mortality occurred and only 2 of 25 mucus samples were positive while all biofilters were<br />
positive for <strong>the</strong> pathogen. When rainbow trout and char were removed from <strong>the</strong><br />
3<br />
Degasser<br />
1<br />
Degasser<br />
2<br />
Biofilters
ecirculating system after mortality occurred and systems, including biofilters, disinfected<br />
with 10 ppm chloramine-T and new fish added nei<strong>the</strong>r enteric redmouth nor furunculosis<br />
occuured within six weeks after restocking. Culturing feces, mucus or biofilters also<br />
failed to show <strong>the</strong> pathogens.<br />
Transmission of Y. ruckeri and A salmonicida by disinfecting <strong>the</strong> entire system with 10<br />
ppm chloramine-T immediately after <strong>the</strong> five day culture addition, procedure 2, failed to<br />
produce clinical disease in rainbow trout or char. Culture of feces from 25 rainbow trout<br />
3 wk after chloramine-T disinfection failed to show Y. ruckeri, while 1 of six biofilters<br />
was positive for <strong>the</strong> pathogen. Five wks after chloramine-T disinfection none of <strong>the</strong> 25<br />
mucus samples from char was positive for A. salmonicida, while one of six biofilters was<br />
positive. Monitoring of both rainbow and char is being continued.<br />
Our results to date show that when Y. ruckeri or A. salmonicida are continuouely added<br />
to our recycle system for five days <strong>the</strong>se bacteria remain in <strong>the</strong> biofilters, even after 24 hr<br />
of continuous washing, and can produce overt disease in rainbow trout or char. However,<br />
if infected fish are removed and <strong>the</strong> entire system disinfected with 10 ppm chloramine-T<br />
and <strong>the</strong>n restocked no disease occurs and <strong>the</strong> pathogens cannot be cultured from feces,<br />
mucus, or biofilters. When <strong>the</strong> entire culture system is disinfected with 10 ppm<br />
chloramine-T and fish stocked no disease occurs and bacteria cannot be isolated from<br />
feces or mucus, but can be isolated from biofilters. It is possible that chloramine-T<br />
disinfection reduces <strong>the</strong> pathogens to a level where months may be required before overt<br />
disease is produced. However <strong>the</strong> presence of pathogens in <strong>the</strong> biofilters is a threat for<br />
newly stocked fish. We will continue to monitors fish and biofilters over several months<br />
to determine if disease will occur if pathogens are not added again and new fish stocked<br />
into <strong>the</strong> systems.<br />
Table 1. Transmission of Yersinia ruckeri and Aeromonas salmonicida after<br />
Rinsing biofilters and disinfection of <strong>the</strong> rest of <strong>the</strong> system with chlorine.<br />
Trial 1 Trial 2<br />
Trial 1<br />
Y. ruckeri Y. ruckeri A. salmonicida<br />
5 day culture addition 6.0 x 10 9 /ml 6.0 x 10 9 /ml 2.5 x 10 6 /ml<br />
Pathogen in system 1/6 biofilters+ 3/6 biofilters + 6/6 biofilters +<br />
after culture addition tank water + tank water + tank water +<br />
Pathogen in system not done 1/6 biofilters + 1/6 biofilters +<br />
After disinfection<br />
tank water - tank water -<br />
Mortality after restocking 21 days 11 days 15 days<br />
Prevalence before or after 6/25 feces + 2/25 feces + 2/25 mucus +<br />
mortality<br />
1/6 biofilters + 0/6 biofilters + 6/6 biofilters +<br />
before mortality after mortality after mortality<br />
Presence of pathogen after 0/6 biofilters + not done 0/6 biofilters +<br />
Chloramine-T<br />
tank water -<br />
tank water –<br />
Mortality after restocking no mortality 6 no mortality 6 wk no mortality 6 wk<br />
Or presence of pathogen wk<br />
biofilters and biofilters and<br />
biofilters and<br />
feces -<br />
Feces -<br />
Mucus -<br />
4
Acknowledgments<br />
This work was supported by <strong>the</strong> United States Department of Agriculture, Agricultural<br />
Research Service under agreement number 59-1930-8-038. Any opinions findings,<br />
conclusions, or recommendations expressed in this publication are those of <strong>the</strong> authors<br />
and do not necessarily reflect <strong>the</strong> view of <strong>the</strong> USDA.<br />
References<br />
Bullock, G. L., Hankins, J,. Heinen, J., Starliper, C., and Teska, J. 1993. “ Qualitative<br />
and quantitative bacteriological studies on a fluidized sand biofilter used in a semiclosed<br />
trout culture system.” U.S. Fish and Wildlife Service Biological Report 17.<br />
Cipriano, R., Bullock, G. L., and Noble, A. 1996. “ Nature of Aeromonas salmonicida<br />
carriage on asymptomatic rainbow trout mailntained in a culture system with<br />
recirculating water and fluidized-sand biofilters.” J. Aquat. Anim. Health 8:47-51.<br />
Egusa, S. 1981. Fish diseases and <strong>the</strong>ir control in intensive culture utilizing heated<br />
effluents or recirculation systems. <strong>Pages</strong> 33-38 In K.Tiews (ed.), Aquaculture in heated<br />
effluents and recirculation systems, Vol. 2. Heenemann Veerlagsgesellschaft mbH,<br />
Berlin, Germany.<br />
Mellergaard, S., Dalsgaard, I. 1987. “Disease problems in danish eel farms.”<br />
Aquaculture 67:139-146.<br />
Miles, A. A and Misra, S. S. 1938. “.The estimation of <strong>the</strong> bacteriocidal power of <strong>the</strong><br />
blood.” J. Hygiene 38:732-749.<br />
Noble, A. C., Summerfelt, S.T. 1996. Diseases encountered in rainbow trout cultured in<br />
recirculating systems. <strong>Pages</strong> 65-92 In M. Faisal and F. M.Hetrick (eds.) Annual Review<br />
of Fish Diseases, Vol 6. Elsiever, Great Britain.<br />
Waltman, W. D.,Shotts, E.B., Jr. 1984. “A medium for <strong>the</strong> isolation and differentiation<br />
of Yersinia ruckeri.” Can. J. Fish. Aquat. Sci. 41:804-806.<br />
Udey , L. R., 1982. “A differential medium for distinguishing Alr + from Alr -<br />
phenotypes of Aeromonas salmonicida.” Page 41 In Proceedings of <strong>the</strong> 13 th annual<br />
conference and 7 th annual eastern fish health workshop. International Association for<br />
Aquatic Animal Medicine, Baltimore, Md.<br />
5
Fish Health Monitoring and Maintenance of Small Scale<br />
Recirculating Systems in Virginia<br />
David Crosby<br />
Aquaculture Disease Specialist, Virginia Cooperative Extension, Virginia State<br />
University, Petersburg, VA<br />
The strong interest in aquaculture in <strong>the</strong> United States and especially in Virginia is<br />
resulting in many individuals considering aquaculture as a business opportunity. The<br />
Virginia Fish Farmers Association has taken <strong>the</strong> approach that small recirculating system<br />
growing tilapia integrated with hydroponics may be <strong>the</strong> best option. Many of <strong>the</strong>se<br />
systems, but not all, are self-designed and unproven to generate adequate and profitable<br />
production. Never<strong>the</strong>less, <strong>the</strong>se individuals are committed to learning and growing fish in<br />
small systems. Many of <strong>the</strong>se systems are designed to generate between 25,000 to<br />
100,000 lbs. per year.<br />
As with every production system, <strong>the</strong>re are inherent problems. Fish health concerns with<br />
recirculating systems are a topmost priority with <strong>the</strong> tilapia industry. The Virginia State<br />
University Aquaculture Diagnostic Laboratory has responded to many of this small scale<br />
recirculating system producer requests for assistance with fish health problems. The<br />
disease laboratory has assisted producers using small scale recirculating systems since<br />
1993. Fish health cases from recirculating systems ranges from about 25% to 50% per<br />
year of <strong>the</strong> total casework for <strong>the</strong> VSU Fish Disease Laboratory. The goal of keeping fish<br />
healthy means that a small-scale producer will have a marketable fish to sell. This paper<br />
summarizes specific fish health problems associated with recirculating systems in<br />
Virginia This paper also provides brief guidelines for fish health monitoring and<br />
maintenance of <strong>the</strong>se using small-scale systems in Virginia based on recent diagnostic<br />
casework.<br />
Inspections/Routine Checks<br />
Some producers have requested <strong>the</strong>ir fish be examined for fish health problems as a<br />
preventive measure or for fish health inspection for specific pathogens. This<br />
categorization of inspections/routine checks represents one third to one-half of <strong>the</strong><br />
casework from Virginia producers using recirculating systems. VSU laboratory receives<br />
on <strong>the</strong> average of 15 cases from recirculating systems per year. VSU laboratory has done<br />
numerous inspections for specific pathogens (using AFS Fish Health Section bluebook<br />
standards for detecting specific pathogen) and routine checks (necropsy of 5 to 20 fish for<br />
external parasites and gross pathology) for producers that are primarily raising tilapia.<br />
From 1996 to 1999 laboratory has done 39 inspections/routine checks.<br />
1
Parasites<br />
Clinical signs showed that in many cases tilapia had high numbers of external parasites<br />
but showed no signs of a disease outbreak. Ichthyobodo (Costia) constituted <strong>the</strong> most<br />
commonly found <strong>the</strong> external parasite. Ichthyobodo was found about 50% of <strong>the</strong> time<br />
during <strong>the</strong>se inspections/routine checks. Numbers found on <strong>the</strong> fish were considered to be<br />
of significant threat to cause a possible disease outbreak. Under <strong>the</strong>se circumstances, it<br />
was recommended to <strong>the</strong> producers to use formalin at 15 to 25 ppm as an indefinite<br />
treatment. Routine check follow-ups to treatments showed that treatment with formalin<br />
was effective in controlling <strong>the</strong>se parasites without upsetting <strong>the</strong> balance of <strong>the</strong> biological<br />
filter.<br />
O<strong>the</strong>r parasites found, but not as frequently, in significant number were Trichodina and<br />
Gyrodactylus (skin flukes). Formalin also was effective in controlling <strong>the</strong>se parasites.<br />
Bacteria<br />
No bacteria were recovered from any inspections/routine checks. Streptococcus was <strong>the</strong><br />
specific pathogen targeted by <strong>the</strong>se checks. No Streptococcus was recovered at any time<br />
from checks. Only time that this VSU laboratory recovered Streptococcus was in 1995<br />
from tilapia during an epizootic in progress. Streptococcus inspection were done using<br />
AFS Fish Health Section Blue Book Standards for sample size (sixty fish) for detecting<br />
specific pathogens. CNA agar, which is designed for recovering gram positive bacteria,<br />
was used as <strong>the</strong> media for Streptococcus detection. Fish brain was used as <strong>the</strong> inoculum<br />
onto <strong>the</strong> plate.<br />
Outline of Fish Health Maintenance<br />
The first and most important step in maintaining healthy fish is to implement best<br />
management practices. A facility operating under poor cultural management will<br />
consistently have fish diseases. Facilities that have best management practices will have<br />
healthy fish.<br />
The second step in maintaining healthy fish is to identify possible stressors. Fish stress is<br />
<strong>the</strong> primary initiator of diseases at a production facility. Management practices should avoid<br />
stressing fish during production.<br />
Quarantine Facility<br />
Regardless of facility size, it should have a quarantine facility that is separate or isolated<br />
from <strong>the</strong> rest of <strong>the</strong> facility. The quarantine facility is <strong>the</strong> most important management<br />
practice that can be done towards preventing <strong>the</strong> introduction of diseases into <strong>the</strong> facility.<br />
The quarantine room should be physically separation ei<strong>the</strong>r by rooms, walls or even by<br />
building. Quarantined fish should be held for at least two weeks, before introducing new<br />
fish into production facility. After two weeks, fish should be checked for potential<br />
2
disease problems. For tilapia, a specific pathogen examination should be done for<br />
Streptococcus. The Streptococcus check should come about 1½ to 2 weeks before<br />
moving fish. Before introduction of new fish into quarantine room, it should be clean<br />
from last use.<br />
Floors<br />
Try to avoid <strong>the</strong> use of dirt or gravel floors at a facility. These types of floors are not<br />
suitable or conducive for keeping facility clean. Debris and fish material works itself<br />
down in <strong>the</strong> gravel setting up possible contamination to tanks. Concrete floors can be<br />
power spray down to wash away debris and o<strong>the</strong>r materials out of building. An operation<br />
should have <strong>the</strong> ability to wash down everything with a high-pressure system. Keeping<br />
things clean and washing away all fish debris are critical for a good operation.<br />
Prophylactic Treatments<br />
Fish should be treated prophylactically each time when moved to <strong>the</strong> next stage of<br />
production. Formalin can be used ei<strong>the</strong>r as an indefinite or as a short-term bath treatment.<br />
The range for treatment is 15 to 25 ppms. Using 20 ppm has been used to treat systems<br />
with success. For bath treatment, formalin can be used at 125 to 250 for up to one hour.<br />
Only use a bath treatment, if a tank can be isolated and is capable of being flushed out.<br />
Medicine Cabinet<br />
Preventing disease outbreaks in tilapia is critical due to <strong>the</strong> lack of FDA approved<br />
chemicals and antibiotics. At this time, <strong>the</strong> only approved chemo<strong>the</strong>rapeutic treatment for<br />
tilapia is formalin. Efforts are underway to obtain approval for o<strong>the</strong>r chemo<strong>the</strong>rapeutic<br />
treatments such as Terramycin and Romet 30. These antibiotics are presently available<br />
and approved for use in <strong>the</strong> catfish and trout industry to control bacterial infections.<br />
Water Quality<br />
The vital key in <strong>the</strong> prevention of disease outbreaks at a facility is water quality. It is well<br />
known that recirculating systems water quality can go from good to bad very quickly.<br />
When this happens, formidable disease problems often appear and seem to never go a<br />
way. Poor water quality episodes can be <strong>the</strong> cause of fish diseases weeks later.<br />
Monitoring and managing of water quality parameters on a daily schedule are necessary<br />
and should be a mandatory management practice for recirculating facilities.<br />
Broodstock and Fingerlings<br />
In order to keep <strong>the</strong> risk of introducing diseases to your facility from stock coming from<br />
an outside production facility, one should think about developing <strong>the</strong>ir own brood stock<br />
and fingerlings facility to produce <strong>the</strong> needed fingerlings needed for <strong>the</strong> operation. This<br />
will allow for control over fish health issues at all stages of production. Clean broodstock<br />
3
should produce clean fingerlings. When buying fingerlings from outside sources you<br />
never know shat <strong>the</strong> fish have been exposed to (esoteric and unusual pathogens) or what<br />
<strong>the</strong>y are carrying.<br />
System Setup<br />
Having all production on one or two systems can lead to disaster. If disease outbreaks<br />
occur, <strong>the</strong> entire production facility will become infected with <strong>the</strong> disease. When<br />
developing a production facility, a fish health management plan should be used to guide<br />
construction. A producer should have a production system that is easily treatable and<br />
manageable for diseases. A facility that uses a few large units would most likely have<br />
difficulty in treating for a disease outbreak. This would result in shutting down <strong>the</strong><br />
system for disinfecting and having no production capabilities for months. If a disease gets<br />
into a facility with many small units, individual systems can be isolated and disinfected<br />
without total facility shut down.<br />
Summary of Fish health Maintenance and Monitoring Recommendations<br />
1. Good Management Practices.<br />
2. Quarantine system that can be physical separated from <strong>the</strong> main system.<br />
3. Prophylactic treatments for external parasites.<br />
4. Water quality monitoring program.<br />
5. Development of on site broodstock and fingerling production.<br />
6. Fish health training for <strong>the</strong> producer.<br />
7. Multiple systems for controlling disease outbreaks.<br />
4
The Role of Fish Density in Infectious Disease Outbreaks<br />
Julie Bebak<br />
Freshwater Institute<br />
Shepherdstown, WV<br />
Phil McAllister Ray Boston, Gary Smith<br />
USGS New Bolton Center<br />
<strong>National</strong> Fish Health Research Laboratory University of Pennsylvania<br />
Kearneysville, WV School of Veterinary Medicine<br />
Kennett Square, PA<br />
Introduction<br />
In food animal production, crowding of animals in <strong>the</strong> necessarily intensive culture<br />
environment is well-known to increase <strong>the</strong> risk of infectious disease outbreaks. In<br />
aquaculture, estimation of carrying capacity on a loading rate (kg/L/min) basis accounts<br />
for consumption of oxygen and feed and production of carbon dioxide and ammonia<br />
(Westers, 1981; Colt and Watten, 1988). The effect of density (kg/m 3 ) on fish behavior<br />
and product quality (e.g., fin erosion and skin abrasion) are also considered (Bosakowski<br />
and Wagner, 1994; Wagner et al., 1996; Wagner et al., 1997). Acute and chronic losses<br />
due to infectious disease outbreaks in aquaculture can impose a significant cost to<br />
productivity and, <strong>the</strong>refore, to profit. A few field studies have demonstrated that mortality<br />
during infectious disease outbreaks is higher at higher fish densities (Fagerlund et al.,<br />
1984; Mazur et al., 1993; Banks, 1994; LaPatra et al., 1996). Also, some general “rules<br />
of thumb” for suggested densities to avoid infectious disease outbreaks have been<br />
published for salmonid culture (Wedemeyer and Wood, 1974; Piper et al., 1982).<br />
However, details about <strong>the</strong> relationship between fish density/loading rates, pathogen<br />
concentration and <strong>the</strong> risk of infectious disease outbreaks have not been studied. This<br />
relationship should be quantified so that it can be included in estimates of system carrying<br />
capacity and in <strong>the</strong> development of risk analyses for aquaculture production.<br />
We used a disease model to explore three questions about <strong>the</strong> relationship between fish<br />
density, pathogen concentration and characteristics of infectious disease outbreaks. 1) As<br />
fish density and pathogen concentration increase, how does this change affect <strong>the</strong><br />
probability of survival for an individual fish? 2) How does <strong>the</strong> maximum population death<br />
rate change as pathogen load changes? 3) As pathogen load changes, what is <strong>the</strong> effect on<br />
<strong>the</strong> time at which <strong>the</strong> maximum death rate is reached?<br />
The model system<br />
The design requirements for studies that will anwer <strong>the</strong>se questions make it practically<br />
impossible for <strong>the</strong>m to be done in a commercial aquaculture facility. Large numbers of<br />
fish and tanks are needed. The requirements can be restrictive even for a well-equipped<br />
1
aquaculture research laboratory. After considering <strong>the</strong>se requirements, we chose<br />
infectious pancreatic necrosis (IPN) as our disease model. IPN, which is a viral disease, is<br />
an appropriate model because it affects small salmonid fish. Therefore, small tanks<br />
containing large numbers of fish can be used in an investigation.<br />
Young rainbow trout (34 days old) were used for <strong>the</strong> study. Conditions were set up to<br />
mimic rainbow trout fry culture in flow-through conditions. The study consisted of two<br />
experiments. The first lasted 59 days and <strong>the</strong> second lasted 53 days. The day before each<br />
experiment began, all of <strong>the</strong> fish in a single tank were infected with <strong>the</strong> IPN virus. These<br />
fish will be referred to as infectious, or INF, fish. The next day, <strong>the</strong>se INF fish were added<br />
to tanks containing various densities of uninfected, susceptible fish (Table 1). Ei<strong>the</strong>r 1, 2<br />
or 3 of <strong>the</strong> infectious fish were added. Additional tanks were set up that contained no INF<br />
fish or all INF fish. Tank densities ranged from about 23 to 162 kg/m 3 . The total<br />
densities were chosen to be near to, or greater than, <strong>the</strong> density of 0.5 lbs/ft 3<br />
recommended for culturing one inch rainbow trout (Piper et al., 1982) without any<br />
outbreaks of infectious disease. Tank volume was 1 liter of spring water at 54°F. Tank<br />
turnover rate was 15 times per hour. This high flow rate was chosen to maintain good<br />
water quality at high fish densities. Each day dead fish were removed and counted. All<br />
remaining fish were counted at <strong>the</strong> end of each experiment.<br />
Table 1. INF = Number of fish that were exposed to IPN virus (INF) and added to <strong>the</strong><br />
tanks. Total density = total density of fish in <strong>the</strong> tank. X is a tank that was lost when<br />
water flow to <strong>the</strong> tank was disrupted.<br />
INF Total density<br />
1 15,15,25,25,26,30,30,34,37,45,48,50,59,60,74,75,75,75,76,87,90,90,98,<br />
100,104,105<br />
2 14,15,27,28,45,45,60,60,75,75,89,92,105,105<br />
3 14,15,25,25,25,30,30,45,49,50,52,X,57,60,64,75,75,75,76,81,90,90,95,<br />
100,105,105<br />
All 15,15,30,30,45,45,60,60,69,75,75,86,90,105,105<br />
0 14,15,25,26,44,45,48,49,72,73,74,75,96,97,103,104<br />
Results<br />
Effect on probability of survival for individual fish<br />
The probability of survival to <strong>the</strong> end of <strong>the</strong> experiment was >0.98 for tanks where no INF<br />
fish were added (Fig 1A). As <strong>the</strong> number of INF fish added to <strong>the</strong> tanks increases, <strong>the</strong><br />
probability of survival to <strong>the</strong> end of <strong>the</strong> experiment (S(t)) decreases (Fig. 1A). When each<br />
group of infectious fish is considered separately, <strong>the</strong> effect of density can be seen (Fig. 1b<br />
– Fig. 1d). For <strong>the</strong> tanks where INF = 1, <strong>the</strong> probability of survival is higher at densities<br />
This apparent interaction between total density and number of INF fish has been<br />
confirmed with regression models.<br />
Figure 1a – 1d. Survival curves. Fig. 1A: Each curve represents number of infectious<br />
(INF) fish added (l=1 INF fish; h=2 INF fish; c=3 INF fish; y=All INF fish; ~=0 INF<br />
fish). Figure 1B: Survival curves for tanks where 1 INF fish added. Figure 1C: Survival<br />
curves for tanks where 2 INF fish. Figure 1D: Survival curves for 3 infectious fish added.<br />
For figures 1B – 1D, l=density
increased, <strong>the</strong> time to <strong>the</strong> maximum death rate decreased, until it reached 13.5 days for<br />
tanks where all fish were infectious.<br />
Figure 2a - 2b. Fig 2a. Maximum death rate (fish/(fish⋅day)) vs. number of infectious<br />
fish added. Fig. 2b. Time to maximum death rate (fish/(fish⋅day)) vs. number of infectious<br />
fish added.<br />
Discussion<br />
Maximum death rate<br />
Time to maximum death rate (days)<br />
0.70<br />
0.60<br />
0.50<br />
0.40<br />
0.30<br />
0.20<br />
0.10<br />
0.00<br />
30<br />
25<br />
20<br />
15<br />
10<br />
1 2 3 All<br />
Number of infectious fish added<br />
1 2 3 All<br />
Number of infectious fish added<br />
More quantification is needed before fish density/loading, pathogen concentration and <strong>the</strong><br />
risk of infectious disease outbreaks can be used in carrying capacity and risk analysis<br />
estimates. However, this work contributes new information that describes how fish density<br />
and pathogen load will interact to affect characteristics of disease outbreaks in an<br />
aquaculture system. It also emphasizes <strong>the</strong> importance of effective biosecurity measures.<br />
The effect of fish density on <strong>the</strong> probability of survival for an individual fish will depend on<br />
<strong>the</strong> pathogen load. For example, when <strong>the</strong> pathogen concentration is lower (e.g., INF=1),<br />
fish in tanks containing lower densities have a greater probability of survival than fish in<br />
tanks containing higher densities. However, as <strong>the</strong> pathogen load increases (e.g., INF=2,<br />
INF=3), <strong>the</strong> advantage of lower density disappears, that is, at a given point in time, <strong>the</strong><br />
probability of survival is similar regardless of density. Pathogen load also affects <strong>the</strong><br />
maximum death rate and <strong>the</strong> time to <strong>the</strong> maximum death rate. The lower <strong>the</strong> pathogen<br />
concentration, <strong>the</strong> lower <strong>the</strong> maximum death rate and <strong>the</strong> longer <strong>the</strong> time taken to reach<br />
<strong>the</strong> maximum death rate.<br />
4
References<br />
Banks, J.L. (1994) Raceway density and water flow as factors affecting spring chinook<br />
salmon during rearing and after release. Aquaculture, 119, 201-217.<br />
Bosakowski, T. & Wagner, E.J. (1994) A survey of trout fin erosion, water quality, and<br />
rearing conditions at state fish hatcheries in Utah. Journal of <strong>the</strong> World<br />
Aquaculture Society, 25, 308-316.<br />
Colt, J. & Watten, B. (1988) Applications of pure oxygen in fish culture. Aquacultural<br />
Engineering, 7, 397-441.<br />
Ewing, R.D. & Ewing, S.K. (1995) Review of <strong>the</strong> effects of rearing density on survival to<br />
adulthood for Pacific salmon. The Progressive Fish-Culturist, 57, 1-25.<br />
Fagerlund, U.H.M., McBride, J.R., Dosanjh, H., Bilton, T., Morley, R.B. & Van Tine, J.<br />
(1984) Density effects on performance to release of three size groups within<br />
populations of pond-reared juvenile coho salmon. Smolts released from Quinsam<br />
Hatchery in 1983.<br />
LaPatra, S.E., Groff, J.M., Patterson, T.L., Shewmaker, W.D., Casten, M., Siple, J. &<br />
Hauck, A.K. (1996) Preliminary evidence of sturgeon density and o<strong>the</strong>r stressors<br />
on manifestation of white sturgeon iridovirus disease. Journal of Applied<br />
Aquaculture, 6, 51-58.<br />
Mazur, C.F., Tillapaugh, D. & Iwama, G.K. (1993) The effects of feeding level and<br />
rearing density on <strong>the</strong> prevalence of Renibacterium salmoninarum in chinook<br />
salmon (Oncorhynchus tshawytscha). Aquaculture, 117, 141-147.<br />
Piper, R.G., McElwain, I.B., Orme, L.E., McCraren, J.P., Fowler, L.G. & Leonard, J.R.<br />
(1982) Fish Hatchery Management, United States Department of <strong>the</strong> Interior, Fish<br />
and Wildlife Service, Washington, D.C.<br />
Wagner, E., Intelmann, S.S. & Routledge, M.D. (1996) The Effects of Fry Rearing<br />
Density on Hatchery Performance, Fin Condition , and Agonistic Behavior of<br />
Rainbow Trout Oncorhynchus mykiss fry. Journal of <strong>the</strong> World Aquaculture<br />
Society, 27, 264-274.<br />
Wagner, E.J., Jeppsen, T., Arndt, R., Routledge, M.D. & Bradwisch, Q. (1997) Effects of<br />
rearing desity upon cutthroat trout hematology, hatchery performance, fin erosion<br />
and general health and condition. The Progressive Fish-Culturist, 59, 173-187.<br />
Wedemeyer, G.A. & Wood, J.W. (1974) Stress as a predisposing factor in fish diseases.<br />
United States Department of <strong>the</strong> Interior, Fish and Wildlife Service, Division of<br />
Fishery Research, Washington, D.C.<br />
Westers, H. (1981) Fish Culture Manual for <strong>the</strong> State of Michigan. Michigan Department<br />
of Natural Resources, Lansing, MI.<br />
5