Counting populations - BiologyMad A-Level Biology
Counting populations - BiologyMad A-Level Biology
Counting populations - BiologyMad A-Level Biology

Create successful ePaper yourself
Turn your PDF publications into a flip-book with our unique Google optimized e-Paper software.
This chapter covers Ecology and, as such, has a vocabulary all its own – which is often examined.<br />
Environment: All the organisms (biotic) and the conditions (abiotic) which exist in an area<br />
Abiotic factors: all the non-living factors in an environment, such as rainfall, temperature, soil.<br />
Biotic factors: All the living organisms in an area – such as producers, predators and parasites.<br />
Population: All the members of one species living in an area<br />
Community: The total of all the <strong>populations</strong> living in an area (i.e. all the biotic factors)<br />
Ecosystem: The community of living organisms and the abiotic factors affecting them in one area.<br />
Habitat: The place where an organism lives<br />
Niche: Where an organism fits into the community - covering feeding, nesting, and range of habitat.<br />
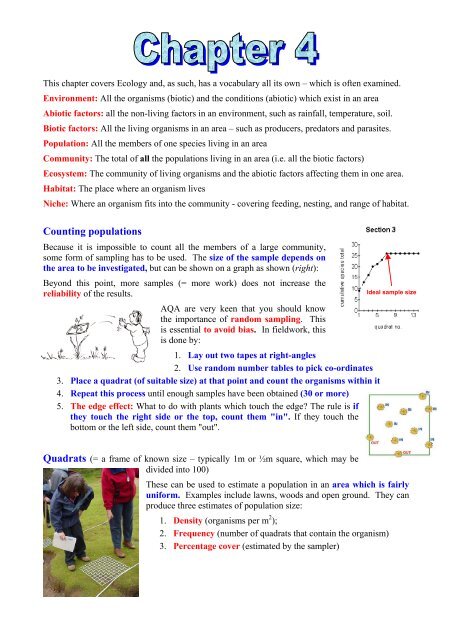
<strong>Counting</strong> <strong>populations</strong><br />
Because it is impossible to count all the members of a large community,<br />
some form of sampling has to be used. The size of the sample depends on<br />
the area to be investigated, but can be shown on a graph as shown (right):<br />
Beyond this point, more samples (= more work) does not increase the<br />
reliability of the results.<br />
3.<br />
4.<br />
5.<br />
AQA are very keen that you should know<br />
the importance of random sampling. This<br />
is essential to avoid bias. In fieldwork, this<br />
is done by:<br />
1. Lay out two tapes at right-angles<br />
2. Use random number tables to pick co-ordinates<br />
Place a quadrat (of suitable size) at that point and count the organisms within it<br />
Repeat this process until enough samples have been obtained (30 or more)<br />
The edge effect: What to do with plants which touch the edge? The rule is if<br />
they touch the right side or the top, count them "in". If they touch the<br />
bottom or the left side, count them "out".<br />
Quadrats (= a frame of known size – typically 1m or ½m square, which may be<br />
divided into 100)<br />
Ideal sample size<br />
These can be used to estimate a population in an area which is fairly<br />
uniform. Examples include lawns, woods and open ground. They can<br />
produce three estimates of population size:<br />
1. Density (organisms per m 2 );<br />
2. Frequency (number of quadrats that contain the organism)<br />
3. Percentage cover (estimated by the sampler)
Transects (= a straight line. Can be of any length, but<br />
samples are taken at uniform intervals along it)<br />
These are used when the abiotic factors gradually vary,<br />
causing a change to the organisms living there. Examples<br />
include seashores (low → high tide); across streams; up<br />
hillsides. Can be used with a quadrat to sample in more<br />
detail, otherwise population estimates are limited to<br />
frequency. Useful to obtain a general ‘overview’ of an area<br />
before starting more detailed work with quadrats.<br />
Mark-release-recapture<br />
Since animals are mobile, it is difficult to use quadrats or transects to count them. Instead, the<br />
mark-release-recapture technique is used.<br />
1. A (large) sample group of the animal is caught (without injury)<br />
2. They are all marked (usually underneath, with paint) such that their survival is not affected<br />
3. They are released back into the same area they were captured<br />
4. They are allowed time to mix with the rest of the population, but not to reproduce<br />
5. A second, unbiased, sample group is captured and divided into<br />
a. those that are marked (i.e. have been recaptured) and<br />
b. those that are unmarked (i.e. have been caught for the first time).<br />
6. The population is calculated from:<br />
Population = Overall total in second sample (5) x Total number marked (2)<br />
Total number of marked individuals in second sample (5a)<br />
This formula assumes that:<br />
1. The population does not change between samples, due to migration, predation or breeding.<br />
2. The marked individuals mix freely (and randomly) with the rest of the population<br />
3. Marking does not affect the animal in any way.<br />
Diversity<br />
This describes a community, both by the total number of species present and by the number of<br />
organisms present. The index of diversity (d) is given by:<br />
Where:<br />
d = N (N − 1)<br />
∑ n (n – 1)<br />
• N = total number of organisms in the area (i.e. the community, or sum of the <strong>populations</strong>)<br />
• n = total number of each organism (i.e. each individual population)<br />
• ∑ = ‘sum of’ (i.e. calculate each value, and then add them together.<br />
It follows that the bottom line can involve quite a lot of calculating! When looking at the final<br />
index of diversity total (the value is generally between 2 and 10), remember that:<br />
• The harsher the environment, the lower diversity. Abiotic factors dominate.<br />
• The less harsh the environment, the greater the diversity and biotic factors dominate.
Succession<br />
Some of the organisms in<br />
an area are gradually<br />
replaced over time by new<br />
species. This succession<br />
is a result of the changes<br />
to the environment<br />
brought about by the<br />
organisms themselves.<br />
Through succession, the<br />
organisms tend to get<br />
bigger and more<br />
complex, whilst the<br />
biodiversity also rises.<br />
Pioneer species are those<br />
that first colonise bare soil<br />
or rock. They can withstand the harsh environment, and include lichens and mosses and Marram<br />
Grass on sand dunes. The process continues in stages (seres) until the climax community is<br />
reached, which will remain stable until the abiotic factors change.<br />
Ultimately, it does not<br />
matter very much<br />
what the starting point<br />
for succession is -<br />
rock, bog or pond - as<br />
eventually the climax<br />
community will be<br />
much the same, since<br />
the climate is the main<br />
influence on it.<br />
If succession is halted (e.g. by fire,<br />
flood or by Man’s actions – such as<br />
ploughing), then a secondary<br />
succession will start. This is much<br />
faster than primary succession as<br />
there are many seeds in the soil<br />
from which new plants can grow,<br />
whilst animals readily colonise the<br />
area as soon as the plants appear.
Food Chains and Food Webs<br />
• Not all of the ‘prey’ organism is<br />
actually eaten<br />
• Only the energy eaten, assimilated<br />
and used for growth by the ‘prey’<br />
is available to the ‘predator’. Most<br />
of the ‘missing’ 90% of energy is<br />
lost in respiration, but also in<br />
keeping warm, moving etc.<br />
For these reasons, food chains are usually<br />
short and big, fierce animals are rare (thank<br />
goodness!)<br />
Ecological Pyramids<br />
Once again, a few terms need to be learned:<br />
Producer: An autotroph i.e. it can make organic<br />
molecules from inorganic ones. Normally these are<br />
plants. Only about 1% of the Sun’s energy is trapped<br />
by photosynthesis in new organic matter, so this, vital,<br />
stage of any food web is by far the least efficient.<br />
Primary consumer: A herbivorous heterotroph<br />
Secondary consumer: A carnivorous heterotroph<br />
Decomposer: The microbes that respire the molecules in<br />
dead & waste matter and so recycle them.<br />
Only about 10% of the energy at any level in a food chain<br />
is passed on to the next level. This is because:<br />
These have not changed since you did them at primary school. Pyramids of<br />
Numbers can be inverted (when a parasite is involved – see right);<br />
Pyramids of Biomass and Pyramids of Energy are<br />
never inverted (see left). Thus, if one appears in the<br />
exam, it is because the lower (smaller) level is<br />
reproducing very quickly (and the figure used only<br />
shows one moment), or there is another source of food that has been<br />
omitted (usually that is dead material).<br />
© IHW April 2006