

Application Compendium - Agilent Technologies
Application Compendium - Agilent Technologies
Application Compendium - Agilent Technologies

You also want an ePaper? Increase the reach of your titles
YUMPU automatically turns print PDFs into web optimized ePapers that Google loves.
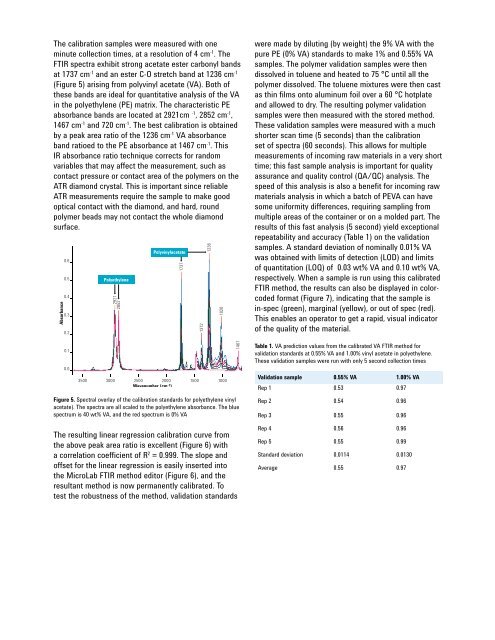
The calibration samples were measured with one<br />
minute collection times, at a resolution of 4 cm -1 . The<br />
FTIR spectra exhibit strong acetate ester carbonyl bands<br />
at 1737 cm -1 and an ester C-O stretch band at 1236 cm -1<br />
(Figure 5) arising from polyvinyl acetate (VA). Both of<br />
these bands are ideal for quantitative analysis of the VA<br />
in the polyethylene (PE) matrix. The characteristic PE<br />
absorbance bands are located at 2921cm -1 , 2852 cm -1 ,<br />
1467 cm -1 and 720 cm -1 . The best calibration is obtained<br />
by a peak area ratio of the 1236 cm -1 VA absorbance<br />
band ratioed to the PE absorbance at 1467 cm -1 . This<br />
IR absorbance ratio technique corrects for random<br />
variables that may affect the measurement, such as<br />
contact pressure or contact area of the polymers on the<br />
ATR diamond crystal. This is important since reliable<br />
ATR measurements require the sample to make good<br />
optical contact with the diamond, and hard, round<br />
polymer beads may not contact the whole diamond<br />
surface.<br />
Absorbance<br />
0.6<br />
0.5<br />
0.4<br />
0.3<br />
0.2<br />
0.1<br />
0.0<br />
3500<br />
Polyethylene<br />
2921<br />
2852<br />
Polyvinylacetate<br />
Figure 5. Spectral overlay of the calibration standards for polyethylene vinyl<br />
acetate). The spectra are all scaled to the polyethylene absorbance. The blue<br />
spectrum is 40 wt% VA, and the red spectrum is 0% VA<br />
The resulting linear regression calibration curve from<br />
the above peak area ratio is excellent (Figure 6) with<br />
a correlation coeffi cient of R 2 = 0.999. The slope and<br />
offset for the linear regression is easily inserted into<br />
the MicroLab FTIR method editor (Figure 6), and the<br />
resultant method is now permanently calibrated. To<br />
test the robustness of the method, validation standards<br />
1737<br />
3000 2500 2000 1500<br />
Wavenumber (cm-1) 1372<br />
1236<br />
1020<br />
1000<br />
1467<br />
were made by diluting (by weight) the 9% VA with the<br />
pure PE (0% VA) standards to make 1% and 0.55% VA<br />
samples. The polymer validation samples were then<br />
dissolved in toluene and heated to 75 °C until all the<br />
polymer dissolved. The toluene mixtures were then cast<br />
as thin fi lms onto aluminum foil over a 60 °C hotplate<br />
and allowed to dry. The resulting polymer validation<br />
samples were then measured with the stored method.<br />
These validation samples were measured with a much<br />
shorter scan time (5 seconds) than the calibration<br />
set of spectra (60 seconds). This allows for multiple<br />
measurements of incoming raw materials in a very short<br />
time; this fast sample analysis is important for quality<br />
assurance and quality control (QA/QC) analysis. The<br />
speed of this analysis is also a benefi t for incoming raw<br />
materials analysis in which a batch of PEVA can have<br />
some uniformity differences, requiring sampling from<br />
multiple areas of the container or on a molded part. The<br />
results of this fast analysis (5 second) yield exceptional<br />
repeatability and accuracy (Table 1) on the validation<br />
samples. A standard deviation of nominally 0.01% VA<br />
was obtained with limits of detection (LOD) and limits<br />
of quantitation (LOQ) of 0.03 wt% VA and 0.10 wt% VA,<br />
respectively. When a sample is run using this calibrated<br />
FTIR method, the results can also be displayed in colorcoded<br />
format (Figure 7), indicating that the sample is<br />
in-spec (green), marginal (yellow), or out of spec (red).<br />
This enables an operator to get a rapid, visual indicator<br />
of the quality of the material.<br />
Table 1. VA prediction values from the calibrated VA FTIR method for<br />
validation standards at 0.55% VA and 1.00% vinyl acetate in polyethylene.<br />
These validation samples were run with only 5 second collection times<br />
4<br />
Validation sample 0.55% VA 1.00% VA<br />
Rep 1 0.53 0.97<br />
Rep 2 0.54 0.96<br />
Rep 3 0.55 0.96<br />
Rep 4 0.56 0.96<br />
Rep 5 0.55 0.99<br />
Standard deviation 0.0114 0.0130<br />
Average 0.55 0.97


