

Application Compendium - Agilent Technologies
Application Compendium - Agilent Technologies
Application Compendium - Agilent Technologies

Create successful ePaper yourself
Turn your PDF publications into a flip-book with our unique Google optimized e-Paper software.
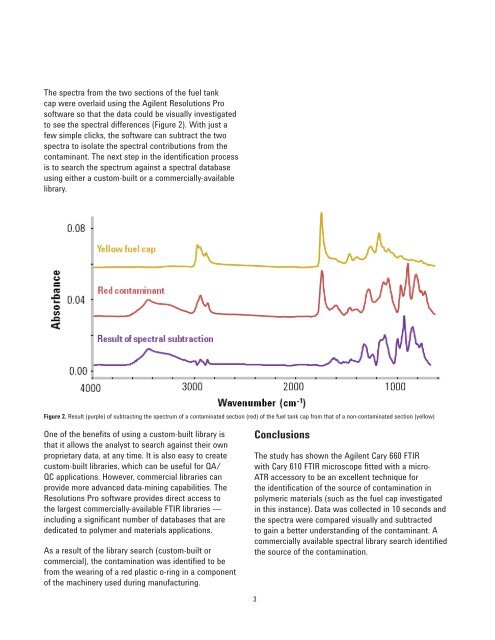
The spectra from the two sections of the fuel tank<br />
cap were overlaid using the <strong>Agilent</strong> Resolutions Pro<br />
software so that the data could be visually investigated<br />
to see the spectral differences (Figure 2). With just a<br />
few simple clicks, the software can subtract the two<br />
spectra to isolate the spectral contributions from the<br />
contaminant. The next step in the identifi cation process<br />
is to search the spectrum against a spectral database<br />
using either a custom-built or a commercially-available<br />
library.<br />
Figure 2. Result (purple) of subtracting the spectrum of a contaminated section (red) of the fuel tank cap from that of a non-contaminated section (yellow)<br />
One of the benefi ts of using a custom-built library is<br />
that it allows the analyst to search against their own<br />
proprietary data, at any time. It is also easy to create<br />
custom-built libraries, which can be useful for QA/<br />
QC applications. However, commercial libraries can<br />
provide more advanced data-mining capabilities. The<br />
Resolutions Pro software provides direct access to<br />
the largest commercially-available FTIR libraries —<br />
including a signifi cant number of databases that are<br />
dedicated to polymer and materials applications.<br />
As a result of the library search (custom-built or<br />
commercial), the contamination was identifi ed to be<br />
from the wearing of a red plastic o-ring in a component<br />
of the machinery used during manufacturing.<br />
Conclusions<br />
The study has shown the <strong>Agilent</strong> Cary 660 FTIR<br />
with Cary 610 FTIR microscope fi tted with a micro-<br />
ATR accessory to be an excellent technique for<br />
the identifi cation of the source of contamination in<br />
polymeric materials (such as the fuel cap investigated<br />
in this instance). Data was collected in 10 seconds and<br />
the spectra were compared visually and subtracted<br />
to gain a better understanding of the contaminant. A<br />
commercially available spectral library search identifi ed<br />
the source of the contamination.<br />
3


