

Application Compendium - Agilent Technologies
Application Compendium - Agilent Technologies
Application Compendium - Agilent Technologies

You also want an ePaper? Increase the reach of your titles
YUMPU automatically turns print PDFs into web optimized ePapers that Google loves.
This methodology makes use of the relationship between<br />
molecular weight and molecular density, allowing accurate<br />
molecular weights to be determined for materials irrespective<br />
of their chemistry. This note describes the analysis of a series<br />
of five poly(styrene-co-methyl methacrylate) copolymers<br />
manufactured with different molecular weights by GPC<br />
viscometry.<br />
Results and Discussion<br />
Conditions<br />
Columns: 2 x <strong>Agilent</strong> PLgel 5 µm MIXED-C, 300 x 7.5 mm<br />
(part number PL1110-6500)<br />
Eluent: Tetrahydrofuran<br />
Flow Rate: 1 mL/min<br />
Inj. Vol: 100 µL<br />
Sample Conc: 2 mg/mL<br />
Temp: 40 °C<br />
Detectors: <strong>Agilent</strong> 390-MDS Multi Detection Suite comprising<br />
a differential refractive index and a four capillary<br />
bridge viscometer<br />
Calibration Standards: <strong>Agilent</strong> Polystyrene EasiVials<br />
Figure 1 shows overlaid dual detector raw data<br />
chromatograms for a poly(styrene-co-methyl methacrylate)<br />
sample showing the data collected from the individual<br />
detectors. The polymers all eluted as narrow near-Gaussian<br />
peaks.<br />
Response<br />
Viscometry<br />
Differential refractive index<br />
0 2 4 6 8 10 12 14 16 18 20 22<br />
Retention time / min<br />
Figure 1. Overlaid dual detector raw data chromatograms for a block<br />
copolymer sample<br />
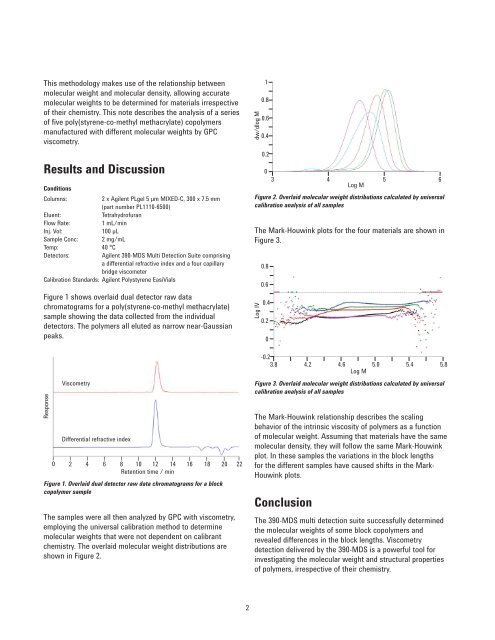
The samples were all then analyzed by GPC with viscometry,<br />
employing the universal calibration method to determine<br />
molecular weights that were not dependent on calibrant<br />
chemistry. The overlaid molecular weight distributions are<br />
shown in Figure 2.<br />
2<br />
dw/dlog M<br />
1<br />
0.8<br />
0.6<br />
0.4<br />
0.2<br />
0<br />
3<br />
4 5<br />
Log M<br />
Figure 2. Overlaid molecular weight distributions calculated by universal<br />
calibration analysis of all samples<br />
The Mark-Houwink plots for the four materials are shown in<br />
Figure 3.<br />
Log IV<br />
0.8<br />
0.6<br />
0.4<br />
0.2<br />
0<br />
-0.2<br />
3.8<br />
4.2 4.6 5.0 5.4 5.8<br />
Log M<br />
Figure 3. Overlaid molecular weight distributions calculated by universal<br />
calibration analysis of all samples<br />
The Mark-Houwink relationship describes the scaling<br />
behavior of the intrinsic viscosity of polymers as a function<br />
of molecular weight. Assuming that materials have the same<br />
molecular density, they will follow the same Mark-Houwink<br />
plot. In these samples the variations in the block lengths<br />
for the different samples have caused shifts in the Mark-<br />
Houwink plots.<br />
Conclusion<br />
The 390-MDS multi detection suite successfully determined<br />
the molecular weights of some block copolymers and<br />
revealed differences in the block lengths. Viscometry<br />
detection delivered by the 390-MDS is a powerful tool for<br />
investigating the molecular weight and structural properties<br />
of polymers, irrespective of their chemistry.<br />
6


