

Application Compendium - Agilent Technologies
Application Compendium - Agilent Technologies
Application Compendium - Agilent Technologies

Create successful ePaper yourself
Turn your PDF publications into a flip-book with our unique Google optimized e-Paper software.
Robustness<br />
To test the robustness of the method, a<br />
standard solution containing 30 ng/mL<br />
of BPA and BPF was used. Six critical<br />
method parameters (fl ow rate, column<br />
temperature, injector volume, excitation<br />
and emission wavelength, step<br />
gradient and buffer concentration)<br />
were varied separately and data were<br />
collected for seven replicate injections.<br />
The compound peak areas from the last<br />
six replicates were compared for analysis.<br />
The allowed deviation for the area<br />
and retention time was set to ± 5% and<br />
± 3% respectively.<br />
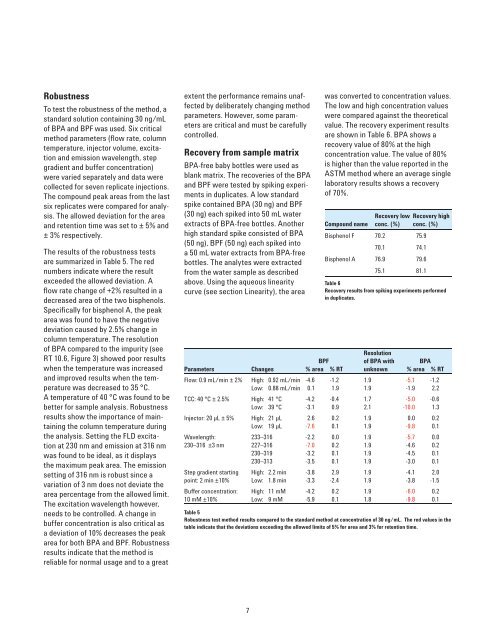
The results of the robustness tests<br />
are summarized in Table 5. The red<br />
numbers indicate where the result<br />
exceeded the allowed deviation. A<br />
fl ow rate change of +2% resulted in a<br />
decreased area of the two bisphenols.<br />
Specifi cally for bisphenol A, the peak<br />
area was found to have the negative<br />
deviation caused by 2.5% change in<br />
column temperature. The resolution<br />
of BPA compared to the impurity (see<br />
RT 10.6, Figure 3) showed poor results<br />
when the temperature was increased<br />
and improved results when the temperature<br />
was decreased to 35 °C.<br />
A temperature of 40 °C was found to be<br />
better for sample analysis. Robustness<br />
results show the importance of maintaining<br />
the column temperature during<br />
the analysis. Setting the FLD excitation<br />
at 230 nm and emission at 316 nm<br />
was found to be ideal, as it displays<br />
the maximum peak area. The emission<br />
setting of 316 nm is robust since a<br />
variation of 3 nm does not deviate the<br />
area percentage from the allowed limit.<br />
The excitation wavelength however,<br />
needs to be controlled. A change in<br />
buffer concentration is also critical as<br />
a deviation of 10% decreases the peak<br />
area for both BPA and BPF. Robustness<br />
results indicate that the method is<br />
reliable for normal usage and to a great<br />
extent the performance remains unaffected<br />
by deliberately changing method<br />
parameters. However, some parameters<br />
are critical and must be carefully<br />
controlled.<br />
Recovery from sample matrix<br />
BPA-free baby bottles were used as<br />
blank matrix. The recoveries of the BPA<br />
and BPF were tested by spiking experiments<br />
in duplicates. A low standard<br />
spike contained BPA (30 ng) and BPF<br />
(30 ng) each spiked into 50 mL water<br />
extracts of BPA-free bottles. Another<br />
high standard spike consisted of BPA<br />
(50 ng), BPF (50 ng) each spiked into<br />
a 50 mL water extracts from BPA-free<br />
bottles. The analytes were extracted<br />
from the water sample as described<br />
above. Using the aqueous linearity<br />
curve (see section Linearity), the area<br />
7<br />
was converted to concentration values.<br />
The low and high concentration values<br />
were compared against the theoretical<br />
value. The recovery experiment results<br />
are shown in Table 6. BPA shows a<br />
recovery value of 80% at the high<br />
concentration value. The value of 80%<br />
is higher than the value reported in the<br />
ASTM method where an average single<br />
laboratory results shows a recovery<br />
of 70%.<br />
Compound name<br />
Recovery low<br />
conc. (%)<br />
Bisphenol F 70.2 75.9<br />
70.1 74.1<br />
Bisphenol A 76.9 79.6<br />
75.1 81.1<br />
Recovery high<br />
conc. (%)<br />
Table 6<br />
Recovery results from spiking experiments performed<br />
in duplicates.<br />
BPF<br />
Resolution<br />
of BPA with BPA<br />
Parameters Changes % area % RT unknown % area % RT<br />
Flow: 0.9 mL/min ± 2% High: 0.92 mL/min -4.6 -1.2 1.9 -5.1 -1.2<br />
Low: 0.88 mL/min 0.1 1.9 1.9 -1.9 2.2<br />
TCC: 40 °C ± 2.5% High: 41 °C -4.2 -0.4 1.7 -5.0 -0.6<br />
Low: 39 °C -3.1 0.9 2.1 -10.0 1.3<br />
Injector: 20 µL ± 5% High: 21 µL 2.6 0.2 1.9 0.0 0.2<br />
Low: 19 µL -7.6 0.1 1.9 -9.8 0.1<br />
Wavelength: 233–316 -2.2 0.0 1.9 -5.7 0.0<br />
230–316 ±3 nm 227–316 -7.0 0.2 1.9 -4.6 0.2<br />
230–319 -3.2 0.1 1.9 -4.5 0.1<br />
230–313 -3.5 0.1 1.9 -3.0 0.1<br />
Step gradient starting High: 2.2 min -3.8 2.9 1.9 -4.1 2.0<br />
point: 2 min ±10% Low: 1.8 min -3.3 -2.4 1.9 -3.8 -1.5<br />
Buffer concentration: High: 11 mM -4.2 0.2 1.9 -6.0 0.2<br />
10 mM ±10% Low: 9 mM -5.9 0.1 1.8 -9.8 0.1<br />
Table 5<br />
Robustness test method results compared to the standard method at concentration of 30 ng/mL. The red values in the<br />
table indicate that the deviations exceeding the allowed limits of 5% for area and 3% for retention time.


