watervulnerability
watervulnerability watervulnerability
Grand Mesa, Uncompahgre and Gunnison National Forest Watershed Vulnerability Assessment, Rocky Mountain Region (R2) areas (Cochetopa, Uncompahgre, and West Elk). The amount of available water is expected to become limiting in the Uncompahgre, Cochetopa, and West Elk geographic areas for three out of four seasons. Figure 19 displays the annual change in aridity indices for both the composite and MIROC_3.2 models, compared to the historic trend. All geographic areas are predicted to become drier. The largest changes will actually occur at the highest elevations (San Juans, Upper Taylor, and Grand Mesa) in those geographic areas with the highest precipitation. These areas also have the greatest capacity to buffer the effects of climate change because of the high levels of water produced from snowmelt and higher occurrence of aquatic habitats. These areas also support high levels of water development for human uses, so any increase in aridity could have a dramatic effect on water uses. This is potentially a very big concern in the Grand Mesa geographic area, where the annual aridity index is predicted to drop below 1. Airidity Index (mm/mm) 5.0 4.5 4.0 3.5 3.0 2.5 2.0 1.5 1.0 0.5 0.0 -‐11.18% -‐23.35% Historic COMP MIROC -‐9.37% 1.29 -‐18.31% -‐11.87% 1.07 -‐22.00% Figure 19. Annual Change in Aridity Index by Geographic Area 0.88 0.87 Geographic areas were ranked for exposure, based on the predicted changes (from the MIROC_3.2 model outputs) for maximum and minimum temperatures and the annual percent change in aridity index (Table 3). A score of 1 indicates lower exposure; a score of 6 indicates higher exposure. Figure 20 displays this ranking. 88 Assessing the Vulnerability of Watersheds to Climate Change -‐8.72% -‐9.53% -‐8.57% -‐18.05% -‐18.79% -‐18.80% San Juans Upper Taylor Grand Mesa West Elk Cochetopa Uncompahgre 0.75 0% -‐10% -‐20% -‐30% -‐40% -‐50% -‐60% -‐70% -‐80% -‐90% -‐100% Percent Change (%)
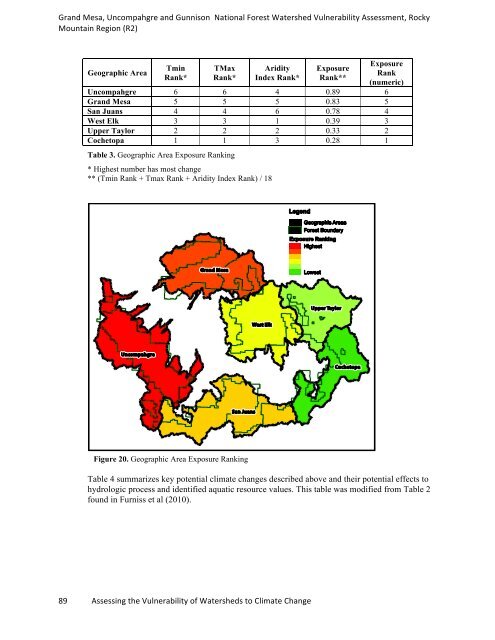
Grand Mesa, Uncompahgre and Gunnison National Forest Watershed Vulnerability Assessment, Rocky Mountain Region (R2) Geographic Area Tmin Rank* TMax Rank* Aridity Index Rank* 89 Assessing the Vulnerability of Watersheds to Climate Change Exposure Rank** Exposure Rank (numeric) Uncompahgre 6 6 4 0.89 6 Grand Mesa 5 5 5 0.83 5 San Juans 4 4 6 0.78 4 West Elk 3 3 1 0.39 3 Upper Taylor 2 2 2 0.33 2 Cochetopa 1 1 3 0.28 1 Table 3. Geographic Area Exposure Ranking * Highest number has most change ** (Tmin Rank + Tmax Rank + Aridity Index Rank) / 18 Figure 20. Geographic Area Exposure Ranking Table 4 summarizes key potential climate changes described above and their potential effects to hydrologic process and identified aquatic resource values. This table was modified from Table 2 found in Furniss et al (2010).
- Page 42 and 43: Gallatin National Forest Watershed
- Page 44 and 45: Gallatin National Forest Watershed
- Page 46 and 47: Gallatin National Forest Watershed
- Page 48 and 49: Gallatin National Forest Watershed
- Page 50 and 51: Assessment of Watershed Vulnerabili
- Page 52 and 53: Helena National Forest Watershed Vu
- Page 54 and 55: Helena National Forest Watershed Vu
- Page 56 and 57: Helena National Forest Watershed Vu
- Page 58 and 59: Helena National Forest Watershed Vu
- Page 60 and 61: Helena National Forest Watershed Vu
- Page 62 and 63: Helena National Forest Watershed Vu
- Page 64 and 65: Helena National Forest Watershed Vu
- Page 66 and 67: Helena National Forest Watershed Vu
- Page 68 and 69: Assessment of Watershed Vulnerabili
- Page 70 and 71: Grand Mesa, Uncompahgre and Gunniso
- Page 72 and 73: Grand Mesa, Uncompahgre and Gunniso
- Page 74 and 75: Grand Mesa, Uncompahgre and Gunniso
- Page 76 and 77: Grand Mesa, Uncompahgre and Gunniso
- Page 78 and 79: Grand Mesa, Uncompahgre and Gunniso
- Page 80 and 81: Grand Mesa, Uncompahgre and Gunniso
- Page 82 and 83: Grand Mesa, Uncompahgre and Gunniso
- Page 84 and 85: Grand Mesa, Uncompahgre and Gunniso
- Page 86 and 87: Grand Mesa, Uncompahgre and Gunniso
- Page 88 and 89: Grand Mesa, Uncompahgre and Gunniso
- Page 90 and 91: Grand Mesa, Uncompahgre and Gunniso
- Page 94 and 95: Grand Mesa, Uncompahgre and Gunniso
- Page 96 and 97: Grand Mesa, Uncompahgre and Gunniso
- Page 98 and 99: Grand Mesa, Uncompahgre and Gunniso
- Page 100 and 101: Grand Mesa, Uncompahgre and Gunniso
- Page 102 and 103: Grand Mesa, Uncompahgre and Gunniso
- Page 104 and 105: Grand Mesa, Uncompahgre and Gunniso
- Page 106 and 107: Grand Mesa, Uncompahgre and Gunniso
- Page 108 and 109: Grand Mesa, Uncompahgre and Gunniso
- Page 110 and 111: Grand Mesa, Uncompahgre and Gunniso
- Page 112 and 113: Grand Mesa, Uncompahgre and Gunniso
- Page 114 and 115: Grand Mesa, Uncompahgre and Gunniso
- Page 116 and 117: Assessment of Watershed Vulnerabili
- Page 118 and 119: White River National Forest Watersh
- Page 120 and 121: White River National Forest Watersh
- Page 122 and 123: White River National Forest Watersh
- Page 124 and 125: White River National Forest Watersh
- Page 126 and 127: White River National Forest Watersh
- Page 128 and 129: White River National Forest Watersh
- Page 130 and 131: White River National Forest Watersh
- Page 132 and 133: White River National Forest Watersh
- Page 134 and 135: Assessment of Watershed Vulnerabili
- Page 136 and 137: Coconino National Forest Watershed
- Page 138 and 139: Coconino National Forest Watershed
- Page 140 and 141: Coconino National Forest Watershed
Grand Mesa, Uncompahgre and Gunnison National Forest Watershed Vulnerability Assessment, Rocky<br />
Mountain Region (R2)<br />
Geographic Area<br />
Tmin<br />
Rank*<br />
TMax<br />
Rank*<br />
Aridity<br />
Index Rank*<br />
89 Assessing the Vulnerability of Watersheds to Climate Change<br />
Exposure<br />
Rank**<br />
Exposure<br />
Rank<br />
(numeric)<br />
Uncompahgre 6 6 4 0.89 6<br />
Grand Mesa 5 5 5 0.83 5<br />
San Juans 4 4 6 0.78 4<br />
West Elk 3 3 1 0.39 3<br />
Upper Taylor 2 2 2 0.33 2<br />
Cochetopa 1 1 3 0.28 1<br />
Table 3. Geographic Area Exposure Ranking<br />
* Highest number has most change<br />
** (Tmin Rank + Tmax Rank + Aridity Index Rank) / 18<br />
Figure 20. Geographic Area Exposure Ranking<br />
Table 4 summarizes key potential climate changes described above and their potential effects to<br />
hydrologic process and identified aquatic resource values. This table was modified from Table 2<br />
found in Furniss et al (2010).


