watervulnerability
watervulnerability watervulnerability
Grand Mesa, Uncompahgre and Gunnison National Forest Watershed Vulnerability Assessment, Rocky Mountain Region (R2) °C Figure 16. Seasonal Increase in Maximum Average Temperature by Geographic Area °C 4 3.5 3 2.5 2 1.5 1 0.5 0 4 3.5 3 2.5 2 1.5 1 0.5 0 Seasonal Increase in Maximum Average Temperature by Geographic Area Spring Summer Fall Winter Seasonal Increase in Minimum Average Temperature by Geographic Area Spring Summer Fall Winter Figure 17. Seasonal Increase in Minimum Average Temperature by Geographic Area Temperatures are predicted to increase across all seasons and across all geographic areas. Increases in minimum daily temperatures will be very similar to increases in maximum daily temperature. Spring temperatures are expected to increase the most for the Uncompahgre Plateau, San Juans, Grand Mesa, and West Elk geographic areas. For the Uncompahgre Plateau, this spring increase may mean the difference from being below freezing to above freezing, which will change the precipitation from snow to rain, and which could affect snowpack melt and stream flow response. Summer temperatures are expected to increase the most for the more easterly geographic areas (Upper Taylor and Cochetopa). Fall temperatures are expected to increase the least for all geographic areas. However, for the Uncompahgre Plateau and the Grand Mesa, this increase could extend the frost-free period, resulting in longer growing seasons and later 86 Assessing the Vulnerability of Watersheds to Climate Change Uncompahgre San Juans Cochetopa Upper Taylor West Elk Grand Mesa Uncompahgre San Juans Cochetopa Upper Taylor West Elk Grand Mesa
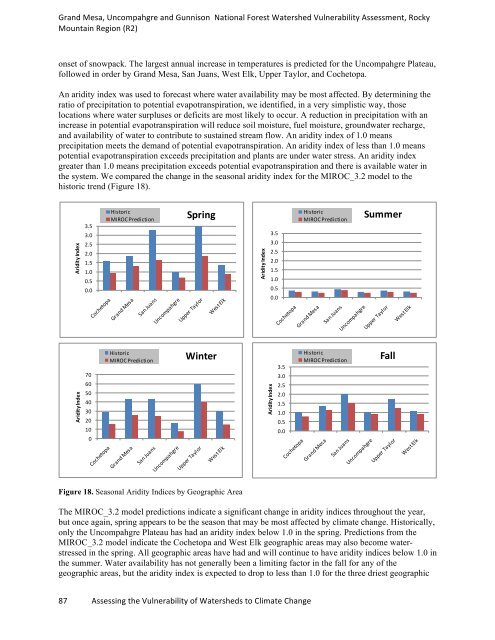
Grand Mesa, Uncompahgre and Gunnison National Forest Watershed Vulnerability Assessment, Rocky Mountain Region (R2) onset of snowpack. The largest annual increase in temperatures is predicted for the Uncompahgre Plateau, followed in order by Grand Mesa, San Juans, West Elk, Upper Taylor, and Cochetopa. An aridity index was used to forecast where water availability may be most affected. By determining the ratio of precipitation to potential evapotranspiration, we identified, in a very simplistic way, those locations where water surpluses or deficits are most likely to occur. A reduction in precipitation with an increase in potential evapotranspiration will reduce soil moisture, fuel moisture, groundwater recharge, and availability of water to contribute to sustained stream flow. An aridity index of 1.0 means precipitation meets the demand of potential evapotranspiration. An aridity index of less than 1.0 means potential evapotranspiration exceeds precipitation and plants are under water stress. An aridity index greater than 1.0 means precipitation exceeds potential evapotranspiration and there is available water in the system. We compared the change in the seasonal aridity index for the MIROC_3.2 model to the historic trend (Figure 18). Aridity Index Aridity Index 3.5 3.0 2.5 2.0 1.5 1.0 0.5 0.0 70 60 50 40 30 20 10 0 Historic MIROCPrediction Historic MIROCPrediction Spring Winter Figure 18. Seasonal Aridity Indices by Geographic Area The MIROC_3.2 model predictions indicate a significant change in aridity indices throughout the year, but once again, spring appears to be the season that may be most affected by climate change. Historically, only the Uncompahgre Plateau has had an aridity index below 1.0 in the spring. Predictions from the MIROC_3.2 model indicate the Cochetopa and West Elk geographic areas may also become waterstressed in the spring. All geographic areas have had and will continue to have aridity indices below 1.0 in the summer. Water availability has not generally been a limiting factor in the fall for any of the geographic areas, but the aridity index is expected to drop to less than 1.0 for the three driest geographic 87 Assessing the Vulnerability of Watersheds to Climate Change Aridity Index 3.5 3.0 2.5 2.0 1.5 1.0 0.5 0.0 Aridity Index 3.5 3.0 2.5 2.0 1.5 1.0 0.5 0.0 Historic MIROCPrediction Historic MIROCPrediction Summer Fall
- Page 40 and 41: Gallatin National Forest Watershed
- Page 42 and 43: Gallatin National Forest Watershed
- Page 44 and 45: Gallatin National Forest Watershed
- Page 46 and 47: Gallatin National Forest Watershed
- Page 48 and 49: Gallatin National Forest Watershed
- Page 50 and 51: Assessment of Watershed Vulnerabili
- Page 52 and 53: Helena National Forest Watershed Vu
- Page 54 and 55: Helena National Forest Watershed Vu
- Page 56 and 57: Helena National Forest Watershed Vu
- Page 58 and 59: Helena National Forest Watershed Vu
- Page 60 and 61: Helena National Forest Watershed Vu
- Page 62 and 63: Helena National Forest Watershed Vu
- Page 64 and 65: Helena National Forest Watershed Vu
- Page 66 and 67: Helena National Forest Watershed Vu
- Page 68 and 69: Assessment of Watershed Vulnerabili
- Page 70 and 71: Grand Mesa, Uncompahgre and Gunniso
- Page 72 and 73: Grand Mesa, Uncompahgre and Gunniso
- Page 74 and 75: Grand Mesa, Uncompahgre and Gunniso
- Page 76 and 77: Grand Mesa, Uncompahgre and Gunniso
- Page 78 and 79: Grand Mesa, Uncompahgre and Gunniso
- Page 80 and 81: Grand Mesa, Uncompahgre and Gunniso
- Page 82 and 83: Grand Mesa, Uncompahgre and Gunniso
- Page 84 and 85: Grand Mesa, Uncompahgre and Gunniso
- Page 86 and 87: Grand Mesa, Uncompahgre and Gunniso
- Page 88 and 89: Grand Mesa, Uncompahgre and Gunniso
- Page 92 and 93: Grand Mesa, Uncompahgre and Gunniso
- Page 94 and 95: Grand Mesa, Uncompahgre and Gunniso
- Page 96 and 97: Grand Mesa, Uncompahgre and Gunniso
- Page 98 and 99: Grand Mesa, Uncompahgre and Gunniso
- Page 100 and 101: Grand Mesa, Uncompahgre and Gunniso
- Page 102 and 103: Grand Mesa, Uncompahgre and Gunniso
- Page 104 and 105: Grand Mesa, Uncompahgre and Gunniso
- Page 106 and 107: Grand Mesa, Uncompahgre and Gunniso
- Page 108 and 109: Grand Mesa, Uncompahgre and Gunniso
- Page 110 and 111: Grand Mesa, Uncompahgre and Gunniso
- Page 112 and 113: Grand Mesa, Uncompahgre and Gunniso
- Page 114 and 115: Grand Mesa, Uncompahgre and Gunniso
- Page 116 and 117: Assessment of Watershed Vulnerabili
- Page 118 and 119: White River National Forest Watersh
- Page 120 and 121: White River National Forest Watersh
- Page 122 and 123: White River National Forest Watersh
- Page 124 and 125: White River National Forest Watersh
- Page 126 and 127: White River National Forest Watersh
- Page 128 and 129: White River National Forest Watersh
- Page 130 and 131: White River National Forest Watersh
- Page 132 and 133: White River National Forest Watersh
- Page 134 and 135: Assessment of Watershed Vulnerabili
- Page 136 and 137: Coconino National Forest Watershed
- Page 138 and 139: Coconino National Forest Watershed
Grand Mesa, Uncompahgre and Gunnison National Forest Watershed Vulnerability Assessment, Rocky<br />
Mountain Region (R2)<br />
onset of snowpack. The largest annual increase in temperatures is predicted for the Uncompahgre Plateau,<br />
followed in order by Grand Mesa, San Juans, West Elk, Upper Taylor, and Cochetopa.<br />
An aridity index was used to forecast where water availability may be most affected. By determining the<br />
ratio of precipitation to potential evapotranspiration, we identified, in a very simplistic way, those<br />
locations where water surpluses or deficits are most likely to occur. A reduction in precipitation with an<br />
increase in potential evapotranspiration will reduce soil moisture, fuel moisture, groundwater recharge,<br />
and availability of water to contribute to sustained stream flow. An aridity index of 1.0 means<br />
precipitation meets the demand of potential evapotranspiration. An aridity index of less than 1.0 means<br />
potential evapotranspiration exceeds precipitation and plants are under water stress. An aridity index<br />
greater than 1.0 means precipitation exceeds potential evapotranspiration and there is available water in<br />
the system. We compared the change in the seasonal aridity index for the MIROC_3.2 model to the<br />
historic trend (Figure 18).<br />
Aridity Index<br />
Aridity Index<br />
3.5<br />
3.0<br />
2.5<br />
2.0<br />
1.5<br />
1.0<br />
0.5<br />
0.0<br />
70<br />
60<br />
50<br />
40<br />
30<br />
20<br />
10<br />
0<br />
Historic<br />
MIROCPrediction<br />
Historic<br />
MIROCPrediction<br />
Spring<br />
Winter<br />
Figure 18. Seasonal Aridity Indices by Geographic Area<br />
The MIROC_3.2 model predictions indicate a significant change in aridity indices throughout the year,<br />
but once again, spring appears to be the season that may be most affected by climate change. Historically,<br />
only the Uncompahgre Plateau has had an aridity index below 1.0 in the spring. Predictions from the<br />
MIROC_3.2 model indicate the Cochetopa and West Elk geographic areas may also become waterstressed<br />
in the spring. All geographic areas have had and will continue to have aridity indices below 1.0 in<br />
the summer. Water availability has not generally been a limiting factor in the fall for any of the<br />
geographic areas, but the aridity index is expected to drop to less than 1.0 for the three driest geographic<br />
87 Assessing the Vulnerability of Watersheds to Climate Change<br />
Aridity Index<br />
3.5<br />
3.0<br />
2.5<br />
2.0<br />
1.5<br />
1.0<br />
0.5<br />
0.0<br />
Aridity Index<br />
3.5<br />
3.0<br />
2.5<br />
2.0<br />
1.5<br />
1.0<br />
0.5<br />
0.0<br />
Historic<br />
MIROCPrediction<br />
Historic<br />
MIROCPrediction<br />
Summer<br />
Fall


