watervulnerability
watervulnerability watervulnerability
Grand Mesa, Uncompahgre and Gunnison National Forest Watershed Vulnerability Assessment, Rocky Mountain Region (R2) Season Precipitation (%) Temperature (˚C) Temperature (˚F) Annual -10.0 +3.0 +5.4 Winter ~0.0 +3.0 +5.4 Spring -15.0 +3.0 +5.4 Summer -20.0 +4.0 +7.0 Fall -10.0 +3.0 +5.4 Table 2. Temperature and Precipitation Changes for “More Extreme” Climate Change Scenario developed by Barsugli and Mearns for the Gunnison Basin Predicted changes under the “more extreme” scenario include: 1. Increase in annual temperatures of 3 ˚C (5.4 ˚F). 2. A 10% decrease in annual precipitation, with greater decreases in warm season precipitation. 3. Decrease in precipitation and increase in temperature, both act to reduce annual stream flow totals in the range of 20% to 25%. 4. Warming temperatures lead to a later accumulation of snow in the fall and earlier snowmelt in the spring. Because this likely represents a hot/dry scenario for much of the west, the potential exists for more frequent dust deposition events, which also may lead to an earlier melt and to reduced water yield from the snowpack. 5. Snowmelt-driven stream flow will peak about two or more weeks earlier in the spring, though this effect may be less if dust effects on snowmelt are strong. The combined effects of dust and temperature on snowmelt timing tend to be dominated by the dust effects. 6. The much earlier melt, along with decreased summer precipitation and increased summer temperatures, will result in extremely low amounts of water stored in the soils during summer and fall. VIC Model Climate Change Predictions The primary predictive model used to display climate changes was the VIC hydrologic model. Data derived using the VIC model were available from the Climate Impacts Group (CIG) at the University of Washington. Historic trends were developed from the climate record from 1916 to 2006. Future prediction results for temperature- and precipitation-related parameters were generated using: 1) a composite of the 10 climate models that best resembled the historic trend, 2) the MIROC_3.2 model (more extreme temperature increases), and 3) the PCM1 model (less extreme temperatures increases) for two time periods (2030-2059 and 2070-2099) using the A1B emissions scenario. Data were available at the ~6 km-grid scale for monthly averages for 21 parameters for each model, but not all parameters were reviewed by the GMUG team. (Data downloaded from ftp://ftp.hydro.washington.edu/pub/climate/USFS_monthly_summaries/CO/ on 11/5/2010). In addition, some of the data were summarized at the HUC-5 scale. (Data downloaded from ftp://ftp2.fs.fed.us/incoming/gis/PNF/WVA/ on 10/22/2010). Outputs obtained from the VIC Model data are described below. 84 Assessing the Vulnerability of Watersheds to Climate Change
Grand Mesa, Uncompahgre and Gunnison National Forest Watershed Vulnerability Assessment, Rocky Mountain Region (R2) Initially, we reviewed the HUC-5 data for the composite, and MIROC_3.2 models, comparing projections of historic condition with two time periods (2030-2059 and 2070-2099) for the following parameters: • precipitation (monthly total, seasonal* total) • tmax (daily maximum temperature monthly average, seasonal* average) • tmin (daily minimum temperature monthly average, seasonal* average) • runoff (monthly total, seasonal* total) • baseflow (monthly total, seasonal* total) • hydrograph (runoff + baseflow as monthly total, seasonal* total) *Seasonal breakdown: winter = December, January, February; spring = March, April, May; summer = June, July, August; fall = September, October, November Charts for each HUC-5 were created to compare the composite and MIROC_3.2 model results to the historic trend for these parameters (this information is available as GMUG Appendix A at www.fs.fed.us/ccrc/wva/appendixes). (Note: We did not chart the PCM1model results that averaged between the composite and MIROC_3.2 results). For most HUC-5 watersheds, the data display future decreases in summer and fall precipitation and shifts in precipitation between winter and spring. Temperature increases of 2 to 3 ˚C are predicted for both maximum and minimum temperatures throughout the year. Runoff periods are predicted to shift one to two months earlier and total runoff is reduced. (Note: these predictions are in addition to the changes already seen since 1978, described earlier.) Because some HUC-5 watersheds include a wide range of elevations (ranges of 5,000 to 7,000 feet), we also reviewed the 6 km-grid scale VIC data. Predicted results for the composite and MIROC_3.2 models were compared to the historic trend for the same parameters listed above, as well as for evapotranspiration. We looked at the actual change between modeled and historic results, and the percent change on a monthly basis at the 6 km-grid scale. Maps showing monthly results at the grid scale display large differences between higher and lower elevation areas (see this information is available as GMUG Appendix B at www.fs.fed.us/ccrc/wva/appendixes). We used the six geographic areas (areas with similar climatic regimes and elevation ranges) to examine predicted climate changes (see Figure 4). Since most of the lower elevations within the HUC-5 scale watersheds are actually below the GMUG Forest boundary, reviewing exposure parameters at the geographic area scale is more representative for the GMUG. We chose to focus on a smaller subset of VIC parameters at the geographic area scale. We compared the predicted seasonal temperature changes (both maximum and minimum averages) from the MIROC_3.2 model to the historic model. Figure 16 displays the seasonal increase in maximum average temperature by geographic area. Figure 17 displays the seasonal increase in minimum average temperature by geographic area. 85 Assessing the Vulnerability of Watersheds to Climate Change
- Page 38 and 39: Gallatin National Forest Watershed
- Page 40 and 41: Gallatin National Forest Watershed
- Page 42 and 43: Gallatin National Forest Watershed
- Page 44 and 45: Gallatin National Forest Watershed
- Page 46 and 47: Gallatin National Forest Watershed
- Page 48 and 49: Gallatin National Forest Watershed
- Page 50 and 51: Assessment of Watershed Vulnerabili
- Page 52 and 53: Helena National Forest Watershed Vu
- Page 54 and 55: Helena National Forest Watershed Vu
- Page 56 and 57: Helena National Forest Watershed Vu
- Page 58 and 59: Helena National Forest Watershed Vu
- Page 60 and 61: Helena National Forest Watershed Vu
- Page 62 and 63: Helena National Forest Watershed Vu
- Page 64 and 65: Helena National Forest Watershed Vu
- Page 66 and 67: Helena National Forest Watershed Vu
- Page 68 and 69: Assessment of Watershed Vulnerabili
- Page 70 and 71: Grand Mesa, Uncompahgre and Gunniso
- Page 72 and 73: Grand Mesa, Uncompahgre and Gunniso
- Page 74 and 75: Grand Mesa, Uncompahgre and Gunniso
- Page 76 and 77: Grand Mesa, Uncompahgre and Gunniso
- Page 78 and 79: Grand Mesa, Uncompahgre and Gunniso
- Page 80 and 81: Grand Mesa, Uncompahgre and Gunniso
- Page 82 and 83: Grand Mesa, Uncompahgre and Gunniso
- Page 84 and 85: Grand Mesa, Uncompahgre and Gunniso
- Page 86 and 87: Grand Mesa, Uncompahgre and Gunniso
- Page 90 and 91: Grand Mesa, Uncompahgre and Gunniso
- Page 92 and 93: Grand Mesa, Uncompahgre and Gunniso
- Page 94 and 95: Grand Mesa, Uncompahgre and Gunniso
- Page 96 and 97: Grand Mesa, Uncompahgre and Gunniso
- Page 98 and 99: Grand Mesa, Uncompahgre and Gunniso
- Page 100 and 101: Grand Mesa, Uncompahgre and Gunniso
- Page 102 and 103: Grand Mesa, Uncompahgre and Gunniso
- Page 104 and 105: Grand Mesa, Uncompahgre and Gunniso
- Page 106 and 107: Grand Mesa, Uncompahgre and Gunniso
- Page 108 and 109: Grand Mesa, Uncompahgre and Gunniso
- Page 110 and 111: Grand Mesa, Uncompahgre and Gunniso
- Page 112 and 113: Grand Mesa, Uncompahgre and Gunniso
- Page 114 and 115: Grand Mesa, Uncompahgre and Gunniso
- Page 116 and 117: Assessment of Watershed Vulnerabili
- Page 118 and 119: White River National Forest Watersh
- Page 120 and 121: White River National Forest Watersh
- Page 122 and 123: White River National Forest Watersh
- Page 124 and 125: White River National Forest Watersh
- Page 126 and 127: White River National Forest Watersh
- Page 128 and 129: White River National Forest Watersh
- Page 130 and 131: White River National Forest Watersh
- Page 132 and 133: White River National Forest Watersh
- Page 134 and 135: Assessment of Watershed Vulnerabili
- Page 136 and 137: Coconino National Forest Watershed
Grand Mesa, Uncompahgre and Gunnison National Forest Watershed Vulnerability Assessment, Rocky<br />
Mountain Region (R2)<br />
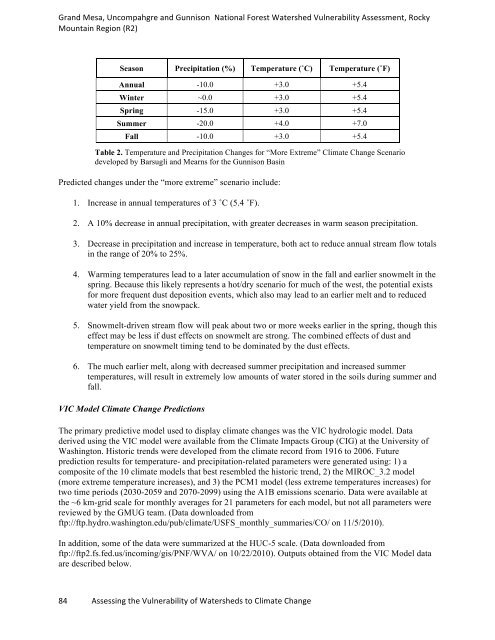
Season Precipitation (%) Temperature (˚C) Temperature (˚F)<br />
Annual -10.0 +3.0 +5.4<br />
Winter ~0.0 +3.0 +5.4<br />
Spring -15.0 +3.0 +5.4<br />
Summer -20.0 +4.0 +7.0<br />
Fall -10.0 +3.0 +5.4<br />
Table 2. Temperature and Precipitation Changes for “More Extreme” Climate Change Scenario<br />
developed by Barsugli and Mearns for the Gunnison Basin<br />
Predicted changes under the “more extreme” scenario include:<br />
1. Increase in annual temperatures of 3 ˚C (5.4 ˚F).<br />
2. A 10% decrease in annual precipitation, with greater decreases in warm season precipitation.<br />
3. Decrease in precipitation and increase in temperature, both act to reduce annual stream flow totals<br />
in the range of 20% to 25%.<br />
4. Warming temperatures lead to a later accumulation of snow in the fall and earlier snowmelt in the<br />
spring. Because this likely represents a hot/dry scenario for much of the west, the potential exists<br />
for more frequent dust deposition events, which also may lead to an earlier melt and to reduced<br />
water yield from the snowpack.<br />
5. Snowmelt-driven stream flow will peak about two or more weeks earlier in the spring, though this<br />
effect may be less if dust effects on snowmelt are strong. The combined effects of dust and<br />
temperature on snowmelt timing tend to be dominated by the dust effects.<br />
6. The much earlier melt, along with decreased summer precipitation and increased summer<br />
temperatures, will result in extremely low amounts of water stored in the soils during summer and<br />
fall.<br />
VIC Model Climate Change Predictions<br />
The primary predictive model used to display climate changes was the VIC hydrologic model. Data<br />
derived using the VIC model were available from the Climate Impacts Group (CIG) at the University of<br />
Washington. Historic trends were developed from the climate record from 1916 to 2006. Future<br />
prediction results for temperature- and precipitation-related parameters were generated using: 1) a<br />
composite of the 10 climate models that best resembled the historic trend, 2) the MIROC_3.2 model<br />
(more extreme temperature increases), and 3) the PCM1 model (less extreme temperatures increases) for<br />
two time periods (2030-2059 and 2070-2099) using the A1B emissions scenario. Data were available at<br />
the ~6 km-grid scale for monthly averages for 21 parameters for each model, but not all parameters were<br />
reviewed by the GMUG team. (Data downloaded from<br />
ftp://ftp.hydro.washington.edu/pub/climate/USFS_monthly_summaries/CO/ on 11/5/2010).<br />
In addition, some of the data were summarized at the HUC-5 scale. (Data downloaded from<br />
ftp://ftp2.fs.fed.us/incoming/gis/PNF/WVA/ on 10/22/2010). Outputs obtained from the VIC Model data<br />
are described below.<br />
84 Assessing the Vulnerability of Watersheds to Climate Change


