watervulnerability
watervulnerability watervulnerability
Helena National Forest Watershed Vulnerability Assessment, Northern Region (R1) Projected Climatic Changes Anticipated Watershed Response Warmer air temperatures • Warmer water temperature in streams Changes in precipitation amounts and timing Less snowfall, earlier snowmelt, increased snowpack density Intensified storms, greater extremes of precipitation and wind • Altered timing and volume of runoff • Altered erosion rates • Higher winter flows • Lower summer flows • Earlier and smaller peak flows in spring • Greater likelihood of flooding • Increased erosion rates and sediment yields 50 Assessing the Vulnerability of Watersheds to Climate Change Potential Consequences to Watershed Services • Decrease in coldwater aquatic habitats • Increases or decreases in availability of water supplies • Complex changes in water quality related to flow and sediment changes • Changes in the amounts, quality and distribution of aquatic and riparian habitats and biota • Changes in aquatic and riparian habitats • Increased damage to roads, campgrounds, and other facilities Table 1. Projected hydrologic changes relative to the HNF identified values. Adapted from Water, Climate Change, and Forests GTR (Rieman and Isaak, 2010) The models used to predict climate changes were developed by the Climate Impacts Group (CIG) at the University of Washington. The Climate Impacts Group selected the A1B climate scenario to provide projections most relevant for vulnerability assessment and scenario planning exercises. They then modeled change (from time period 1916-2006 representing historic) and for two future time periods representing the mid-21 st century (2030-2049) and late 21 st century (2070-2099), using the emissions scenario A1B with the composite climate model. The composite model is an ensemble of climate models that falls between those models that predict cooler and warmer climate scenarios. It includes 10 Global Circulation Models that perform similarly well in the PNW / Columbia Basin, the Northern Rockies / Upper Missouri Basin, and the Central Rockies / Upper Colorado Basin and this is what the Helena National Forest chose to use to represent climate change in this analysis. Data was summarized at the HUC-5 scale for the entire Forest (downloaded from ftp://ftp2.fs.fed.us/incoming/gis/PNF/WVA/ on 12/10/2010). Predicted changes in selected hydrologic attributes were derived from the Variable Infiltration Capacity (VIC) model. Parameters from VIC modeling were used to assess potential impacts to the selected forest water resource values. We compared the HUC-5 scale CIG’s VIC outputs for the historic trend and composite models for the following parameters (by resource value): 1. Bull trout – Average summer maximum air temperature 2. Cutthroat trout – Average summer maximum air temperature 3. Infrastructure – Snowpack vulnerability (defined as the ratio of April1 snow water equivalent and October-March precipitation)
Helena National Forest Watershed Vulnerability Assessment, Northern Region (R1) Predicted Average Summer Maximum Temperature Projection Period Historic Composite Mean Range Mean Range 1916-‐2006 23.7 21.1-‐26.0 2030-‐2059 26.0 (+10%) 23.4-‐28.2 2070-‐2099 28.2 (+19%) 25.6-‐30.5 Predicted Average April 1 SWE Projection Period Historic Composite Mean Range Mean Range 1916-‐2006 41.3 0.2-‐342.7 2030-‐2059 29.6 (-‐28%) 0-‐289.2 2070-‐2099 18.6 (-‐55%) 0-‐216.9 Predicted Average June Runoff Projection Period Historic Composite Mean Range Mean Range 1916-‐2006 10.1 2.9-‐87.6 2030-‐2059 7.4 (-‐27%) 2.5-‐59.4 2070-‐2099 5.6 (-‐45%) 2.3-‐33.0 Summer Baserflow (September Runoff) Projection Period Historic Composite Mean Range Mean Range 1916-‐2006 2.3 1.1-‐5.2 2030-‐2059 2.5 (9%) 1.1-‐7.0 2070-‐2099 1.2 (-‐48%) 0.2-‐3.2 Table 2. Historic (1916-2006) and future (2030-2059 and 2070-2099) hydrologic output climate predictions averaged over all watersheds on the Helena National Forest. Based on Global models downscaled to 1/16th degree (~6 km) grid. VULNERABILITY ANALYSIS BY RESOURCE VALUE For this watershed vulnerability assessment, pilot forests were tasked with identifying the relative vulnerability of watersheds to potential risks posed by climate change by focusing on the potential effects of those changes to water resource values. Based on our current evaluation of water resource values on the Helena National Forest, values evaluated include fisheries habitat for bull trout and cutthroat trout, and infrastructure. Vulnerability analysis was conducted specific to each individual water resource value. Water Resource Value: Bull Trout Habitat Sensitivity Bull trout habitat condition was characterized using the regional bull trout watershed baseline analysis completed in 2007. This analysis was a consultation requirement for species listed under the Endangered Species Act since the late 1990’s. Baseline information was summarized according to important environmental parameters for each subwatershed within the Helena National Forest. This summary was 51 Assessing the Vulnerability of Watersheds to Climate Change
- Page 4 and 5: ASSESSSING THE VULNERABILITY OF WAT
- Page 6 and 7: staff; the task group included repr
- Page 8 and 9: Figure 2. Conceptual model for asse
- Page 10 and 11: Figure 3. Density of springs and sm
- Page 12 and 13: Using Historic Data One finding con
- Page 14 and 15: NF (Region 8) relied on information
- Page 16 and 17: level of uncertainty. Though there
- Page 18 and 19: climate (Casola et al. 2005). Only
- Page 20 and 21: sensitivity. Most were derived from
- Page 22 and 23: The sensitivity evaluation typicall
- Page 24 and 25: in exposure. The result of combinin
- Page 26 and 27: highest priority for management act
- Page 28 and 29: to information affected the assessm
- Page 30 and 31: with and rely on in many resource d
- Page 32 and 33: Pilot National Forest Reports Conte
- Page 34 and 35: Assessment of Watershed Vulnerabili
- Page 36 and 37: Gallatin National Forest Watershed
- Page 38 and 39: Gallatin National Forest Watershed
- Page 40 and 41: Gallatin National Forest Watershed
- Page 42 and 43: Gallatin National Forest Watershed
- Page 44 and 45: Gallatin National Forest Watershed
- Page 46 and 47: Gallatin National Forest Watershed
- Page 48 and 49: Gallatin National Forest Watershed
- Page 50 and 51: Assessment of Watershed Vulnerabili
- Page 52 and 53: Helena National Forest Watershed Vu
- Page 56 and 57: Helena National Forest Watershed Vu
- Page 58 and 59: Helena National Forest Watershed Vu
- Page 60 and 61: Helena National Forest Watershed Vu
- Page 62 and 63: Helena National Forest Watershed Vu
- Page 64 and 65: Helena National Forest Watershed Vu
- Page 66 and 67: Helena National Forest Watershed Vu
- Page 68 and 69: Assessment of Watershed Vulnerabili
- Page 70 and 71: Grand Mesa, Uncompahgre and Gunniso
- Page 72 and 73: Grand Mesa, Uncompahgre and Gunniso
- Page 74 and 75: Grand Mesa, Uncompahgre and Gunniso
- Page 76 and 77: Grand Mesa, Uncompahgre and Gunniso
- Page 78 and 79: Grand Mesa, Uncompahgre and Gunniso
- Page 80 and 81: Grand Mesa, Uncompahgre and Gunniso
- Page 82 and 83: Grand Mesa, Uncompahgre and Gunniso
- Page 84 and 85: Grand Mesa, Uncompahgre and Gunniso
- Page 86 and 87: Grand Mesa, Uncompahgre and Gunniso
- Page 88 and 89: Grand Mesa, Uncompahgre and Gunniso
- Page 90 and 91: Grand Mesa, Uncompahgre and Gunniso
- Page 92 and 93: Grand Mesa, Uncompahgre and Gunniso
- Page 94 and 95: Grand Mesa, Uncompahgre and Gunniso
- Page 96 and 97: Grand Mesa, Uncompahgre and Gunniso
- Page 98 and 99: Grand Mesa, Uncompahgre and Gunniso
- Page 100 and 101: Grand Mesa, Uncompahgre and Gunniso
- Page 102 and 103: Grand Mesa, Uncompahgre and Gunniso
Helena National Forest Watershed Vulnerability Assessment, Northern Region (R1)<br />
Predicted Average Summer Maximum Temperature<br />
Projection Period Historic Composite<br />
Mean Range Mean Range<br />
1916-‐2006 23.7 21.1-‐26.0<br />
2030-‐2059 26.0 (+10%) 23.4-‐28.2<br />
2070-‐2099 28.2 (+19%) 25.6-‐30.5<br />
Predicted Average April 1 SWE<br />
Projection Period Historic Composite<br />
Mean Range Mean Range<br />
1916-‐2006 41.3 0.2-‐342.7<br />
2030-‐2059 29.6 (-‐28%) 0-‐289.2<br />
2070-‐2099 18.6 (-‐55%) 0-‐216.9<br />
Predicted Average June Runoff<br />
Projection Period Historic Composite<br />
Mean Range Mean Range<br />
1916-‐2006 10.1 2.9-‐87.6<br />
2030-‐2059 7.4 (-‐27%) 2.5-‐59.4<br />
2070-‐2099 5.6 (-‐45%) 2.3-‐33.0<br />
Summer Baserflow (September Runoff)<br />
Projection Period Historic Composite<br />
Mean Range Mean Range<br />
1916-‐2006 2.3 1.1-‐5.2<br />
2030-‐2059 2.5 (9%) 1.1-‐7.0<br />
2070-‐2099 1.2 (-‐48%) 0.2-‐3.2<br />
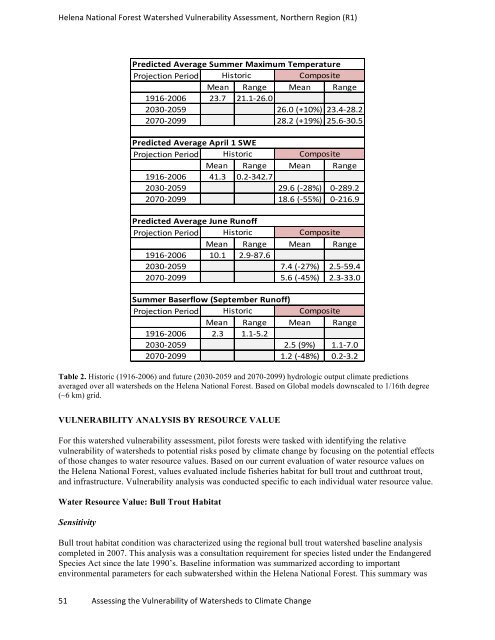
Table 2. Historic (1916-2006) and future (2030-2059 and 2070-2099) hydrologic output climate predictions<br />
averaged over all watersheds on the Helena National Forest. Based on Global models downscaled to 1/16th degree<br />
(~6 km) grid.<br />
VULNERABILITY ANALYSIS BY RESOURCE VALUE<br />
For this watershed vulnerability assessment, pilot forests were tasked with identifying the relative<br />
vulnerability of watersheds to potential risks posed by climate change by focusing on the potential effects<br />
of those changes to water resource values. Based on our current evaluation of water resource values on<br />
the Helena National Forest, values evaluated include fisheries habitat for bull trout and cutthroat trout,<br />
and infrastructure. Vulnerability analysis was conducted specific to each individual water resource value.<br />
Water Resource Value: Bull Trout Habitat<br />
Sensitivity<br />
Bull trout habitat condition was characterized using the regional bull trout watershed baseline analysis<br />
completed in 2007. This analysis was a consultation requirement for species listed under the Endangered<br />
Species Act since the late 1990’s. Baseline information was summarized according to important<br />
environmental parameters for each subwatershed within the Helena National Forest. This summary was<br />
51 Assessing the Vulnerability of Watersheds to Climate Change


