

watervulnerability
watervulnerability
watervulnerability

You also want an ePaper? Increase the reach of your titles
YUMPU automatically turns print PDFs into web optimized ePapers that Google loves.
Chugach National Forest Watershed Vulnerability Assessment, Alaska Region (R10)<br />
Eyak Lake Resurrection Creek<br />
Air Temperature °C<br />
Annual Mean Annual Mean<br />
A1B Scenario B1 Scenario A1B Scenario B1 Scenario<br />
2000-2009 4.3 3.5 1.4 0.5<br />
2020-2029 5.1 4.4 2.1 2.1<br />
2050-2059 6.1 5.3 3.1 2.4<br />
Cordova January Hope January<br />
2001-2010 -1.4 -3.3 -6.1 -8.2<br />
2031-2040 -0.2 0.7 -5.2 -4.2<br />
2061-2070 2.3 0.2 -2.3 -4.7<br />
Cordova July Hope July<br />
2001-2010 14.1 13.1 15.1 14.1<br />
2031-2040 14.3 14.4 15.2 15.4<br />
2061-2070 15.6 14.9 16.7 15.9<br />
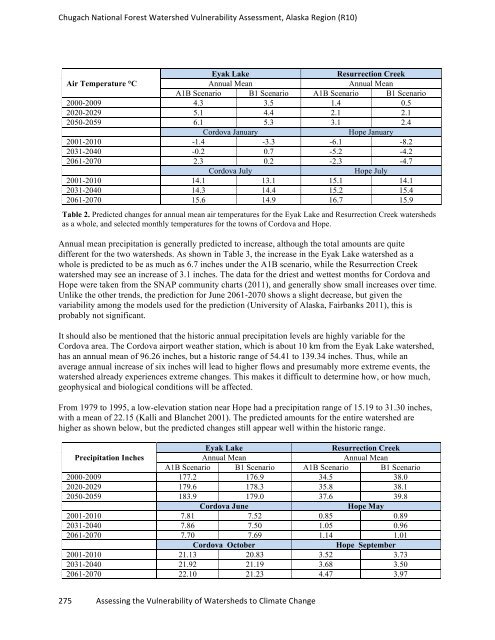
Table 2. Predicted changes for annual mean air temperatures for the Eyak Lake and Resurrection Creek watersheds<br />
as a whole, and selected monthly temperatures for the towns of Cordova and Hope.<br />
Annual mean precipitation is generally predicted to increase, although the total amounts are quite<br />
different for the two watersheds. As shown in Table 3, the increase in the Eyak Lake watershed as a<br />
whole is predicted to be as much as 6.7 inches under the A1B scenario, while the Resurrection Creek<br />
watershed may see an increase of 3.1 inches. The data for the driest and wettest months for Cordova and<br />
Hope were taken from the SNAP community charts (2011), and generally show small increases over time.<br />
Unlike the other trends, the prediction for June 2061-2070 shows a slight decrease, but given the<br />
variability among the models used for the prediction (University of Alaska, Fairbanks 2011), this is<br />
probably not significant.<br />
It should also be mentioned that the historic annual precipitation levels are highly variable for the<br />
Cordova area. The Cordova airport weather station, which is about 10 km from the Eyak Lake watershed,<br />
has an annual mean of 96.26 inches, but a historic range of 54.41 to 139.34 inches. Thus, while an<br />
average annual increase of six inches will lead to higher flows and presumably more extreme events, the<br />
watershed already experiences extreme changes. This makes it difficult to determine how, or how much,<br />
geophysical and biological conditions will be affected.<br />
From 1979 to 1995, a low-elevation station near Hope had a precipitation range of 15.19 to 31.30 inches,<br />
with a mean of 22.15 (Kalli and Blanchet 2001). The predicted amounts for the entire watershed are<br />
higher as shown below, but the predicted changes still appear well within the historic range.<br />
Eyak Lake Resurrection Creek<br />
Precipitation Inches<br />
Annual Mean Annual Mean<br />
A1B Scenario B1 Scenario A1B Scenario B1 Scenario<br />
2000-2009 177.2 176.9 34.5 38.0<br />
2020-2029 179.6 178.3 35.8 38.1<br />
2050-2059 183.9 179.0 37.6 39.8<br />
Cordova June Hope May<br />
2001-2010 7.81 7.52 0.85 0.89<br />
2031-2040 7.86 7.50 1.05 0.96<br />
2061-2070 7.70 7.69 1.14 1.01<br />
Cordova October Hope September<br />
2001-2010 21.13 20.83 3.52 3.73<br />
2031-2040 21.92 21.19 3.68 3.50<br />
2061-2070 22.10 21.23 4.47 3.97<br />
275 Assessing the Vulnerability of Watersheds to Climate Change