watervulnerability
watervulnerability watervulnerability
Chequamegon-‐Nicolet National Forest Watershed Vulnerability Assessment, Eastern Region (R9) Figure 15. Modeled 100 and 500 year flood water surface elevations for an 87”x63” pipe-‐arch culvert at Riley Creek and Forest Road 2161 with a minimum bankfull width of 7.0 feet Road and trail stream crossings inventoried on the CNNF were used to estimate crossing density for each HUC-6. Densities for each HUC-6 ranged from 0.0 to 1.83 crossings per square mile. Watersheds were rated for their vulnerability to infrastructure impacts based on the following crossing densities (mi/sq mi): very low, 0.0-0.15; low, 0.16-0.39; moderate, 0.40-0.83; and high, 0.84-1.83. Watersheds were rated for their vulnerability to increased floods based on the following HSG indices: very low, 1.049-1.816; low, 1.862-2.422; moderate, 2.446-2.837; and high, 2.838-5.894. Combining the HSG and crossing density indices while giving the HSG index double weight resulted in 26 HUC-6s rated very low, 50 low, 46 moderate, and 37 high (Figure 16). The most vulnerable HUC-6s have high runoff potential and high crossing density while the least vulnerable have the opposite characteristics. However, it is possible to adapt to potential increases in flood flows in all watersheds by sizing stream crossing structures to bankfull width or greater and conducting hydrologic and hydraulic analyses to ensure the 100-yr flood elevation is below the top of the culvert to provide freeboard for future increases in flood flows. Such sizing will also help to restore or maintain aquatic organism passage and channel morphology, reduce maintenance, and extend structure life. 254 Assessing the Vulnerability of Watersheds to Climate Change
Chequamegon-‐Nicolet National Forest Watershed Vulnerability Assessment, Eastern Region (R9) Figure 16. HUC-6 watershed vulnerability to infrastructure (stream crossing) impacts from climate change on the Chequamegon-Nicolet National Forest Stream Fishes Both cold water species, brook trout and mottled sculpin, are very vulnerable to all levels of warming but especially to moderate and major warming. The projected existing and future brook trout distributions are provided in Figure 17. Brook trout and mottled sculpin were predicted to decline by 81 and 76 percent, respectively, under moderate warming, and 100 and 90 percent under moderate warming (Table 5). These two species are fairly common in small- to medium-sized streams across the CNNF and brook trout are a popular sport fish. Such declines could have a dramatic effect on recreational fishing opportunities and cold water stream ecology. As a group, cool water species appear to be very vulnerable to moderate and major warming. They were predicted to decline by 15 to 98 percent under moderate warming and only two of these species, brook stickleback and northern hogsucker, were predicted to decline by less than 47 percent (Table 5). These eight species are very common and occur in a wide range of stream habitats across the Forest. Such declines could have a dramatic effect on the abundance and distribution of stream fishes and on stream ecology. 255 Assessing the Vulnerability of Watersheds to Climate Change
- Page 208 and 209: Shasta Trinity National Forest Wate
- Page 210 and 211: Shasta Trinity National Forest Wate
- Page 212 and 213: Shasta Trinity National Forest Wate
- Page 214 and 215: Assessment of Watershed Vulnerabili
- Page 216 and 217: Umatilla National Forest Watershed
- Page 218 and 219: Umatilla National Forest Watershed
- Page 220 and 221: Umatilla National Forest Watershed
- Page 222 and 223: Umatilla National Forest Watershed
- Page 224 and 225: Umatilla National Forest Watershed
- Page 226 and 227: Umatilla National Forest Watershed
- Page 228 and 229: Umatilla National Forest Watershed
- Page 230 and 231: Assessment of Watershed Vulnerabili
- Page 232 and 233: Ouachita National Forest Watershed
- Page 234 and 235: Ouachita National Forest Watershed
- Page 236 and 237: Ouachita National Forest Watershed
- Page 238 and 239: Ouachita National Forest Watershed
- Page 240 and 241: Assessment of Watershed Vulnerabili
- Page 242 and 243: Chequamegon-‐Nicolet National F
- Page 244 and 245: Chequamegon-‐Nicolet National F
- Page 246 and 247: Chequamegon-‐Nicolet National F
- Page 248 and 249: Chequamegon-‐Nicolet National F
- Page 250 and 251: Chequamegon-‐Nicolet National F
- Page 252 and 253: Chequamegon-‐Nicolet National F
- Page 254 and 255: Chequamegon-‐Nicolet National F
- Page 256 and 257: Chequamegon-‐Nicolet National F
- Page 260 and 261: Chequamegon-‐Nicolet National F
- Page 262 and 263: Chequamegon-‐Nicolet National F
- Page 264 and 265: Chequamegon-‐Nicolet National F
- Page 266 and 267: Chequamegon-‐Nicolet National F
- Page 268 and 269: Chequamegon-‐Nicolet National F
- Page 270 and 271: Assessment of Watershed Vulnerabili
- Page 272 and 273: Chugach National Forest Watershed V
- Page 274 and 275: Chugach National Forest Watershed V
- Page 276 and 277: Chugach National Forest Watershed V
- Page 278 and 279: Chugach National Forest Watershed V
- Page 280 and 281: Chugach National Forest Watershed V
- Page 282 and 283: Chugach National Forest Watershed V
- Page 284 and 285: Chugach National Forest Watershed V
- Page 286 and 287: Chugach National Forest Watershed V
- Page 288 and 289: Chugach National Forest Watershed V
- Page 290 and 291: Chugach National Forest Watershed V
- Page 292 and 293: Chugach National Forest Watershed V
- Page 294 and 295: Chugach National Forest Watershed V
- Page 296 and 297: Chugach National Forest Watershed V
- Page 298 and 299: Chugach National Forest Watershed V
- Page 300 and 301: Chugach National Forest Watershed V
- Page 302 and 303: Chugach National Forest Watershed V
- Page 304 and 305: Chugach National Forest Watershed V
- Page 306 and 307: Chugach National Forest Watershed V
Chequamegon-‐Nicolet National Forest Watershed Vulnerability Assessment, Eastern Region (R9)<br />
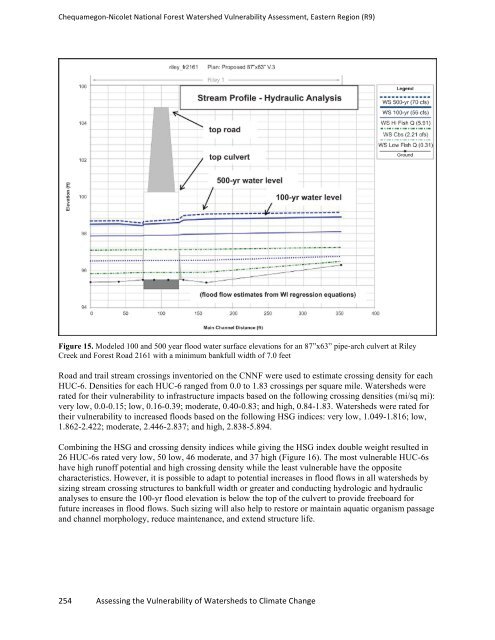
Figure 15. Modeled 100 and 500 year flood water surface elevations for an 87”x63” pipe-‐arch culvert at Riley<br />
Creek and Forest Road 2161 with a minimum bankfull width of 7.0 feet<br />
Road and trail stream crossings inventoried on the CNNF were used to estimate crossing density for each<br />
HUC-6. Densities for each HUC-6 ranged from 0.0 to 1.83 crossings per square mile. Watersheds were<br />
rated for their vulnerability to infrastructure impacts based on the following crossing densities (mi/sq mi):<br />
very low, 0.0-0.15; low, 0.16-0.39; moderate, 0.40-0.83; and high, 0.84-1.83. Watersheds were rated for<br />
their vulnerability to increased floods based on the following HSG indices: very low, 1.049-1.816; low,<br />
1.862-2.422; moderate, 2.446-2.837; and high, 2.838-5.894.<br />
Combining the HSG and crossing density indices while giving the HSG index double weight resulted in<br />
26 HUC-6s rated very low, 50 low, 46 moderate, and 37 high (Figure 16). The most vulnerable HUC-6s<br />
have high runoff potential and high crossing density while the least vulnerable have the opposite<br />
characteristics. However, it is possible to adapt to potential increases in flood flows in all watersheds by<br />
sizing stream crossing structures to bankfull width or greater and conducting hydrologic and hydraulic<br />
analyses to ensure the 100-yr flood elevation is below the top of the culvert to provide freeboard for<br />
future increases in flood flows. Such sizing will also help to restore or maintain aquatic organism passage<br />
and channel morphology, reduce maintenance, and extend structure life.<br />
254 Assessing the Vulnerability of Watersheds to Climate Change


