watervulnerability
watervulnerability watervulnerability
Chequamegon-‐Nicolet National Forest Watershed Vulnerability Assessment, Eastern Region (R9) Figure 12. Difference in potential groundwater recharge average 2046-2065 minus 1971-1990, Park Falls Unit, Chequamegon-Nicolet NF 250 Assessing the Vulnerability of Watersheds to Climate Change
Chequamegon-‐Nicolet National Forest Watershed Vulnerability Assessment, Eastern Region (R9) GW Recharge Difference (inches/yr) 1.5 1.25 1 0.75 0.5 0.25 0 -‐0.25 A B C D Water Hydrologic Soil Group Figure 13. Average annual difference in potential groundwater recharge by hydrologic soil group These estimates need to be viewed cautiously; but in spite of these shortcomings, the regressions are strong, they are consistent with the modeled results by HSG, and the climatic differences across the Forest are not large. Therefore, they should provide reasonable estimates for the entire Forest until more comprehensive modeling can be conducted. The number, location, and relative vulnerability of the four HUC-6 classes are presented in Figure 14. The groundwater recharge watersheds have few or no streams, very high permeability, and are entirely groundwater recharge zones that were considered to be resilient or to have very low vulnerability to impacts from the projected climate change. There were 12 watersheds in this class; nine were split HUC- 6s and three were complete HUC-6s. All were located on the Bayfield Peninsula. The estimated average annual future and historic potential groundwater recharge for these watersheds were 13.4 and 12.4 inches, respectively, resulting in an average increase of 1.0 inch (Table 4). These watersheds may provide the best opportunities on the Forest to implement adaptive management practices to respond to climate change for resources other than water. HUC-6 # of Est. Avg. Annual Potential Watershed HUC-6 Groundwater Recharge (inches) Class Watersheds 2046-2065 1971-1990 Difference Groundwater Recharge 12 13.4 12.4 1.0 Groundwater Runoff 50 10.1 9.4 0.7 Mixed Runoff 59 8.6 8.1 0.6 Surface Runoff 37 7.0 6.6 0.4 Table 4. Estimated Average Potential Groundwater Recharge for the historic (1971-1990) and future (2046-2065) time periods for HUC-6 watersheds on the Chequamegon-Nicolet NF 251 Assessing the Vulnerability of Watersheds to Climate Change
- Page 204 and 205: Shasta Trinity National Forest Wate
- Page 206 and 207: Shasta Trinity National Forest Wate
- Page 208 and 209: Shasta Trinity National Forest Wate
- Page 210 and 211: Shasta Trinity National Forest Wate
- Page 212 and 213: Shasta Trinity National Forest Wate
- Page 214 and 215: Assessment of Watershed Vulnerabili
- Page 216 and 217: Umatilla National Forest Watershed
- Page 218 and 219: Umatilla National Forest Watershed
- Page 220 and 221: Umatilla National Forest Watershed
- Page 222 and 223: Umatilla National Forest Watershed
- Page 224 and 225: Umatilla National Forest Watershed
- Page 226 and 227: Umatilla National Forest Watershed
- Page 228 and 229: Umatilla National Forest Watershed
- Page 230 and 231: Assessment of Watershed Vulnerabili
- Page 232 and 233: Ouachita National Forest Watershed
- Page 234 and 235: Ouachita National Forest Watershed
- Page 236 and 237: Ouachita National Forest Watershed
- Page 238 and 239: Ouachita National Forest Watershed
- Page 240 and 241: Assessment of Watershed Vulnerabili
- Page 242 and 243: Chequamegon-‐Nicolet National F
- Page 244 and 245: Chequamegon-‐Nicolet National F
- Page 246 and 247: Chequamegon-‐Nicolet National F
- Page 248 and 249: Chequamegon-‐Nicolet National F
- Page 250 and 251: Chequamegon-‐Nicolet National F
- Page 252 and 253: Chequamegon-‐Nicolet National F
- Page 256 and 257: Chequamegon-‐Nicolet National F
- Page 258 and 259: Chequamegon-‐Nicolet National F
- Page 260 and 261: Chequamegon-‐Nicolet National F
- Page 262 and 263: Chequamegon-‐Nicolet National F
- Page 264 and 265: Chequamegon-‐Nicolet National F
- Page 266 and 267: Chequamegon-‐Nicolet National F
- Page 268 and 269: Chequamegon-‐Nicolet National F
- Page 270 and 271: Assessment of Watershed Vulnerabili
- Page 272 and 273: Chugach National Forest Watershed V
- Page 274 and 275: Chugach National Forest Watershed V
- Page 276 and 277: Chugach National Forest Watershed V
- Page 278 and 279: Chugach National Forest Watershed V
- Page 280 and 281: Chugach National Forest Watershed V
- Page 282 and 283: Chugach National Forest Watershed V
- Page 284 and 285: Chugach National Forest Watershed V
- Page 286 and 287: Chugach National Forest Watershed V
- Page 288 and 289: Chugach National Forest Watershed V
- Page 290 and 291: Chugach National Forest Watershed V
- Page 292 and 293: Chugach National Forest Watershed V
- Page 294 and 295: Chugach National Forest Watershed V
- Page 296 and 297: Chugach National Forest Watershed V
- Page 298 and 299: Chugach National Forest Watershed V
- Page 300 and 301: Chugach National Forest Watershed V
- Page 302 and 303: Chugach National Forest Watershed V
Chequamegon-‐Nicolet National Forest Watershed Vulnerability Assessment, Eastern Region (R9)<br />
GW Recharge Difference (inches/yr)<br />
1.5<br />
1.25<br />
1<br />
0.75<br />
0.5<br />
0.25<br />
0<br />
-‐0.25<br />
A B C D Water<br />
Hydrologic Soil Group<br />
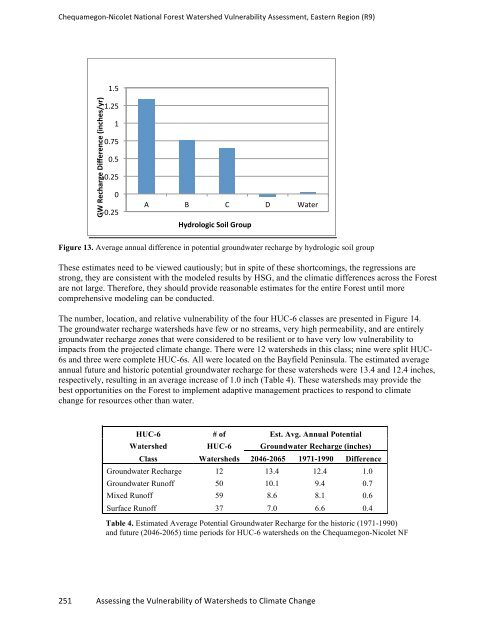
Figure 13. Average annual difference in potential groundwater recharge by hydrologic soil group<br />
These estimates need to be viewed cautiously; but in spite of these shortcomings, the regressions are<br />
strong, they are consistent with the modeled results by HSG, and the climatic differences across the Forest<br />
are not large. Therefore, they should provide reasonable estimates for the entire Forest until more<br />
comprehensive modeling can be conducted.<br />
The number, location, and relative vulnerability of the four HUC-6 classes are presented in Figure 14.<br />
The groundwater recharge watersheds have few or no streams, very high permeability, and are entirely<br />
groundwater recharge zones that were considered to be resilient or to have very low vulnerability to<br />
impacts from the projected climate change. There were 12 watersheds in this class; nine were split HUC-<br />
6s and three were complete HUC-6s. All were located on the Bayfield Peninsula. The estimated average<br />
annual future and historic potential groundwater recharge for these watersheds were 13.4 and 12.4 inches,<br />
respectively, resulting in an average increase of 1.0 inch (Table 4). These watersheds may provide the<br />
best opportunities on the Forest to implement adaptive management practices to respond to climate<br />
change for resources other than water.<br />
HUC-6 # of Est. Avg. Annual Potential<br />
Watershed HUC-6 Groundwater Recharge (inches)<br />
Class Watersheds 2046-2065 1971-1990 Difference<br />
Groundwater Recharge 12 13.4 12.4 1.0<br />
Groundwater Runoff 50 10.1 9.4 0.7<br />
Mixed Runoff 59 8.6 8.1 0.6<br />
Surface Runoff 37 7.0 6.6 0.4<br />
Table 4. Estimated Average Potential Groundwater Recharge for the historic (1971-1990)<br />
and future (2046-2065) time periods for HUC-6 watersheds on the Chequamegon-Nicolet NF<br />
251 Assessing the Vulnerability of Watersheds to Climate Change


