watervulnerability
watervulnerability watervulnerability
Chequamegon-‐Nicolet National Forest Watershed Vulnerability Assessment, Eastern Region (R9) RESULTS Wetlands For the historic period, the PHIM produced an average monthly snowpack that peaks in March at 2.2 inches of water equivalent and normally melts by mid-April (Figure 7). With warmer winters in the future, PHIM projects that average monthly snow water equivalent would peak in February at 1.7 inches and melt by mid-March. This represents a decline in average snow water of nearly 25 percent with melt occurring about one month earlier. The modeling results indicate average annual evapotranspiration from the upland-peatland complex would increase by 3.2 inches (from 21.7 to 24.9 inches), a 15 percent increase (Table 1). Average annual runoff would decline by 1.3 inches (from 5.5 to 4.2 inches), which represents a 24 percent decline. From a seasonal standpoint, runoff would remain the same in winter, increase in spring by 0.4 inches, and substantially decline in summer and fall (Table 1). Average annual water levels would decline only slightly in the bog but changes for individual seasons and months would be much greater. Average annual water levels in the bog would decline from 9.5 to 8.1 inches, or about 15 percent (Table 1). Monthly water levels would be unchanged in Jan-Feb, increase 0.5- 1.25 inches in Mar-May, and decline 0.5-4.5 inches in Jun-Dec (Figure 8). No flow days were predicted to occur 4.4 percent of the time (16 days/yr) for the current climate but would increase to 23.4 percent of time (85 days/yr) under the climate change scenario. The 4.5-inch decline in water levels in August and September and large increase in no-flow days could have a substantial effect on plant communities and carbon processes in the bog. Ave Snow Water Equivalnet (inches) 2.5 2.0 1.5 1.0 0.5 0.0 Jan Feb Mar Apr May Jun Jul Aug Sep Oct Nov Dec Month 1960-‐2000 2046-‐2065 Figure 7. PHIM average monthly watershed snow water equivalent for 1961-2000 and 2046-2065 The results indicating earlier snowmelt and higher initial water levels in the spring are similar to the results obtained by McAdams et al. (1993) who used PHIM to model streamflow and water table changes in the S2 bog due to climate change. S2 is an experimental peatland watershed located on the Marcell Experimental Watershed in northern Minnesota. The researchers used temperature and precipitation 244 Assessing the Vulnerability of Watersheds to Climate Change Peatland Hydrologic Impact Model Calibrated S2 Bog WS from Marcel Exp Forest in MN WICCI Climate Data longitude -‐90.1, ladtude 45.8 (located on Park Falls unit of Chequamegon-‐Nicolet NF) GFDL_CM2.0 Model, Scenario A1B
Chequamegon-‐Nicolet National Forest Watershed Vulnerability Assessment, Eastern Region (R9) increases projected for northern Minnesota by the GISS global climate model at the time of their study. These included monthly increases of 3 to 6 o C for temperature and 5 to 25 percent for precipitation. In their case, though, growing-season water levels in the bog were projected to decline by only 0.2-0.6 inches because higher evapotranspirational losses would be offset by higher summer precipitation. There was one modeling problem that remained unresolved. The spring runoff hydrograph for the historic period appears to peak at about 25 to 50 percent of expected runoff during the spring snowmelt season (Figure 9). It also appears to produce slightly higher runoff than expected in the fall. While this modeling problem causes some concern, the overall results seem to provide reasonable estimates of the potential impacts of climate change on bog hydrology in northern Wisconsin. These include future increases in average annual evapotranspiration of about 3.2 inches, decreases in runoff of 1.3 inches (about 25 percent) with an increase in spring and decreases in summer and fall, and lower water levels in the bog in summer and fall of 2-4.5 inches with an increase in no-flow days. Although the ecological implications of these potential changes in wetland hydrology need further evaluation, for the purposes of this analysis they were considered sufficient to conclude that climate change poses some risk to the Forest’s wetlands in general and to bogs in particular. These risks include loss of wetland area, changes in wetland plant communities, and alteration of wetland processes such as water chemistry, peat accumulation, and geochemical cycling. Season Time Period Air Temp. ( o C) Ppt. (in) ET (in) 245 Assessing the Vulnerability of Watersheds to Climate Change RO (in) Water Level (in) Winter 1961-2000 -10.3 3.2 0.2 0.4 8.6 2046-2065 -7.0 3.9 0.4 0.4 8.2 Spring 1961-2000 4.3 7.5 4.7 1.6 9.5 2046-2065 7.6 9.7 6.0 2.0 10.3 Summer 1961-2000 17.9 11.7 12.5 1.3 9.3 2046-2065 22.3 10.3 14.8 0.8 6.7 Autumn 1961-2000 6.3 8.7 3.7 2.1 10.5 2046-2065 9.2 8.0 4.4 0.8 7.3 Annual 1961-2000 4.6 31.1 21.7 5.5 9.5 2046-2065 8.1 31.9 24.9 4.2 8.1 Table 1. Average seasonal and annual water balance components from modeling of potential climate change impacts to wetlands on the Chequamegon-Nicolet National Forest. WICC climate data for longitude 90.1, latitude 45.8 located on Park Falls Unit of Chequamegon-Nicolet NF, GFDL_CM2.0 Model, A1B scenario. Water level estimates from Peatland Hydrologic Model (PHIM).
- Page 198 and 199: Shasta Trinity National Forest Wate
- Page 200 and 201: Shasta Trinity National Forest Wate
- Page 202 and 203: Shasta Trinity National Forest Wate
- Page 204 and 205: Shasta Trinity National Forest Wate
- Page 206 and 207: Shasta Trinity National Forest Wate
- Page 208 and 209: Shasta Trinity National Forest Wate
- Page 210 and 211: Shasta Trinity National Forest Wate
- Page 212 and 213: Shasta Trinity National Forest Wate
- Page 214 and 215: Assessment of Watershed Vulnerabili
- Page 216 and 217: Umatilla National Forest Watershed
- Page 218 and 219: Umatilla National Forest Watershed
- Page 220 and 221: Umatilla National Forest Watershed
- Page 222 and 223: Umatilla National Forest Watershed
- Page 224 and 225: Umatilla National Forest Watershed
- Page 226 and 227: Umatilla National Forest Watershed
- Page 228 and 229: Umatilla National Forest Watershed
- Page 230 and 231: Assessment of Watershed Vulnerabili
- Page 232 and 233: Ouachita National Forest Watershed
- Page 234 and 235: Ouachita National Forest Watershed
- Page 236 and 237: Ouachita National Forest Watershed
- Page 238 and 239: Ouachita National Forest Watershed
- Page 240 and 241: Assessment of Watershed Vulnerabili
- Page 242 and 243: Chequamegon-‐Nicolet National F
- Page 244 and 245: Chequamegon-‐Nicolet National F
- Page 246 and 247: Chequamegon-‐Nicolet National F
- Page 250 and 251: Chequamegon-‐Nicolet National F
- Page 252 and 253: Chequamegon-‐Nicolet National F
- Page 254 and 255: Chequamegon-‐Nicolet National F
- Page 256 and 257: Chequamegon-‐Nicolet National F
- Page 258 and 259: Chequamegon-‐Nicolet National F
- Page 260 and 261: Chequamegon-‐Nicolet National F
- Page 262 and 263: Chequamegon-‐Nicolet National F
- Page 264 and 265: Chequamegon-‐Nicolet National F
- Page 266 and 267: Chequamegon-‐Nicolet National F
- Page 268 and 269: Chequamegon-‐Nicolet National F
- Page 270 and 271: Assessment of Watershed Vulnerabili
- Page 272 and 273: Chugach National Forest Watershed V
- Page 274 and 275: Chugach National Forest Watershed V
- Page 276 and 277: Chugach National Forest Watershed V
- Page 278 and 279: Chugach National Forest Watershed V
- Page 280 and 281: Chugach National Forest Watershed V
- Page 282 and 283: Chugach National Forest Watershed V
- Page 284 and 285: Chugach National Forest Watershed V
- Page 286 and 287: Chugach National Forest Watershed V
- Page 288 and 289: Chugach National Forest Watershed V
- Page 290 and 291: Chugach National Forest Watershed V
- Page 292 and 293: Chugach National Forest Watershed V
- Page 294 and 295: Chugach National Forest Watershed V
- Page 296 and 297: Chugach National Forest Watershed V
Chequamegon-‐Nicolet National Forest Watershed Vulnerability Assessment, Eastern Region (R9)<br />
RESULTS<br />
Wetlands<br />
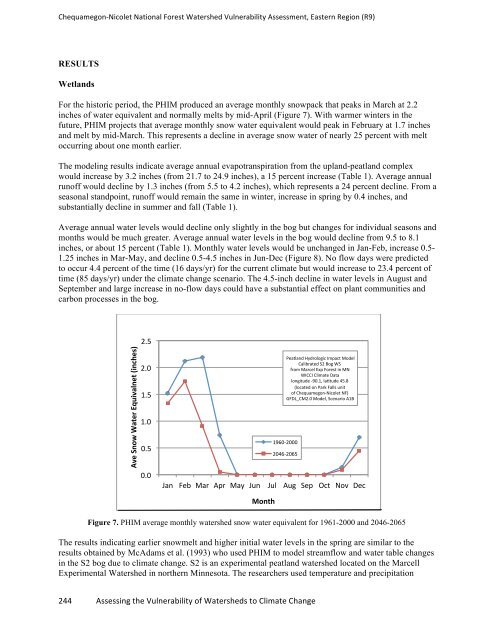
For the historic period, the PHIM produced an average monthly snowpack that peaks in March at 2.2<br />
inches of water equivalent and normally melts by mid-April (Figure 7). With warmer winters in the<br />
future, PHIM projects that average monthly snow water equivalent would peak in February at 1.7 inches<br />
and melt by mid-March. This represents a decline in average snow water of nearly 25 percent with melt<br />
occurring about one month earlier.<br />
The modeling results indicate average annual evapotranspiration from the upland-peatland complex<br />
would increase by 3.2 inches (from 21.7 to 24.9 inches), a 15 percent increase (Table 1). Average annual<br />
runoff would decline by 1.3 inches (from 5.5 to 4.2 inches), which represents a 24 percent decline. From a<br />
seasonal standpoint, runoff would remain the same in winter, increase in spring by 0.4 inches, and<br />
substantially decline in summer and fall (Table 1).<br />
Average annual water levels would decline only slightly in the bog but changes for individual seasons and<br />
months would be much greater. Average annual water levels in the bog would decline from 9.5 to 8.1<br />
inches, or about 15 percent (Table 1). Monthly water levels would be unchanged in Jan-Feb, increase 0.5-<br />
1.25 inches in Mar-May, and decline 0.5-4.5 inches in Jun-Dec (Figure 8). No flow days were predicted<br />
to occur 4.4 percent of the time (16 days/yr) for the current climate but would increase to 23.4 percent of<br />
time (85 days/yr) under the climate change scenario. The 4.5-inch decline in water levels in August and<br />
September and large increase in no-flow days could have a substantial effect on plant communities and<br />
carbon processes in the bog.<br />
Ave Snow Water Equivalnet (inches)<br />
2.5<br />
2.0<br />
1.5<br />
1.0<br />
0.5<br />
0.0<br />
Jan Feb Mar Apr May Jun Jul Aug Sep Oct Nov Dec<br />
Month<br />
1960-‐2000<br />
2046-‐2065<br />
Figure 7. PHIM average monthly watershed snow water equivalent for 1961-2000 and 2046-2065<br />
The results indicating earlier snowmelt and higher initial water levels in the spring are similar to the<br />
results obtained by McAdams et al. (1993) who used PHIM to model streamflow and water table changes<br />
in the S2 bog due to climate change. S2 is an experimental peatland watershed located on the Marcell<br />
Experimental Watershed in northern Minnesota. The researchers used temperature and precipitation<br />
244 Assessing the Vulnerability of Watersheds to Climate Change<br />
Peatland Hydrologic Impact Model<br />
Calibrated S2 Bog WS<br />
from Marcel Exp Forest in MN<br />
WICCI Climate Data<br />
longitude -‐90.1, ladtude 45.8<br />
(located on Park Falls unit<br />
of Chequamegon-‐Nicolet NF)<br />
GFDL_CM2.0 Model, Scenario A1B


