

watervulnerability
watervulnerability
watervulnerability

Create successful ePaper yourself
Turn your PDF publications into a flip-book with our unique Google optimized e-Paper software.
Ouachita National Forest Watershed Vulnerability Assessment, Southern Region (R8)<br />
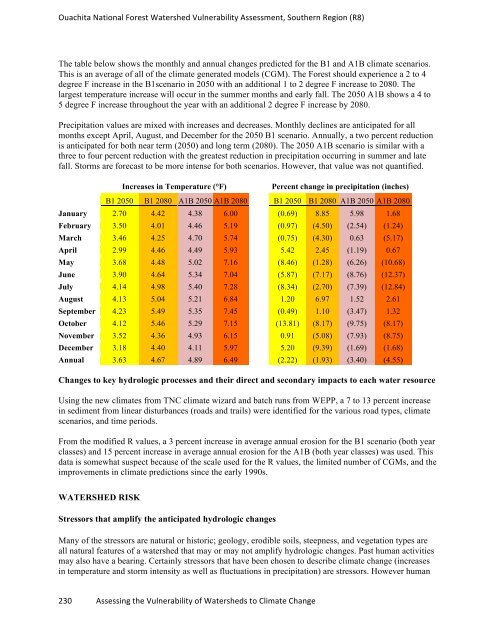
The table below shows the monthly and annual changes predicted for the B1 and A1B climate scenarios.<br />
This is an average of all of the climate generated models (CGM). The Forest should experience a 2 to 4<br />
degree F increase in the B1scenario in 2050 with an additional 1 to 2 degree F increase to 2080. The<br />
largest temperature increase will occur in the summer months and early fall. The 2050 A1B shows a 4 to<br />
5 degree F increase throughout the year with an additional 2 degree F increase by 2080.<br />
Precipitation values are mixed with increases and decreases. Monthly declines are anticipated for all<br />
months except April, August, and December for the 2050 B1 scenario. Annually, a two percent reduction<br />
is anticipated for both near term (2050) and long term (2080). The 2050 A1B scenario is similar with a<br />
three to four percent reduction with the greatest reduction in precipitation occurring in summer and late<br />
fall. Storms are forecast to be more intense for both scenarios. However, that value was not quantified.<br />
Increases in Temperature (°F) Percent change in precipitation (inches)<br />
B1 2050 B1 2080 A1B 2050 A1B 2080<br />
January 2.70 4.42 4.38 6.00<br />
February 3.50 4.01 4.46 5.19<br />
March 3.46 4.25 4.70 5.74<br />
April 2.99 4.46 4.49 5.93<br />
May 3.68 4.48 5.02 7.16<br />
June 3.90 4.64 5.34 7.04<br />
July 4.14 4.98 5.40 7.28<br />
August 4.13 5.04 5.21 6.84<br />
September 4.23 5.49 5.35 7.45<br />
October 4.12 5.46 5.29 7.15<br />
November 3.52 4.36 4.93 6.15<br />
December 3.18 4.40 4.11 5.97<br />
Annual 3.63 4.67 4.89 6.49<br />
230 Assessing the Vulnerability of Watersheds to Climate Change<br />
B1 2050 B1 2080 A1B 2050 A1B 2080<br />
(0.69) 8.85 5.98 1.68<br />
(0.97) (4.50) (2.54) (1.24)<br />
(0.75) (4.30) 0.63 (5.17)<br />
5.42 2.45 (1.19) 0.67<br />
(8.46) (1.28) (6.26) (10.68)<br />
(5.87) (7.17) (8.76) (12.37)<br />
(8.34) (2.70) (7.39) (12.84)<br />
1.20 6.97 1.52 2.61<br />
(0.49) 1.10 (3.47) 1.32<br />
(13.81) (8.17) (9.75) (8.17)<br />
0.91 (5.08) (7.93) (8.75)<br />
5.20 (9.39) (1.69) (1.68)<br />
(2.22) (1.93) (3.40) (4.55)<br />
Changes to key hydrologic processes and their direct and secondary impacts to each water resource<br />
Using the new climates from TNC climate wizard and batch runs from WEPP, a 7 to 13 percent increase<br />
in sediment from linear disturbances (roads and trails) were identified for the various road types, climate<br />
scenarios, and time periods.<br />
From the modified R values, a 3 percent increase in average annual erosion for the B1 scenario (both year<br />
classes) and 15 percent increase in average annual erosion for the A1B (both year classes) was used. This<br />
data is somewhat suspect because of the scale used for the R values, the limited number of CGMs, and the<br />
improvements in climate predictions since the early 1990s.<br />
WATERSHED RISK<br />
Stressors that amplify the anticipated hydrologic changes<br />
Many of the stressors are natural or historic; geology, erodible soils, steepness, and vegetation types are<br />
all natural features of a watershed that may or may not amplify hydrologic changes. Past human activities<br />
may also have a bearing. Certainly stressors that have been chosen to describe climate change (increases<br />
in temperature and storm intensity as well as fluctuations in precipitation) are stressors. However human