

watervulnerability
watervulnerability
watervulnerability

Create successful ePaper yourself
Turn your PDF publications into a flip-book with our unique Google optimized e-Paper software.
The sensitivity evaluation typically resulted in maps<br />
showing relative sensitivities of subwatersheds. Two<br />
examples of this type of product are displayed. Figure 15<br />
shows the sensitivity rating from the Umatilla NF, where<br />
(like the GMUG example) a matrix was used to produce<br />
a combined rating of intrinsic and anthropogenic<br />
factors. A combined sensitivity rating was applied<br />
to a composite of resource values. The Coconino NF<br />
developed different sensitivity ratings for each water<br />
resource issue (Figure 16).<br />
Recent trends and projected future trends in resource<br />
conditions should also be included. For example,<br />
increased water diversion could exacerbate effects on<br />
a resource, whereas anticipated road improvements<br />
could improve condition and reduce effects that might<br />
otherwise occur.<br />
EVALUATE AND CATEGORIZE<br />
VULNERABILITY<br />
Climate change is a risk-multiplier… any decline<br />
N<br />
NF Boundary<br />
HUC6<br />
WI Counties<br />
Low<br />
Moderate<br />
High<br />
Very High<br />
1:1,000,000<br />
Figure 10. Relative vulnerability of wetlands to climate change for HUC6<br />
watersheds on the Chequamegon-Nicolet National Forest.<br />
Figure 17. Classification of climate-change risk to wetlands<br />
on the Chequamegon-Nicolet NFs. The rating is based on<br />
the proportion of total wetland and acid wetland within the<br />
National Forest boundary in each HUC-6. Total wetland area<br />
ranged from 0 percent to 55.8 percent of the area for all HUC-<br />
6 watersheds. The HUC-6s with less than 10 percent were<br />
rated “low,” those with 10 percent to 30 percent were rated<br />
“moderate,” and those with greater than 30 percent were rated<br />
“high.” The HUC-6s with less than 5 percent acid wetland area<br />
were rated “low,” those with 5 percent to 15 percent were rated<br />
“moderate,” and those with greater than 15 percent were rated<br />
“high,” and above that value were "very high". These two risk<br />
classes were combined to form one vulnerability classification<br />
for each watershed.<br />
18 | ASSESSING THE VULNERABILITY OF WATERSHEDS TO CLIMATE CHANGE<br />
in the ecological resilience of one resource<br />
base or ecosystem increases the fragility of<br />
the whole —HRH Charles, The Prince of Wales,<br />
addressing UN climate conference COP15,<br />
Copenhagen (December 2009)<br />
A relative rating of vulnerability of water resources to<br />
climate change was produced by combining information<br />
from the evaluation of resource values, exposure, and<br />
sensitivity. Pilot Forests used a variety of approaches<br />
to complete this step. Primary determinants were the<br />
number of water resources selected for analysis, and<br />
the way values, sensitivities, and responses had been<br />
described. Some pilot Forests classified vulnerability<br />
based on a threshold or ecological value (such as the<br />
amount of wetland area in each watershed, as shown in the<br />
Chequamegon-Nicolet example in Figure 17). The most<br />
common approach used by pilot Forests was to merge the<br />
location of values with ratings of watershed sensitivity,<br />
and then overlay that summary rating with differences<br />
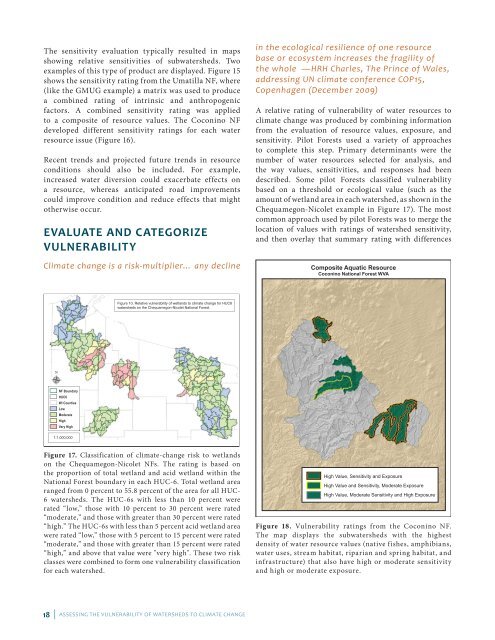
Composite Aquatic Resource<br />
Coconino National Forest WVA<br />
High Value, Sensitivity and Exposure<br />
High Value and Sensitivity, Moderate Exposure<br />
High Value, Moderate Sensitivity and High Exposure<br />
Figure 18. Vulnerability ratings from the Coconino NF.<br />
The map displays the subwatersheds with the highest<br />
density of water resource values (native fishes, amphi bians,<br />
water uses, stream habitat, riparian and spring habitat, and<br />
infrastructure) that also have high or moderate sensitivity<br />
and high or moderate exposure.