watervulnerability
watervulnerability watervulnerability
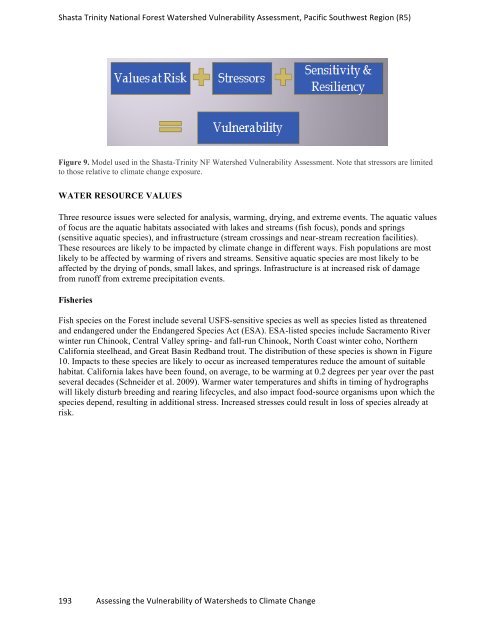
Shasta Trinity National Forest Watershed Vulnerability Assessment, Pacific Southwest Region (R5) Figure 7. Trends in snow depths from snow courses on the Shasta-Trinity National Forest. Maximum, mean and minimum depths are shown in green, blue and red, respectively. Figure 8. Photographs of the Hotlum Glacier, Mount Shasta, taken September 18, 1935 (left) and August 24, 2008 (right). Photos courtesy of Mount Shasta Climbing Rangers. APPROACH TO ASSESSING VULNERABILITY The general model used in this assessment is shown in Figure 9. The approach starts with identifying important aquatic resource values on the Forest that might be affected by climate change. Next, the potential changes to climate and the resources were assessed. The third step was to examine factors that might modify the response. The three components are characterized (rated and ranked) at the watershed scales described above. Vulnerability was derived by overlaying the products of the first three steps. The objective of the assessment was to provide a means of describing relative vulnerability of aquatic resources on the Forest to potential climate change impacts. It is important to remember the results are not applicable to watersheds not on the Forest, and they are not based on ecological thresholds. 192 Assessing the Vulnerability of Watersheds to Climate Change
Shasta Trinity National Forest Watershed Vulnerability Assessment, Pacific Southwest Region (R5) Figure 9. Model used in the Shasta-Trinity NF Watershed Vulnerability Assessment. Note that stressors are limited to those relative to climate change exposure. WATER RESOURCE VALUES Three resource issues were selected for analysis, warming, drying, and extreme events. The aquatic values of focus are the aquatic habitats associated with lakes and streams (fish focus), ponds and springs (sensitive aquatic species), and infrastructure (stream crossings and near-stream recreation facilities). These resources are likely to be impacted by climate change in different ways. Fish populations are most likely to be affected by warming of rivers and streams. Sensitive aquatic species are most likely to be affected by the drying of ponds, small lakes, and springs. Infrastructure is at increased risk of damage from runoff from extreme precipitation events. Fisheries Fish species on the Forest include several USFS-sensitive species as well as species listed as threatened and endangered under the Endangered Species Act (ESA). ESA-listed species include Sacramento River winter run Chinook, Central Valley spring- and fall-run Chinook, North Coast winter coho, Northern California steelhead, and Great Basin Redband trout. The distribution of these species is shown in Figure 10. Impacts to these species are likely to occur as increased temperatures reduce the amount of suitable habitat. California lakes have been found, on average, to be warming at 0.2 degrees per year over the past several decades (Schneider et al. 2009). Warmer water temperatures and shifts in timing of hydrographs will likely disturb breeding and rearing lifecycles, and also impact food-source organisms upon which the species depend, resulting in additional stress. Increased stresses could result in loss of species already at risk. 193 Assessing the Vulnerability of Watersheds to Climate Change
- Page 146 and 147: Coconino National Forest Watershed
- Page 148 and 149: Coconino National Forest Watershed
- Page 150 and 151: Coconino National Forest Watershed
- Page 152 and 153: Coconino National Forest Watershed
- Page 154 and 155: Coconino National Forest Watershed
- Page 156 and 157: Coconino National Forest Watershed
- Page 158 and 159: Coconino National Forest Watershed
- Page 160 and 161: Coconino National Forest Watershed
- Page 162 and 163: Coconino National Forest Watershed
- Page 164 and 165: Sawtooth National Forest Watershed
- Page 166 and 167: Sawtooth National Forest Watershed
- Page 168 and 169: Sawtooth National Forest Watershed
- Page 170 and 171: Sawtooth National Forest Watershed
- Page 172 and 173: Sawtooth National Forest Watershed
- Page 174 and 175: Sawtooth National Forest Watershed
- Page 176 and 177: Sawtooth National Forest Watershed
- Page 178 and 179: Sawtooth National Forest Watershed
- Page 180 and 181: Sawtooth National Forest Watershed
- Page 182 and 183: Sawtooth National Forest Watershed
- Page 184 and 185: Sawtooth National Forest Watershed
- Page 186 and 187: Sawtooth National Forest Watershed
- Page 188 and 189: Sawtooth National Forest Watershed
- Page 190 and 191: Shasta Trinity National Forest Wate
- Page 192 and 193: Shasta Trinity National Forest Wate
- Page 194 and 195: Shasta Trinity National Forest Wate
- Page 198 and 199: Shasta Trinity National Forest Wate
- Page 200 and 201: Shasta Trinity National Forest Wate
- Page 202 and 203: Shasta Trinity National Forest Wate
- Page 204 and 205: Shasta Trinity National Forest Wate
- Page 206 and 207: Shasta Trinity National Forest Wate
- Page 208 and 209: Shasta Trinity National Forest Wate
- Page 210 and 211: Shasta Trinity National Forest Wate
- Page 212 and 213: Shasta Trinity National Forest Wate
- Page 214 and 215: Assessment of Watershed Vulnerabili
- Page 216 and 217: Umatilla National Forest Watershed
- Page 218 and 219: Umatilla National Forest Watershed
- Page 220 and 221: Umatilla National Forest Watershed
- Page 222 and 223: Umatilla National Forest Watershed
- Page 224 and 225: Umatilla National Forest Watershed
- Page 226 and 227: Umatilla National Forest Watershed
- Page 228 and 229: Umatilla National Forest Watershed
- Page 230 and 231: Assessment of Watershed Vulnerabili
- Page 232 and 233: Ouachita National Forest Watershed
- Page 234 and 235: Ouachita National Forest Watershed
- Page 236 and 237: Ouachita National Forest Watershed
- Page 238 and 239: Ouachita National Forest Watershed
- Page 240 and 241: Assessment of Watershed Vulnerabili
- Page 242 and 243: Chequamegon-‐Nicolet National F
- Page 244 and 245: Chequamegon-‐Nicolet National F
Shasta Trinity National Forest Watershed Vulnerability Assessment, Pacific Southwest Region (R5)<br />
Figure 9. Model used in the Shasta-Trinity NF Watershed Vulnerability Assessment. Note that stressors are limited<br />
to those relative to climate change exposure.<br />
WATER RESOURCE VALUES<br />
Three resource issues were selected for analysis, warming, drying, and extreme events. The aquatic values<br />
of focus are the aquatic habitats associated with lakes and streams (fish focus), ponds and springs<br />
(sensitive aquatic species), and infrastructure (stream crossings and near-stream recreation facilities).<br />
These resources are likely to be impacted by climate change in different ways. Fish populations are most<br />
likely to be affected by warming of rivers and streams. Sensitive aquatic species are most likely to be<br />
affected by the drying of ponds, small lakes, and springs. Infrastructure is at increased risk of damage<br />
from runoff from extreme precipitation events.<br />
Fisheries<br />
Fish species on the Forest include several USFS-sensitive species as well as species listed as threatened<br />
and endangered under the Endangered Species Act (ESA). ESA-listed species include Sacramento River<br />
winter run Chinook, Central Valley spring- and fall-run Chinook, North Coast winter coho, Northern<br />
California steelhead, and Great Basin Redband trout. The distribution of these species is shown in Figure<br />
10. Impacts to these species are likely to occur as increased temperatures reduce the amount of suitable<br />
habitat. California lakes have been found, on average, to be warming at 0.2 degrees per year over the past<br />
several decades (Schneider et al. 2009). Warmer water temperatures and shifts in timing of hydrographs<br />
will likely disturb breeding and rearing lifecycles, and also impact food-source organisms upon which the<br />
species depend, resulting in additional stress. Increased stresses could result in loss of species already at<br />
risk.<br />
193 Assessing the Vulnerability of Watersheds to Climate Change


