watervulnerability
watervulnerability watervulnerability
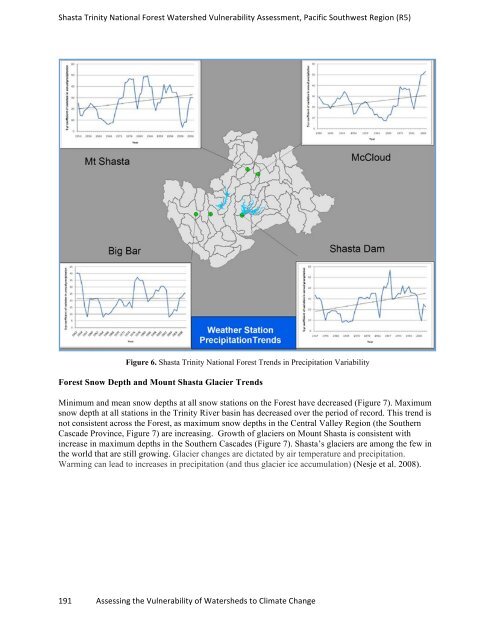
Shasta Trinity National Forest Watershed Vulnerability Assessment, Pacific Southwest Region (R5) Precipitation Variability Figure 5. Shasta Trinity National Forest Mean Annual Temperature Trends Precipitation variability has significantly increased at all gauges in Sacramento River Basin (Southern Cascade Province) (McCloud and Mt Shasta Stations, Figure 6) on the east side of the Forest. This pattern in not evident in the west in the Trinity portion of Klamath Basin (Big Bar, Figure 6). 190 Assessing the Vulnerability of Watersheds to Climate Change
Shasta Trinity National Forest Watershed Vulnerability Assessment, Pacific Southwest Region (R5) Figure 6. Shasta Trinity National Forest Trends in Precipitation Variability Forest Snow Depth and Mount Shasta Glacier Trends Minimum and mean snow depths at all snow stations on the Forest have decreased (Figure 7). Maximum snow depth at all stations in the Trinity River basin has decreased over the period of record. This trend is not consistent across the Forest, as maximum snow depths in the Central Valley Region (the Southern Cascade Province, Figure 7) are increasing. Growth of glaciers on Mount Shasta is consistent with increase in maximum depths in the Southern Cascades (Figure 7). Shasta’s glaciers are among the few in the world that are still growing. Glacier changes are dictated by air temperature and precipitation. Warming can lead to increases in precipitation (and thus glacier ice accumulation) (Nesje et al. 2008). 191 Assessing the Vulnerability of Watersheds to Climate Change
- Page 144 and 145: Coconino National Forest Watershed
- Page 146 and 147: Coconino National Forest Watershed
- Page 148 and 149: Coconino National Forest Watershed
- Page 150 and 151: Coconino National Forest Watershed
- Page 152 and 153: Coconino National Forest Watershed
- Page 154 and 155: Coconino National Forest Watershed
- Page 156 and 157: Coconino National Forest Watershed
- Page 158 and 159: Coconino National Forest Watershed
- Page 160 and 161: Coconino National Forest Watershed
- Page 162 and 163: Coconino National Forest Watershed
- Page 164 and 165: Sawtooth National Forest Watershed
- Page 166 and 167: Sawtooth National Forest Watershed
- Page 168 and 169: Sawtooth National Forest Watershed
- Page 170 and 171: Sawtooth National Forest Watershed
- Page 172 and 173: Sawtooth National Forest Watershed
- Page 174 and 175: Sawtooth National Forest Watershed
- Page 176 and 177: Sawtooth National Forest Watershed
- Page 178 and 179: Sawtooth National Forest Watershed
- Page 180 and 181: Sawtooth National Forest Watershed
- Page 182 and 183: Sawtooth National Forest Watershed
- Page 184 and 185: Sawtooth National Forest Watershed
- Page 186 and 187: Sawtooth National Forest Watershed
- Page 188 and 189: Sawtooth National Forest Watershed
- Page 190 and 191: Shasta Trinity National Forest Wate
- Page 192 and 193: Shasta Trinity National Forest Wate
- Page 196 and 197: Shasta Trinity National Forest Wate
- Page 198 and 199: Shasta Trinity National Forest Wate
- Page 200 and 201: Shasta Trinity National Forest Wate
- Page 202 and 203: Shasta Trinity National Forest Wate
- Page 204 and 205: Shasta Trinity National Forest Wate
- Page 206 and 207: Shasta Trinity National Forest Wate
- Page 208 and 209: Shasta Trinity National Forest Wate
- Page 210 and 211: Shasta Trinity National Forest Wate
- Page 212 and 213: Shasta Trinity National Forest Wate
- Page 214 and 215: Assessment of Watershed Vulnerabili
- Page 216 and 217: Umatilla National Forest Watershed
- Page 218 and 219: Umatilla National Forest Watershed
- Page 220 and 221: Umatilla National Forest Watershed
- Page 222 and 223: Umatilla National Forest Watershed
- Page 224 and 225: Umatilla National Forest Watershed
- Page 226 and 227: Umatilla National Forest Watershed
- Page 228 and 229: Umatilla National Forest Watershed
- Page 230 and 231: Assessment of Watershed Vulnerabili
- Page 232 and 233: Ouachita National Forest Watershed
- Page 234 and 235: Ouachita National Forest Watershed
- Page 236 and 237: Ouachita National Forest Watershed
- Page 238 and 239: Ouachita National Forest Watershed
- Page 240 and 241: Assessment of Watershed Vulnerabili
- Page 242 and 243: Chequamegon-‐Nicolet National F
Shasta Trinity National Forest Watershed Vulnerability Assessment, Pacific Southwest Region (R5)<br />
Figure 6. Shasta Trinity National Forest Trends in Precipitation Variability<br />
Forest Snow Depth and Mount Shasta Glacier Trends<br />
Minimum and mean snow depths at all snow stations on the Forest have decreased (Figure 7). Maximum<br />
snow depth at all stations in the Trinity River basin has decreased over the period of record. This trend is<br />
not consistent across the Forest, as maximum snow depths in the Central Valley Region (the Southern<br />
Cascade Province, Figure 7) are increasing. Growth of glaciers on Mount Shasta is consistent with<br />
increase in maximum depths in the Southern Cascades (Figure 7). Shasta’s glaciers are among the few in<br />
the world that are still growing. Glacier changes are dictated by air temperature and precipitation.<br />
Warming can lead to increases in precipitation (and thus glacier ice accumulation) (Nesje et al. 2008).<br />
191 Assessing the Vulnerability of Watersheds to Climate Change


