watervulnerability
watervulnerability watervulnerability
Sawtooth National Forest Watershed Vulnerability Assessment, Intermountain Region (R4) and Stewart et al. (2005) found that stream runoff steadily advanced during the latter half of the twentieth century and now occurs 1 to 3 weeks earlier, due largely to concurrent decreases in snowpack and earlier spring melt (Mote et al. 2005). These changes diminished recharge of subsurface aquifers that support summer baseflows (Hamlet et al. 2005). Luce and Holden (2009) found that three-fourths of the 43 gauge records they examined from the Pacific Northwest exhibited statistically significant declines in summer low flows. Luce and Holden (2009) also found that the driest 25% of years are becoming drier across the majority of the Pacific Northwest sites, with most streams showing decreases exceeding 29% and some showing decreases approaching 50% between 1948 and 2006. Sites on or near the Sawtooth National Forest showed similar declines in mean annual flow (Table 3). Site Name 13139510 13186000 13302500 Big Wood River at Hailey SF Boise River NF Featherville Salmon River at Salmon Table 3. Mean annual flow from 1948-2006 Average Annual Flow (mm) 25 th Percentile Change 170 Assessing the Vulnerability of Watersheds to Climate Change Median Change 75 th Percentile Change Mean Change 257 -31% -13% -6% -7% 411 -43% -30% 1% -21% 182 -42% -29% -11% -26% In the upper Salmon River drainage, there are numerous irrigation diversions on federal and private land within the Sawtooth NRA. There are nine subwatersheds (Champion, Elk, Fisher, Huckleberry, Iron- Goat, Park-Hanna, Pole, Slate, and Smiley Creeks) at risk from declining baseflows and water diversion (Table 4). Future decreases in summer baseflows in these subwatersheds are likely to have severe consequences for aquatic ecosystems where there are already high water demands from diversions. HUC-6 Name % Decrease in MeanSummer Baseflows from Current 2040 2080 Overall Influence Water Diversions Miles of Stream Impacted Alturas Lake 24 39 None -- Beaver Creek 30 42 Low 1.21 Beaver-Peach 14 25 Low 3.88 Big Boulder Creek 109 15 Low 0.58 Big Casino Creek 10 14 Moderate 1.06 Big Lake Creek 11 20 None -- Bluett-Baker 10 22 Low 3.96 Boundary-Cleveland 15 28 Low 5.25 Cabin-Vat 22 34 Low 1.99 Champion Creek 17 33 Mod/High 3.13 East Basin-Kelly 24 30 None -- Elk Creek 25 53 Moderate 0.30 Fisher Creek 24 27 High 1.95 Fishhook Creek 25 37 None -- Fourth of July Creek 122 21 Low/Mod 4.52 French-Spring 13 24 Low 5.16 Germania Creek 13 27 None --
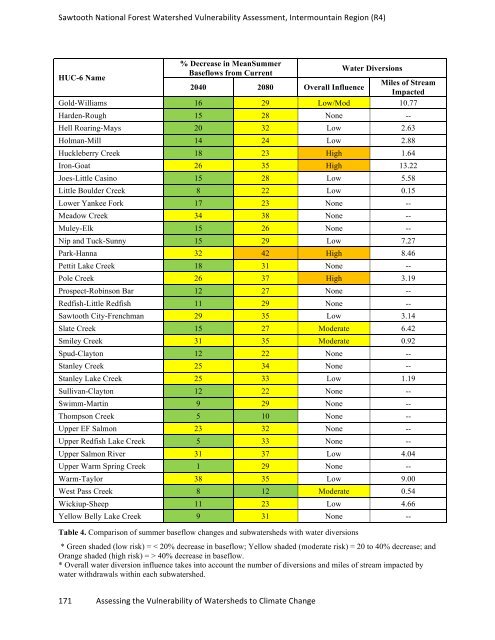
Sawtooth National Forest Watershed Vulnerability Assessment, Intermountain Region (R4) HUC-6 Name % Decrease in MeanSummer Baseflows from Current 2040 2080 Overall Influence 171 Assessing the Vulnerability of Watersheds to Climate Change Water Diversions Miles of Stream Impacted Gold-Williams 16 29 Low/Mod 10.77 Harden-Rough 15 28 None -- Hell Roaring-Mays 20 32 Low 2.63 Holman-Mill 14 24 Low 2.88 Huckleberry Creek 18 23 High 1.64 Iron-Goat 26 35 High 13.22 Joes-Little Casino 15 28 Low 5.58 Little Boulder Creek 8 22 Low 0.15 Lower Yankee Fork 17 23 None -- Meadow Creek 34 38 None -- Muley-Elk 15 26 None -- Nip and Tuck-Sunny 15 29 Low 7.27 Park-Hanna 32 42 High 8.46 Pettit Lake Creek 18 31 None -- Pole Creek 26 37 High 3.19 Prospect-Robinson Bar 12 27 None -- Redfish-Little Redfish 11 29 None -- Sawtooth City-Frenchman 29 35 Low 3.14 Slate Creek 15 27 Moderate 6.42 Smiley Creek 31 35 Moderate 0.92 Spud-Clayton 12 22 None -- Stanley Creek 25 34 None -- Stanley Lake Creek 25 33 Low 1.19 Sullivan-Clayton 12 22 None -- Swimm-Martin 9 29 None -- Thompson Creek 5 10 None -- Upper EF Salmon 23 32 None -- Upper Redfish Lake Creek 5 33 None -- Upper Salmon River 31 37 Low 4.04 Upper Warm Spring Creek 1 29 None -- Warm-Taylor 38 35 Low 9.00 West Pass Creek 8 12 Moderate 0.54 Wickiup-Sheep 11 23 Low 4.66 Yellow Belly Lake Creek 9 31 None -- Table 4. Comparison of summer baseflow changes and subwatersheds with water diversions * Green shaded (low risk) = < 20% decrease in baseflow; Yellow shaded (moderate risk) = 20 to 40% decrease; and Orange shaded (high risk) = > 40% decrease in baseflow. * Overall water diversion influence takes into account the number of diversions and miles of stream impacted by water withdrawals within each subwatershed.
- Page 124 and 125: White River National Forest Watersh
- Page 126 and 127: White River National Forest Watersh
- Page 128 and 129: White River National Forest Watersh
- Page 130 and 131: White River National Forest Watersh
- Page 132 and 133: White River National Forest Watersh
- Page 134 and 135: Assessment of Watershed Vulnerabili
- Page 136 and 137: Coconino National Forest Watershed
- Page 138 and 139: Coconino National Forest Watershed
- Page 140 and 141: Coconino National Forest Watershed
- Page 142 and 143: Coconino National Forest Watershed
- Page 144 and 145: Coconino National Forest Watershed
- Page 146 and 147: Coconino National Forest Watershed
- Page 148 and 149: Coconino National Forest Watershed
- Page 150 and 151: Coconino National Forest Watershed
- Page 152 and 153: Coconino National Forest Watershed
- Page 154 and 155: Coconino National Forest Watershed
- Page 156 and 157: Coconino National Forest Watershed
- Page 158 and 159: Coconino National Forest Watershed
- Page 160 and 161: Coconino National Forest Watershed
- Page 162 and 163: Coconino National Forest Watershed
- Page 164 and 165: Sawtooth National Forest Watershed
- Page 166 and 167: Sawtooth National Forest Watershed
- Page 168 and 169: Sawtooth National Forest Watershed
- Page 170 and 171: Sawtooth National Forest Watershed
- Page 172 and 173: Sawtooth National Forest Watershed
- Page 176 and 177: Sawtooth National Forest Watershed
- Page 178 and 179: Sawtooth National Forest Watershed
- Page 180 and 181: Sawtooth National Forest Watershed
- Page 182 and 183: Sawtooth National Forest Watershed
- Page 184 and 185: Sawtooth National Forest Watershed
- Page 186 and 187: Sawtooth National Forest Watershed
- Page 188 and 189: Sawtooth National Forest Watershed
- Page 190 and 191: Shasta Trinity National Forest Wate
- Page 192 and 193: Shasta Trinity National Forest Wate
- Page 194 and 195: Shasta Trinity National Forest Wate
- Page 196 and 197: Shasta Trinity National Forest Wate
- Page 198 and 199: Shasta Trinity National Forest Wate
- Page 200 and 201: Shasta Trinity National Forest Wate
- Page 202 and 203: Shasta Trinity National Forest Wate
- Page 204 and 205: Shasta Trinity National Forest Wate
- Page 206 and 207: Shasta Trinity National Forest Wate
- Page 208 and 209: Shasta Trinity National Forest Wate
- Page 210 and 211: Shasta Trinity National Forest Wate
- Page 212 and 213: Shasta Trinity National Forest Wate
- Page 214 and 215: Assessment of Watershed Vulnerabili
- Page 216 and 217: Umatilla National Forest Watershed
- Page 218 and 219: Umatilla National Forest Watershed
- Page 220 and 221: Umatilla National Forest Watershed
- Page 222 and 223: Umatilla National Forest Watershed
Sawtooth National Forest Watershed Vulnerability Assessment, Intermountain Region (R4)<br />
HUC-6 Name<br />
% Decrease in MeanSummer<br />
Baseflows from Current<br />
2040 2080 Overall Influence<br />
171 Assessing the Vulnerability of Watersheds to Climate Change<br />
Water Diversions<br />
Miles of Stream<br />
Impacted<br />
Gold-Williams 16 29 Low/Mod 10.77<br />
Harden-Rough 15 28 None --<br />
Hell Roaring-Mays 20 32 Low 2.63<br />
Holman-Mill 14 24 Low 2.88<br />
Huckleberry Creek 18 23 High 1.64<br />
Iron-Goat 26 35 High 13.22<br />
Joes-Little Casino 15 28 Low 5.58<br />
Little Boulder Creek 8 22 Low 0.15<br />
Lower Yankee Fork 17 23 None --<br />
Meadow Creek 34 38 None --<br />
Muley-Elk 15 26 None --<br />
Nip and Tuck-Sunny 15 29 Low 7.27<br />
Park-Hanna 32 42 High 8.46<br />
Pettit Lake Creek 18 31 None --<br />
Pole Creek 26 37 High 3.19<br />
Prospect-Robinson Bar 12 27 None --<br />
Redfish-Little Redfish 11 29 None --<br />
Sawtooth City-Frenchman 29 35 Low 3.14<br />
Slate Creek 15 27 Moderate 6.42<br />
Smiley Creek 31 35 Moderate 0.92<br />
Spud-Clayton 12 22 None --<br />
Stanley Creek 25 34 None --<br />
Stanley Lake Creek 25 33 Low 1.19<br />
Sullivan-Clayton 12 22 None --<br />
Swimm-Martin 9 29 None --<br />
Thompson Creek 5 10 None --<br />
Upper EF Salmon 23 32 None --<br />
Upper Redfish Lake Creek 5 33 None --<br />
Upper Salmon River 31 37 Low 4.04<br />
Upper Warm Spring Creek 1 29 None --<br />
Warm-Taylor 38 35 Low 9.00<br />
West Pass Creek 8 12 Moderate 0.54<br />
Wickiup-Sheep 11 23 Low 4.66<br />
Yellow Belly Lake Creek 9 31 None --<br />
Table 4. Comparison of summer baseflow changes and subwatersheds with water diversions<br />
* Green shaded (low risk) = < 20% decrease in baseflow; Yellow shaded (moderate risk) = 20 to 40% decrease; and<br />
Orange shaded (high risk) = > 40% decrease in baseflow.<br />
* Overall water diversion influence takes into account the number of diversions and miles of stream impacted by<br />
water withdrawals within each subwatershed.


