

watervulnerability
watervulnerability
watervulnerability

Create successful ePaper yourself
Turn your PDF publications into a flip-book with our unique Google optimized e-Paper software.
level of uncertainty. Though there may be uncertainty<br />
in characterizing resource value, especially when ratings<br />
comprise more than one resource (for example, frogs plus<br />
fish species), descriptions of resource locations generally<br />
have little error. Likewise, assessments of sensitivity, as<br />
we will see in the next section, are composites of both<br />
intrinsic and anthropogenic factors. Schemes to combine<br />
or weigh the factors contain error, relative to how these<br />
factors are expressed in nature. Nevertheless, these<br />
assessment components are likely to be more accurate<br />
than projections of future temperature and snowpack,<br />
especially regarding what will actually occur decades<br />
from now.<br />
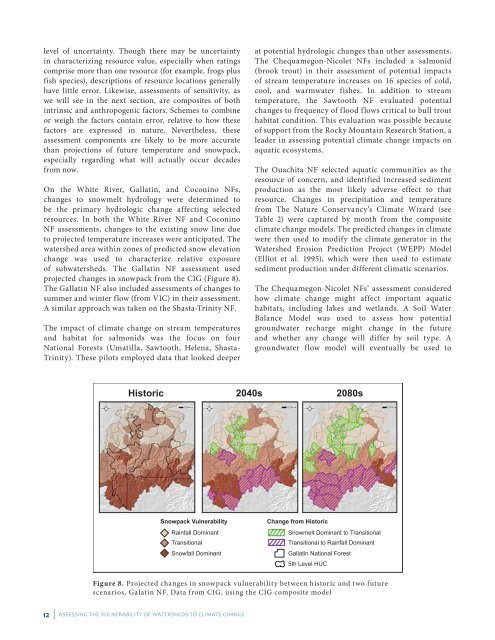
On the White River, Gallatin, and Coconino NFs,<br />
changes to snowmelt hydrology were determined to<br />
be the primary hydrologic change affecting selected<br />
resources. In both the White River NF and Coconino<br />
NF assessments, changes to the existing snow line due<br />
to projected temperature increases were anticipated. The<br />
watershed area within zones of predicted snow elevation<br />
change was used to characterize relative exposure<br />
of subwatersheds. The Gallatin NF assessment used<br />
projected changes in snowpack from the CIG (Figure 8).<br />
The Gallatin NF also included assessments of changes to<br />
summer and winter flow (from VIC) in their assessment.<br />
A similar approach was taken on the Shasta-Trinity NF.<br />
The impact of climate change on stream temperatures<br />
and habitat for salmonids was the focus on four<br />
National Forests (Umatilla, Sawtooth, Helena, Shasta-<br />
Trinity). These pilots employed data that looked deeper<br />
12 | ASSESSING THE VULNERABILITY OF WATERSHEDS TO CLIMATE CHANGE<br />
at potential hydrologic changes than other assessments.<br />
The Chequamegon-Nicolet NFs included a salmonid<br />
(brook trout) in their assessment of potential impacts<br />
of stream temperature increases on 16 species of cold,<br />
cool, and warmwater fishes. In addition to stream<br />
temperature, the Sawtooth NF evaluated potential<br />
changes to frequency of flood flows critical to bull trout<br />
habitat condition. This evaluation was possible because<br />
of support from the Rocky Mountain Research Station, a<br />
leader in assessing potential climate change impacts on<br />
aquatic ecosystems.<br />
The Ouachita NF selected aquatic communities as the<br />
resource of concern, and identified increased sediment<br />
production as the most likely adverse effect to that<br />
resource. Changes in precipitation and temperature<br />
from The Nature Conservancy’s Climate Wizard (see<br />
Table 2) were captured by month from the composite<br />
climate change models. The predicted changes in climate<br />
were then used to modify the climate generator in the<br />
Watershed Erosion Prediction Project (WEPP) Model<br />
(Elliot et al. 1995), which were then used to estimate<br />
sediment production under different climatic scenarios.<br />
The Chequamegon-Nicolet NFs’ assessment considered<br />
how climate change might affect important aquatic<br />
habitats, including lakes and wetlands. A Soil Water<br />
Balance Model was used to assess how potential<br />
groundwater recharge might change in the future<br />
and whether any change will differ by soil type. A<br />
groundwater flow model will eventually be used to<br />
Historic 2040s 2080s<br />
Snowpack Vulnerability<br />
Rainfall Dominant<br />
Transitional<br />
Snowfall Dominant<br />
Change from Historic<br />
Snowmelt Dominant to Transitional<br />
Transitional to Rainfall Dominant<br />
Gallatin National Forest<br />
5th Level HUC<br />
Figure 8. Projected changes in snowpack vulnerability between historic and two future<br />
scenarios, Galatin NF. Data from CIG, using the CIG composite model