watervulnerability
watervulnerability watervulnerability
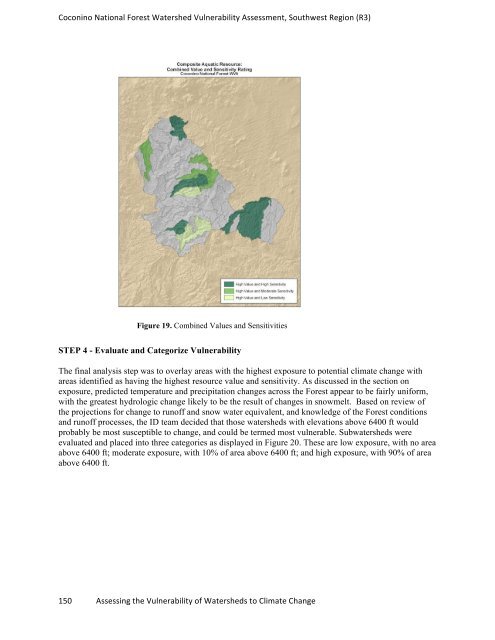
Coconino National Forest Watershed Vulnerability Assessment, Southwest Region (R3) Figure 19. Combined Values and Sensitivities STEP 4 - Evaluate and Categorize Vulnerability The final analysis step was to overlay areas with the highest exposure to potential climate change with areas identified as having the highest resource value and sensitivity. As discussed in the section on exposure, predicted temperature and precipitation changes across the Forest appear to be fairly uniform, with the greatest hydrologic change likely to be the result of changes in snowmelt. Based on review of the projections for change to runoff and snow water equivalent, and knowledge of the Forest conditions and runoff processes, the ID team decided that those watersheds with elevations above 6400 ft would probably be most susceptible to change, and could be termed most vulnerable. Subwatersheds were evaluated and placed into three categories as displayed in Figure 20. These are low exposure, with no area above 6400 ft; moderate exposure, with 10% of area above 6400 ft; and high exposure, with 90% of area above 6400 ft. 150 Assessing the Vulnerability of Watersheds to Climate Change
Coconino National Forest Watershed Vulnerability Assessment, Southwest Region (R3) Figure 20. Relative exposure to potential climate change effects, based on % of subwatershed above 6400 ft Once exposure was categorized, this rating was combined with the assessment of sensitivity and value, to produce a relative assessment of vulnerability for each resource, and for the combined resources. The vulnerability ratings for stream habitat and for all resources combined are displayed in Figures 21 and 22. Results for all resources are available at www.fs.fed.us/ccrc/wva/appendixes. Both examples reflect highest exposure at elevations above 6400 ft. Subwatersheds in the East Clear Creek drainage are consistently rated highly vulnerable, due to the combination of elevation, relatively high sensitivities, and high combined resource values. High values are associated with water uses (C.C. Cragen Reservoir) the presence of warm water fish species, and relatively high amounts of stream habitat. Pumphouse Wash in the Oak Creek watershed is the other subwatershed that displays the highest vulnerability. 151 Assessing the Vulnerability of Watersheds to Climate Change
- Page 104 and 105: Grand Mesa, Uncompahgre and Gunniso
- Page 106 and 107: Grand Mesa, Uncompahgre and Gunniso
- Page 108 and 109: Grand Mesa, Uncompahgre and Gunniso
- Page 110 and 111: Grand Mesa, Uncompahgre and Gunniso
- Page 112 and 113: Grand Mesa, Uncompahgre and Gunniso
- Page 114 and 115: Grand Mesa, Uncompahgre and Gunniso
- Page 116 and 117: Assessment of Watershed Vulnerabili
- Page 118 and 119: White River National Forest Watersh
- Page 120 and 121: White River National Forest Watersh
- Page 122 and 123: White River National Forest Watersh
- Page 124 and 125: White River National Forest Watersh
- Page 126 and 127: White River National Forest Watersh
- Page 128 and 129: White River National Forest Watersh
- Page 130 and 131: White River National Forest Watersh
- Page 132 and 133: White River National Forest Watersh
- Page 134 and 135: Assessment of Watershed Vulnerabili
- Page 136 and 137: Coconino National Forest Watershed
- Page 138 and 139: Coconino National Forest Watershed
- Page 140 and 141: Coconino National Forest Watershed
- Page 142 and 143: Coconino National Forest Watershed
- Page 144 and 145: Coconino National Forest Watershed
- Page 146 and 147: Coconino National Forest Watershed
- Page 148 and 149: Coconino National Forest Watershed
- Page 150 and 151: Coconino National Forest Watershed
- Page 152 and 153: Coconino National Forest Watershed
- Page 156 and 157: Coconino National Forest Watershed
- Page 158 and 159: Coconino National Forest Watershed
- Page 160 and 161: Coconino National Forest Watershed
- Page 162 and 163: Coconino National Forest Watershed
- Page 164 and 165: Sawtooth National Forest Watershed
- Page 166 and 167: Sawtooth National Forest Watershed
- Page 168 and 169: Sawtooth National Forest Watershed
- Page 170 and 171: Sawtooth National Forest Watershed
- Page 172 and 173: Sawtooth National Forest Watershed
- Page 174 and 175: Sawtooth National Forest Watershed
- Page 176 and 177: Sawtooth National Forest Watershed
- Page 178 and 179: Sawtooth National Forest Watershed
- Page 180 and 181: Sawtooth National Forest Watershed
- Page 182 and 183: Sawtooth National Forest Watershed
- Page 184 and 185: Sawtooth National Forest Watershed
- Page 186 and 187: Sawtooth National Forest Watershed
- Page 188 and 189: Sawtooth National Forest Watershed
- Page 190 and 191: Shasta Trinity National Forest Wate
- Page 192 and 193: Shasta Trinity National Forest Wate
- Page 194 and 195: Shasta Trinity National Forest Wate
- Page 196 and 197: Shasta Trinity National Forest Wate
- Page 198 and 199: Shasta Trinity National Forest Wate
- Page 200 and 201: Shasta Trinity National Forest Wate
- Page 202 and 203: Shasta Trinity National Forest Wate
Coconino National Forest Watershed Vulnerability Assessment, Southwest Region (R3)<br />
Figure 19. Combined Values and Sensitivities<br />
STEP 4 - Evaluate and Categorize Vulnerability<br />
The final analysis step was to overlay areas with the highest exposure to potential climate change with<br />
areas identified as having the highest resource value and sensitivity. As discussed in the section on<br />
exposure, predicted temperature and precipitation changes across the Forest appear to be fairly uniform,<br />
with the greatest hydrologic change likely to be the result of changes in snowmelt. Based on review of<br />
the projections for change to runoff and snow water equivalent, and knowledge of the Forest conditions<br />
and runoff processes, the ID team decided that those watersheds with elevations above 6400 ft would<br />
probably be most susceptible to change, and could be termed most vulnerable. Subwatersheds were<br />
evaluated and placed into three categories as displayed in Figure 20. These are low exposure, with no area<br />
above 6400 ft; moderate exposure, with 10% of area above 6400 ft; and high exposure, with 90% of area<br />
above 6400 ft.<br />
150 Assessing the Vulnerability of Watersheds to Climate Change


