watervulnerability
watervulnerability watervulnerability
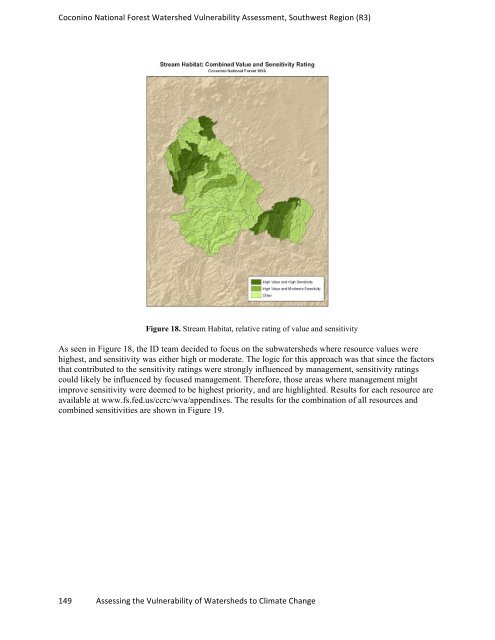
Coconino National Forest Watershed Vulnerability Assessment, Southwest Region (R3) Figure 17. Relative watershed sensitivities for Stream Habitat Data sources for each sensitivity factor are listed in Table 5. The Watershed Condition Assessment provided much of these data. Other data sources were the Forest records, GIS, and professional judgment. To assess how the location of highly-valued resources related to watershed sensitivities, maps were created that combined these two factors. An example (for stream habitat) is displayed as Figure 18. 148 Assessing the Vulnerability of Watersheds to Climate Change
Coconino National Forest Watershed Vulnerability Assessment, Southwest Region (R3) Figure 18. Stream Habitat, relative rating of value and sensitivity As seen in Figure 18, the ID team decided to focus on the subwatersheds where resource values were highest, and sensitivity was either high or moderate. The logic for this approach was that since the factors that contributed to the sensitivity ratings were strongly influenced by management, sensitivity ratings could likely be influenced by focused management. Therefore, those areas where management might improve sensitivity were deemed to be highest priority, and are highlighted. Results for each resource are available at www.fs.fed.us/ccrc/wva/appendixes. The results for the combination of all resources and combined sensitivities are shown in Figure 19. 149 Assessing the Vulnerability of Watersheds to Climate Change
- Page 102 and 103: Grand Mesa, Uncompahgre and Gunniso
- Page 104 and 105: Grand Mesa, Uncompahgre and Gunniso
- Page 106 and 107: Grand Mesa, Uncompahgre and Gunniso
- Page 108 and 109: Grand Mesa, Uncompahgre and Gunniso
- Page 110 and 111: Grand Mesa, Uncompahgre and Gunniso
- Page 112 and 113: Grand Mesa, Uncompahgre and Gunniso
- Page 114 and 115: Grand Mesa, Uncompahgre and Gunniso
- Page 116 and 117: Assessment of Watershed Vulnerabili
- Page 118 and 119: White River National Forest Watersh
- Page 120 and 121: White River National Forest Watersh
- Page 122 and 123: White River National Forest Watersh
- Page 124 and 125: White River National Forest Watersh
- Page 126 and 127: White River National Forest Watersh
- Page 128 and 129: White River National Forest Watersh
- Page 130 and 131: White River National Forest Watersh
- Page 132 and 133: White River National Forest Watersh
- Page 134 and 135: Assessment of Watershed Vulnerabili
- Page 136 and 137: Coconino National Forest Watershed
- Page 138 and 139: Coconino National Forest Watershed
- Page 140 and 141: Coconino National Forest Watershed
- Page 142 and 143: Coconino National Forest Watershed
- Page 144 and 145: Coconino National Forest Watershed
- Page 146 and 147: Coconino National Forest Watershed
- Page 148 and 149: Coconino National Forest Watershed
- Page 150 and 151: Coconino National Forest Watershed
- Page 154 and 155: Coconino National Forest Watershed
- Page 156 and 157: Coconino National Forest Watershed
- Page 158 and 159: Coconino National Forest Watershed
- Page 160 and 161: Coconino National Forest Watershed
- Page 162 and 163: Coconino National Forest Watershed
- Page 164 and 165: Sawtooth National Forest Watershed
- Page 166 and 167: Sawtooth National Forest Watershed
- Page 168 and 169: Sawtooth National Forest Watershed
- Page 170 and 171: Sawtooth National Forest Watershed
- Page 172 and 173: Sawtooth National Forest Watershed
- Page 174 and 175: Sawtooth National Forest Watershed
- Page 176 and 177: Sawtooth National Forest Watershed
- Page 178 and 179: Sawtooth National Forest Watershed
- Page 180 and 181: Sawtooth National Forest Watershed
- Page 182 and 183: Sawtooth National Forest Watershed
- Page 184 and 185: Sawtooth National Forest Watershed
- Page 186 and 187: Sawtooth National Forest Watershed
- Page 188 and 189: Sawtooth National Forest Watershed
- Page 190 and 191: Shasta Trinity National Forest Wate
- Page 192 and 193: Shasta Trinity National Forest Wate
- Page 194 and 195: Shasta Trinity National Forest Wate
- Page 196 and 197: Shasta Trinity National Forest Wate
- Page 198 and 199: Shasta Trinity National Forest Wate
- Page 200 and 201: Shasta Trinity National Forest Wate
Coconino National Forest Watershed Vulnerability Assessment, Southwest Region (R3)<br />
Figure 18. Stream Habitat, relative rating of value and sensitivity<br />
As seen in Figure 18, the ID team decided to focus on the subwatersheds where resource values were<br />
highest, and sensitivity was either high or moderate. The logic for this approach was that since the factors<br />
that contributed to the sensitivity ratings were strongly influenced by management, sensitivity ratings<br />
could likely be influenced by focused management. Therefore, those areas where management might<br />
improve sensitivity were deemed to be highest priority, and are highlighted. Results for each resource are<br />
available at www.fs.fed.us/ccrc/wva/appendixes. The results for the combination of all resources and<br />
combined sensitivities are shown in Figure 19.<br />
149 Assessing the Vulnerability of Watersheds to Climate Change


