

watervulnerability
watervulnerability
watervulnerability

Create successful ePaper yourself
Turn your PDF publications into a flip-book with our unique Google optimized e-Paper software.
etween exposure and water resources, the evaluation<br />
served to stimulate thinking about which watershed<br />
characteristics might influence (either moderate or<br />
exacerbate) the hydrologic response to climate change,<br />
providing a segue to evaluating watershed sensitivity.<br />
An example of this type of analysis, which tracks<br />
climate changes through hydrologic responses to<br />
potential impacts on water resources from the Helena<br />
NF, is provided in Table 3.<br />
Applying Exposure Projections<br />
Once the hydrologic processes important to selected<br />
water resource values were identified, exposure metrics<br />
closely linked to those processes were identified.<br />
The list of metrics used to characterize exposure was<br />
limited because of the commonality in water resources<br />
in the assessments (Table 4). The selection of exposure<br />
metrics differed among National Forests for three<br />
reasons. The first is the water resources themselves.<br />
The Chequamegon-Nicolet was the only pilot Forest to<br />
include assessment of changes to groundwater recharge,<br />
and the only pilot Forest to use soil-water balance as<br />
an exposure metric. The second difference in selecting<br />
metrics was data availability. Both the Sawtooth NF and<br />
Umatilla NF assessments included finer-scaled analysis<br />
of potential changes to water temperature in evaluating<br />
change to bull trout habitat. These analyses were possible<br />
because of the availability of stream temperature<br />
data and predictive models, and the support of the<br />
Rocky Mountain Research Station (RMRS). The third<br />
difference in exposure metrics was the level of analysis.<br />
Differences in the depth of analysis were partly the<br />
result of data availability, as in the example described<br />
above. But the amount of time team leads could devote<br />
to the assessment was also a factor. Available time and<br />
perceived need for detailed analysis were practical<br />
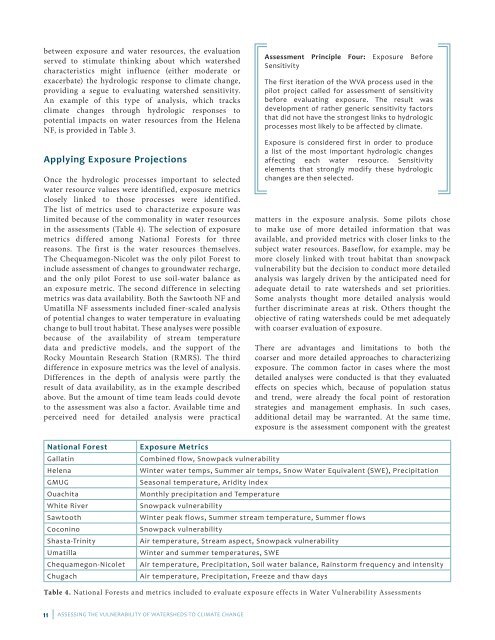
National Forest Exposure Metrics<br />
Gallatin Combined flow, Snowpack vulnerability<br />
Helena Winter water temps, Summer air temps, Snow Water Equivalent (SWE), Precipitation<br />
GMUG Seasonal temperature, Aridity index<br />
Ouachita Monthly precipitation and Temperature<br />
White River Snowpack vulnerability<br />
Sawtooth Winter peak flows, Summer stream temperature, Summer flows<br />
Coconino Snowpack vulnerability<br />
Shasta-Trinity Air temperature, Stream aspect, Snowpack vulnerability<br />
Umatilla Winter and summer temperatures, SWE<br />
Chequamegon-Nicolet Air temperature, Precipitation, Soil water balance, Rainstorm frequency and intensity<br />
Chugach Air temperature, Precipitation, Freeze and thaw days<br />
Table 4. National Forests and metrics included to evaluate exposure effects in Water Vulnerability Assessments<br />
11 | ASSESSING THE VULNERABILITY OF WATERSHEDS TO CLIMATE CHANGE<br />
Assessment Principle Four: Exposure Before<br />
Sensitivity<br />
The first iteration of the WVA process used in the<br />
pilot project called for assessment of sensitivity<br />
before evaluating exposure. The result was<br />
development of rather generic sensitivity factors<br />
that did not have the strongest links to hydrologic<br />
processes most likely to be affected by climate.<br />
Exposure is considered first in order to produce<br />
a list of the most important hydrologic changes<br />
affecting each water resource. Sensitivity<br />
elements that strongly modify these hydrologic<br />
changes are then selected.<br />
matters in the exposure analysis. Some pilots chose<br />
to make use of more detailed information that was<br />
available, and provided metrics with closer links to the<br />
subject water resources. Baseflow, for example, may be<br />
more closely linked with trout habitat than snowpack<br />
vulnerability but the decision to conduct more detailed<br />
analysis was largely driven by the anticipated need for<br />
adequate detail to rate watersheds and set priorities.<br />
Some analysts thought more detailed analysis would<br />
further discriminate areas at risk. Others thought the<br />
objective of rating watersheds could be met adequately<br />
with coarser evaluation of exposure.<br />
There are advantages and limitations to both the<br />
coarser and more detailed approaches to characterizing<br />
exposure. The common factor in cases where the most<br />
detailed analyses were conducted is that they evaluated<br />
effects on species which, because of population status<br />
and trend, were already the focal point of restoration<br />
strategies and management emphasis. In such cases,<br />
additional detail may be warranted. At the same time,<br />
exposure is the assessment component with the greatest