watervulnerability
watervulnerability watervulnerability
Coconino National Forest Watershed Vulnerability Assessment, Southwest Region (R3) The CIG applied the Variable Infiltration Capacity (VIC) (Liang et al. 1994) model to their modeled changes in temperature and precipitation, to predict changes to different hydrologic characteristics. Of most interest to the ID team were changes to snow, and runoff (Figures 14-15). Predictions again show fairly uniform changes across the forest, but with more change at higher elevations. This is logical, as this is where the most snow currently falls. If temperatures increase, a decrease in snow could be expected, with resultant changes in runoff timing and amount. Figures 14 and 15. Left, Predicted changes in Snow Water Equivalent (mm) between modeled historic and modeled conditions in 2070, based on the CIG composite model. Right, Predicted changes in runoff (mm/acre) between modeled historic and modeled conditions in 2030, based on the CIG composite model. The CIG composite model predicts almost no change in the annual precipitation, but does predict changes in the timing, with less precipitation falling in the spring, and more delivered by monsoons in the fall. Results of this modeling are shown in Table 4, and are averages for all the watersheds in the analysis area. Month Historic 2030 2030 2080 2080 January 2.4 2.5 0.1 2.3 -0.2 February 2.4 2.5 0.1 2.5 0.2 March 2.4 2.0 -0.4 1.9 -0.5 April 1.4 1.1 -0.3 0.9 -0.5 May 0.6 0.4 -0.2 0.3 -0.2 June 0.4 0.4 0.0 0.4 0.0 July 2.3 2.3 0.1 2.8 0.6 August 3.1 3.3 0.2 3.9 0.8 September 1.9 2.5 0.6 2.6 0.8 October 1.6 2.0 0.4 2.1 0.5 November 1.6 1.5 -0.1 1.3 -0.3 December 2.4 2.2 -0.2 2.3 -0.1 144 Assessing the Vulnerability of Watersheds to Climate Change
Coconino National Forest Watershed Vulnerability Assessment, Southwest Region (R3) Annual 22.5 22.8 0.4 23.4 0.9 Table 4. Modeled precipitation (inches) and predicted changes from historic, by month for the Coconino NF analysis area The team also considered modeling conducted by Rajagupal (Rajagupal et al. 2010) in his assessment of hydrologic change in the Black and Verde Rivers. This analysis included the entire WVA area, with the exception of the Upper Clear Creek (East Clear Creek) watershed. The selection of these models was based on a “best fit” comparison of all available models with historic temperature and precipitation records that was completed by Dominguez et al. (2009). Some of their results are displayed in Figure 16, and show a fairly substantial decrease in spring runoff for all future projections, with a slight increase in fall flows. Figure 16. Simulated annual hydrograph for the Salt and Verde Rivers, based on VIC modeling. Periods1:2009- 2038; 2:2039-2068; and 3:2069-2098. Hydrologic Changes of Concern The Forest team considered the potential changes as indicated by the CIG and Rajagupal modeling, and considered how these potential changes might impact the selected aquatic resources. The following is a brief summary of those considerations for each water resource value. Herpetiles • Less spring precipitation and runoff could result in drying of springs wetland habitats such that habitats might not persist through the summer, resulting in reduced populations or loss of species. • Dispersal might be improved in fall (more water). Warm Water Species • Natives spawn in spring triggered by snowmelt hydrograph, spawning success may be reduced. 145 Assessing the Vulnerability of Watersheds to Climate Change
- Page 98 and 99: Grand Mesa, Uncompahgre and Gunniso
- Page 100 and 101: Grand Mesa, Uncompahgre and Gunniso
- Page 102 and 103: Grand Mesa, Uncompahgre and Gunniso
- Page 104 and 105: Grand Mesa, Uncompahgre and Gunniso
- Page 106 and 107: Grand Mesa, Uncompahgre and Gunniso
- Page 108 and 109: Grand Mesa, Uncompahgre and Gunniso
- Page 110 and 111: Grand Mesa, Uncompahgre and Gunniso
- Page 112 and 113: Grand Mesa, Uncompahgre and Gunniso
- Page 114 and 115: Grand Mesa, Uncompahgre and Gunniso
- Page 116 and 117: Assessment of Watershed Vulnerabili
- Page 118 and 119: White River National Forest Watersh
- Page 120 and 121: White River National Forest Watersh
- Page 122 and 123: White River National Forest Watersh
- Page 124 and 125: White River National Forest Watersh
- Page 126 and 127: White River National Forest Watersh
- Page 128 and 129: White River National Forest Watersh
- Page 130 and 131: White River National Forest Watersh
- Page 132 and 133: White River National Forest Watersh
- Page 134 and 135: Assessment of Watershed Vulnerabili
- Page 136 and 137: Coconino National Forest Watershed
- Page 138 and 139: Coconino National Forest Watershed
- Page 140 and 141: Coconino National Forest Watershed
- Page 142 and 143: Coconino National Forest Watershed
- Page 144 and 145: Coconino National Forest Watershed
- Page 146 and 147: Coconino National Forest Watershed
- Page 150 and 151: Coconino National Forest Watershed
- Page 152 and 153: Coconino National Forest Watershed
- Page 154 and 155: Coconino National Forest Watershed
- Page 156 and 157: Coconino National Forest Watershed
- Page 158 and 159: Coconino National Forest Watershed
- Page 160 and 161: Coconino National Forest Watershed
- Page 162 and 163: Coconino National Forest Watershed
- Page 164 and 165: Sawtooth National Forest Watershed
- Page 166 and 167: Sawtooth National Forest Watershed
- Page 168 and 169: Sawtooth National Forest Watershed
- Page 170 and 171: Sawtooth National Forest Watershed
- Page 172 and 173: Sawtooth National Forest Watershed
- Page 174 and 175: Sawtooth National Forest Watershed
- Page 176 and 177: Sawtooth National Forest Watershed
- Page 178 and 179: Sawtooth National Forest Watershed
- Page 180 and 181: Sawtooth National Forest Watershed
- Page 182 and 183: Sawtooth National Forest Watershed
- Page 184 and 185: Sawtooth National Forest Watershed
- Page 186 and 187: Sawtooth National Forest Watershed
- Page 188 and 189: Sawtooth National Forest Watershed
- Page 190 and 191: Shasta Trinity National Forest Wate
- Page 192 and 193: Shasta Trinity National Forest Wate
- Page 194 and 195: Shasta Trinity National Forest Wate
- Page 196 and 197: Shasta Trinity National Forest Wate
Coconino National Forest Watershed Vulnerability Assessment, Southwest Region (R3)<br />
Annual 22.5 22.8 0.4 23.4 0.9<br />
Table 4. Modeled precipitation (inches) and predicted changes from historic, by month for the Coconino<br />
NF analysis area<br />
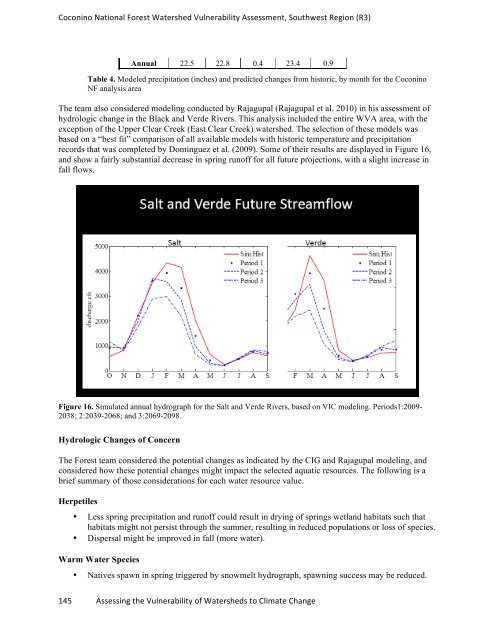
The team also considered modeling conducted by Rajagupal (Rajagupal et al. 2010) in his assessment of<br />
hydrologic change in the Black and Verde Rivers. This analysis included the entire WVA area, with the<br />
exception of the Upper Clear Creek (East Clear Creek) watershed. The selection of these models was<br />
based on a “best fit” comparison of all available models with historic temperature and precipitation<br />
records that was completed by Dominguez et al. (2009). Some of their results are displayed in Figure 16,<br />
and show a fairly substantial decrease in spring runoff for all future projections, with a slight increase in<br />
fall flows.<br />
Figure 16. Simulated annual hydrograph for the Salt and Verde Rivers, based on VIC modeling. Periods1:2009-<br />
2038; 2:2039-2068; and 3:2069-2098.<br />
Hydrologic Changes of Concern<br />
The Forest team considered the potential changes as indicated by the CIG and Rajagupal modeling, and<br />
considered how these potential changes might impact the selected aquatic resources. The following is a<br />
brief summary of those considerations for each water resource value.<br />
Herpetiles<br />
• Less spring precipitation and runoff could result in drying of springs wetland habitats such that<br />
habitats might not persist through the summer, resulting in reduced populations or loss of species.<br />
• Dispersal might be improved in fall (more water).<br />
Warm Water Species<br />
• Natives spawn in spring triggered by snowmelt hydrograph, spawning success may be reduced.<br />
145 Assessing the Vulnerability of Watersheds to Climate Change


