watervulnerability
watervulnerability watervulnerability
Coconino National Forest Watershed Vulnerability Assessment, Southwest Region (R3) It should be noted that the ID team questioned the accuracy of the stream spring layer because it only includes about 200 springs and there are at least 100-150 more known springs not digitized in the forest GIS. Additional spring data were obtained from Northern Arizona University (NAU). NAU and other studies have identified at least 100-150 more springs located in the fifth-field watersheds included in this assessment. Results of the riparian spring ratings are shown in Figure 8. Perennial Stream Habitat As mentioned earlier, perennial stream habitat on the CNF is relatively uncommon, and supports a wide variety of environmental and human uses. Initially, streams were combined with riparian and spring habitat, but further consideration by the ID team resulted in the decision to look at the perennial stream resource by itself. The team felt that the data for perennial streams were slightly better than that for either riparian habitat or springs, and that the existing and future demands on the perennial stream resource justified the switch. Miles of stream were calculated for each subwatershed. The results, displayed in Figure 9, reflect ratings based on ranking of the subwatersheds by miles of stream and then grouping them into thirds. The break for these groupings is less than 16 miles for low, and greater than 27 miles for a high rating. Figure 9. Relative values of subwatershed for perennial stream habitat 140 Assessing the Vulnerability of Watersheds to Climate Change
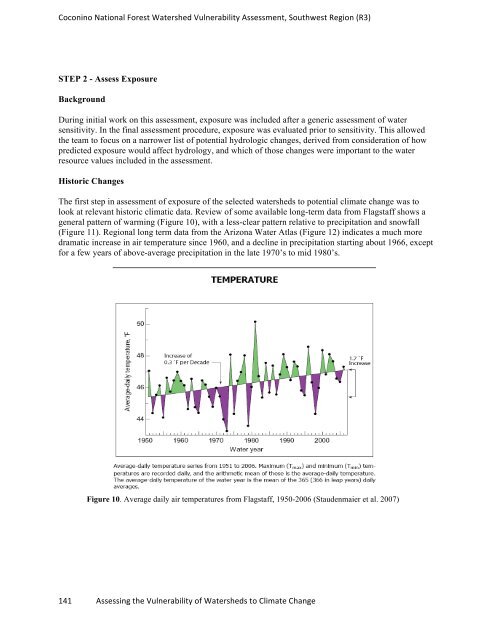
Coconino National Forest Watershed Vulnerability Assessment, Southwest Region (R3) STEP 2 - Assess Exposure Background During initial work on this assessment, exposure was included after a generic assessment of water sensitivity. In the final assessment procedure, exposure was evaluated prior to sensitivity. This allowed the team to focus on a narrower list of potential hydrologic changes, derived from consideration of how predicted exposure would affect hydrology, and which of those changes were important to the water resource values included in the assessment. Historic Changes The first step in assessment of exposure of the selected watersheds to potential climate change was to look at relevant historic climatic data. Review of some available long-term data from Flagstaff shows a general pattern of warming (Figure 10), with a less-clear pattern relative to precipitation and snowfall (Figure 11). Regional long term data from the Arizona Water Atlas (Figure 12) indicates a much more dramatic increase in air temperature since 1960, and a decline in precipitation starting about 1966, except for a few years of above-average precipitation in the late 1970’s to mid 1980’s. Figure 10. Average daily air temperatures from Flagstaff, 1950-2006 (Staudenmaier et al. 2007) 141 Assessing the Vulnerability of Watersheds to Climate Change
- Page 94 and 95: Grand Mesa, Uncompahgre and Gunniso
- Page 96 and 97: Grand Mesa, Uncompahgre and Gunniso
- Page 98 and 99: Grand Mesa, Uncompahgre and Gunniso
- Page 100 and 101: Grand Mesa, Uncompahgre and Gunniso
- Page 102 and 103: Grand Mesa, Uncompahgre and Gunniso
- Page 104 and 105: Grand Mesa, Uncompahgre and Gunniso
- Page 106 and 107: Grand Mesa, Uncompahgre and Gunniso
- Page 108 and 109: Grand Mesa, Uncompahgre and Gunniso
- Page 110 and 111: Grand Mesa, Uncompahgre and Gunniso
- Page 112 and 113: Grand Mesa, Uncompahgre and Gunniso
- Page 114 and 115: Grand Mesa, Uncompahgre and Gunniso
- Page 116 and 117: Assessment of Watershed Vulnerabili
- Page 118 and 119: White River National Forest Watersh
- Page 120 and 121: White River National Forest Watersh
- Page 122 and 123: White River National Forest Watersh
- Page 124 and 125: White River National Forest Watersh
- Page 126 and 127: White River National Forest Watersh
- Page 128 and 129: White River National Forest Watersh
- Page 130 and 131: White River National Forest Watersh
- Page 132 and 133: White River National Forest Watersh
- Page 134 and 135: Assessment of Watershed Vulnerabili
- Page 136 and 137: Coconino National Forest Watershed
- Page 138 and 139: Coconino National Forest Watershed
- Page 140 and 141: Coconino National Forest Watershed
- Page 142 and 143: Coconino National Forest Watershed
- Page 146 and 147: Coconino National Forest Watershed
- Page 148 and 149: Coconino National Forest Watershed
- Page 150 and 151: Coconino National Forest Watershed
- Page 152 and 153: Coconino National Forest Watershed
- Page 154 and 155: Coconino National Forest Watershed
- Page 156 and 157: Coconino National Forest Watershed
- Page 158 and 159: Coconino National Forest Watershed
- Page 160 and 161: Coconino National Forest Watershed
- Page 162 and 163: Coconino National Forest Watershed
- Page 164 and 165: Sawtooth National Forest Watershed
- Page 166 and 167: Sawtooth National Forest Watershed
- Page 168 and 169: Sawtooth National Forest Watershed
- Page 170 and 171: Sawtooth National Forest Watershed
- Page 172 and 173: Sawtooth National Forest Watershed
- Page 174 and 175: Sawtooth National Forest Watershed
- Page 176 and 177: Sawtooth National Forest Watershed
- Page 178 and 179: Sawtooth National Forest Watershed
- Page 180 and 181: Sawtooth National Forest Watershed
- Page 182 and 183: Sawtooth National Forest Watershed
- Page 184 and 185: Sawtooth National Forest Watershed
- Page 186 and 187: Sawtooth National Forest Watershed
- Page 188 and 189: Sawtooth National Forest Watershed
- Page 190 and 191: Shasta Trinity National Forest Wate
- Page 192 and 193: Shasta Trinity National Forest Wate
Coconino National Forest Watershed Vulnerability Assessment, Southwest Region (R3)<br />
STEP 2 - Assess Exposure<br />
Background<br />
During initial work on this assessment, exposure was included after a generic assessment of water<br />
sensitivity. In the final assessment procedure, exposure was evaluated prior to sensitivity. This allowed<br />
the team to focus on a narrower list of potential hydrologic changes, derived from consideration of how<br />
predicted exposure would affect hydrology, and which of those changes were important to the water<br />
resource values included in the assessment.<br />
Historic Changes<br />
The first step in assessment of exposure of the selected watersheds to potential climate change was to<br />
look at relevant historic climatic data. Review of some available long-term data from Flagstaff shows a<br />
general pattern of warming (Figure 10), with a less-clear pattern relative to precipitation and snowfall<br />
(Figure 11). Regional long term data from the Arizona Water Atlas (Figure 12) indicates a much more<br />
dramatic increase in air temperature since 1960, and a decline in precipitation starting about 1966, except<br />
for a few years of above-average precipitation in the late 1970’s to mid 1980’s.<br />
Figure 10. Average daily air temperatures from Flagstaff, 1950-2006 (Staudenmaier et al. 2007)<br />
141 Assessing the Vulnerability of Watersheds to Climate Change


