

watervulnerability
watervulnerability
watervulnerability

You also want an ePaper? Increase the reach of your titles
YUMPU automatically turns print PDFs into web optimized ePapers that Google loves.
NF (Region 8) relied on information from The Nature<br />
Conservancy’s Climate Change Wizard (Table 2). The<br />
Chequamegon-Nicolet NF (Region 9) employed data<br />
from WICCI, and the Chugach NF (Region 10) utilized<br />
projections provided by the University of Alaska,<br />
Fairbanks (UAF) Scenarios Network for Alaska Planning<br />
Project (Figure 7).<br />
All the pilot assessments used air temperature change<br />
projections in their analyses and most pilots included<br />
projected changes to precipitation. These projections<br />
were obtained from the variety of publically available<br />
state or regional climate sources listed above. All<br />
projections of future climate are based on General<br />
Circulation Models (GCM). These models are<br />
mathematical representations of atmospheric and<br />
oceanic motion, physics, and chemistry, and employ<br />
different emission scenarios to yield predictions of<br />
temperature and precipitation change. The globalscale<br />
model outputs are very coarse, so data are<br />
often downscaled and used as inputs to macro-scale<br />
hydrologic models for use in regional and finer scale<br />
analysis, such as the WVA pilots. The accuracy of the<br />
data becomes more uncertain with each subsequent layer<br />
of modeling. The greatest certainty is associated with<br />
air temperature projections. Precipitation projections<br />
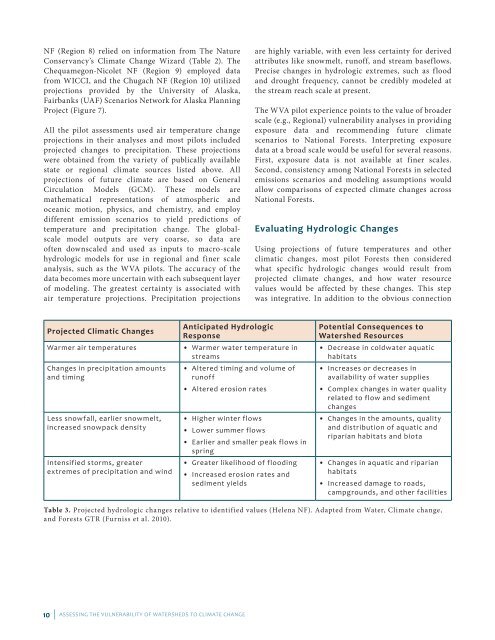
Projected Climatic Changes<br />
Anticipated Hydrologic<br />
Response<br />
Warmer air temperatures • Warmer water temperature in<br />
streams<br />
Changes in precipitation amounts<br />
and timing<br />
Less snowfall, earlier snowmelt,<br />
increased snowpack density<br />
Intensified storms, greater<br />
extremes of precipitation and wind<br />
• Altered timing and volume of<br />
runoff<br />
• Altered erosion rates<br />
• Higher winter flows<br />
• Lower summer flows<br />
• Earlier and smaller peak flows in<br />
spring<br />
• Greater likelihood of flooding<br />
• Increased erosion rates and<br />
sediment yields<br />
10 | ASSESSING THE VULNERABILITY OF WATERSHEDS TO CLIMATE CHANGE<br />
are highly variable, with even less certainty for derived<br />
attributes like snowmelt, runoff, and stream baseflows.<br />
Precise changes in hydrologic extremes, such as flood<br />
and drought frequency, cannot be credibly modeled at<br />
the stream reach scale at present.<br />
The WVA pilot experience points to the value of broader<br />
scale (e.g., Regional) vulnerability analyses in providing<br />
exposure data and recommending future climate<br />
scenarios to National Forests. Interpreting exposure<br />
data at a broad scale would be useful for several reasons.<br />
First, exposure data is not available at finer scales.<br />
Second, consistency among National Forests in selected<br />
emissions scenarios and modeling assumptions would<br />
allow comparisons of expected climate changes across<br />
National Forests.<br />
Evaluating Hydrologic Changes<br />
Using projections of future temperatures and other<br />
climatic changes, most pilot Forests then considered<br />
what specific hydrologic changes would result from<br />
projected climate changes, and how water resource<br />
values would be affected by these changes. This step<br />
was integrative. In addition to the obvious connection<br />
Potential Consequences to<br />
Watershed Resources<br />
• Decrease in coldwater aquatic<br />
habitats<br />
• Increases or decreases in<br />
availability of water supplies<br />
• Complex changes in water quality<br />
related to flow and sediment<br />
changes<br />
• Changes in the amounts, quality<br />
and distribution of aquatic and<br />
riparian habitats and biota<br />
• Changes in aquatic and riparian<br />
habitats<br />
• Increased damage to roads,<br />
campgrounds, and other facilities<br />
Table 3. Projected hydrologic changes relative to identified values (Helena NF). Adapted from Water, Climate change,<br />
and Forests GTR (Furniss et al. 2010).