watervulnerability
watervulnerability watervulnerability
White River National Forest Watershed Vulnerability Assessment, Rocky Mountain Region (R2) Figure 7. Climate change vulnerability rating for the Aquatic Habitat resource value. Red shading depicts subwatersheds with the highest vulnerability. Cutthroat trout and boreal toad populations are shown as green lines and green dots, respectively. 124 Assessing the Vulnerability of Watersheds to Climate Change
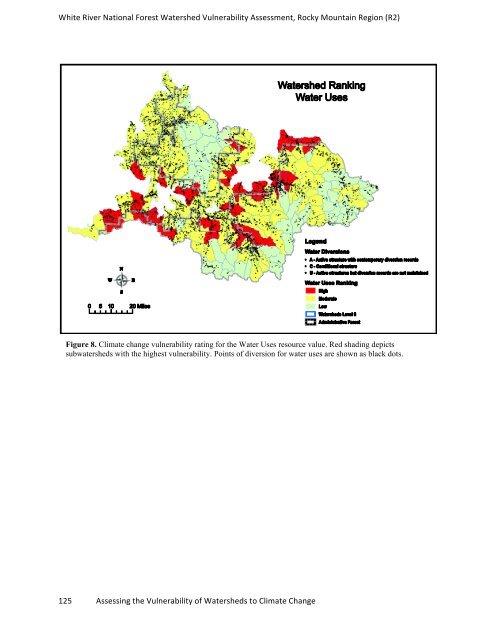
White River National Forest Watershed Vulnerability Assessment, Rocky Mountain Region (R2) Figure 8. Climate change vulnerability rating for the Water Uses resource value. Red shading depicts subwatersheds with the highest vulnerability. Points of diversion for water uses are shown as black dots. 125 Assessing the Vulnerability of Watersheds to Climate Change
- Page 78 and 79: Grand Mesa, Uncompahgre and Gunniso
- Page 80 and 81: Grand Mesa, Uncompahgre and Gunniso
- Page 82 and 83: Grand Mesa, Uncompahgre and Gunniso
- Page 84 and 85: Grand Mesa, Uncompahgre and Gunniso
- Page 86 and 87: Grand Mesa, Uncompahgre and Gunniso
- Page 88 and 89: Grand Mesa, Uncompahgre and Gunniso
- Page 90 and 91: Grand Mesa, Uncompahgre and Gunniso
- Page 92 and 93: Grand Mesa, Uncompahgre and Gunniso
- Page 94 and 95: Grand Mesa, Uncompahgre and Gunniso
- Page 96 and 97: Grand Mesa, Uncompahgre and Gunniso
- Page 98 and 99: Grand Mesa, Uncompahgre and Gunniso
- Page 100 and 101: Grand Mesa, Uncompahgre and Gunniso
- Page 102 and 103: Grand Mesa, Uncompahgre and Gunniso
- Page 104 and 105: Grand Mesa, Uncompahgre and Gunniso
- Page 106 and 107: Grand Mesa, Uncompahgre and Gunniso
- Page 108 and 109: Grand Mesa, Uncompahgre and Gunniso
- Page 110 and 111: Grand Mesa, Uncompahgre and Gunniso
- Page 112 and 113: Grand Mesa, Uncompahgre and Gunniso
- Page 114 and 115: Grand Mesa, Uncompahgre and Gunniso
- Page 116 and 117: Assessment of Watershed Vulnerabili
- Page 118 and 119: White River National Forest Watersh
- Page 120 and 121: White River National Forest Watersh
- Page 122 and 123: White River National Forest Watersh
- Page 124 and 125: White River National Forest Watersh
- Page 126 and 127: White River National Forest Watersh
- Page 130 and 131: White River National Forest Watersh
- Page 132 and 133: White River National Forest Watersh
- Page 134 and 135: Assessment of Watershed Vulnerabili
- Page 136 and 137: Coconino National Forest Watershed
- Page 138 and 139: Coconino National Forest Watershed
- Page 140 and 141: Coconino National Forest Watershed
- Page 142 and 143: Coconino National Forest Watershed
- Page 144 and 145: Coconino National Forest Watershed
- Page 146 and 147: Coconino National Forest Watershed
- Page 148 and 149: Coconino National Forest Watershed
- Page 150 and 151: Coconino National Forest Watershed
- Page 152 and 153: Coconino National Forest Watershed
- Page 154 and 155: Coconino National Forest Watershed
- Page 156 and 157: Coconino National Forest Watershed
- Page 158 and 159: Coconino National Forest Watershed
- Page 160 and 161: Coconino National Forest Watershed
- Page 162 and 163: Coconino National Forest Watershed
- Page 164 and 165: Sawtooth National Forest Watershed
- Page 166 and 167: Sawtooth National Forest Watershed
- Page 168 and 169: Sawtooth National Forest Watershed
- Page 170 and 171: Sawtooth National Forest Watershed
- Page 172 and 173: Sawtooth National Forest Watershed
- Page 174 and 175: Sawtooth National Forest Watershed
- Page 176 and 177: Sawtooth National Forest Watershed
White River National Forest Watershed Vulnerability Assessment, Rocky Mountain Region (R2)<br />
Figure 8. Climate change vulnerability rating for the Water Uses resource value. Red shading depicts<br />
subwatersheds with the highest vulnerability. Points of diversion for water uses are shown as black dots.<br />
125 Assessing the Vulnerability of Watersheds to Climate Change


