watervulnerability
watervulnerability watervulnerability
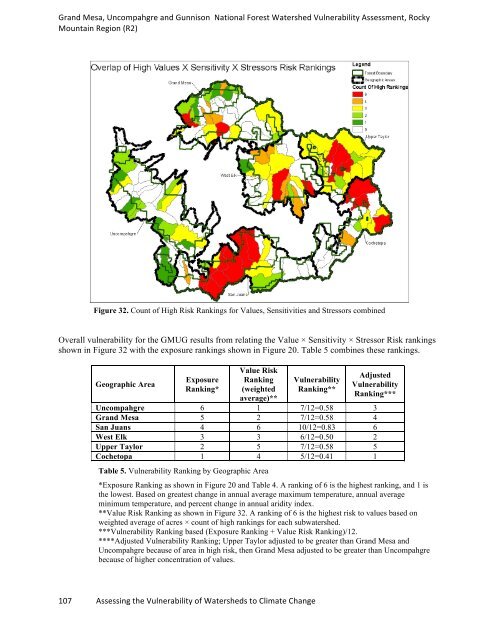
Grand Mesa, Uncompahgre and Gunnison National Forest Watershed Vulnerability Assessment, Rocky Mountain Region (R2) Fisheries and aquatic habitats can be directly affected by the predicted changes in temperature and precipitation. Temperature increase may have both negative and positive effects on cold-water fisheries in general and on cutthroat trout populations in particular. Occupied habitats at lower elevations may be eliminated as stream temperatures increase due to increases in air temperatures. The loss of cold-water fisheries may allow an expansion of occupied habitat for several sensitive species (e.g., bluehead sucker, roundtail chub) currently only found in streams and rivers at lower elevations. Increases in stream temperatures at higher elevations may actually benefit fish populations by making these streams more productive due to increasing growth rates of the fish that occupy them. Our current thinking is that low water temperatures in high-elevation streams limit fish growth and recruitment. Because current stream temperature data are lacking for most of the Forest, it is unknown if and specifically where low stream temperature could be having these effects. In 2011, the Forest began a multi-year project to collect and summarize baseline stream temperature data. The collection effort will focus on streams that support conservation populations of cutthroat trout; however, additional streams will be sampled in order to develop a robust dataset from which changes in stream temperature may be modeled. Botanical aquatic habitats (fens, wetlands, riparian areas) can also be directly impacted by predicted changes in temperature and precipitation, in much the same way water use values were affected. Predicted increases in temperature, associated increases in evapotranspiration, and decreases in aridity indices will all result in reducing water availability. Prolonged drought will further reduce groundwater recharge. Aquatic habitats in areas where these changes are more pronounced will be most vulnerable. Aquatic habitats are currently limited in the drier geographic areas (Uncompahgre, West Elk, Cochetopa) and are likely to become even more so. Aquatic habitats on the Grand Mesa may be most vulnerable because the aridity index is predicted to drop from above 1 to below 1. In reviewing the six previous figures, some areas have high risk much more often than others. Figure 32 displays a count of how often a given subwatershed has a high risk ranking for the combination of values, sensitivities, and stressors. The San Juans geographic area has the largest area (339,717 acres) and largest number of subwatersheds (9) that received “High” rankings for all combinations of values, sensitivities, and stressors. The Upper Taylor geographic area has the largest area (476,936 acres) of subwatersheds with three or more “High” risk rankings. 106 Assessing the Vulnerability of Watersheds to Climate Change
Grand Mesa, Uncompahgre and Gunnison National Forest Watershed Vulnerability Assessment, Rocky Mountain Region (R2) Figure 32. Count of High Risk Rankings for Values, Sensitivities and Stressors combined Overall vulnerability for the GMUG results from relating the Value × Sensitivity × Stressor Risk rankings shown in Figure 32 with the exposure rankings shown in Figure 20. Table 5 combines these rankings. Geographic Area Exposure Ranking* Value Risk Ranking (weighted average)** 107 Assessing the Vulnerability of Watersheds to Climate Change Vulnerability Ranking** Adjusted Vulnerability Ranking*** Uncompahgre 6 1 7/12=0.58 3 Grand Mesa 5 2 7/12=0.58 4 San Juans 4 6 10/12=0.83 6 West Elk 3 3 6/12=0.50 2 Upper Taylor 2 5 7/12=0.58 5 Cochetopa 1 4 5/12=0.41 1 Table 5. Vulnerability Ranking by Geographic Area *Exposure Ranking as shown in Figure 20 and Table 4. A ranking of 6 is the highest ranking, and 1 is the lowest. Based on greatest change in annual average maximum temperature, annual average minimum temperature, and percent change in annual aridity index. **Value Risk Ranking as shown in Figure 32. A ranking of 6 is the highest risk to values based on weighted average of acres × count of high rankings for each subwatershed. ***Vulnerability Ranking based (Exposure Ranking + Value Risk Ranking)/12. ****Adjusted Vulnerability Ranking; Upper Taylor adjusted to be greater than Grand Mesa and Uncompahgre because of area in high risk, then Grand Mesa adjusted to be greater than Uncompahgre because of higher concentration of values.
- Page 60 and 61: Helena National Forest Watershed Vu
- Page 62 and 63: Helena National Forest Watershed Vu
- Page 64 and 65: Helena National Forest Watershed Vu
- Page 66 and 67: Helena National Forest Watershed Vu
- Page 68 and 69: Assessment of Watershed Vulnerabili
- Page 70 and 71: Grand Mesa, Uncompahgre and Gunniso
- Page 72 and 73: Grand Mesa, Uncompahgre and Gunniso
- Page 74 and 75: Grand Mesa, Uncompahgre and Gunniso
- Page 76 and 77: Grand Mesa, Uncompahgre and Gunniso
- Page 78 and 79: Grand Mesa, Uncompahgre and Gunniso
- Page 80 and 81: Grand Mesa, Uncompahgre and Gunniso
- Page 82 and 83: Grand Mesa, Uncompahgre and Gunniso
- Page 84 and 85: Grand Mesa, Uncompahgre and Gunniso
- Page 86 and 87: Grand Mesa, Uncompahgre and Gunniso
- Page 88 and 89: Grand Mesa, Uncompahgre and Gunniso
- Page 90 and 91: Grand Mesa, Uncompahgre and Gunniso
- Page 92 and 93: Grand Mesa, Uncompahgre and Gunniso
- Page 94 and 95: Grand Mesa, Uncompahgre and Gunniso
- Page 96 and 97: Grand Mesa, Uncompahgre and Gunniso
- Page 98 and 99: Grand Mesa, Uncompahgre and Gunniso
- Page 100 and 101: Grand Mesa, Uncompahgre and Gunniso
- Page 102 and 103: Grand Mesa, Uncompahgre and Gunniso
- Page 104 and 105: Grand Mesa, Uncompahgre and Gunniso
- Page 106 and 107: Grand Mesa, Uncompahgre and Gunniso
- Page 108 and 109: Grand Mesa, Uncompahgre and Gunniso
- Page 112 and 113: Grand Mesa, Uncompahgre and Gunniso
- Page 114 and 115: Grand Mesa, Uncompahgre and Gunniso
- Page 116 and 117: Assessment of Watershed Vulnerabili
- Page 118 and 119: White River National Forest Watersh
- Page 120 and 121: White River National Forest Watersh
- Page 122 and 123: White River National Forest Watersh
- Page 124 and 125: White River National Forest Watersh
- Page 126 and 127: White River National Forest Watersh
- Page 128 and 129: White River National Forest Watersh
- Page 130 and 131: White River National Forest Watersh
- Page 132 and 133: White River National Forest Watersh
- Page 134 and 135: Assessment of Watershed Vulnerabili
- Page 136 and 137: Coconino National Forest Watershed
- Page 138 and 139: Coconino National Forest Watershed
- Page 140 and 141: Coconino National Forest Watershed
- Page 142 and 143: Coconino National Forest Watershed
- Page 144 and 145: Coconino National Forest Watershed
- Page 146 and 147: Coconino National Forest Watershed
- Page 148 and 149: Coconino National Forest Watershed
- Page 150 and 151: Coconino National Forest Watershed
- Page 152 and 153: Coconino National Forest Watershed
- Page 154 and 155: Coconino National Forest Watershed
- Page 156 and 157: Coconino National Forest Watershed
- Page 158 and 159: Coconino National Forest Watershed
Grand Mesa, Uncompahgre and Gunnison National Forest Watershed Vulnerability Assessment, Rocky<br />
Mountain Region (R2)<br />
Figure 32. Count of High Risk Rankings for Values, Sensitivities and Stressors combined<br />
Overall vulnerability for the GMUG results from relating the Value × Sensitivity × Stressor Risk rankings<br />
shown in Figure 32 with the exposure rankings shown in Figure 20. Table 5 combines these rankings.<br />
Geographic Area<br />
Exposure<br />
Ranking*<br />
Value Risk<br />
Ranking<br />
(weighted<br />
average)**<br />
107 Assessing the Vulnerability of Watersheds to Climate Change<br />
Vulnerability<br />
Ranking**<br />
Adjusted<br />
Vulnerability<br />
Ranking***<br />
Uncompahgre 6 1 7/12=0.58 3<br />
Grand Mesa 5 2 7/12=0.58 4<br />
San Juans 4 6 10/12=0.83 6<br />
West Elk 3 3 6/12=0.50 2<br />
Upper Taylor 2 5 7/12=0.58 5<br />
Cochetopa 1 4 5/12=0.41 1<br />
Table 5. Vulnerability Ranking by Geographic Area<br />
*Exposure Ranking as shown in Figure 20 and Table 4. A ranking of 6 is the highest ranking, and 1 is<br />
the lowest. Based on greatest change in annual average maximum temperature, annual average<br />
minimum temperature, and percent change in annual aridity index.<br />
**Value Risk Ranking as shown in Figure 32. A ranking of 6 is the highest risk to values based on<br />
weighted average of acres × count of high rankings for each subwatershed.<br />
***Vulnerability Ranking based (Exposure Ranking + Value Risk Ranking)/12.<br />
****Adjusted Vulnerability Ranking; Upper Taylor adjusted to be greater than Grand Mesa and<br />
Uncompahgre because of area in high risk, then Grand Mesa adjusted to be greater than Uncompahgre<br />
because of higher concentration of values.


