watervulnerability
watervulnerability watervulnerability
Grand Mesa, Uncompahgre and Gunnison National Forest Watershed Vulnerability Assessment, Rocky Mountain Region (R2) Sensitivity × Stressors Risk Ranking Matrix Sensitivity Sensitivity x Stressors Low Moderate High Low Low Low Low Moderate Low Low High High High High High The GMUG team working on the WVA felt that the inherent characteristics of a subwatershed would have greater influence on the overall watershed risk than the effects of past management activities. For this reason, if a subwatershed was ranked “High” for either one of the sensitivities, the watershed risk ranking was “High.” If the subwatershed ranking for either sensitivity was “Low,” the watershed risk ranking was “Low.” The following figures show the resulting watershed risk ranking for the erosion sensitivity combined with activity stressors (Figure 24) and the resulting watershed risk ranking for the runoff response sensitivity combined with activity stressors (Figure 25). In both figures, the subwatersheds with the highest risk are shown in red, and those with the lowest risk are shown in green. Figure 24. Erosion Sensitivity × Activity Stressors Ranking 98 Assessing the Vulnerability of Watersheds to Climate Change
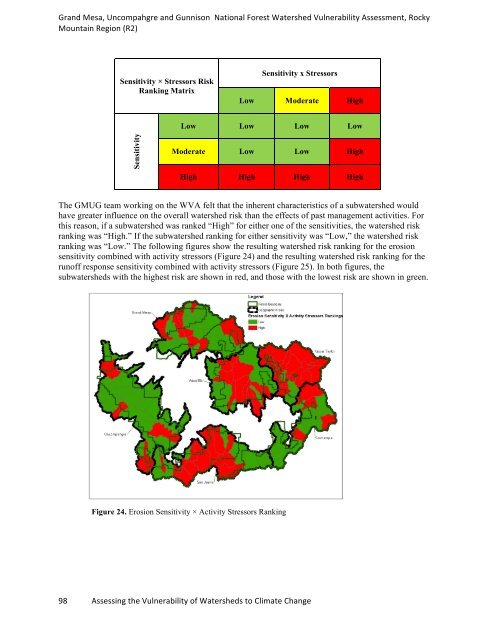
Grand Mesa, Uncompahgre and Gunnison National Forest Watershed Vulnerability Assessment, Rocky Mountain Region (R2) There are a total of 58 “High” risk subwatersheds for Erosion Sensitivity × Activity Stressors. The majority of these subwatersheds are found in the San Juans, Upper Taylor, and West Elk geographic areas. Twenty-three of these subwatersheds have a “High” Risk Rating just for Erosion Sensitivity × Activity Stressors alone, and 35 also have a “High” risk for Runoff Response Sensitivity × Activity Stressors (compare with Figure 25). Figure 25. Runoff Response Sensitivity × Activity Stressors Ranking There are 63 “High” risk subwatersheds for Runoff Response Sensitivity × Activity Stressors. The majority of these subwatersheds are found in the San Juans and Grand Mesa geographic areas. Of these, 28 subwatersheds have a “High” risk rating for Runoff Response Sensitivity × Activity Stressors, while the remaining 35 are also “High” risk for Erosion Sensitivity × Activity Stressors (compare with Figure 24). RESULTS (VULNERABILITY) To determine relative vulnerability of identified aquatic resources to predicted climate change, we need to combine all the pieces described above (resource values, risk [inherent sensitivity of the land and past management], and exposure) to see where they overlap. Resources of concern are most vulnerable where they occur in subwatersheds with highest sensitivity. The additional stress from climate change is most likely to have greatest impact in these areas. Method Used to Rank Resource Values Relative to Watershed Risk The different aquatic resource values of concern identified for this WVA can be affected by erosion/sedimentation and runoff in different ways. For this reason, the results of the two different risk 99 Assessing the Vulnerability of Watersheds to Climate Change
- Page 52 and 53: Helena National Forest Watershed Vu
- Page 54 and 55: Helena National Forest Watershed Vu
- Page 56 and 57: Helena National Forest Watershed Vu
- Page 58 and 59: Helena National Forest Watershed Vu
- Page 60 and 61: Helena National Forest Watershed Vu
- Page 62 and 63: Helena National Forest Watershed Vu
- Page 64 and 65: Helena National Forest Watershed Vu
- Page 66 and 67: Helena National Forest Watershed Vu
- Page 68 and 69: Assessment of Watershed Vulnerabili
- Page 70 and 71: Grand Mesa, Uncompahgre and Gunniso
- Page 72 and 73: Grand Mesa, Uncompahgre and Gunniso
- Page 74 and 75: Grand Mesa, Uncompahgre and Gunniso
- Page 76 and 77: Grand Mesa, Uncompahgre and Gunniso
- Page 78 and 79: Grand Mesa, Uncompahgre and Gunniso
- Page 80 and 81: Grand Mesa, Uncompahgre and Gunniso
- Page 82 and 83: Grand Mesa, Uncompahgre and Gunniso
- Page 84 and 85: Grand Mesa, Uncompahgre and Gunniso
- Page 86 and 87: Grand Mesa, Uncompahgre and Gunniso
- Page 88 and 89: Grand Mesa, Uncompahgre and Gunniso
- Page 90 and 91: Grand Mesa, Uncompahgre and Gunniso
- Page 92 and 93: Grand Mesa, Uncompahgre and Gunniso
- Page 94 and 95: Grand Mesa, Uncompahgre and Gunniso
- Page 96 and 97: Grand Mesa, Uncompahgre and Gunniso
- Page 98 and 99: Grand Mesa, Uncompahgre and Gunniso
- Page 100 and 101: Grand Mesa, Uncompahgre and Gunniso
- Page 104 and 105: Grand Mesa, Uncompahgre and Gunniso
- Page 106 and 107: Grand Mesa, Uncompahgre and Gunniso
- Page 108 and 109: Grand Mesa, Uncompahgre and Gunniso
- Page 110 and 111: Grand Mesa, Uncompahgre and Gunniso
- Page 112 and 113: Grand Mesa, Uncompahgre and Gunniso
- Page 114 and 115: Grand Mesa, Uncompahgre and Gunniso
- Page 116 and 117: Assessment of Watershed Vulnerabili
- Page 118 and 119: White River National Forest Watersh
- Page 120 and 121: White River National Forest Watersh
- Page 122 and 123: White River National Forest Watersh
- Page 124 and 125: White River National Forest Watersh
- Page 126 and 127: White River National Forest Watersh
- Page 128 and 129: White River National Forest Watersh
- Page 130 and 131: White River National Forest Watersh
- Page 132 and 133: White River National Forest Watersh
- Page 134 and 135: Assessment of Watershed Vulnerabili
- Page 136 and 137: Coconino National Forest Watershed
- Page 138 and 139: Coconino National Forest Watershed
- Page 140 and 141: Coconino National Forest Watershed
- Page 142 and 143: Coconino National Forest Watershed
- Page 144 and 145: Coconino National Forest Watershed
- Page 146 and 147: Coconino National Forest Watershed
- Page 148 and 149: Coconino National Forest Watershed
- Page 150 and 151: Coconino National Forest Watershed
Grand Mesa, Uncompahgre and Gunnison National Forest Watershed Vulnerability Assessment, Rocky<br />
Mountain Region (R2)<br />
Sensitivity × Stressors Risk<br />
Ranking Matrix<br />
Sensitivity<br />
Sensitivity x Stressors<br />
Low Moderate High<br />
Low Low Low Low<br />
Moderate Low Low High<br />
High High High High<br />
The GMUG team working on the WVA felt that the inherent characteristics of a subwatershed would<br />
have greater influence on the overall watershed risk than the effects of past management activities. For<br />
this reason, if a subwatershed was ranked “High” for either one of the sensitivities, the watershed risk<br />
ranking was “High.” If the subwatershed ranking for either sensitivity was “Low,” the watershed risk<br />
ranking was “Low.” The following figures show the resulting watershed risk ranking for the erosion<br />
sensitivity combined with activity stressors (Figure 24) and the resulting watershed risk ranking for the<br />
runoff response sensitivity combined with activity stressors (Figure 25). In both figures, the<br />
subwatersheds with the highest risk are shown in red, and those with the lowest risk are shown in green.<br />
Figure 24. Erosion Sensitivity × Activity Stressors Ranking<br />
98 Assessing the Vulnerability of Watersheds to Climate Change


