Research Methodology - Dr. Krishan K. Pandey
Research Methodology - Dr. Krishan K. Pandey Research Methodology - Dr. Krishan K. Pandey
Analysis of Variance and Co-variance 277 b∑Xg Correction factor for X = N = 2 7616. 27 ∑ Y = 33 + 72 + 105 = 210 b∑Yg Correction factor for Y = = N 2 2940 ∑ X = 2 9476 ∑ Y = 2 3734 ∑ XY = 5838 Correction factor for XY = ∑X ⋅ ∑ Y = 4732 N Hence, total SS for X = ∑X 2 – correction factor for X = 9476 – 7616.27 = 1859.73 R 2 2 2 b g b g b g U S| V| l q 49 114 175 SS between for X = + + correction factor for X 5 5 5 T| W| − = (480.2 + 2599.2 + 6125) – (7616.27) = 1588.13 SS within for X = (total SS for X) – (SS between for X) = (1859.73) – (1588.13) = 271.60 Similarly we work out the following values in respect of Y total SS for Y = ∑Y 2 – correction factor for Y = 3734 – 2940 = 794 R 2 2 2 bg bg b gU S| V| l q 33 72 105 SS between for Y = + + correction factor for Y 5 5 5 T| W| − = (217.8 + 1036.8 + 2205) – (2940) = 519.6 SS within for Y = (total SS for Y) – (SS between for Y) = (794) – (519.6) = 274.4 Then, we work out the following values in respect of both X and Y Total sum of product of XY =∑ XY – correction factor for XY = 5838 – 4732 = 1106 R S b gb g b gb g b gb gU V 49 33 114 72 175 105 SS between for XY = + + correction factor for XY T 5 5 5 W − = (323.4 + 1641.6 + 3675) – (4732) = 908 SS within for XY = (Total sum of product) – (SS between for XY) = (1106) – (908) = 198
278 Research Methodology ANOVA table for X, Y and XY can now be set up as shown below: Anova Table for X, Y and XY Source d.f. SS for X SS for Y Sum of product XY Between groups 2 1588.13 519.60 908 Within groups 12 E XX 271.60 E YY 274.40 E XY 198 Total 14 T XX 1859.73 T YY 794.00 T XY 1106 bTXYg2 Adjusted total SS = TXX − T Adjusted SS within group = E − YY b1106g = 1859. 73 − 794 = (1859.73) – (1540.60) = 319.13 XX b XYg2 198 = 27160 . − 274. 40 = (271.60) – (142.87)) = 128.73 Adjusted SS between groups = (adjusted total SS) – (Adjusted SS within group) = (319.13 – 128.73) = 190.40 E E YY b g Anova Table for Adjusted X Source d.f. SS MS F-ratio Between groups 2 190.40 95.2 8.14 Within group 11 128.73 11.7 Total 13 319.13 At 5% level, the table value of F for v 1 = 2 and v 2 = 11 is 3.98 and at 1% level the table value of F is 7.21. Both these values are less than the calculated value (i.e., calculated value of 8.14 is greater than table values) and accordingly we infer that F-ratio is significant at both levels which means the difference in group means is significant. Adjusted means on X will be worked out as follows: Regression coefficient for X on Y i.e., b = 2 2 Sum of product within group Sum of squares within groups for Y
- Page 244 and 245: Testing of Hypotheses I 227 and 2 X
- Page 246 and 247: Testing of Hypotheses I 229 LIMITAT
- Page 248 and 249: Testing of Hypotheses I 231 20. Ten
- Page 250 and 251: Chi-square Test 233 10 Chi-Square T
- Page 252 and 253: Chi-square Test 235 S. No. 1 2 3 4
- Page 254 and 255: Chi-square Test 237 As a test of go
- Page 256 and 257: Chi-square Test 239 (i) First of al
- Page 258 and 259: Chi-square Test 241 The expected fr
- Page 260 and 261: Chi-square Test 243 Show that the s
- Page 262 and 263: Chi-square Test 245 Events or Expec
- Page 264 and 265: Chi-square Test 247 c h χ 2 N ⋅
- Page 266 and 267: Chi-square Test 249 from a number o
- Page 268 and 269: Chi-square Test 251 Questions 1. Wh
- Page 270 and 271: Chi-square Test 253 No. of boys 5 4
- Page 272 and 273: Chi-square Test 255 23. For the dat
- Page 274 and 275: Analysis of Variance and Co-varianc
- Page 276 and 277: Analysis of Variance and Co-varianc
- Page 278 and 279: Analysis of Variance and Co-varianc
- Page 280 and 281: Analysis of Variance and Co-varianc
- Page 282 and 283: Analysis of Variance and Co-varianc
- Page 284 and 285: Analysis of Variance and Co-varianc
- Page 286 and 287: Analysis of Variance and Co-varianc
- Page 288 and 289: Analysis of Variance and Co-varianc
- Page 290 and 291: Analysis of Variance and Co-varianc
- Page 292 and 293: Analysis of Variance and Co-varianc
- Page 296 and 297: Analysis of Variance and Co-varianc
- Page 298 and 299: Analysis of Variance and Co-varianc
- Page 300 and 301: Testing of Hypotheses-II 283 12 Tes
- Page 302 and 303: Testing of Hypotheses-II 285 Illust
- Page 304 and 305: Testing of Hypotheses-II 287 Table
- Page 306 and 307: Testing of Hypotheses-II 289 fact,
- Page 308 and 309: Testing of Hypotheses-II 291 The te
- Page 310 and 311: Testing of Hypotheses-II 293 Pair B
- Page 312 and 313: Testing of Hypotheses-II 295 Table
- Page 314 and 315: Testing of Hypotheses-II 297 Illust
- Page 316 and 317: Testing of Hypotheses-II 299 Soluti
- Page 318 and 319: Testing of Hypotheses-II 301 r = nu
- Page 320 and 321: Testing of Hypotheses-II 303 where
- Page 322 and 323: Testing of Hypotheses-II 305 Table
- Page 324 and 325: Testing of Hypotheses-II 307 We now
- Page 326 and 327: Testing of Hypotheses-II 309 (ii) I
- Page 328 and 329: Testing of Hypotheses-II 311 all po
- Page 330 and 331: Testing of Hypotheses-II 313 CONCLU
- Page 332 and 333: Multivariate Analysis Techniques 31
- Page 334 and 335: Multivariate Analysis Techniques 31
- Page 336 and 337: Multivariate Analysis Techniques 31
- Page 338 and 339: Multivariate Analysis Techniques 32
- Page 340 and 341: Multivariate Analysis Techniques 32
- Page 342 and 343: Multivariate Analysis Techniques 32
278 <strong>Research</strong> <strong>Methodology</strong><br />
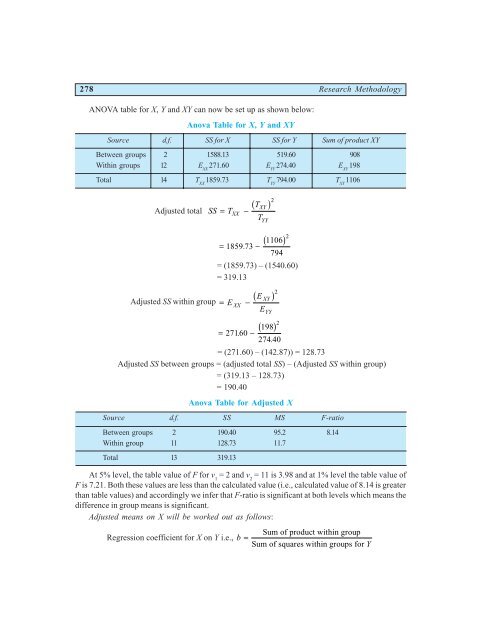
ANOVA table for X, Y and XY can now be set up as shown below:<br />
Anova Table for X, Y and XY<br />
Source d.f. SS for X SS for Y Sum of product XY<br />
Between groups 2 1588.13 519.60 908<br />
Within groups 12 E XX 271.60 E YY 274.40 E XY 198<br />
Total 14 T XX 1859.73 T YY 794.00 T XY 1106<br />
bTXYg2 Adjusted total SS = TXX<br />
−<br />
T<br />
Adjusted SS within group = E −<br />
YY<br />
b1106g = 1859. 73 −<br />
794<br />
= (1859.73) – (1540.60)<br />
= 319.13<br />
XX<br />
b XYg2<br />
198<br />
= 27160 . −<br />
274. 40<br />
= (271.60) – (142.87)) = 128.73<br />
Adjusted SS between groups = (adjusted total SS) – (Adjusted SS within group)<br />
= (319.13 – 128.73)<br />
= 190.40<br />
E<br />
E<br />
YY<br />
b g<br />
Anova Table for Adjusted X<br />
Source d.f. SS MS F-ratio<br />
Between groups 2 190.40 95.2 8.14<br />
Within group 11 128.73 11.7<br />
Total 13 319.13<br />
At 5% level, the table value of F for v 1 = 2 and v 2 = 11 is 3.98 and at 1% level the table value of<br />
F is 7.21. Both these values are less than the calculated value (i.e., calculated value of 8.14 is greater<br />
than table values) and accordingly we infer that F-ratio is significant at both levels which means the<br />
difference in group means is significant.<br />
Adjusted means on X will be worked out as follows:<br />
Regression coefficient for X on Y i.e., b =<br />
2<br />
2<br />
Sum of product within group<br />
Sum of squares within groups for<br />
Y


